SINIR 2014-39 Asean and India Industry Monitor · Industry Report ASEAN / INDIA INDUSTRY MONITOR...
16
1 Industry Report ASEAN / INDIA INDUSTRY MONITOR 2014 Second Half Issue Bank of Tokyo-Mitsubishi UFJ A member of MUFG, a global financial group OCTOBER 1, 2014 【Summary】 The business environment will continue to rebound gradually on the back of solid domestic demand and further export recovery. The business environment of major industries in ASEAN countries and India has been slowly recovering, thanks to solid domestic demand as well as the gradual recovery of exports to developed countries. There are differences in business environment among the ASEAN countries. The Philippines and Malaysia gained momentum due to export recovery. India was bottoming out as a result of expectations towards the new government and the stabilization of the inflation rate, while Thailand showed a sign of recovery as economic management under the military government returned to normal after May 2014. On the other hand, Indonesia continued to slow down due to postponement of investment during the presidential election and export restrictions on raw minerals. Singapore lost its momentum, as a result of the slow growth of the manufacturing industry especially electronics. The manufacturing sector (automobile and electronics) and materials sector (textiles, cement and steel) posted steady performance overall, in line with export recovery and solid domestic demand. However, Thailand continued to see weak automobile sales amid prolonged political turmoil, while the electronics industry in Singapore saw sluggish exports due to low production of information-communication devices such as tablet PCs and smartphones, which demand has been growing recently. Although the non-manufacturing sector (retail, travel, construction and real estate) achieved solid growth overall, Thailand’s retail industry continued to shrink as consumer confidence deteriorated amid the political turmoil. Going forward, the business environment in ASEAN and India is likely to rebound gradually with further export recovery. Domestic demand will continue to be solid, driven by a favorable employment and income environment. Meanwhile, exports, especially to developed countries, are likely to rebound further. In addition, since negative factors such as (1) high inflation that put downward pressure on the Indonesian and Indian economies, and (2) Thailand’s political turmoil have eased, more stable growth is forecasted in the region, although strong growth is still not expected.
Transcript of SINIR 2014-39 Asean and India Industry Monitor · Industry Report ASEAN / INDIA INDUSTRY MONITOR...

1
Industry Report
ASEAN / INDIA INDUSTRY MONITOR 2014 Second Half Issue
Bank of Tokyo-Mitsubishi UFJ A member of MUFG, a global financial group
OCTOBER 1, 2014
【Summary】 The business environment will continue to rebound gradually on the
back of solid domestic demand and further export recovery.
The business environment of major industries in ASEAN countries and India has been slowly recovering, thanks to solid domestic demand as well as the gradual recovery of exports to developed countries.
There are differences in business environment among the ASEAN countries. The Philippines and Malaysia gained momentum due to export recovery. India was bottoming out as a result of expectations towards the new government and the stabilization of the inflation rate, while Thailand showed a sign of recovery as economic management under the military government returned to normal after May 2014. On the other hand, Indonesia continued to slow down due to postponement of investment during the presidential election and export restrictions on raw minerals. Singapore lost its momentum, as a result of the slow growth of the manufacturing industry especially electronics.
The manufacturing sector (automobile and electronics) and materials sector (textiles, cement and steel) posted steady performance overall, in line with export recovery and solid domestic demand. However, Thailand continued to see weak automobile sales amid prolonged political turmoil, while the electronics industry in Singapore saw sluggish exports due to low production of information-communication devices such as tablet PCs and smartphones, which demand has been growing recently.
Although the non-manufacturing sector (retail, travel, construction and real estate) achieved solid growth overall, Thailand’s retail industry continued to shrink as consumer confidence deteriorated amid the political turmoil.
Going forward, the business environment in ASEAN and India is likely to rebound gradually with further export recovery. Domestic demand will continue to be solid, driven by a favorable employment and income environment. Meanwhile, exports, especially to developed countries, are likely to rebound further. In addition, since negative factors such as (1) high inflation that put downward pressure on the Indonesian and Indian economies, and (2) Thailand’s political turmoil have eased, more stable growth is forecasted in the region, although strong growth is still not expected.

2
Table of Contents
Country Industry Indicator Latest Data Page
Singapore
Electronics 1. Electronics Exports Jul 2014 3
Retail 2. Department Store Retail Sales Index Jun 2014
Travel 3. Standard Room Average Occupancy Rate & Visitor Arrivals
Jun 2014 4
Office Property 4. Singapore Office Vacancy Rate & Rental Index Q2 2014
Construction 5. Construction Contracts Awarded Jun 2014 5
Malaysia Automobile 6. Automobile Sales Jul 2014
Office Property 7. KL Office Vacancy Rate & Rental Index Q2 2014 6
Thailand
Automobile 8. Automobile Sales Jun 2014
Textile 9. Shipment Index of Textile Products Jun 2014 7
Cement 10. Cement Production Jun 2014
Retail 11. Retail Sales Index Jun 2014 8
Office Property 12. Bangkok Office Vacancy Rate & Rental Index Q2 2014
Indonesia
Automobile 13. Automobile Sales Jul 2014 9
Motorcycle 14. Motorcycle Sales Jul 2014
Textile 15. Garment, Thread & Textile Exports Jun 2014 10
Office Property 16. Jakarta Office Vacancy Rate & Rental Index Q2 2014
Philippines Automobile 17. Automobile Sales Jul 2014
11 Office Property 18. Manila Office Vacancy Rate & Rental Index Q2 2014
Vietnam
Electronics 19. Computer & Electronics Components Exports Jul 2014 12
Automobile 20. Automobile Sales Jul 2014
Textile 21. Textile Exports Jul 2014 13
India
Steel 22. Crude Steel Production Jul 2014
Automobile 23. Automobile Sales Jul 2014 14
Motorcycle 24. Motorcycle Sales Jul 2014
Appendix Major Economics & Industrial Index (Real GDP Growth, etc) 15
Note: The “FORECAST” period added in this edition is a short-term outlook (about 6 months to 1 year). This bulletin is issued semi-annually.

3
1. Singapore / Electronics Exports Forecast: Continued Downturn Expected
(Source:International Enterprise)
Singapore’s electronic export value in H1 2014
declined by 13.3% compared to the same period last year.
Production volume of semiconductors and integrated circuits has stagnated due to increased production cost in the country. In addition, although demand from developed countries for tablets and smartphones is increasing, Singapore’s production for such products is low, hence the decline.
Exports of integrated circuits decreased by 14.7% YoY, while exports of hard disk drives decreased by 20.0% YoY.
As Microsoft has terminated its support for Windows XP, demand for PCs is expected to improve as consumers replace their computers. Hence, production of major products such as semiconductors and PC components is expected to improve over the next one year. However, there is limited room for the PC market to expand as consumers shift towards tablets and smartphones. Thus, the export value of electronics in Singapore is expected to continue to decline.
2. Singapore / Department Store Retail Sales Index Forecast : Steady Sales Likely to Continue
(Source:Department of Statistics)
The average YoY growth rate Singapore’s monthly
department store sales index slowed down to 2.7% in H1 2014, compared to 4.5% in H1 2013.
This trend is partly attributable to the sharp fall in China tourists (-40% YoY) between Mar-Jun 2014 after the disappearance of Malaysia Airlines 370 in Mar 2014. As tourists from China commonly visit both Malaysia and Singapore together for vacation, reduction in Malaysia’s appeal to them had a negative spillover effect to Singapore as well.
In addition, the tightening of foreign labour in-flow by the Singapore government in recent months reduced the pool of consumers spending in domestic department stores as well.
Over the next one year, should the current benign inflationary environment be maintained in Singapore, we expect domestic household spending to be the key pillar maintaining stability of the country’s retail sales, amid the current favourable employment situation for local labour. At the same time, as the effects of the MH370 disappearance slowly abates, China tourist arrivals should see some recovery gradually. Against this backdrop, we anticipate modest department store sales growth over the next one year.
-120%
-100%
-80%
-60%
-40%
-20%
0%
20%
40%
60%
1.0
2.0
3.0
4.0
5.0
6.0
7.0
8.0
9.0
10.0
Jul/11 Jan/12 Jul/12 Jan/13 Jul/13 Jan/14 Jul/14
Electronics Export Value(LHS)
(SGD Billion)
YoY (RHS)
-80%
-60%
-40%
-20%
0%
20%
40%
0
50
100
150
200
250
300
Jul/11 Jan/12 Jul/12 Jan/13 Jul/13 Jan/14
(2010=100)
YoY (RHS)
Department Store Sales Index(LHS)

4
3. Singapore / Standard Room Average Occupancy Rate & Visitor Arrivals
Forecast: Occupancy Rate and Average Room Rate Expected to Weaken
(Source:Singapore Tourism Board)
Singapore’s room occupancy rates and average
room rates remained at relatively high levels in H1 2014 at 84.8% and SGD258 respectively.
However, occupancy rate has dipped slightly YoY (-1.2pt). This trend was mainly attributable to the decline in tourist arrivals (-2.8% YoY) due to the weakness from other regional markets such as Thailand, Malaysia and China.
New hotels such as Holiday Inn Express Clarke Quay (448 rooms), and Sofitel So Singapore (134 rooms) were opened in H1 2014; however, the number of rooms added in full year 2014 (around 2,000 rooms) is less than that of the previous year (about 3,000 rooms).
Occupancy rates and average room rates are likely to
weaken slightly over the next one year. Visitor arrivals are expected to pick up in H2 2014
due to: (1) strong pipeline of new attractions like the opening of the Sports Hub and Sisters’ Island Marine Park; (2) annual international events like the Formula 1 Singapore Grand Prix.
However, the expected rise in visitor arrivals will not be able to offset the higher room supply, which has been estimated to peak in 2015 (more than 4,000 rooms).
4. Singapore / Office Vacancy Rate & Rental Index Forecast: Office Rentals Will Increase Slightly
(Source:Urban Redevelopment Authority)
Office rents in the Central Business District (CBD)
in Singapore have continued to grow in Q2 2014, with a firm increase of 3.0% QoQ.
No new office building in the CBD was completed in Q2 2014 and only two Grade A projects are expected to be completed by end 2014 (CapitaGreen and South Beach).
The demand for office space has remained firm due to the sustained demand from smaller, non-financial firms. The office vacancy rate of Q2 2014 stood at 9.4%, indicating a gradually improving trend.
Office rents are likely to increase slightly over the next one year, mostly driven by the very low supply in CBD. In addition, the demand from non-financial services sectors is expected to remain healthy and it is highly likely that the office market vacancy rate in the CBD will continue to improve.
10%
20%
30%
40%
50%
60%
70%
80%
90%
100%
110%
0
20
40
60
80
100
120
140
160
180
200
Jul/11 Jan/12 Jul/12 Jan/13 Jul/13 Jan/14
Visitor Arrival(LHS)
Standard Room Occupancy Rate
(RHS)
(10,000 people)
0%
5%
10%
15%
20%
50
100
150
200
250
3Q/11 1Q/12 3Q/12 1Q/13 3Q/13 1Q/14
Vacancy Rate (RHS)
Rental(LHS)
(1990=100)

5
5. Singapore / Construction Contracts Awarded Forecast: Gradual Downward Trend Expected
(Source:Urban Redevelopment Authority)
Construction contracts awarded in Singapore increased by 6.0% YoY in H1 2014.
A breakdown of the figures shows that demand from the private sector plunged by 25.4% YoY, due to easing residential, commercial and industrial sectors as well as the high base effect of the previous year from the construction of electricity transmission facilities.
On the other hand, demand from the public sector increased by 80.1% YoY, driven by construction of Housing and Development Board (HDB) public housing as well as bidding on the Thomson-East Coast Line project, which is an expansion of the Mass Rapid Transit (MRT) system.
Construction demand is likely to decrease gradually over the next one year but remaining healthy. Public contracts are likely to be bolstered by large-scale projects such as the construction of HDB housing and the expansion of the MRT. On the other hand, demand from the private sector is expected to remain weak as a result of measures to control real estate speculation in most sub-segments such as the residential and industrial segments.
6. Malaysia / Automobile Sales Forecast: Expected to Increase Gradually
(Source:Malaysian Automotive Association)
Automobile sales in Malaysia in H1 2014 rose by
6.3% YoY to hit 333 thousand units. Sales of passenger cars increased by 7.5% to 297
thousand units, while sales of commercial vehicles declined by 3.0% to 36 thousand units.
Perodua, the market leader, maintained its top position with sales of 94 thousand units (28.4% market share). Proton, in second place, sold 63 thousand units (18.9%), followed by Toyota with 51 thousand units (15.3%). Honda, which introduced a popular new model, managed to increase its sales volume by nearly 70% compared to the same period last year.
The automobile market in Malaysia is expected to expand gradually over the next one year. The Malaysian economy remains stable, with major automobile manufacturers expected to release new models that may boost market demand. The local automobile association has estimated that domestic sales will reach 680 thousand units in 2014, an increase of 3.7% YoY.
-600%
-500%
-400%
-300%
-200%
-100%
0%
100%
200%
300%
400%
0
5
10
15
20
25
30
35
40
45
50
Jul/11 Jan/12 Jul/12 Jan/13 Jul/13 Jan/14
(SGD Hundred Million)
Public Sector Demand, YoY (6 month Ave,
RHS)
Private Sector Demand, YoY (6 month Ave,
RHS)
Public Sector Demand
(6 month Ave, LHS)
Private Sector Demand
(6 month Ave, LHS)
-80%
-60%
-40%
-20%
0%
20%
40%
0
20
40
60
80
100
120
Jul/11 Jan/12 Jul/12 Jan/13 Jul/13 Jan/14 Jul/14
New Car Sales(LHS)
YoY (RHS)
(1,000 units)

6
7. Malaysia / KL Office Vacancy Rate & Rental Index
Forecast: Office Rentals Expected to Remain Stable
(Note) Due to a change in data, figures for
2Q/13 are estimation (Source:Jones Lang LaSalle)
Office rents in the Central Business District (CBD)
in Kuala Lumpur were stagnant in Q2 2014. There was no new supply in H1 2014. Despite the
lower supply, the vacancy rate has remained high, registering 13.8% in Q2 2014. This is a marginal improvement from Q1 2014 (14.2%) and is mostly due to a notable expansion of OCBC Bank and the relocation of the Spanish Embassy.
New office supply will be relatively low in 2014.
There is only one office building (320k sqf) expected to be completed in 2014 with some projects being deferred to 2015.
Office rents and the vacancy rate are expected to remain stable over the next one year, along with the sustained demand that should be able to absorb the new supply, in line with the stable economic growth of the Malaysia economy.
8. Thailand / Automobile Sales Forecast: Slow Return to Recovery
(Note) Sales soared by 477% YoY on November 2012.
(Source:Thai Automotive Industry Association)
The Thai automobile industry shrank in H1 2014,
with sales decreasing by 40.5% YoY to 441 thousand units.
This decline can be attributed to the prolonged political unrest that has reduced consumer sentiment as well as the distortion by the high base in H1 2013 from the backorders of the government’s “first time car buyers” scheme that ended in 2012.
Sales of passenger vehicles declined by 47.8% to 184 thousand units while sales of commercial vehicles fell by 33.8% to 257 thousand units.
Toyota, the market leader, declined by 30.9% to 164 thousand units YoY (37.1% market share). Other major manufacturers fell across the board, with Isuzu falling by 30.9% to 83 thousand units (18.7%) and Honda falling by 64.0% to 47 thousand units (10.7%).
The automobile market in Thailand is expected to slowly recover over the next year with the stabilisation of the political situation. Major manufacturers expect sales for the year to reach 930 thousand units, representing a drop of about 30% YoY as a result of the prolonged political instability.
0%
5%
10%
15%
20%
25%
30%
200
300
400
500
600
700
800
3Q/11 1Q/12 3Q/12 1Q/13 3Q/13 1Q/14
Rental(LHS)
Vacancy Rate(RHS)
(RM / square metre · year)
-240%
-200%
-160%
-120%
-80%
-40%
0%
40%
80%
120%
160%
200%
0
20
40
60
80
100
120
140
160
180
200
220
Jul/11 Jan/12 Jul/12 Jan/13 Jul/13 Jan/14
New Car Sales(LHS)
(1,000 units)
YoY (RHS)

7
9. Thailand / Shipment Index of Textile Products Forecast: Continued Downturn Expected
(Source:Bank of Thailand)
The shipment index of textile products in Thailand
decreased by 3.6% in H1 2014 compared to the same period last year.
Textile manufacturers have continued to shift their operations to neighbouring countries such as Vietnam and Cambodia as Thailand had raised its minimum wage across Thailand. Also, the industrial demand, which accounts for 10 to 20 percent of overall demand in Thailand, has continued to slump due to a fall in domestic automobile production.
Thailand’s textile industry is expected to continue to stagnate over the next one year. Industrial demand for textiles will pick up gradually with the recovery of the automobile sector. However, textile export, which is the major contributor to overall shipment, is not expected to fully recover. In addition, the production bases in Thailand will continue to move to neighbouring countries with lower production cost.
10. Thailand / Cement Production Forecast: Stagnation Likely to Continue
(Source:Bank of Thailand)
Thailand’s cement production in H1 2014 stagnated,
with marginal increase YoY (+ 0.1%). Domestic demand, which accounts for about 80% of
total demand, increased steadily by 1.3% YoY. Although public demand has continued to slow down due to the prolonged political instability, private demand has remained firm due to strong demand for rural housing.
Exports, which account for about 20% of demand, shrank by 6.1% as competition intensified with other ASEAN countries such as Vietnam, which has stepped up its exports.
Cement production in Thailand is likely to stagnate over the next one year. Although the private demand is expected to recover slowly with the stabilization of the political situation, it is likely that public demand will stagnate, as the start date for large public projects such as the high speed rail and flood control are still not confirmed. Also, exports to the region are expected to weaken as competition intensifies with neighbouring countries.
-100%
-80%
-60%
-40%
-20%
0%
20%
40%
0
20
40
60
80
100
120
140
Jul/11 Jan/12 Jul/12 Jan/13 Jul/13 Jan/14
(2000=100)
YoY (RHS)
Shipment Index of Textile Products
(LHS)
-80%
-70%
-60%
-50%
-40%
-30%
-20%
-10%
0%
10%
20%
30%
40%
0.0
0.5
1.0
1.5
2.0
2.5
3.0
3.5
4.0
4.5
5.0
5.5
6.0
Jul/11 Jan/12 Jul/12 Jan/13 Jul/13 Jan/14
(Million tons)
Cement Production
YoY (RHS)

8
11. Thailand / Retail Sales Index Forecast : Gradual Recovery Expected
(Source:Bank of Thailand)
Thailand’s retail sales index in H1 2014 fell by
8.2% YoY. However, the June index level recovered by 5.7% against the level in April 2014, which was the lowest in the last 12 months following the military coup on 22 May 2014.
This is an improvement for the Thai retail scene as the retail index fell with growing public concerns on Thailand’s stability during the protests from Nov 2013 to May 2014. This negatively impacted domestic consumer confidence and tourist arrivals, which fell 3% YoY in the 7-month period.
The domestic consumer confidence index recovered sharply from 67.8 in April 2014 to 75.1 in June 2014 after the Thai military takeover restored public order.
There is currently limited visibility on how the new government and Prime Minister will manage Thailand’s economy. However, as long as existing public order is maintained, we expect the pace of recovery for the Thai retail sector to pick up gradually over the next one year.
12. Thailand / Bangkok Office Vacancy Rate & Rental Index Forecast : Rentals Likely to Increase Gradually
(Source:Jones Lang LaSalle)
Office rents in the Central Business District (CBD)
in Bangkok increased by 1.0% QoQ in Q2 2014. Demand was weak in Q2 2014 due to the uncertain
political situation. However, the vacancy rate has improved from 8.5% in Q1 2014 to 8.2% as no new supply came on stream in the quarter (there was no new supply in the last two years).
Office rentals are likely to increase gradually over the next one year as the demand recovers amid the easing of political uncertainties. Only one office building is expected to be completed in 2014 (Bhiraj Tower: around 50k sqm); thus the supply of new office space in the CBD will remain at a low level. Therefore, the demand and supply balance for office space in CBD is expected to be tight.
-60%
-40%
-20%
0%
20%
40%
60%
100
140
180
220
260
300
340
Jul/11 Jan/12 Jul/12 Jan/13 Jul/13 Jan/14
(2002=100)
YoY (RHS)
Retail Sales Index
(LHS)
0%
5%
10%
15%
20%
25%
30%
4,000
5,000
6,000
7,000
8,000
9,000
10,000
3Q/11 1Q/12 3Q/12 1Q/13 3Q/13 1Q/14
Rental(LHS)
Vacancy Rate (RHS)
(THB / ㎡・ year)

9
13. Indonesia / Automobile Sales Forecast: Sales to Remain Stable
(Source:Astra International)
Automobile sales in Indonesia in H1 2014 rose
6.7% to 642 thousand units compared to the same period last year.
Low Cost Green Cars (LCGCs) accounted for 13.1% of the market with 86 thousand units sold. LCGCs were introduced in September 2013 (as per government policy) and are likely to lead market expansion.
Toyota and Daihatsu, the top two players in the market, were the first to introduce LCGCs to the market. This has led to a 4.0% increase in sales for Toyota (34.8% market share) and 7.7% increase for Daihatsu (14.8%). Robust sales of the Honda Mobilio small MPV have propelled Honda’s sales by 67.6% (12.9%), allowing Honda to overtake Suzuki (12.6%) to become the third largest player in the market.
Although the increase in gasoline prices and continuously high interest rates will affect the automobile industry negatively over the next one year, stable economic growth is expected to be able to sustain sales. The major manufacturers and domestic automobile association expect sales to increase by 5% YoY in 2014 to hit 1.3 million units.
14. Indonesia / Motorcycle Sales Forecast: Slow Growth Going Forward
(Source:Astra International)
Indonesian motorcycle sales in H1 2014 reached
4.2 million units, an increase of 7.1% YoY. The favourable employment environment and
increased wages have boosted the purchasing power of lower income consumers, while new models from manufacturers have propped up sales.
Honda’s sales increased by 10.9% to 2.6 million units (62.4% market share), while Yamaha maintained second place with a 4.1% increase in sales to 1.3 million units (31.6%).
Motorcycle sales are expected to increase over the next one year. However, the growth rate is expected to be slower due to increased gasoline prices and continuously high interest rates. The major motorcycle manufacturers expect sales to increase by 5% YoY in 2014 to hit 8.2 million units.
-240%
-200%
-160%
-120%
-80%
-40%
0%
40%
80%
120%
0
20
40
60
80
100
120
140
160
180
Jul/11 Jan/12 Jul/12 Jan/13 Jul/13 Jan/14 Jul/14
New Car Sales(LHS)
YoY (RHS)
(1,000 units)
-100%
-80%
-60%
-40%
-20%
0%
20%
40%
60%
80%
0
20
40
60
80
100
120
140
160
180
Jul/11 Jan/12 Jul/12 Jan/13 Jul/13 Jan/14 Jul/14
YoY (RHS)
(10,000 units)
New Motorcycle Sales(LHS)

10
15. Indonesia / Garment, Thread & Textile Exports Forecast: Stagnation Expected
(Source:Bank Indonesia)
The value of Indonesia’s textile exports increased
by 1.3% in H1 2014 compared to the same period last year, due to a slight increase in each sub segment (such as Garments and Thread & Textile).
Even though the synthetic market (polyester etc.) weakened compared to the same period last year, demand from the United States (the main export destination) recovered sufficiently to push up export values.
Export value of textile products is expected to stagnate over the next one year. Demand for textile products is expected to recover slowly as the overseas economies such as Japan, the USA and Europe will recover gradually. However, the minimum wage was raised across most provinces in Indonesia in 2014, including West Java where many textile factories are located. In addition, electricity prices were raised substantially in May and these factors are expected to reduce orders from overseas.
16. Indonesia / Jakarta Office Vacancy Rate & Rental Index Forecast : Office Rentals Expected to Remain Stable
(Source:Jones Lang LaSalle)
Rents for office space in the Central Business
District (CBD) eased by 2.2% QoQ but increased 6.8% YoY in Q2 2014.
The overall demand has been weak due to the slower economy and general election in July 2014. However, the office vacancy rate remained unchanged at a low level of 3.6% due to lack of new supply. There will be no new office supply in the CBD for 2014 and the supply of new office buildings in the CBD has been low since 2011.
Going forward, the lack of supply until 2016 will
offset the weaker demand. As such, office rents and vacancy rate are likely to remain stable over the next one year at the current firm level.
0
200
400
600
800
1,000
Jul/11 Jan/12 Jul/12 Jan/13 Jul/13 Jan/14
Garments
Thread & Textile
(USD Million)
0%
5%
10%
15%
20%
25%
30%
4,000
5,000
6,000
7,000
8,000
9,000
10,000
3Q/11 1Q/12 3Q/12 1Q/13 3Q/13 1Q/14
(USD / ㎡・year)
Rental(LHS)
Vacancy Rate

11
17. Philippines / Automobile Sales Forecast: Continued Growth Expected
(Source:CAMPI)
Automobile sales in the Philippines in H1 2014
reached 109 thousand units, increasing by 24.9% YoY.
The increase can be attributed to strong economic growth, increasing consumer expenditure, and new model launches by manufacturers.
Passenger vehicle sales increased by 44.9% to hit 41 thousand units, led mainly by the increase in sales of smaller vehicles. Meanwhile, sales of commercial vehicles increased by 15.5% to hit 68 thousand units.
Toyota maintained its top position, with sales increasing by 38.9% to reach 48 thousand units (44.5% market share), while second place Mitsubishi increased its sales by 17.8% to 25 thousand units (23.0%).
Increased employment in the manufacturing and service sectors, as well as increased remittances from overseas Filipino workers (OFWs) are expected to push up automobile demand in the Philippines over the next one year. Major manufacturers expect automobile sales to increase by 17% YoY to reach 210 thousand units in 2014.
18. Philippines / Manila Office Vacancy Rate & Rental Index Forecast : Office Rentals Likely to Be Stable
(Source:Jones Lang LaSalle)
Rents for office space in the Makati district (the
Philippines’ metropolitan area) in Manila grew by 1.5% QoQ in Q2 2014.
New office supply in H1 2014 was relatively high, in addition to the sustained new supply in the last few years.
Meanwhile, office vacancy was kept low at 4.1% due to firm demand. Demand from financial services, information technology and logistics firms has been robust. This is in addition to the traditional demand from Business Process Outsourcing (BPO) companies.
Office rents are expected to remain stable over the next one year amid the higher new supply coming on stream, since demand is also expected to be firm. As it is expected that there will be substantial new supply of more than 300k sqm in full year 2014, the vacancy rate may be pushed up temporarily, but should still remain at a healthy level.
-100%
-80%
-60%
-40%
-20%
0%
20%
40%
60%
0
4
8
12
16
20
24
28
32
Jul/11 Jan/12 Jul/12 Jan/13 Jul/13 Jan/14 Jul/14
New Car Sales(LHS)
YoY (RHS)
(1,000 units)
0%
5%
10%
15%
20%
4,000
6,000
8,000
10,000
12,000
3Q/11 1Q/12 3Q/12 1Q/13 3Q/13 1Q/14
Rental (LHS)
Vacancy Rate (RHS)
(PHP / ㎡・year)
12
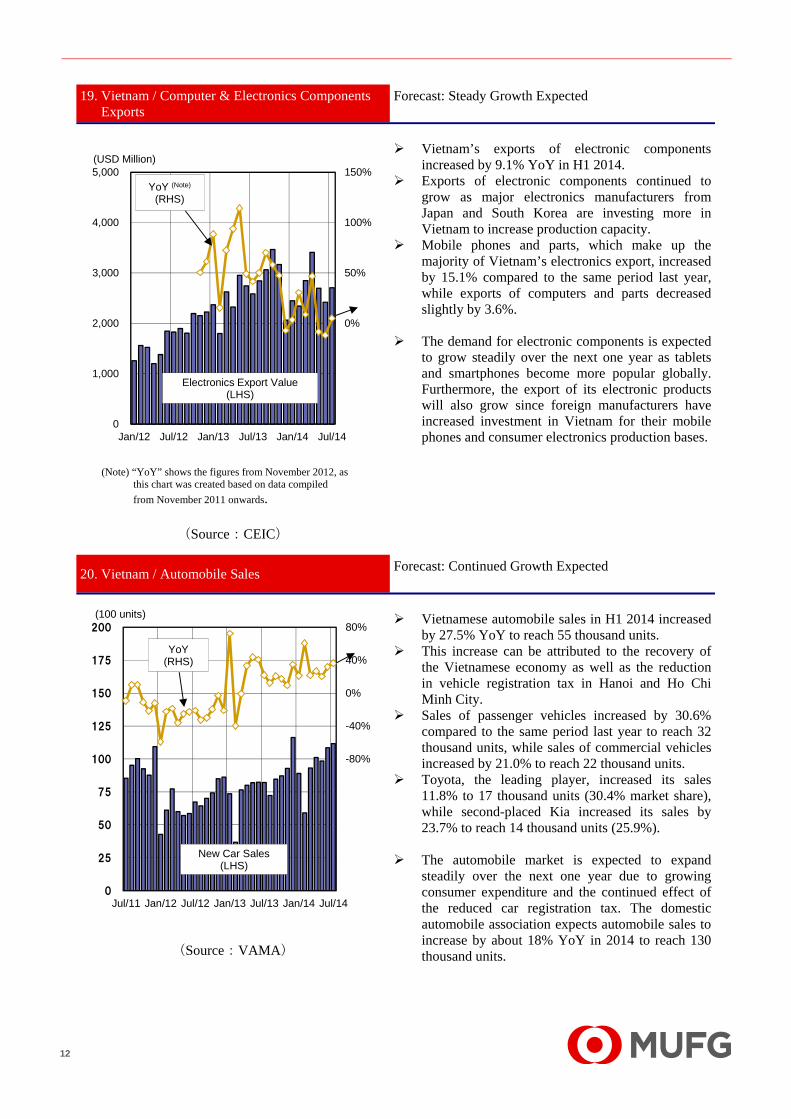
19. Vietnam / Computer & Electronics Components Exports
Forecast: Steady Growth Expected
(Note) “YoY” shows the figures from November 2012, as this chart was created based on data compiled
from November 2011 onwards.
(Source:CEIC)
Vietnam’s exports of electronic components
increased by 9.1% YoY in H1 2014. Exports of electronic components continued to
grow as major electronics manufacturers from Japan and South Korea are investing more in Vietnam to increase production capacity.
Mobile phones and parts, which make up the majority of Vietnam’s electronics export, increased by 15.1% compared to the same period last year, while exports of computers and parts decreased slightly by 3.6%.
The demand for electronic components is expected to grow steadily over the next one year as tablets and smartphones become more popular globally. Furthermore, the export of its electronic products will also grow since foreign manufacturers have increased investment in Vietnam for their mobile phones and consumer electronics production bases.
20. Vietnam / Automobile Sales Forecast: Continued Growth Expected
(Source:VAMA)
Vietnamese automobile sales in H1 2014 increased
by 27.5% YoY to reach 55 thousand units. This increase can be attributed to the recovery of
the Vietnamese economy as well as the reduction in vehicle registration tax in Hanoi and Ho Chi Minh City.
Sales of passenger vehicles increased by 30.6% compared to the same period last year to reach 32 thousand units, while sales of commercial vehicles increased by 21.0% to reach 22 thousand units.
Toyota, the leading player, increased its sales 11.8% to 17 thousand units (30.4% market share), while second-placed Kia increased its sales by 23.7% to reach 14 thousand units (25.9%).
The automobile market is expected to expand steadily over the next one year due to growing consumer expenditure and the continued effect of the reduced car registration tax. The domestic automobile association expects automobile sales to increase by about 18% YoY in 2014 to reach 130 thousand units.
-100%
-50%
0%
50%
100%
150%
0
1,000
2,000
3,000
4,000
5,000
Jan/12 Jul/12 Jan/13 Jul/13 Jan/14 Jul/14
YoY (Note)
(RHS)
Electronics Export Value(LHS)
(USD Million)
-240%
-200%
-160%
-120%
-80%
-40%
0%
40%
80%
0
25
50
75
100
125
150
175
200
Jul/11 Jan/12 Jul/12 Jan/13 Jul/13 Jan/14 Jul/14
YoY (RHS)
New Car Sales(LHS)
(100 units)

13
21. Vietnam / Textile Exports Forecast: Continued Growth Expected
(Source:General Statistics Office)
The value of Vietnam’s textile exports in H1 2014
increased by 21.4% compared to the same period last year.
Demand from major export destinations in the United States and Asia (Japan, South Korea, etc.) continued to remain solid
The overall export value was boosted by the following factors: (1) manufacturers moved their production bases from China to Vietnam due to rising production costs in China as well as a decreased export capacity in China due to strong domestic demand for textile products, and (2) production bases were also moved to Vietnam from neighbouring Thailand and Indonesia as a result of recent rises in labour costs.
Vietnam’s textile exports are expected to continue to increase over the next one year. Vietnam is more competitive in the garment sector compared to its neighbours as it has lower labour costs. In addition, the shift in production from China, Thailand and Indonesia to Vietnam will allow Vietnam’s textile industry to expand at a faster rate compared to other textile producing countries.
22. India / Crude Steel Production Forecast: Likely to Improve
(Source:World Steel Association)
India’s crude steel production rose by 4.2% YoY to
41.3 million tons in H1 2014. While domestic demand growth slowed down to sub 2% levels, exports helped to maintain higher production growth.
Domestic steel demand has been weak as key end-use segments – construction, automobiles etc., have been hit by the economic slowdown. The World Steel Association (WSA) has revised down its demand growth estimate from 5.6% to 3.3% for 2014.
Going ahead, steel demand growth is expected to
improve over the next one year, especially from 2015 onwards. Higher economic growth, more conducive regulatory environment and rising consumer sentiments will aid recovery in key steel consuming sectors. This is expected to boost domestic steel demand growth to 5-6% in 2015.
-200%
-150%
-100%
-50%
0%
50%
100%
0
5
10
15
20
25
30
Jul/11 Jan/12 Jul/12 Jan/13 Jul/13 Jan/14 Jul/14
YoY (RHS)
Textile Export Value(LHS)
(USD Hundred Million)
-70%
-60%
-50%
-40%
-30%
-20%
-10%
0%
10%
20%
30%
0
1
2
3
4
5
6
7
8
9
10
Jul/11 Jan/12 Jul/12 Jan/13 Jul/13 Jan/14
YoY (RHS)
Steel Production
(Million tons)
‘

14
23. India / Automobile Sales Forecast: Slow Return to Recovery
(Source:Monthly Review of the Indian Economy)
Automobile sales in India in H1 2014 decreased by 7.2% YoY to 1.6 million units.
The worsening economy, as well as rising interest rates and gasoline prices, together with wait-and-see attitudes towards post-election automobile policy, dampened consumer appetite.
However, sales in June increased YoY due to the government’s reduction of excise duties, as well as improved sentiments toward the economy with the swearing in of the new government in May. As a result, automobile sales in June have returned to growth after 18 months of continuous decline, a trend that continued into July.
First-placed Maruti Suzuki increased its sales by 2.7% YoY, selling 569 thousand units (35.7% market share). Honda, in fifth place, increased its sales by 74.8% to 89 thousand units (5.6%). Sales of vehicles from local manufacturers Tata, Mahindra and Ashok Leyland declined sharply by 23.1% YoY due to a steep decline in sales of their commercial models.
The economic recovery and extension of the excise duty reductions to the end of 2014 are expected to return the automobile industry to growth over the next year. Major manufacturers expect automobile sales to increase by 2.0% this year to reach 3.3 million units.
24. India / Motorcycle Sales Forecast: Stable Growth Expected
(Source:Monthly Review of the Indian Economy)
Motorcycle sales in India in H1 2014 increased by 13.4% YoY to reach 7.8 million units.
Even though the business environment was negatively affected by the worsening economy, high interest rates and expensive fuel, strong demand from rural areas helped to boost overall demand for the motorcycle industry.
Sales of scooters increased by 30.8% to reach 2.0 million units, thanks to the multitude of new models that were introduced. Sales of motorcycles increased by 9.1% to reach 5.4 million units.
Market leader Hero Motocorp increased its sales by 7.2% to 3.2 million units (41.3% market share), while second-placed Honda’s sales increased by 42.6% to 2.0 million units (25.2%), thanks to robust sales of its scooters.
The positive expectations toward the Indian government that took office in May to improve the economy, as well as the steady demand from rural areas, are expected to boost the motorcycle industry over the next year. Major manufacturers expect sales to increase by 10% YoY to reach 16.0 million units in 2014.
-80%
-60%
-40%
-20%
0%
20%
40%
60%
0
100
200
300
400
500
600
700
Jul/11 Jan/12 Jul/12 Jan/13 Jul/13 Jan/14 Jul/14
(1,000 units)
Passenger Car Sales(LHS)
Commercial Car Sales
(LHS)YoY
(RHS)
-80%
-60%
-40%
-20%
0%
20%
40%
60%
0
40
80
120
160
200
240
280
Jul/11 Jan/12 Jul/12 Jan/13 Jul/13 Jan/14
YoY (RHS)
New Motorcycle Sales(LHS)
(10,000 units)

15
Appendix
Real GDP Growth Consumer Price Index (CPI)
Export Growth Rate Exchange Rates to USD (indexation)
Unemployment Rate Crude Oil Prices (WTI)
-2
0
2
4
6
8
10
12
14
3Q/11 1Q/12 3Q/12 1Q/13 3Q/13 1Q/14
Singapore Malaysia Thailand
Indonesia Philippine Vietnam
India
(%)
(Source) CEIC
‐8.9%
19.4%
0
2
4
6
8
10
12
14
Jul/11 Jan/12 Jul/12 Jan/13 Jul/13 Jan/14
Singapore Malaysia Thailand
Indonesia Philippines India
(%)
(Source) CEIC
-20
-10
0
10
20
30
40
50
60
70
3Q/11 1Q/12 3Q/12 1Q/13 3Q/13 1Q/14
Singapore Malaysia Thailand
Indonesia Philippines Vietnam
India
(%)
(Source) CEIC
70
80
90
100
110
120
130
140
150
Jul/11 Jan/12 Jul/12 Jan/13 Jul/13 Jan/14
Singapore Malaysia
Thailand Indonesia
Philippines India
(1/04=100)
(Source) CEIC
0
1
2
3
4
5
6
7
8
9
10
3Q/11 1Q/12 3Q/12 1Q/13 3Q/13 1Q/14
Singapore Malaysia Thailand
Indonesia Philippines Vietnam
(%)
(Note) The figures of Indonesia show annual data. (Source) CEIC
0
20
40
60
80
100
120
140
Jul/11 Jan/12 Jul/12 Jan/13 Jul/13 Jan/14
(USD / barrel)
(Source) Bloomberg

16
Bank of Tokyo Mitsubishi UFJ’s Network in Southeast and South Asia】
This report shall not be construed as solicitation to take any action such as purchasing/selling/investing in financial market products. In taking any action, each reader is requested to act on the basis of his or her own judgment. This report is based on information believed to be reliable, but we do not guarantee, and do not accept any liability whatsoever for, its accuracy and we accept no liability whatsoever for any loss or damage of any kind arising out of the use of all or any part of this report. The contents of the report may be revised without advance notice. Also, this report is a literary work protected by copyright. No part of this report may be reproduced in any form without express statement of its source. Bank of Tokyo-Mitsubishi UFJ is regulated by the Financial Services Authority. Copyright © The Bank of Tokyo-Mitsubishi UFJ, Limited 2014 No part of this publication may be reproduced, stored in a retrieval system or transmitted without the prior written permission of The Bank of Tokyo-Mitsubishi UFJ Limited.
Publisher: The Bank of Tokyo Mitsubishi UFJ, Corporate Research Division (Singapore)
9 Raffles Place #01-01 Republic Plaza, Singapore 048619 Yoshiyuki Suzaki (65) 6594- 4622 [email protected] Yuji Takekoshi (65) 6531- 4624 [email protected]
Kai Takeshima (65) 6230- 4327 [email protected]
Xavier Kong (65) 6231- 1857 [email protected]
Say Yong Koh (65) 6230- 4376 [email protected]
Archana Khemka (65) 6231- 1690 [email protected]
Diana Cheong (65) 6506- 3286 [email protected]
ホーチミン
Phnom Penh
ニムラナ
(2014年にアユタヤ銀行と統合予定)
Ho Chi Minh
Yangon
Branch Corporate Banking OfficeRepresentative Office
Sub-branch Service Point
Karachi
Chennai
Mumbai
New Delhi
Hanoi
Manila
Yangon
Dhaka
Bangkok
Kuala Lumpur Labuan
Surabaya
Bandung
Jakarta
Singapore
Bekasi
MM2100 Industrial Park
Caravan
Sunter
Cengkareng
Tjikampek
Kota Deltamas
Neemrana
Bangalore
(merged with Bank of Ayudhya)