Mass IntentionsMass Intentions Mass Intentions Next Sunday ...
Article
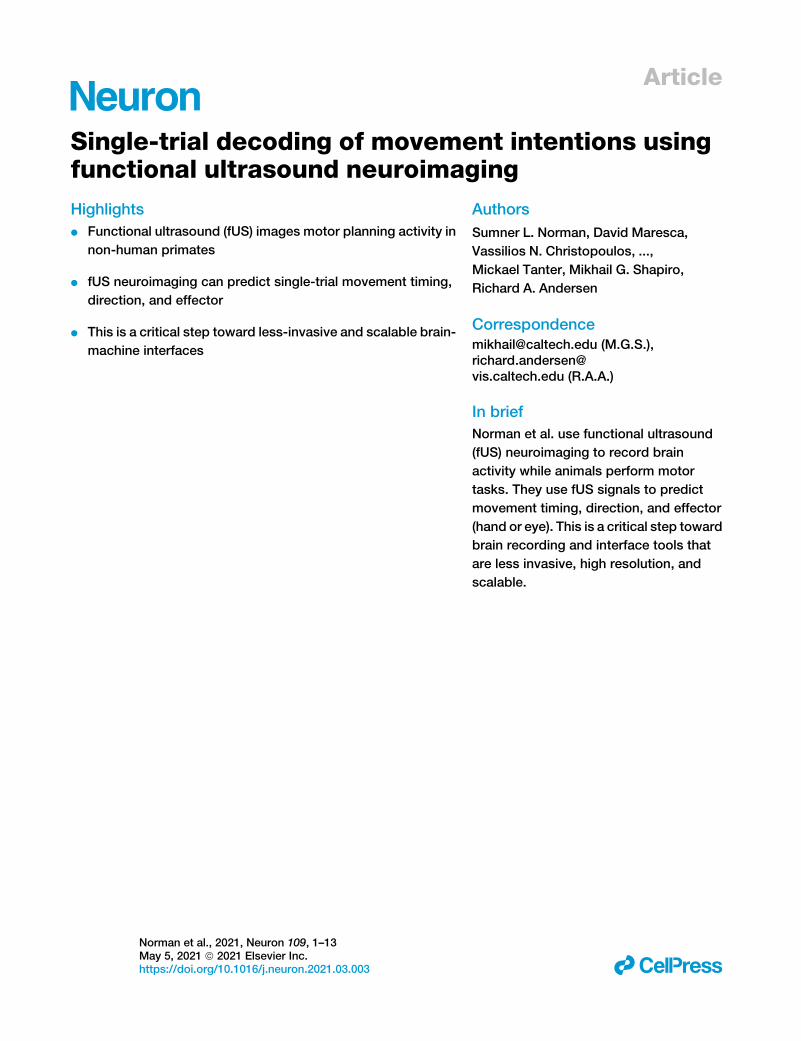
Single-trial decoding of m
ovement intentions usingfunctional ultrasound neuroimagingHighlights
d Functional ultrasound (fUS) images motor planning activity in
non-human primates
d fUS neuroimaging can predict single-trial movement timing,
direction, and effector
d This is a critical step toward less-invasive and scalable brain-
machine interfaces
Norman et al., 2021, Neuron 109, 1–13May 5, 2021 ª 2021 Elsevier Inc.https://doi.org/10.1016/j.neuron.2021.03.003
Authors
Sumner L. Norman, David Maresca,
Vassilios N. Christopoulos, ...,
Mickael Tanter, Mikhail G. Shapiro,
Richard A. Andersen
[email protected] (M.G.S.),[email protected] (R.A.A.)
In brief
Norman et al. use functional ultrasound
(fUS) neuroimaging to record brain
activity while animals perform motor
tasks. They use fUS signals to predict
movement timing, direction, and effector
(hand or eye). This is a critical step toward
brain recording and interface tools that
are less invasive, high resolution, and
scalable.
ll

Article
Single-trial decoding of movement intentionsusing functional ultrasound neuroimagingSumner L. Norman,1,6 David Maresca,5,6,7 Vassilios N. Christopoulos,1,2,6,8 Whitney S. Griggs,1 Charlie Demene,3,4
Mickael Tanter,3,4 Mikhail G. Shapiro,5,* and Richard A. Andersen1,2,9,*1Biology & Biological Engineering, California Institute of Technology, Pasadena, CA 91125, USA2T&C Chen Brain-Machine Interface Center, California Institute of Technology, Pasadena, CA 91125, USA3Physics for Medicine Paris, INSERM, CNRS, ESPCI Paris, PSL Research University, 75012 Paris, France4INSERM Technology Research Accelerator in Biomedical Ultrasound, Paris, France5Chemistry & Chemical Engineering, California Institute of Technology, Pasadena, CA 91125, USA6These authors contributed equally7Present address: Imaging Physics, TU Delft, 2628 CJ Delft, the Netherlands8Present address: Bioengineering, University of California, Riverside, Riverside, CA, USA9Lead contact
*Correspondence: [email protected] (M.G.S.), [email protected] (R.A.A.)https://doi.org/10.1016/j.neuron.2021.03.003
SUMMARY
New technologies are key to understanding the dynamic activity of neural circuits and systems in the brain.Here, we show that a minimally invasive approach based on ultrasound can be used to detect the neural cor-relates of movement planning, including directions and effectors. While non-human primates (NHPs) per-formed memory-guided movements, we used functional ultrasound (fUS) neuroimaging to record changesin cerebral blood volume with 100 mm resolution. We recorded from outside the dura above the posterior pa-rietal cortex, a brain area important for spatial perception, multisensory integration, andmovement planning.We then used fUS signals from the delay period before movement to decode the animals’ intended directionand effector. Single-trial decoding is a prerequisite to brain-machine interfaces, a key application that couldbenefit from this technology. These results are a critical step in the development of neuro-recording and braininterface tools that are less invasive, high resolution, and scalable.
INTRODUCTION
Novel technologies for interfacing with the brain are key to un-
derstanding the dynamic activity of neural circuits and systems
and diagnosing and treating neurological diseases. Many neural
interfaces are based on intracortical electrophysiology, which
provides direct access to the electrical signals of neurons with
excellent temporal resolution. However, the electrodes must
be implanted via significant-risk open-brain surgery. This pro-
cess causes acute and chronic local tissue damage (Polikov
et al., 2005), and implants suffer material degradation over
time (Barrese et al., 2013; Kellis et al., 2019). Invasive electrodes
are also difficult to scale and limited in sampling density and
brain coverage. These factors limit longevity and performance
(Kellis et al., 2019;Welle et al., 2020;Woolley et al., 2013). Nonin-
vasive techniques, such as electroencephalography (EEG) and
functional magnetic resonance imaging (fMRI), have achieved
considerable success in the research setting. Even so, they are
limited by low spatial resolution, summing activity of large brain
volumes, and the dispersion of signal through various tissues
and bone. Minimally invasive techniques such as epidural elec-
trocorticography (ECoG) span amiddle ground,maintaining rela-
tively high performance without damaging healthy brain tissue
(Benabid et al., 2019; Shimoda et al., 2012). However, it is
difficult to resolve signals from deep cortical or subcortical struc-
tures with spatial specificity. In addition, subdural ECoG remains
invasive in requiring penetration of the dura and exposure of un-
derlying brain tissue.
Here, we evaluate the potential of functional ultrasound (fUS)
imaging, a recently developed, minimally invasive neuroimaging
technique, to provide single-trial decoding of movement inten-
tions, a neural signaling process of fundamental importance
and applicability in brain-machine interfaces (BMIs). fUS imaging
is a hemodynamic technique that visualizes regional changes in
blood volume using ultrafast Doppler angiography (Bercoff et al.,
2011; Mace et al., 2013; Mace et al., 2011). It provides excellent
spatiotemporal resolution compared to existing functional neu-
roimaging techniques (<100 mm and 100 ms) and high sensitivity
(~1 mm/s velocity; Boido et al., 2019) across a large field of view
(several centimeters). Since its introduction in 2011 (Mace et al.,
2011), fUS has been used to image neural activity during
epileptic seizures (Mace et al., 2011), olfactory stimuli (Osmanski
et al., 2014), and behavioral tasks in freely moving rodents (Sieu
et al., 2015; Urban et al., 2015). It has also been applied to non-
rodent species, including ferrets (Bimbard et al., 2018), pigeons
(Rau et al., 2018), non-human primates (NHPs) (Blaize et al.,
2020; Dizeux et al., 2019), and humans (Demene et al., 2017; Im-
bault et al., 2017; Soloukey et al., 2020). Unlike fMRI, fUS can be
Neuron 109, 1–13, May 5, 2021 ª 2021 Elsevier Inc. 1
ll
Please cite this article in press as: Norman et al., Single-trial decoding of movement intentions using functional ultrasound neuroimaging, Neuron(2021), https://doi.org/10.1016/j.neuron.2021.03.003

applied in freely moving subjects using miniature, head-mount-
able transducers (Sieu et al., 2015). In addition, the hemody-
namic imaging performance of fUS is ~5- to 10-fold better in
terms of spatiotemporal resolution and sensitivity compared to
fMRI (Deffieux et al., 2018; Mace et al., 2011; Rabut et al., 2020).
In this study, we leveraged the high sensitivity of fUS imaging
to detect movement intentions in NHPs. We trained two animals
to perform memory-delayed instructed eye movements (sac-
cades) and hand movements (reaches) to peripheral targets.
Meanwhile, we recorded hemodynamic activity over the poste-
rior parietal cortex (PPC) through a cranial window throughout
the task. PPC is an association cortical region situated between
visual and motor cortical areas and is involved in high-level
cognitive functions, including spatial attention (Colby and Gold-
berg, 1999), multisensory integration (Andersen and Buneo,
2002), and sensorimotor transformations for movement planning
(Andersen and Cui, 2009). The functional characteristics of PPC
have been thoroughly studied using electrophysiological (Ander-
sen et al., 1987; Andersen and Buneo, 2002; Colby and Gold-
berg, 1999; Gnadt and Andersen, 1988; Snyder et al., 1997)
and functional magnetic resonance techniques (Kagan et al.,
2010; Wilke et al., 2012), providing ample evidence for compar-
ison to the fUS data. PPC contains several subregions with
anatomical specialization, including the lateral intraparietal
area (LIP) involved in planning saccade movements (Andersen
et al., 1987; Andersen and Buneo, 2002; Gnadt and Andersen,
1988; Snyder et al., 1997) and the parietal reach region (PRR)
involved in planning reach movements (Andersen and Buneo,
2002; Calton et al., 2002; Snyder et al., 2000, 1997). Importantly,
their activity can be simultaneously recorded within a single
fUS imaging frame (approximate slice volume of 12.8 3
13 3 0.4 mm).
Figure 1. Anatomical scanning regions
(A and B) Illustrations of craniotomy field of view in
the axial plane (A) and coronal cross-section (B),
overlaid on a NHP brain atlas (Calabrese et al., 2015).
The 24 3 24-mm (inner dimension) chambers were
placed surface normal to the brain on top of the
craniotomized skull.
(C and D) 3D vascular maps for monkey L and
monkey H. The field of view included the central and
intraparietal sulci for both monkeys.
(E and F) Representative slices for monkey L and
monkey H show the intraparietal sulcus (dotted line,
labeled ips) with orientation markers (l, lateral or left;
r, right; m, medial; v, ventral; d, dorsal; a, anterior; p,
posterior).
By recording brain activity while animals
perform movement tasks, we provide evi-
dence that fUS can detect motor planning
activity that precedes movement in NHPs.
We extend these results to decode several
dimensions of behavior at a single-trial
level. These include (1) when the monkey
entered the task phase, (2) which effector
they intended to use (eye or hand), and (3)
which direction they intended to move (left
or right). These results show for the first time that fUS is capable
of imaginghemodynamics in largeanimalswithenoughsensitivity
to decode the timing and goals of an intended movement. These
findings also represent a critical step toward the use of fUS for
BMIs. Such interfaces provide a direct causal link between brain
and machine by interpreting neural activity related to user inten-
tion. They are excellent tools for neuroscientific investigation (Sa-
kellaridi et al., 2019) and as a neuroprosthetic to enable people
with paralysis to control assistive devices, including computer
cursors and prosthetic limbs (Aflalo et al., 2015; Collinger et al.,
2013;Hochberget al., 2012, 2006). As fUShardwareandsoftware
developments enable real-time imaging andprocessing, fUSmay
prove a valuable tool for future BMIs.
RESULTS
To look for goal-related hemodynamic signals in the PPC, we ac-
quired fUS images from NHPs using a miniaturized 15-MHz,
linear array transducer placed on the dura via a cranial window.
The transducer provided a spatial resolution of 100 mm 3
100 mm in-plane, slice thicknesses of ~400 mm, covering a plane
with a width of 12.8 mm and penetration depth of 16 mm. We
positioned the probe surface-normal in a coronal orientation
above the PPC (Figures 1A and 1B). We then selected planes
of interest for each animal from the volumes available (Figures
1C–1F). Specifically, we chose planes that captured both the
lateral and medial banks of the intraparietal sulcus (ips) within
a single image and exhibited behaviorally tuned hemodynamic
activity. We used a plane-wave imaging sequence at a pulse
repetition frequency of 7,500 Hz and compounded frames
collected from a 500-ms period each second to form power
Doppler images with a 1 Hz refresh rate.
llArticle
2 Neuron 109, 1–13, May 5, 2021
Please cite this article in press as: Norman et al., Single-trial decoding of movement intentions using functional ultrasound neuroimaging, Neuron(2021), https://doi.org/10.1016/j.neuron.2021.03.003

A
B
D
G H I
FE
C
(legend on next page)
llArticle
Neuron 109, 1–13, May 5, 2021 3
Please cite this article in press as: Norman et al., Single-trial decoding of movement intentions using functional ultrasound neuroimaging, Neuron(2021), https://doi.org/10.1016/j.neuron.2021.03.003

Hemodynamic response during memory-guidedsaccadesTo resolve goal-specific hemodynamic changes within single tri-
als, we trained two NHPs to perform memory-delayed instructed
saccades. We used a similar task design to previous experiments
investigating the roles of PPC regions using fMRI blood-oxygen-
level-dependent (BOLD) (Kagan et al., 2010; Wilke et al., 2012)
and reversible pharmacological inactivation (Christopoulos et al.,
2015). Specifically, the monkeys were required to memorize the
location of a cue presented in either the left or right hemifield and
execute the movement once the center fixation cue extinguished
(Figure 2A). The memory phase was chosen to be sufficiently
long (from 4.0 to 5.1 s depending on the animals’ training and suc-
cess rate, with a mean of 4.4 s across sessions) to capture hemo-
dynamic changes.Wecollected fUSdatawhile eachanimal (N=2)
performed memory-delayed saccades. We collected 2,441 trials
over 16 days (1,209 from monkey H and 1,232 from monkey L).
We use statistical parametric maps based on the Student’s
t test (one sided with false discovery rate [FDR] correction) to
visualize patterns of lateralized activity in PPC (Figures 2B and
2G). We observed event-related average (ERA) changes of cere-
bral blood volume (CBV) throughout the task from localized re-
gions (Figures 2C–2F, 2H, and 2I). Spatial response fields of
laterally tuned hemodynamic activity appeared on the lateral
bank of ips (i.e., in LIP). The response fields and ERA waveforms
were similar between animals and are consistent with previous
electrophysiological (Graf and Andersen, 2014) and fMRI
BOLD (Wilke et al., 2012) results. Specifically, ERAs from LIP
show higher memory phase responses to contralateral (right)-
compared to ipsilateral (left)-cued trials (one-sided t test of
area under the curve during memory phase, t test p < 0.001).
Monkey H exhibited a similar direction-tuned response in the
presumed medial parietal area (MP), a small patch of cortex on
the medial wall of the hemisphere (we did not record this area ef-
fect in monkey L, because MP was outside the imaging plane).
This tuning supports previous evidence ofMP’s role in directional
eyemovement observed in aprevious study (Thier andAndersen,
1998). In contrast, focal regions of microvasculature outside the
LIPalso showedstrongevent-related responses to the taskonset
but were not tuned to target direction (e.g., Figure 2E).
Memory-delayed reachesIn a second experiment, we also collected fUS signals while each
NHP performedmemory reaches. In total, we collected 1,480 tri-
als (543 frommonkey H and 937 frommonkey L) over 8 sessions.
The task was similar to that of saccades, but the animal’s gaze
remained fixated throughout the trial, including during the fixa-
tion, memory, and reach movement phases (Figure 3A). The
memory phase ranged from 3.2 to 5.2 s depending on the ani-
mals’ training and success rate (mean, 4.2 s across sessions).
ERAs on the lateral bank of ips reveal populations with direc-
tion-specific tuning (Figures 3C, 3D, 3F, and 3G). MP, which
was responsive to saccade planning for monkey H (Figure 2I),
was not responsive to reach planning. Populations on the medial
bank in the putative PRR do not exhibit lateralized tuning but do
show bilateral tuning to the movement (Figures 3D and 3G).
These results are consistent with electrophysiological record-
ings, in which the PRR neurons as a population encode both
hemispaces, whereas LIP neurons largely encode the contralat-
eral space (Quian Quiroga et al., 2006).
Single-trial decodingWe predicted the direction of upcoming movements using single
trials of fUS data (Figure 4A). Briefly, we used class-wise prin-
cipal-component analysis (CPCA) to reduce data dimensionality.
We chose CPCA because it is ideally suited to discrimination
problems with high dimension and small sample size (Das and
Nenadic, 2009, 2008). We then used ordinary least-squares
regression (OLSR) to regress the transformed fUS data (from
the memory delay period) to the movement direction (i.e., class
label). Finally, we used linear discriminant analysis (LDA) to clas-
sify the resulting value for each trial as a presumed left or right
movement plan. All reported results were generated using a
10-fold cross-validation. Saccade direction prediction accuracy
within a session (i.e., decoded from the memory delay) ranged
from 61.5% (binomial test versus chance level, p = 0.012) to
100% (p < 0.001) on a given 30-min run. The mean accuracy
across all sessions and runswas 78.6% (p < 0.001). Reach direc-
tion prediction accuracy ranged from 73.0% (binomial test
versus chance level, p < 0.001) to 100% (p < 0.001). The mean
accuracy across all sessions and runs was 88.5% (p < 0.001).
Figure 2. Saccade task, event-related response maps, and waveforms
(A) A trial started with the animals fixating on a central cue (red diamond). Next, a target cue (red diamond) was flashed on either the left or right visual field. During
amemory period, the animals had to remember its location while continuing to fixate on the center cue.When the center was extinguished (go signal), the animals
performed a saccade to the remembered peripheral target location and maintained eye fixation before receiving a reward. *Mean values across sessions shown;
the fixation andmemory periods were consistent within each session but varied across sessions from 5.4 to 6.3 s and 4.0 to 5.1 s, respectively, depending on the
animals’ level of training. The fixation and memory periods were subject to 400 ms of jitter (green shaded area, uniform distribution) to preclude the animal from
anticipating the change(s) of the trial phase.
(B–F) Representative activity map and event-related average (ERA) waveforms of CBV change within labeled regions of interest duringmemory-guided saccades
for monkey L.
(B) A statistical map shows localized areas with significantly higher signal change (SC) (one-sided t test of area under the curve, p < 0.01) during thememory delay
phase for right-cued compared to left-cued saccades, i.e., vascular patches of contralaterally tuned activity.
(C and D) ERA waveforms in LIP display lateralized tuning specific to local populations.
(E) Small vasculature outside of LIP exhibits event-related structure that is tuned to task structure but not target direction.
(F) Vessels that perfuse large areas of cortex do not exhibit event-related signal.
(G–I) Activity map and ERA waveforms within labeled regions of interest for monkey H.
(G) Map for monkey H.
(H) ERA waveforms show lateralized tuning in LIP.
(I) Target tuning also appears in medial parietal area (MP) for monkey H.
(C)–(F) share a common range (9% SC), as do (H) and (I) (14%). ERAs are displayed as means across trials, and shaded areas represent standard error (SEM).
llArticle
4 Neuron 109, 1–13, May 5, 2021
Please cite this article in press as: Norman et al., Single-trial decoding of movement intentions using functional ultrasound neuroimaging, Neuron(2021), https://doi.org/10.1016/j.neuron.2021.03.003

To analyze the temporal evolution of direction-specific informa-
tion in PPC, we attempted to decode the movement direction
across time through the trial phases (fixation, memory, andmove-
ment). For each time point, we accumulated the preceding data.
For example, at t = 2 s, we included imaging data from t = 0–2 s
(where t = 0 s corresponds to the beginning of fixation). The result-
ing cross-validated accuracy curves (Figure 4B) showaccuracy at
chance level during the fixation phase, increasing discriminability
during thememory phase, and sustaineddecode accuracy during
the movement phase. During the memory phase, decoder accu-
racy improved, surpassing significance 2.08 s ± 0.82 s after the
monkey received the target cue for saccades (2.32 s ± 0.82 s
beforemoving,binomial test versuschance level,p<0.05,Bonfer-
roni corrected for 18 comparisons across time) and 1.92 s ± 1.4 s
A
B C D
E F G
Figure 3. Reach task, event-related response map, and waveforms
(A) Monkeys performed a memory-guided reaching task using a 2D joystick. A trial started with the animal fixating on a central cue (red diamond) and positioning
the joystick to its center (green circle). Next, a target (green circle) was flashed on either the left or right visual field. The animal memorized its locationwhile fixating
eye and hand on the center cue. When the hand center cue was extinguished (go signal), the animal performed a reach to the remembered target location and
maintained the position before receiving a reward. Importantly, eye fixation was maintained throughout the entire trial. *Mean values across sessions shown; the
fixation and memory periods were consistent within each session but varied across sessions from 2.5 to 5.9 s and 3.2 to 5.2 s, respectively. The fixation and
memory periods were subject to 400ms of jitter (green shaded area, uniform distribution) to preclude the animal from anticipating the change(s) of the trial phase.
(B) A statistical map shows localized areas with significantly higher SC (one-sided t test of area under the curve, p < 0.01, false discovery rate [FDR] corrected for
number of pixels in image) during the memory delay phase for right-cued compared to left-cued reaches (i.e., vascular patches of contralaterally tuned activity).
(C) ERA waveforms from the lateral bank of ips reveal lateralized tuning in reaching movements.
(D) ERA waveforms in the medial bank of ips exhibit a population with bilateral tuning to reaching movements. ERAs are displayed as means across trials, and
shaded areas represent standard error (SEM).
(E–G) Statistical map and ERA waveforms from monkey H.
llArticle
Neuron 109, 1–13, May 5, 2021 5
Please cite this article in press as: Norman et al., Single-trial decoding of movement intentions using functional ultrasound neuroimaging, Neuron(2021), https://doi.org/10.1016/j.neuron.2021.03.003
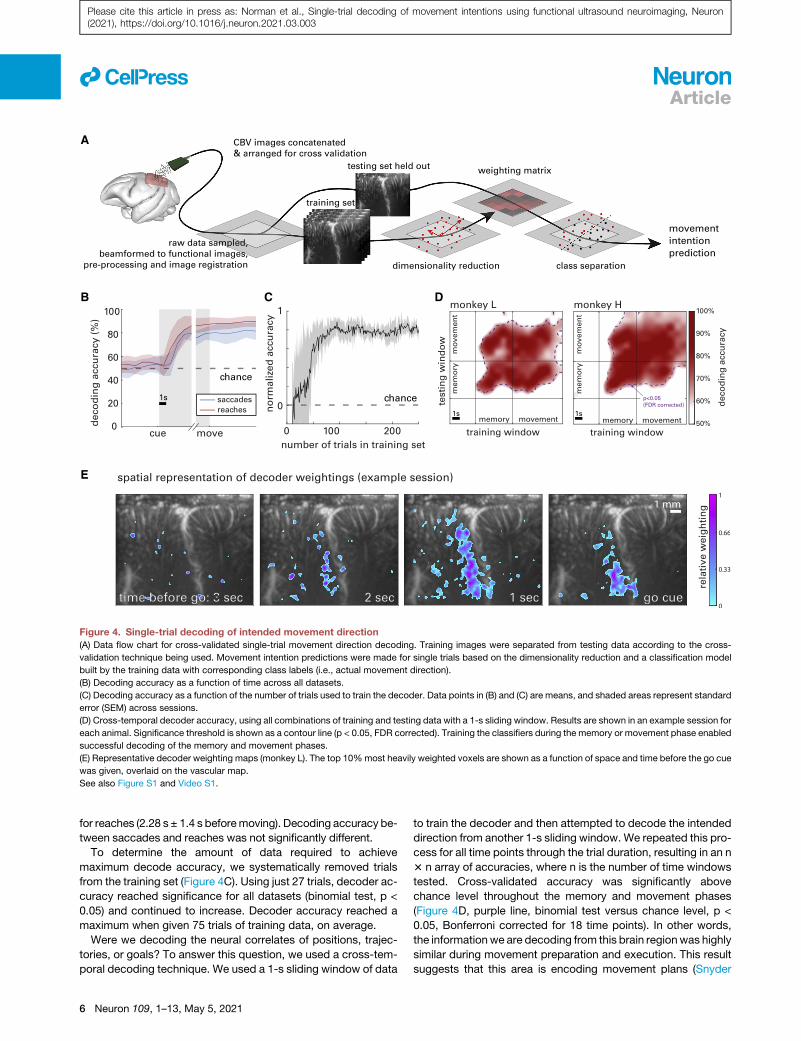
for reaches (2.28 s ± 1.4 s beforemoving). Decoding accuracy be-
tween saccades and reaches was not significantly different.
To determine the amount of data required to achieve
maximum decode accuracy, we systematically removed trials
from the training set (Figure 4C). Using just 27 trials, decoder ac-
curacy reached significance for all datasets (binomial test, p <
0.05) and continued to increase. Decoder accuracy reached a
maximum when given 75 trials of training data, on average.
Were we decoding the neural correlates of positions, trajec-
tories, or goals? To answer this question, we used a cross-tem-
poral decoding technique. We used a 1-s sliding window of data
to train the decoder and then attempted to decode the intended
direction from another 1-s sliding window. We repeated this pro-
cess for all time points through the trial duration, resulting in an n
3 n array of accuracies, where n is the number of time windows
tested. Cross-validated accuracy was significantly above
chance level throughout the memory and movement phases
(Figure 4D, purple line, binomial test versus chance level, p <
0.05, Bonferroni corrected for 18 time points). In other words,
the informationwe are decoding from this brain regionwas highly
similar during movement preparation and execution. This result
suggests that this area is encoding movement plans (Snyder
A
B C D
E
Figure 4. Single-trial decoding of intended movement direction
(A) Data flow chart for cross-validated single-trial movement direction decoding. Training images were separated from testing data according to the cross-
validation technique being used. Movement intention predictions were made for single trials based on the dimensionality reduction and a classification model
built by the training data with corresponding class labels (i.e., actual movement direction).
(B) Decoding accuracy as a function of time across all datasets.
(C) Decoding accuracy as a function of the number of trials used to train the decoder. Data points in (B) and (C) are means, and shaded areas represent standard
error (SEM) across sessions.
(D) Cross-temporal decoder accuracy, using all combinations of training and testing data with a 1-s sliding window. Results are shown in an example session for
each animal. Significance threshold is shown as a contour line (p < 0.05, FDR corrected). Training the classifiers during the memory or movement phase enabled
successful decoding of the memory and movement phases.
(E) Representative decoder weighting maps (monkey L). The top 10%most heavily weighted voxels are shown as a function of space and time before the go cue
was given, overlaid on the vascular map.
See also Figure S1 and Video S1.
llArticle
6 Neuron 109, 1–13, May 5, 2021
Please cite this article in press as: Norman et al., Single-trial decoding of movement intentions using functional ultrasound neuroimaging, Neuron(2021), https://doi.org/10.1016/j.neuron.2021.03.003

et al., 1997), visuo-spatial attention (Colby and Goldberg, 1999),
or both. Although intention and attention are overlapping ab-
stract concepts that cannot be separated by this experimental
design, dissociating their contribution would not fundamentally
change our interpretation. Distinct spatial locations within PPC
encoded this information, a fact reflected in the variable weight-
ing assigned to each voxel in our decoding algorithm. The
decoder placed the highest weightings in area LIP (Figure 4E).
This also agrees with the canonical function of this region (Ander-
sen and Buneo, 2002; Gnadt and Andersen, 1988).
Decoding memory period, effector, and directionTo demonstrate the ability of fUS to decode multiple dimensions
of behavior from a single trial of data, we trained the same two
animals to perform a memory-delayed, intermingled effectors
task. This task was similar to the saccade and reach tasks in
its temporal structure. However, in addition to the animals
fixating their gaze during the fixation period, they also moved a
joystick to a central cue with their right hand. This cue’s color
indicated which effector they should move when the go cue
arrived (blue for saccades and red for reaches). If the monkey
moved the correct effector (eye/hand) to the correct direction
(left/right), then they received a liquid reward (Figure 5A). In total,
we collected 1,576 trials (831 frommonkey H and 745 frommon-
key L) over four sessions (two from each animal) while they per-
formed this task.
Wedecoded the temporal courseof (1) the task structure, (2) the
effector, and (3) the target direction of the animal using a decision
tree decoder. First, we predicted the task memory periods versus
non-memory periods (includingmovement, inter-trial interval, and
fixation). We refer to this distinction as task/no task (Figure 5C,
task/no task). To predict when the monkey entered the memory
period, the decoder used continuous data where each power
Doppler image was labeled as task or no task. After predicting
the animal entered the taskphase, the second layer of thedecision
tree used data from the predicted task phase period to classify
effector and direction (Figure 5C, reach/saccade, left/right). Each
of these decodes used the same strategy as before (cross-vali-
dated CPCA). Figure 5B depicts the confusion matrix of decoding
accuracy for each class for monkeys H and L. The classifier
correctly predicted no-task periods 85.9% and 88.8% of the
time for monkeys H and L, respectively, left versus right on
72.8% and 81.5% of trials for monkeys H and L, and eye versus
hand on 65.3% and 62.1% of trials for monkeys H and L. All three
decodes were significantly above chance level (p < 0.05, binomial
test versus chance, Bonferroni corrected for three comparisons).
A B
C
Figure 5. Decoding task, effector, and direction simultaneously
(A) Intermingledmemory-delayed saccade and reach task. A trial started with the animals fixating their gaze (and moving the joystick to) a central cue. The center
fixation cue was either colored blue to cue saccades (top row) or red to cue reaches (bottom row), randomized trial by trial (i.e., not blocked). Next, a target (white
circle) was flashed on either the left or right visual field. The animals had to remember its location while continuing to fixate their eye and hand on the center cue.
When the center was extinguished (go signal), the animals performed a movement of either the eye or hand to the remembered peripheral target location. *Mean
values across sessions shown; the fixation period was consistent within each session but varied across sessions from 2.4 to 4.3 s.
(B) Confusion matrices of decoding accuracy represented as percentage (columns add to 100%).
(C) Example classification of 14 consecutive trials. Classification predictions are shown as lines, and shaded areas indicate ground truth. An example of the fUS
image time series transformed by the classifier subspace appears in red. After predicting the task period, the classifier decoded effector (second row) and
movement direction (third row) using data only from the predicted task period (first row).
llArticle
Neuron 109, 1–13, May 5, 2021 7
Please cite this article in press as: Norman et al., Single-trial decoding of movement intentions using functional ultrasound neuroimaging, Neuron(2021), https://doi.org/10.1016/j.neuron.2021.03.003

Vascular signal and information contentThe purported benefits of fUS compared to established neuroi-
maging techniques include increased resolution and sensitivity.
To test the benefit of increased resolution, we classified move-
ment goals while systematically decreasing the resolution of
the image. We resized the images using a low-pass filter in
each of the dimensions of the imaging plane, x (across the probe
surface) and z (with image depth). We then used the entire image
(where the downsized images contained fewer pixels) to decode
movement direction. Accuracy continuously decreased as voxel
sizes increased (Figure 6A). This effect was isotropic (i.e., similar
for both x and z directions).
We hypothesized that functional information useful for decod-
ingwould primarily be located in subresolution (<100 mm) vessels
within the imaging plane. This hypothesis was based on the func-
tion of hyperemia, which starts in parenchymal arterioles and
first-order capillaries (i.e., vessels of diameter <50 mm; Rungta
et al., 2018). To test this hypothesis, we rank ordered voxels
by their mean power Doppler intensity and segmented them by
deciles, resulting in a spatial map of ranked deciles (Figure 6C).
Deciles 1–2 mostly captured subcortical areas. Deciles 3–8
mostly captured cortical layers. Deciles 9 and 10 were largely
restricted to large arteries, commonly on the cortical surface
and in the sulci. We then classified movement goals using data
from each decile. We normalized accuracy for each session,
where 0 represents chance level (50%) and 1 represents the
maximum accuracy reached across deciles. Accuracy peaked
when the regions of the image within the third decile of mean
Doppler power were used to decode movement direction. This
decile was mostly represented by cortex vasculature, much of
which is at or below the limits of fUS resolution. This result is
consistent with our hypothesis that functional hyperemia arises
from subresolution vessels (Boido et al., 2019; Maresca et al.,
2020) and agrees with previous studies in rodents (Demene
et al., 2016) and ferrets (Bimbard et al., 2018).
DISCUSSION
Contributions compared to previous workThis work presents a high-water mark for ultrasound neuroimag-
ing sensitivity that builds on the two previous studies of fUS in
NHPs. Significant advances include (1) classification of behavior
using fUS data from a single trial, (2) detection of the neural cor-
relates of behavior before its onset, (3) the first investigation of
motor planning using fUS, and (4) significant advances in ultrafast
ultrasound imaging for single trial and real-time imaging as a pre-
cursor to BMI. Dizeux et al. were the first to use fUS in NHPs,
finding changes in CBV in the supplementary eye field (SEF) dur-
ing an eye movement task and mapping directional functional
connectivity within cortical layers (Dizeux et al., 2019). Blaize
et al. recorded fUS images from the visual cortex (V1, V2, and
V3) of NHPs to reconstruct retinotopic maps (Blaize et al.,
2020). Both studies explored the boundaries of fUS sensitivity.
Dizeux et al. showed that the correlation of fUS signal from SEF
and the behavior signal was statistically predictive of the success
rate of the animal. However, this prediction required 40 s of data.
A B
C
Figure 6. Effects of spatial resolution, time window, and mean power Doppler intensity
(A) Accuracy decreases with resolution in both the x direction (across the imaging plane) and z direction (depth in the plane) in an isotropic manner.
(B) Decoding accuracy as a function of decoder time bin durations (1-, 2-, and 3-s bins represented by black, red, and purple, respectively). Data are aligned to the
end of the time bin used for decoding. Dots represent maximum decoder accuracy for each session for each of the bin sizes. Stars indicate statistical significance
between groups (Student’s t test, p < 0.001 for all combinations).
(C) A typical vascularmap overlaid with contours dividing the image into deciles ofmean power Doppler intensity. Decoding accuracy is shown as a function of the
mean power Doppler intensity. Information content is greatest in quantile 3, which mostly contains small vasculature within the cortex. Subcortical and primary
unit vasculature (i.e., deciles 1 and 10) are least informative to decoding movement direction.
All data represent means, and shaded areas, when present, represent standard error (SEM) across sessions.
llArticle
8 Neuron 109, 1–13, May 5, 2021
Please cite this article in press as: Norman et al., Single-trial decoding of movement intentions using functional ultrasound neuroimaging, Neuron(2021), https://doi.org/10.1016/j.neuron.2021.03.003
Blaize et al. used a binary classification (50% chance level) tech-
nique to determine the number of trials necessary to construct
retinotopicmaps. They reached 89%accuracy after 10 averaged
trials for one monkey and 91.8% for the second monkey. Our
study is the first to successfully classify fUSactivitywith just a sin-
gle trial of data. Furthermore, we predicted the differences be-
tween multiple task variables (e.g., effector, direction) in addition
to detecting the task itself. We also decoded the behavior of the
animal before it was executed. Compared to previous multi-trial
detection of a stimulus or task, detecting cognitive state variables
fromsingle trials represents a newhigh bar for fUS neuroimaging.
This study represents the first investigation ofmotor planning and
execution using fUS. It thus is the first example in a future body of
work using fUS to study the neural correlates of motor learning
and motor control in large animals. Finally, the methods devel-
oped here are technological achievements by introducing mini-
mal latency (Video S1; Figure S1) and being robust across ani-
mals and task paradigms (Figures 2, 3, 4, and 5). Thus, they
can be applied in a range of tasks and applications that require
real-time signal detection.
Simultaneous effector and direction decodingPPC’s location within the dorsal stream suggests that while vi-
suospatial variables are well represented, other movement vari-
ables such as effector may be more difficult to detect. Indeed,
decoding accuracy was higher for direction (i.e., left versus right)
than for effector (i.e., hand versus eye) (Figure 5B). The observed
difference in performance is likely due to PPCs bias toward the
contralateral side and partially intermixed populations for effec-
tors in some regions. In addition to direction and effector, we
decoded the task versus no-task phases. This is a critical step
toward closed-loop feedback environments such as BMI, where
the user gates their own movement or the decoder is otherwise
not privy to movement or task timing information. Furthermore,
simultaneous decoding of task state, direction, and effector is
a promising step forward for the use of fUS in both complex be-
haviors and BMIs.
Comparison of fUS to electrophysiologyThere are several clear advantages of fUS monitoring. fUS can
reliably record from large portions of the brain simultaneously
(e.g., cortical areas LIP and PRR) with a single probe. fUS is
also much less invasive than intracortical electrodes; it does
not require penetration of the dura mater. This is a significant
attribute, because it greatly reduces the risk level of the tech-
nique. Furthermore, while tissue reactions degrade the perfor-
mance of chronic electrodes over time (Woolley et al., 2013),
fUS operates epidurally, precluding these reactions. In addition,
our approach is highly adaptive thanks to the reconfigurable
electronic focusing of the ultrasound beam and its wide field of
view. This makes it much easier to target regions of interest.
fUS also provides access to cortical areas deep within sulci
and subcortical brain structures that are difficult to target with
electrophysiology. Finally, the mesoscopic view of neural popu-
lations made available by fUS may be favorable for decoder
generalization. Thus, training and using decoders across days
and/or subjects will be an exciting and important direction of
future research.
Other techniques, such as noninvasive scalp EEG, have been
used to decode single trials and as a neural basis for control of
BMI systems (Norman et al., 2018; Wolpaw et al., 1991; Wolpaw
and McFarland, 2004). The earliest proof-of-concept EEG-
based BMI achieved a one-bit decode (Nowlis and Kamiya,
1970). Performance of modern EEG BMIs varies greatly across
users (Ahn and Jun, 2015) but can yield two degrees of freedom
with 70%–90% accuracy (Huang et al., 2009). This performance
is comparable to that described here using fUS. However, fUS
performance is rapidly increasing as an evolving neuroimaging
technique, including recent breakthroughs in 3D fUS neuroimag-
ing (Rabut et al., 2019; Sauvage et al., 2018). These technolog-
ical advances are likely to herald improvements in fUS single-trial
decoding and future BMIs.
Epidural ECoG is a minimally invasive technique used for
neuroscientific investigation, clinical diagnostics, and as a
recording method for BMIs. Building on the success of more-
invasive subdural ECoG, early epidural ECoG in monkeys
enabled decoding of continuous 3D hand trajectories with
slightly worse accuracy than subdural ECoG (Shimoda et al.,
2012). More recently, bilateral epidural ECoG over human so-
matosensory cortex facilitated decoding of 8 degrees of freedom
(4 degrees of freedom per arm, including 3D translation of a ro-
botic arm and wrist flexion) with ~70% accuracy (Benabid
et al., 2019). In this study, we demonstrated that unilateral fUS
imaging of PPC enabled 3 degrees of freedom with similar accu-
racy. This is fewer degrees than attainable usingmodern bilateral
ECoG grids. However, it demonstrates that, as a young tech-
nique, fUS holds excellent potential. Future work can, for
example, extend these findings to similarly record bilateral
cortical and subcortical structures, such as M1, PPC, and basal
ganglia. As fUS recording technology rapidly advances toward
high-speed, wide-coverage, and 3D scanning, these types of re-
cordings will become commonplace.
Advances in fUS technologyImprovements in fUS imaging and computation power continue
to accelerate functional frame rates and sensitivity. New scanner
prototypes promise faster refresh rates, already reaching 6 Hz
(Brunner et al., 2020). Although high temporal resolutions will
oversample the hemodynamic response, they enable detection
of new feature types (e.g., directional mapping of functional con-
nectivity between brain regions) (Dizeux et al., 2019). The user
could also preferentially sacrifice frame rate to compound
more frames into functional images, improving image sensitivity.
Thus, we anticipate that although these results are a critical step
in decoding brain states from a single trial, they are only the first
in many forthcoming improvements.
Goal decoding for BMIThe results presented here suggest that fUS has potential as a
recording technique for BMI. A potential limitation is the temporal
latency of the hemodynamic response to neural activity. Electro-
physiology-based BMIs that decode velocity of intended limb
movements require as little latency as possible. However, in
many cases, goal decoding circumvents the need for instanta-
neous updates. For example, if a BMI decodes the visuospatial
location of a goal (as we do here), then the external effector
llArticle
Neuron 109, 1–13, May 5, 2021 9
Please cite this article in press as: Norman et al., Single-trial decoding of movement intentions using functional ultrasound neuroimaging, Neuron(2021), https://doi.org/10.1016/j.neuron.2021.03.003

(e.g., a robotic arm) can complete the movement without low-
level, short-latency information (e.g., joint angles). Furthermore,
goal information as found in PPC can represent sequences of
consecutivemovements (Baldauf et al., 2008) andmultiple effec-
tors simultaneously (Chang and Snyder, 2012). Finally, future
goal decoders could potentially leverage information from re-
gions in the ventral stream to decode object semantics directly
(Bao et al., 2020). These unique advantages of goal decoding
could thus improve BMI efficacy without requiring short-latency
signals.
fUS BMI in its form in the current study could also enable BMIs
outside the motor system. Optimal applications might require
access to deep brain structures or large fields of view on time-
scales compatible with hemodynamics. For example, cognitive
BMIs such as state decoding of mood and other psychiatric
states (Shanechi, 2019) are of great interest due to the
astounding prevalence of psychiatric disorders. Like fUS, cogni-
tive BMI is a small but rapidly advancing area of research (Ander-
sen et al., 2019;Musallam et al., 2004). It is ourmission that these
areas of research mature together, as they are well matched in
timescale and spatial coverage.
One concern about goal decoding is that an error and subse-
quent change in motor plan happen on short timescales. These
sudden changes are difficult to decode regardless of recording
methodology, only recently appearing as a potential feature in
chronically implanted electrophysiology-based BMIs (Even-
Chen et al., 2017). Action inhibition is often attributed to subcor-
tical nuclei, such as the basal ganglia (Jin and Costa, 2010) and
subthalamic nucleus (Aron et al., 2016), rather than the cortical
areas most often used for BMI. fUS may be able to simulta-
neously image cortex and these subcortical nuclei but would still
be subject to hemodynamic delays. Decreasing system la-
tencies and detecting error signals with complementary
methods will be an important topic for future research.
Activity in PPC during saccade planningActivationmaps revealed regions (~100 mm to ~1 cm) within PPC
during saccade planning that weremore responsive to contralat-
eral targets than ipsilateral targets. Contralateral tuning of these
regions during memory delay is consistent with the findings from
previous fMRI studies (Kagan et al., 2010; Wilke et al., 2012). Our
results are also consistent with the extensive evidence from elec-
trophysiological recordings in NHPs that show LIP is involved in
planning and executing saccadic movements (Quian Quiroga
et al., 2006; Snyder et al., 1997). Notably, the ERA waveforms
display significantly larger target-specific differences compared
to fMRI signals in a memory-delayed saccade task (i.e., 2%–5%
versus 0.1%–0.5%) (Kagan et al., 2010; Wilke et al., 2012) and
have much finer spatial resolution. This sensitivity was possible
despite the deepest subregions of interest extending 16 mm
below the probe surface. At this depth, signal attenuation is
approximately �7.2 dB (assuming uniform tissue using a 15-
MHz probe). Using a probe with a lower center frequency would
allow for increasing depths at the cost of spatiotemporal resolu-
tion. Use of microbubbles (Errico et al., 2016) or biomolecular
contrast agents (Maresca et al., 2020) may enhance hemody-
namic contrast, allowing for deeper imaging without sacrificing
resolution.
In addition to well-studied PPC subregions, we also identified
patches of activity in the MP located within medial parietal area
PG (PGm) (Pandya and Seltzer, 1982). These functional areas
were much smaller in size and magnitude than those nearer to
the ips. This may be one potential reason why MP activity was
not reported in previous fMRI studies. However, electrophysio-
logical studies have showed that stimulation of this area can elicit
goal-directed saccades, indicating its role for eye movements
(Thier and Andersen, 1998). The addition of the hemodynamic re-
sults presented here is the first hemodynamic evidence of MP
function. A limitation of this finding is that we did not observe
such activity in the second animal, likely because MP was not
in the imaging plane. Current efforts to develop 3D fUS imaging
(Rabut et al., 2019) will eliminate this limitation, allowing us to
identify new areas based on response properties.
Activity in PPC during reach planningWe also collected data during a memory-delayed reaching task.
ERA waveforms identified increases in CBV during the memory
phase for regions on the medial aspect of the ips. The PRR is
located on the medial bank of the ips and is characterized by
functional selectively to effector (i.e., the arm) (Christopoulos
et al., 2015). The responses we observed in this area were
effector specific; they did not appear in the saccadic data. How-
ever, they were not direction specific; increases in CBV activity
were present for left-cued and right-cued trials. This bilateral
reach response can be explained by the spatial scale of the
recording method. Whereas single-unit electrophysiology in
PRR reveals single neurons that are tuned to contralateral
hand movement planning, a significant portion of PRR neurons
are also tuned to ipsilateral movement planning (Quian Quiroga
et al., 2006). Within the limits of fUS resolution (~100 mm), each
voxel records the hemodynamic response to the summed activ-
ity of neurons within the voxel (~100 mm 3 100 mm 3 400 mm).
Therefore, our results, in the context of previous literature, pro-
vide evidence that (1) populations of ipsilaterally and contralater-
ally tuned neurons were roughly equivalent, and (2) these popu-
lations are mixed at subresolution scales (100 mm). We also
found activity on the lateral bank of ips that encoded target direc-
tion for an upcoming reach. That is, responses were more robust
to contralateral targets. Although this area is predominantly
involved in saccade movements, neurophysiological studies
have also reported neurons within the LIP that encode reaches
to peripheral targets (Colby and Duhamel, 1996; Snyder et al.,
1997). This area was located more ventral to saccade related
areas in the lateral bank of ips andmay bewithin the ventral intra-
parietal area (VIP). VIP is a bimodal visual and tactile area (Duha-
mel et al., 1998) that produces movements of the body when
electrically stimulated (Cooke et al., 2003; Thier and Andersen,
1996), consistent with a possible role in reaching movements.
Instructed versus free movementWe decoded activity as the monkeys performed instructed
movements rather than internally driven (‘‘free’’) movements. A
previous study using fMRI showed that free-choice movements
produced similar activation patterns in LIP; however, the differ-
ence in signal between left/right targets was smaller than that
for instructed movements (Wilke et al., 2012). Given the
llArticle
10 Neuron 109, 1–13, May 5, 2021
Please cite this article in press as: Norman et al., Single-trial decoding of movement intentions using functional ultrasound neuroimaging, Neuron(2021), https://doi.org/10.1016/j.neuron.2021.03.003

improvement in signal made possible with fUS, it may be
possible to decode movement direction from single trials of
free-choice movements, although accuracy may be impacted.
As free-choice movements are more conducive to BMI use,
this is an important direction for future research.
ConclusionsThe contributions presented here required significant advance-
ments in large-scale recording of hemodynamic activity with sin-
gle-trial sensitivity. Decoding capabilities are competitive with ex-
isting and mature techniques, establishing fUS as a technique for
neuroscientific investigation in task paradigms that require sin-
gle-trial analysis, real-time neurofeedback, or BMI. Although the
neurophysiology presented here is in NHPs, we expect that the
methods described will transfer well to human neuroimaging, sin-
gle-trial decoding, and eventually BMI. We first described the vi-
suomotor planning function of PPC using electrophysiology in
NHPs (Gnadt and Andersen, 1988; Snyder et al., 1997) and later
PPC electrophysiology-based BMI control (Aflalo et al., 2015; Sa-
kellaridi et al., 2019). Translation of these findings into human neu-
roimagingandBMI isan importantdirectionof futurestudy. Inaddi-
tion to its utility for neuroscientific investigation, brain-machine
interfacing isapromising technique to restoremovement topeople
livingwith neurological injury and disease. The advancements pre-
sented here are a critical first step in ushering in a new era of BMIs
that are less-invasive, high-resolution, and scalable. These tools
will empower researchers tomakeunique insights into the function
and malfunction of brain circuits, including neurological injury and
disease. Furthermore, future work advancing these findings could
make a large impact in neuroprosthetics by developing and
disseminating high-performance, minimally invasive BMIs.
STAR+METHODS
Detailed methods are provided in the online version of this paper
and include the following:
d KEY RESOURCES TABLE
d RESOURCE AVAILABILITY
B Lead contact
B Materials availability
B Data and code availability
d EXPERIMENTAL MODEL AND SUBJECT DETAILS
d METHOD DETAILS
B Animal preparation and implant
B Behavioral setup
B Behavioral tasks
B Functional ultrasound sequence and recording
B Power Doppler image processing
d QUANTIFICATION AND STATISTICAL ANALYSIS
B ERA waveforms and statistical parametric maps
B Single trial decoding
B Analysis of training set sample size
B Multicoder for intermingled effectors task
B Cross temporal decoding
B Decoding with reduced spatial resolution
B Decoding with different time windows
B Power Doppler quantiles
SUPPLEMENTAL INFORMATION
Supplemental information can be found online at https://doi.org/10.1016/j.
neuron.2021.03.003.
ACKNOWLEDGMENTS
We thank Kelsie Pejsa for assistance with animal care, surgeries, and training.
We thank Thomas Deffieux for his contributions to the ultrasound neuroimag-
ingmethods thatmade this work possible. We thank Igor Kagan for assisting in
implantation planning. We thank Charles Liu and Claire Rabut for helpful dis-
cussions. Finally, we thank Krissta Passanante for her illustrations. S.N. was
supported by a Della Martin Postdoctoral Fellowship. D.M. was supported
by a Human Frontiers Science Program Cross-Disciplinary Postdoctoral
Fellowship (award LT000637/2016). W.G. was supported by the UCLA-Cal-
tech MSTP (NIGMS T32 GM008042). This research was supported by the Na-
tional Institute of Health BRAIN Initiative (grant U01NS099724 to M.G.S.), the
T&C Chen Brain-machine Interface Center, and the Boswell Foundation
(R.A.A.). Related research in the Shapiro lab is supported by the HeritageMed-
ical Research Institute.
AUTHOR CONTRIBUTIONS
S.L.N., D.M., V.N.C., M.T., M.G.S., and R.A.A. conceived the study; D.M. and
C.D. established the imaging sequences; S.L.N., V.N.C., and W.G. trained the
animals; S.L.N., V.N.C., D.M., and W.G. acquired the data; S.L.N., D.M., and
V.N.C. performed the data processing; S.L.N., D.M., and V.N.C. drafted the
manuscript with substantial contribution from M.G.S. and R.A.A., and all au-
thors edited and approved the final version of the manuscript; M.T., M.G.S.,
and R.A.A. supervised the research.
DECLARATION OF INTERESTS
M.T. is a co-founder and shareholder of Iconeus Company, which commercial-
izes ultrasonic neuroimaging scanners. D.M. is now affiliated with T.U. Delft,
Netherlands. V.C. is now affiliated with University of California, Riverside.
Received: July 2, 2020
Revised: December 29, 2020
Accepted: March 1, 2021
Published: March 22, 2021
REFERENCES
Aflalo, T., Kellis, S., Klaes, C., Lee, B., Shi, Y., Pejsa, K., Shanfield, K., Hayes-
Jackson, S., Aisen, M., Heck, C., et al. (2015). Neurophysiology. Decodingmo-
tor imagery from the posterior parietal cortex of a tetraplegic human. Science
348, 906–910.
Ahn, M., and Jun, S.C. (2015). Performance variation in motor imagery brain-
computer interface: a brief review. J. Neurosci. Methods 243, 103–110.
Andersen, R.A., and Buneo, C.A. (2002). Intentional maps in posterior parietal
cortex. Annu. Rev. Neurosci. 25, 189–220.
Andersen, R.A., and Cui, H. (2009). Intention, action planning, and decision
making in parietal-frontal circuits. Neuron 63, 568–583.
Andersen, R.A., Essick, G.K., and Siegel, R.M. (1987). Neurons of area 7 acti-
vated by both visual stimuli and oculomotor behavior. Exp. Brain Res. 67,
316–322.
Andersen, R.A., Aflalo, T., and Kellis, S. (2019). From thought to action: The
brain-machine interface in posterior parietal cortex. Proc. Natl. Acad. Sci.
USA 116, 26274–26279.
Aron, A.R., Herz, D.M., Brown, P., Forstmann, B.U., and Zaghloul, K. (2016).
Frontosubthalamic circuits for control of action and cognition. J. Neurosci.
36, 11489–11495.
Baldauf, D., Cui, H., and Andersen, R.A. (2008). The posterior parietal cortex
encodes in parallel both goals for double-reach sequences. J. Neurosci. 28,
10081–10089.
llArticle
Neuron 109, 1–13, May 5, 2021 11
Please cite this article in press as: Norman et al., Single-trial decoding of movement intentions using functional ultrasound neuroimaging, Neuron(2021), https://doi.org/10.1016/j.neuron.2021.03.003
Bao, P., She, L., McGill, M., and Tsao, D.Y. (2020). A map of object space in
primate inferotemporal cortex. Nature 583, 103–108.
Barrese, J.C., Rao, N., Paroo, K., Triebwasser, C., Vargas-Irwin, C.,
Franquemont, L., and Donoghue, J.P. (2013). Failure mode analysis of sili-
con-based intracortical microelectrode arrays in non-human primates.
J. Neural Eng. 10, 066014.
Benabid, A.L., Costecalde, T., Eliseyev, A., Charvet, G., Verney, A., Karakas,
S., Foerster, M., Lambert, A., Moriniere, B., Abroug, N., et al. (2019). An
exoskeleton controlled by an epidural wireless brain-machine interface in a tet-
raplegic patient: a proof-of-concept demonstration. Lancet Neurol. 18,
1112–1122.
Bercoff, J., Montaldo, G., Loupas, T., Savery, D., Meziere, F., Fink, M., and
Tanter, M. (2011). Ultrafast compound Doppler imaging: providing full blood
flow characterization. IEEE Trans. Ultrason. Ferroelectr. Freq. Control 58,
134–147.
Bimbard, C., Demene, C., Girard, C., Radtke-Schuller, S., Shamma, S., Tanter,
M., andBoubenec, Y. (2018). Multi-scalemapping along the auditory hierarchy
using high-resolution functional UltraSound in the awake ferret. eLife 7,
e35028.
Blaize, K., Arcizet, F., Gesnik, M., Ahnine, H., Ferrari, U., Deffieux, T., Pouget,
P., Chavane, F., Fink, M., Sahel, J.-A., et al. (2020). Functional ultrasound im-
aging of deep visual cortex in awake nonhuman primates. Proc. Natl. Acad.
Sci. USA 117, 14453–14463.
Boido, D., Rungta, R.L., Osmanski, B.-F., Roche, M., Tsurugizawa, T., Le
Bihan, D., Ciobanu, L., and Charpak, S. (2019). Mesoscopic and microscopic
imaging of sensory responses in the same animal. Nat. Commun. 10, 1110.
Brunner, C., Grillet, M., Sans-Dublanc, A., Farrow, K., Lambert, T., Mace, E.,
Montaldo, G., and Urban, A. (2020). A Platform for Brain-wide Volumetric
Functional Ultrasound Imaging and Analysis of Circuit Dynamics in Awake
Mice. Neuron 108, 861–875.e7.
Calabrese, E., Badea, A., Coe, C.L., Lubach, G.R., Shi, Y., Styner, M.A., and
Johnson, G.A. (2015). A diffusion tensor MRI atlas of the postmortem rhesus
macaque brain. Neuroimage 117, 408–416.
Calton, J.L., Dickinson, A.R., and Snyder, L.H. (2002). Non-spatial, motor-spe-
cific activation in posterior parietal cortex. Nat. Neurosci. 5, 580–588.
Chang, S.W.C., and Snyder, L.H. (2012). The representations of reach end-
points in posterior parietal cortex depend on which hand does the reaching.
J. Neurophysiol. 107, 2352–2365.
Christopoulos, V.N., Bonaiuto, J., Kagan, I., and Andersen, R.A. (2015).
Inactivation of parietal reach region affects reaching but not saccade choices
in internally guided decisions. J. Neurosci. 35, 11719–11728.
Colby, C.L., and Duhamel, J.-R. (1996). Spatial representations for action in
parietal cortex. Brain Res. Cogn. Brain Res. 5, 105–115.
Colby, C.L., and Goldberg, M.E. (1999). Space and attention in parietal cortex.
Annu. Rev. Neurosci. 22, 319–349.
Collinger, J.L., Wodlinger, B., Downey, J.E., Wang, W., Tyler-Kabara, E.C.,
Weber, D.J., McMorland, A.J., Velliste, M., Boninger, M.L., and Schwartz,
A.B. (2013). High-performance neuroprosthetic control by an individual with
tetraplegia. Lancet 381, 557–564.
Cooke, D.F., Taylor, C.S., Moore, T., and Graziano, M.S. (2003). Complex
movements evoked by microstimulation of the ventral intraparietal area.
Proc. Natl. Acad. Sci. USA 100, 6163–6168.
Das, K., and Nenadic, Z. (2008). Approximate information discriminant anal-
ysis: A computationally simple heteroscedastic feature extraction technique.
Pattern Recognit. 41, 1548–1557.
Das, K., and Nenadic, Z. (2009). An efficient discriminant-based solution for
small sample size problem. Pattern Recognit. 42, 857–866.
Deffieux, T., Demene, C., Pernot, M., and Tanter, M. (2018). Functional ultra-
sound neuroimaging: a review of the preclinical and clinical state of the art.
Curr. Opin. Neurobiol. 50, 128–135.
Demene, C., Deffieux, T., Pernot, M., Osmanski, B.-F., Biran, V., Gennisson,
J.-L., Sieu, L.-A., Bergel, A., Franqui, S., Correas, J.-M., et al. (2015).
Spatiotemporal clutter filtering of ultrafast ultrasound data highly increases
Doppler and fUltrasound sensitivity. IEEE Trans. Med. Imaging 34, 2271–2285.
Demene, C., Tiran, E., Sieu, L.-A., Bergel, A., Gennisson, J.L., Pernot, M.,
Deffieux, T., Cohen, I., and Tanter, M. (2016). 4Dmicrovascular imaging based
on ultrafast Doppler tomography. Neuroimage 127, 472–483.
Demene, C., Baranger, J., Bernal, M., Delanoe, C., Auvin, S., Biran, V., Alison,
M., Mairesse, J., Harribaud, E., Pernot, M., et al. (2017). Functional ultrasound
imaging of brain activity in human newborns. Sci. Transl. Med. 9, eaah6756.
Dizeux, A., Gesnik, M., Ahnine, H., Blaize, K., Arcizet, F., Picaud, S., Sahel,
J.-A., Deffieux, T., Pouget, P., and Tanter, M. (2019). Functional ultrasound im-
aging of the brain reveals propagation of task-related brain activity in behaving
primates. Nat. Commun. 10, 1400.
Do, A.H., Wang, P.T., King, C.E., Abiri, A., and Nenadic, Z. (2011). Brain-com-
puter interface controlled functional electrical stimulation system for ankle
movement. J. Neuroeng. Rehabil. 8, 49.
Do, A.H., Wang, P.T., King, C.E., Chun, S.N., and Nenadic, Z. (2013). Brain-
computer interface controlled robotic gait orthosis. J. Neuroeng. Rehabil.
10, 111.
Duhamel, J.-R., Colby, C.L., and Goldberg, M.E. (1998). Ventral intraparietal
area of the macaque: congruent visual and somatic response properties.
J. Neurophysiol. 79, 126–136.
Errico, C., Osmanski, B.-F., Pezet, S., Couture, O., Lenkei, Z., and Tanter, M.
(2016). Transcranial functional ultrasound imaging of the brain using micro-
bubble-enhanced ultrasensitive Doppler. Neuroimage 124 (Pt A), 752–761.
Even-Chen, N., Stavisky, S.D., Kao, J.C., Ryu, S.I., and Shenoy, K.V. (2017).
Augmenting intracortical brain-machine interface with neurally driven error de-
tectors. J. Neural Eng. 14, 066007.
Gnadt, J.W., and Andersen, R.A. (1988). Memory related motor planning activ-
ity in posterior parietal cortex of macaque. Exp. Brain Res. 70, 216–220.
Graf, A.B., and Andersen, R.A. (2014). Brain-machine interface for eye move-
ments. Proc. Natl. Acad. Sci. USA 111, 17630–17635.
Hochberg, L.R., Serruya, M.D., Friehs, G.M., Mukand, J.A., Saleh, M., Caplan,
A.H., Branner, A., Chen, D., Penn, R.D., and Donoghue, J.P. (2006). Neuronal
ensemble control of prosthetic devices by a human with tetraplegia. Nature
442, 164–171.
Hochberg, L.R., Bacher, D., Jarosiewicz, B., Masse, N.Y., Simeral, J.D., Vogel,
J., Haddadin, S., Liu, J., Cash, S.S., van der Smagt, P., and Donoghue, J.P.
(2012). Reach and grasp by people with tetraplegia using a neurally controlled
robotic arm. Nature 485, 372–375.
Huang, D., Lin, P., Fei, D.-Y., Chen, X., and Bai, O. (2009). Decoding human
motor activity from EEG single trials for a discrete two-dimensional cursor con-
trol. J. Neural Eng. 6, 046005.
Imbault, M., Chauvet, D., Gennisson, J.-L., Capelle, L., and Tanter, M. (2017).
Intraoperative functional ultrasound imaging of human brain activity. Sci. Rep.
7, 7304.
Jin, X., and Costa, R.M. (2010). Start/stop signals emerge in nigrostriatal cir-
cuits during sequence learning. Nature 466, 457–462.
Kagan, I., Iyer, A., Lindner, A., and Andersen, R.A. (2010). Space representa-
tion for eye movements is more contralateral in monkeys than in humans.
Proc. Natl. Acad. Sci. USA 107, 7933–7938.
Kellis, S., Rieth, L., Baker, B., Bashford, L., Pejsa, K.W., Lee, B., Liu, C., and
Andersen, R.A. (2019). Quantitative scanning electron microscopy analysis
of intracortical microelectrode arrays after five years in human neocortex.
Program No. 670.09/M23. In 2019 Neuroscience Meeting Planner (Chicago,
IL: Society for Neuroscience).
King, C.E., Wang, P.T., McCrimmon, C.M., Chou, C.C., Do, A.H., and Nenadic,
Z. (2015). The feasibility of a brain-computer interface functional electrical
stimulation system for the restoration of overground walking after paraplegia.
J. Neuroeng. Rehabil. 12, 80.
Mace, E., Montaldo, G., Cohen, I., Baulac, M., Fink, M., and Tanter, M. (2011).
Functional ultrasound imaging of the brain. Nat. Methods 8, 662–664.
llArticle
12 Neuron 109, 1–13, May 5, 2021
Please cite this article in press as: Norman et al., Single-trial decoding of movement intentions using functional ultrasound neuroimaging, Neuron(2021), https://doi.org/10.1016/j.neuron.2021.03.003
Mace, E., Montaldo, G., Osmanski, B.-F., Cohen, I., Fink, M., and Tanter, M.
(2013). Functional ultrasound imaging of the brain: theory and basic principles.
IEEE Trans. Ultrason. Ferroelectr. Freq. Control 60, 492–506.
Maresca, D., Payen, T., Lee-Gosselin, A., Ling, B., Malounda, D., Demene, C.,
Tanter, M., and Shapiro, M.G. (2020). Acoustic biomolecules enhance hemo-
dynamic functional ultrasound imaging of neural activity. Neuroimage 209,
116467.
Montaldo, G., Tanter, M., Bercoff, J., Benech, N., and Fink, M. (2009).
Coherent plane-wave compounding for very high frame rate ultrasonography
and transient elastography. IEEE Trans. Ultrason. Ferroelectr. Freq. Control
56, 489–506.
Musallam, S., Corneil, B.D., Greger, B., Scherberger, H., and Andersen, R.A.
(2004). Cognitive control signals for neural prosthetics. Science 305, 258–262.
Norman, S.L., McFarland, D.J., Miner, A., Cramer, S.C., Wolbrecht, E.T.,
Wolpaw, J.R., and Reinkensmeyer, D.J. (2018). Controlling pre-movement
sensorimotor rhythm can improve finger extension after stroke. J. Neural
Eng. 15, 056026.
Nowlis, D.P., and Kamiya, J. (1970). The control of electroencephalographic
alpha rhythms through auditory feedback and the associated mental activity.
Psychophysiology 6, 476–484.
Osmanski, B.-F.,Martin, C., Montaldo, G., Laniece, P., Pain, F., Tanter, M., and
Gurden, H. (2014). Functional ultrasound imaging reveals different odor-
evoked patterns of vascular activity in the main olfactory bulb and the anterior
piriform cortex. Neuroimage 95, 176–184.
Pandya, D.N., and Seltzer, B. (1982). Intrinsic connections and architectonics
of posterior parietal cortex in the rhesus monkey. J. Comp. Neurol. 204,
196–210.
Peirce, J.W. (2009). Generating stimuli for neuroscience using PsychoPy.
Front. Neuroinform. 2, 10.
Pnevmatikakis, E.A., and Giovannucci, A. (2017). NoRMCorre: An online algo-
rithm for piecewise rigid motion correction of calcium imaging data.
J. Neurosci. Methods 291, 83–94.
Polikov, V.S., Tresco, P.A., and Reichert, W.M. (2005). Response of brain tis-
sue to chronically implanted neural electrodes. J. Neurosci. Methods
148, 1–18.
Quian Quiroga, R., Snyder, L.H., Batista, A.P., Cui, H., and Andersen, R.A.
(2006). Movement intention is better predicted than attention in the posterior
parietal cortex. J. Neurosci. 26, 3615–3620.
Rabut, C., Correia, M., Finel, V., Pezet, S., Pernot, M., Deffieux, T., and Tanter,
M. (2019). 4D functional ultrasound imaging of whole-brain activity in rodents.
Nat. Methods 16, 994–997.
Rabut, C., Yoo, S., Hurt, R.C., Jin, Z., Li, H., Guo, H., Ling, B., and Shapiro,
M.G. (2020). Ultrasound Technologies for Imaging and Modulating Neural
Activity. Neuron 108, 93–110.
Rau, R., Kruizinga, P., Mastik, F., Belau,M., de Jong, N., Bosch, J.G., Scheffer,
W., and Maret, G. (2018). 3D functional ultrasound imaging of pigeons.
Neuroimage 183, 469–477.
Rungta, R.L., Chaigneau, E., Osmanski, B.-F., and Charpak, S. (2018).
Vascular compartmentalization of functional hyperemia from the synapse to
the pia. Neuron 99, 362–375.e4.
Sakellaridi, S., Christopoulos, V.N., Aflalo, T., Pejsa, K.W., Rosario, E.R.,
Ouellette, D., Pouratian, N., and Andersen, R.A. (2019). Intrinsic Variable
Learning for Brain-Machine Interface Control by Human Anterior Intraparietal
Cortex. Neuron 102, 694–705.e3.
Sauvage, J., Flesch, M., Ferin, G., Nguyen-Dinh, A., Poree, J., Tanter, M.,
Pernot, M., and Deffieux, T. (2018). A large aperture row column addressed
probe for in vivo 4D ultrafast doppler ultrasound imaging. Phys. Med. Biol.
63, 215012.
Shanechi, M.M. (2019). Brain-machine interfaces from motor to mood. Nat.
Neurosci. 22, 1554–1564.
Shimoda, K., Nagasaka, Y., Chao, Z.C., and Fujii, N. (2012). Decoding contin-
uous three-dimensional hand trajectories from epidural electrocorticographic
signals in Japanese macaques. J. Neural Eng. 9, 036015.
Sieu, L.-A., Bergel, A., Tiran, E., Deffieux, T., Pernot, M., Gennisson, J.-L.,
Tanter, M., and Cohen, I. (2015). EEG and functional ultrasound imaging in mo-
bile rats. Nat. Methods 12, 831–834.
Snyder, L.H., Batista, A.P., and Andersen, R.A. (1997). Coding of intention in
the posterior parietal cortex. Nature 386, 167–170.
Snyder, L.H., Batista, A.P., and Andersen, R.A. (2000). Intention-related activ-
ity in the posterior parietal cortex: a review. Vision Res. 40, 1433–1441.
Soloukey, S., Vincent, A.J.P.E., Satoer, D.D., Mastik, F., Smits, M., Dirven,
C.M.F., Strydis, C., Bosch, J.G., van der Steen, A.F.W., De Zeeuw, C.I.,
et al. (2020). Functional Ultrasound (fUS) During Awake Brain Surgery: The
Clinical Potential of Intra-Operative Functional and Vascular Brain Mapping.
Front. Neurosci. 13, 1384.
Thier, P., and Andersen, R.A. (1996). Electrical microstimulation suggests two
different forms of representation of head-centered space in the intraparietal
sulcus of rhesus monkeys. Proc. Natl. Acad. Sci. USA 93, 4962–4967.
Thier, P., and Andersen, R.A. (1998). Electrical microstimulation distinguishes
distinct saccade-related areas in the posterior parietal cortex. J. Neurophysiol.
80, 1713–1735.
Urban, A., Dussaux, C., Martel, G., Brunner, C., Mace, E., and Montaldo, G.
(2015). Real-time imaging of brain activity in freely moving rats using functional
ultrasound. Nat. Methods 12, 873–878.
Wang, P.T., King, C.E., Chui, L.A., Do, A.H., andNenadic, Z. (2012). Self-paced
brain-computer interface control of ambulation in a virtual reality environment.
J. Neural Eng. 9, 056016.
Wang, P.T., Camacho, E., Wang, M., Li, Y., Shaw, S.J., Armacost, M., Gong,
H., Kramer, D., Lee, B., Andersen, R.A., et al. (2019). A benchtop system to
assess the feasibility of a fully independent and implantable brain-machine
interface. J. Neural Eng. 16, 066043.
Welle, C.G., Gao, Y.-R., Ye, M., Lozzi, A., Boretsky, A., Abliz, E., and Hammer,
D.X. (2020). Longitudinal neural and vascular structural dynamics produced by
chronic microelectrode implantation. Biomaterials 238, 119831.
Wilke, M., Kagan, I., and Andersen, R.A. (2012). Functional imaging reveals
rapid reorganization of cortical activity after parietal inactivation in monkeys.
Proc. Natl. Acad. Sci. USA 109, 8274–8279.
Wolpaw, J.R., andMcFarland, D.J. (2004). Control of a two-dimensionalmove-
ment signal by a noninvasive brain-computer interface in humans. Proc. Natl.
Acad. Sci. USA 101, 17849–17854.
Wolpaw, J.R., McFarland, D.J., Neat, G.W., and Forneris, C.A. (1991). An EEG-
based brain-computer interface for cursor control. Electroencephalogr. Clin.
Neurophysiol. 78, 252–259.
Woolley, A.J., Desai, H.A., and Otto, K.J. (2013). Chronic intracortical micro-
electrode arrays induce non-uniform, depth-related tissue responses.
J. Neural Eng. 10, 026007.
llArticle
Neuron 109, 1–13, May 5, 2021 13
Please cite this article in press as: Norman et al., Single-trial decoding of movement intentions using functional ultrasound neuroimaging, Neuron(2021), https://doi.org/10.1016/j.neuron.2021.03.003

STAR+METHODS
KEY RESOURCES TABLE
RESOURCE AVAILABILITY
Lead contactFurther information and requests for resources should be directed to and will be fulfilled by the Lead Contact, Richard A. Andersen
Materials availabilityThis study did not generate new unique materials.
Data and code availabilityData and analysis software to replicate the primary results will be shared upon request fromSumner Norman ([email protected]).
EXPERIMENTAL MODEL AND SUBJECT DETAILS
We implanted two healthy adult male rhesusmacaques (Macacamulatta) weighing 10–13 kg. All surgical and animal care procedures
were done in accordance with the National Institutes of Health Guide for the Care and Use of Laboratory Animals and were approved
by the California Institute of Technology Institutional Animal Care and Use Committee.
METHOD DETAILS
Animal preparation and implantWe implanted two animals with polyether ether ketone head caps anchored to the skull with titanium screws. We then placed a
custom polyether ketone (Monkey H) or stainless-steel (Monkey L) head holder on the midline anterior aspect of the cap. Finally,
we placed a unilateral square chamber of 2.4 cm inner diameter, made of polyetherimide (Monkey H) or nylon (Monkey L) over a crani-
otomy above the left intraparietal sulcus. The dura underneath the craniotomywas left intact. To guide the placement of the chamber,
we acquired high-resolution (700 mm) anatomical MRI images before the surgery using a Siemens 3T MR scanner, with fiducial
markers to register the animals’ brains to stereotaxic coordinates.
Behavioral setupDuring each recording session, themonkeyswere placed in a dark anechoic room. They sat in a customdesigned primate chair, head
fixed, facing an LCDmonitor ~30 cm away. Visual stimuli were presented using custom Python software based on PsychoPy (Peirce,
2009). Eye position was monitored at 60 Hz using a miniature infrared camera (Resonance Technology, Northridge, CA, USA) and
ViewPoint pupil-tracking software (Arrington Research, Scottsdale, AZ, USA). Reaches were performed using a 2-dimensional
joystick (Measurement Systems). Both eye and cursor positions were recorded simultaneously with the stimulus and timing informa-
tion and stored for offline access. Data analysis was performed in MATLAB 2020a (MathWorks, Natick, MA, USA) using standard
desktop computers.
Behavioral tasksThe animals performed memory-guided eye movements to peripheral targets (Figure 2A). Each trial started with a fixation cue (red
diamond; 1.5 cm side length) presented in the center of screen (fixation period). The animal fixated for 5.35-6.33 s depending on
REAGENT or RESOURCE SOURCE IDENTIFIER
Software and algorithms
MATLAB 2020a Mathworks RRID:SCR_001622
Python Programming Language v2.7 Python Software Foundation RRID:SCR_008394
PsychoPy v3.1.5 https://github.com/psychopy/psychopy RRID:SCR_006571
Other
Vantage 128 Research Ultrasound System Verasonics N/A
DOMINO linear array probe Vermon H.S.#901812000
llArticle
e1 Neuron 109, 1–13.e1–e4, May 5, 2021
Please cite this article in press as: Norman et al., Single-trial decoding of movement intentions using functional ultrasound neuroimaging, Neuron(2021), https://doi.org/10.1016/j.neuron.2021.03.003

training (mean 5.74 s across sessions). Then, a single cue (red diamond; 1.5 cm side length) appeared either on the left or the right
hemifield for 200 ms, indicating the location of the target. Both targets were located equidistantly from the central fixation cue (23�
eccentricity). After the cue offset, the animals were required to remember the location of the targets while maintaining eye fixation
(memory period). This period was chosen to be sufficiently long to capture hemodynamic transients. Thememory period was consis-
tent within each session but varied across sessions from 4.02-5.08 s (mean 4.43 s across session) depending on the animal’s level of
training. Once the central fixation cue disappeared (i.e., go signal) the animals performed a direct eye movement (saccade) within
500 ms to the remembered location of the target. If the eye position arrived within a radius of 5� of the targets, it was re-illuminated
and stayed on for the duration of the hold period (1 s). If the animal broke eye fixation before the go signal (i.e., shifted their gaze
outsize of a window of 7.5 cm, corresponding to 14� of visual angle) the trial was aborted. Successful trials were followed by a liquid
reward. The fixation and memory periods were subject to 400 ms of jitter sampled from a uniform distribution to preclude the animal
from anticipating the change(s) of the trial phase.
Both animals also performed memory-guided reach movements to peripheral targets using a 2-dimensional joystick positioned in
front of the chair with the handle at knee level. Each trial started with two fixation cues presented at the center of the screen. The
animal fixated his eyes on the red diamond cue (1.5 cm side length) and acquired the green cue by moving a square cursor
(0.3 cm side length) controlled by his right hand on the joystick (fixation period). The animal fixated for 2.53-5.85 s depending on
training (mean 3.94 s across sessions). Then, a single green target (1.5 cm side length) was presented either on the left or the right
visual field for a short period of time (300ms). After the cue offset, the animal was required to remember the location of the targets for
a memory period while maintaining eye and hand fixation. The memory period was consistent within each session but varied across
sessions from 3.23-5.20 (mean 4.25 s across session). Once the central green cue disappeared, the animal performed a direct reach
to the remembered target location within 500 ms, without breaking eye fixation. If they moved the cursor to the correct goal location,
the target was re-illuminated and stayed on for duration of the hold period (1 s). Targets were placed at the same locations as in
saccade trials. If the cursor moved out of the target location, the target was extinguished, and the trial was aborted. Any trial in which
the animal broke eye fixation or initiated a reaching movement before the go signal or failed to arrive at the target location was
aborted. Successful trials were followed with the same liquid reward as in saccade trials. The fixation andmemory periods were sub-
ject to 400 ms of jitter sampled from a uniform distribution to preclude the animal from anticipating the change(s) of the trial phase.
We also trained both animals on a task that intermingled memory delayed saccades and reaches (Figure 5A). Similar to the reach
task, each trial started with two fixation cues presented at the center of the screen: one for his eyes and one for his right hand. The
target sizes were maintained from the reach task. The key difference was that the color of the gaze fixation diamond was randomized
as blue or red: blue to cue saccades and red to cue reaches. After a 4.3 s memory period, a single white target (1.5 cm side length)
was presented either on the left or right visual field for a short period of time (300 ms). After the cue offset, the animal was required to
remember the location of the targets for the duration of the memory period. The memory period across all sessions for both monkeys
was 4.0 s. Once the central green cue disappeared, the animal performed a saccade or reach via joystick to the remembered target
location within 500 ms, without breaking fixation of the non-cued effector. If they moved the cursor to the correct goal location, the
target was re-illuminated and stayed on for the duration of the hold period (1 s). If the cued effector moved out of the target location,
the target was extinguished, and the trial was aborted. Any trial in which the animal broke fixation of the non-cued effector or initiated
a movement of the cued effector before the go signal or failed to arrive at the target location was aborted. Successful trials were fol-
lowed with the same liquid reward as in saccade and reach trials. The fixation and memory periods were subject to 400 ms of jitter
sampled from a uniform distribution to preclude the animal from anticipating the change(s) of the trial phase.
Functional ultrasound sequence and recordingDuring each recording session, we placed the ultrasound probe (128 elements linear array probe, 15.6MHz center frequency, 0.1mm
pitch, Vermon, France) in the chamberwith acoustic coupling gel. This enabled us to acquire images from the posterior parietal cortex
(PPC) with an aperture of 12.8 mm and depths up to 23 mm (results presented here show up to 16 mm depth). This large field of view
allowed us to image several PPC regions simultaneously. These superficial and deep cortical regions included, but were not limited
to, area 5d, lateral intraparietal (LIP) area, medial intraparietal (MIP) area, medial parietal area (MP), and ventral intraparietal (VIP) area.
We used a programmable high-framerate ultrasound scanner (Vantage 128 by Verasonics, Kirkland, WA) to drive a 128-element 15
MHz probe and collect the pulse echo radiofrequency data. We used a plane-wave imaging sequence at a pulse repetition frequency
of 7500Hz.We transmitted plane waves at tilted angles of�6 to 6� in 3� increments.We then compounded data originating from each
angle to obtain one high-contrast B-mode ultrasound image (Mace et al., 2013). Each high-contrast B-mode image was formed in
2 ms, i.e., at a 500 Hz framerate.
Regional changes in cerebral flood volume induced by neurovascular coupling can be captured by ultrafast power Doppler ultra-
sound imaging (Mace et al., 2011). We implemented an ultrafast power Doppler sequence using a spatiotemporal clutter-filter to
separate blood echoes from tissue backscattering. We formed Power Doppler images of the NHP brain using 250 compounded
B-mode images collected over 0.5 s. Image formation and data storage were performed after the pulse sequence and took ~0.5
s. Thus, the pulse sequence and image formation/save resulted in power Doppler functional mapping of the NHP brain at a 1 Hz
refresh rate.
Anatomical PPC regions were spatially located by their stereotaxic positions from the pre-surgical MRI. Response of these
functional areas was confirmed by mapping activated voxels obtained during the experimental phase of this work. If necessary,
llArticle
Neuron 109, 1–13.e1–e4, May 5, 2021 e2
Please cite this article in press as: Norman et al., Single-trial decoding of movement intentions using functional ultrasound neuroimaging, Neuron(2021), https://doi.org/10.1016/j.neuron.2021.03.003

the imaging plane was adjusted to record the most responsive area. Each acquisition consisted of 900-3600 blocks of 250 frames
where each block represented 1 s of data (equivalent to 15-60 minutes runtime). Finally, we stored the in-phase and quadrature
sampled data to high-speed solid-state drive memory for offline processing.
Power Doppler image processingWe used singular value decomposition to discriminate red blood cell motion from tissue motion and extracted the Doppler signal in
each ensemble of 250 coherently compounded frames (Demene et al., 2015; Montaldo et al., 2009). The resulting images were then
stored in a 3D array of 2D images in time series. In some experiments, we observed motion of the entire imaging frame. These shifts
were indicative of a change in the position of the probe/tissue interface due to uncommonly forceful movements of the animal. We
corrected for these events using rigid-body image registration based on the open source NoRMCorre package (Pnevmatikakis and
Giovannucci, 2017), using an empirical template created from the first 20 frames from the same session. We also tested nonrigid
image registration but found little improvement, confirming that motion observed was due to small movements between the
probe/dura interface rather than changes in temperature or brain morphology.
QUANTIFICATION AND STATISTICAL ANALYSIS
All analyses were performed using MATLAB 2020a.
ERA waveforms and statistical parametric mapsWedisplay event-related average (ERA) waveforms (Figures 2C–2F, 2H, 2I, 3C, 3D, 3F, and 3G) of power Doppler change as percent-
age change frombaseline. The baseline consists of the three seconds preceding the first Doppler image obtained after the directional
cue was given on any given trial. ERA waveforms are represented as a solid line with surrounding shaded areas representing the
mean and standard deviation. We generated activation maps (Figures 2B, 2G, 3B, and 3E) by performing a one-sided t test for
each voxel individually with false discovery rate (FDR) correction based on the number of voxels tested. In this test, we compared
the area under the curve of the change in power Doppler during the memory phase of the event-related response. The movement
direction represented the two conditions to be compared, and each trial represented one sample for each condition. We chose a
one-sided test because our hypothesis was that contralateral movement planning would elicit greater hemodynamic responses in
LIP compared to ipsilateral planning (based on canonical LIP function). This has the added benefit of being easily interpretable: areas
of activation represent contralateral tuning. Voxels with values of p < 0.01 are displayed as a heatmap overlaid on a background
vascular map for anatomical reference.
Single trial decodingDecoding single trial movement intention involved three parts: 1) aligningCBV image time serieswith behavioral labels, 2) feature selec-
tion, dimensionality reduction and class discrimination, and 3) cross validation andperformance evaluation (Figure 4A). First, we divided
the imaging dataset into event aligned responses for each trial, i.e., 2DPowerDoppler images through time for each trial.We then sepa-
rated trials into a training set and testing set according to a 10-fold cross validation scheme. The training setwas attached to class labels
that represented thebehavioral variablebeingdecoded. For example,movementdirectionwouldbe labeled left or right. The test setwas
stripped of such labels. Features were selected in the training set by ranking each voxel’s q-value comparing the memory phase re-
sponses to target direction in the training data. Direction-tuned voxels (FDR corrected for number of pixels in image, q < 0.05) of up
to10%of the total imagewerekeptas features.Wealso testedselecting featuresbydrawing regionsof interest around relevant anatom-
ical structures e.g., LIP. Although thismethod can outperform q-maps, it is more laborious and depends on user skill, so we do not pre-
sent its results here. For the intermingled effector task, we used all features (i.e., the whole image) because it did not require combining
multiple t-maps. For dimensionality reduction and class separation, we used classwise principal component analysis (CPCA) and linear
discriminant analysis (LDA) (Das andNenadic, 2009), respectively. This decodingmethod has been implemented with success inmany
real-timeBMIs (Do et al., 2013, 2011; King et al., 2015;Wang et al., 2019, 2012), and is especially useful in applicationswith high dimen-
sionality.CPCAcomputes theprincipal components (PCs) in a piecewisemanner individually for trainingdataof each class.We retained
principal components to account for > 95%of variance.We improved class separability by running linear discriminant analysis (LDA) on
theCPCA-transformeddata.Mathematically the transformed feature for each trial canbe representedby f =TLDAFCPCAðdÞ,whered˛R1
are the flattened imaging data for a single trial,FCPCA is the piecewise linear CPCA transformation, and TLDA is the LDA transformation.
FCPCA is physically related to space and time and thus can be viewed within the context of physiological meaning (Figure 4E). We sub-
sequently used Bayes rule to calculate the posterior probabilities of each class given the observed feature space. Because CPCA is a
piecewise function, this is done twice, once for each class, resulting in four posterior likelihoods: PLðLjf�Þ; PLðRjf�Þ; PRðLjf�Þ; PRðRjf�Þ,where f� represents the observation, PL and PR represent the posterior probabilities in the CPCA subspaces created with training data
from left-directed and right-directed trials, respectively. Finally, we store the optimal PC vectors and corresponding discriminant hyper-
plane from the subspacewith the highest posterior probability.We then used these findings to predict the behavioral variable of interest
for each trial in the testingset. That is,wecompute f� from fUS imagingdata for each trial in the testing set topredict theupcomingmove-
ment direction. Finally, we rotate the training and testing sets according to k-fold validation, storing the BMI performance metrics for
each iteration. We report the mean decoding accuracy as a percentage of correctly predicted trials (Figure 4B). In measures across
llArticle
e3 Neuron 109, 1–13.e1–e4, May 5, 2021
Please cite this article in press as: Norman et al., Single-trial decoding of movement intentions using functional ultrasound neuroimaging, Neuron(2021), https://doi.org/10.1016/j.neuron.2021.03.003

multiple sessionswhere an independent variable is being tested (e.g., number of trials in training set), we use a normalized accuracy that
is linearly scaled to [0, 1] where 0 is chance level (50%) and 1 is themaximum accuracy across the set of values used in the independent
variable (e.g., Figure 4C). This was necessary to regularize raw accuracy values across multiple sessions and animals.
Analysis of training set sample sizeAs BMI models increase in complexity, their need for data also increases. To demonstrate the robustness of our piecewise linear
decoding scheme to limited data, we systematically reduced the amount of data used in the training set (Figure 4C). We used N-i
trials in the training set and i trials in the testing set in a cross-validated manner, rotating the training/testing set i times for i = 1,
2,. N-10. We stop at N-10 because accuracy was diminished to chance level and when less than 10 trials are used in the training
set, it becomes increasingly likely that there will be an under- or non-represented class, i.e., few or no trials to one of the movement
directions. We report the mean normalized accuracy standard error of the means (SEM) across both animals and all recording ses-
sions as a function of the number of trials in the training set (N-i) (Figure 4C).
Multicoder for intermingled effectors taskFor the intermingled effectors task (Figure 5), we used the same decoding scheme described above to decode effector and direction.
However, instead of using data from the period defined by the experiment, we used a decision tree to define the task period. That is,
we first predicted the memory period from the non-memory periods (i.e., task epoch versus no-task epoch). To do this, we labeled
each frame of fUS in the training set with a label for task or no-task. We then decoded each frame in the testing set using the same
decoding scheme described above. The primary difference of note here is that we used individual frames of data rather than cumu-
lative frames from within a known task period. We then refined these predictions by assuming that any time the classifier predicted
the animal had entered a task state, they would be in that task state for three seconds. This allowed us to use three seconds’ worth of
data to train and decode the effector and direction variables. Note that while the task/no-task classifier makes a prediction every 1 s,
the effector and direction make a prediction for each trial defined by the task/no-task classifier.
Cross temporal decodingWe also performed an analysis to determine the nature of hemodynamic encoding in PPC using a cross-temporal decoding tech-
nique. In this analysis, we used all temporal combinations of training and testing data, using a one second sliding window. We
used 1 s of data from all trials to train the decoder and then attempted to decode from each of the 1 s windows of testing data
throughout the trial. We then updated the trainingwindow and repeated the process. This analysis results in an n x n array of accuracy
values where n is the number of time windows in the trial. We report the 10-fold cross-validated accuracies as a percentage of
correctly predicted trials (Figure 4D). To assess the statistical significance of these results, we used a Bonferroni corrected binomial
test versus chance level (0.5) where the number of comparisons was n2. We overlaid a contour at p = 0.05 to indicate the temporal
boundaries of significant decoding accuracies.
Decoding with reduced spatial resolutionPart of the motivation for using fUS is its spatial resolution. To test the effects of increased resolution, we synthetically reduced the
resolution of the in-plane imaging data using a Gaussian filter. We performed this analysis at all combinations of x and z direction
(width and depth, respectively) starting at true resolution (i.e., 100 mm) up to a worst-case of 5 mm resolution. We report the 10-
fold cross-validated accuracy values as a function of these decreasing resolutions as a 2D heatmap and as 1D curves of mean ac-
curacy in both the x and z directions with shaded areas representing s.e.m. (Figure 6A). A limitation of this approach is that we cannot
downsample the out-of-plane dimension. Thus, the reported accuracy values are likely higher than those attainable by a technique
with isotropic voxel size, e.g., fMRI.
Decoding with different time windowsTo analyze the effect of cumulative versus fixed length decoders, we used different sliding windows of data (1 s, 2 s, 3 s) to decode
upcoming movement direction (left or right) using data from the memory delay period. We report these results using accuracy as a
function of trial time and the maximum accuracy achieved during the memory period for each session (Figure 6B). Accuracies are
represented at each time point through the fixation andmemory periods using data aligned to the end of the time bin used for decod-
ing. For example, an accuracy at t = 3 s for a decoder using 3 s of data represents a result trained on data from t = 0-3 s. To assess
significance between different conditions, we used a student’s two-tailed t test.
Power Doppler quantilesWe also investigated the source of hemodynamic information content by segmenting the images according to their mean power
Doppler signal as a proxy for mean cerebral blood flow within a given area. Specifically, we segmented the image into deciles by
mean power Doppler signal within a session, where higher deciles represented higher power and thus higher mean blood flow (Fig-
ure 6C). Deciles were delineated by the number of voxels, i.e., the number of voxels was the same within each segment and did not
overlap. Using only the voxels within each decile segment, we computed the mean accuracy for each recording session. We report
the mean normalized accuracy across all recording sessions (Figure 4C) where shaded error bars represent SEM.
llArticle
Neuron 109, 1–13.e1–e4, May 5, 2021 e4
Please cite this article in press as: Norman et al., Single-trial decoding of movement intentions using functional ultrasound neuroimaging, Neuron(2021), https://doi.org/10.1016/j.neuron.2021.03.003