Single-Stage Vacuum Pressure Swing Adsorption for ... · assembled a lab PSA unit with two columns...
33
1 This article was published in Industrial and Engineering Chemistry Research, 54(39), 9591-9604, 2015 http://dx.doi.org/10.1021/acs.iecr.5b02151 Single-Stage Vacuum Pressure Swing Adsorption for Producing High- Purity Oxygen from Air Daniel Ferreira, † Patrick Baŕcia, ‡ Roger D. Whitley, § and Adeĺio Mendes* ,† † LEPABE-Laboratory for Process Engineering, Environmental, Biotechnology and Energy, Faculdade de Engenharia, Universidade do Porto, Rua Dr. Roberto Frias, 4200-465 Porto, Portugal ‡ Sysadvance, SA., Rua Eng° Frederico Ulrich 2824, 4470-605 Moreira da Maia, Portugal § Air Products & Chemicals, Inc., 7201 Hamilton Boulevard, Allentown, Pennsylvania 18195, United States Abstract The maximum oxygen concentration obtained using a conventional single-stage pressure swing adsorption unit is ca. 95% balanced mostly with argon. However, there are several applications requiring simple and compact units for producing high-purity oxygen (≥99%), such as medical, military, or aerospace. This article studies a single-stage vacuum pressure swing adsorption (VPSA) unit, loaded with silver-based zeolite AgLiLSX, for producing ca. 1 L STP ·min −1 of high-purity oxygen. The unit was designed on the basis of the experimental and simulation results obtained with a lab-scale unit. For a product concentration of 99.0%, the recovery obtained was ca. 8.0% with a productivity of 9.0 m 3 ·h −1 ·ton −1 . INTRODUCTION Since its invention, vacuum pressure swing adsorption (VPSA) technology for oxygen production from air has significantly evolved toward more energy efficient and compact units, using improved adsorption cycles, better adsorbents and new valve technologies. 1−3 However, the oxygen product concentration is limited to ca. 95%, 4,5 since the equilibrium adsorbents used are not selective toward argon, which is present in the atmospheric air at ca. 0.93%. 6,7 To overcome this limitation, dual-stage PSA units were developed when a high-purity product (≥99.0%) is required. 8−10 This process, initially disclosed by Armond et al. in 1980, consists of combining in series two PSA units: the first packed with a carbon molecular sieve for kinetically removing argon (kinetic-stage), and the other packed with zeolite to remove the nitrogen (equilibrium-stage). 11 However, dual-stage PSA processes are complex, energy consuming, and often unattractive. In addition, there are several applications that require simple, low energy consuming and compact units, such as military aircrafts, submarines, or field hospitals. 8,12 Thus, the production of high-purity oxygen by single-stage PSA/VPSA
Transcript of Single-Stage Vacuum Pressure Swing Adsorption for ... · assembled a lab PSA unit with two columns...

1
This article was published in Industrial and Engineering Chemistry Research, 54(39), 9591-9604,
2015
http://dx.doi.org/10.1021/acs.iecr.5b02151
Single-Stage Vacuum Pressure Swing Adsorption for Producing High-
Purity Oxygen from Air
Daniel Ferreira,†
Patrick Barcia,‡
Roger D. Whitley,§
and Adel io Mendes*,†
†LEPABE-Laboratory for Process Engineering, Environmental, Biotechnology and Energy,
Faculdade de Engenharia, Universidade do Porto, Rua Dr. Roberto Frias, 4200-465 Porto,
Portugal
‡Sysadvance, SA., Rua Eng° Frederico Ulrich 2824, 4470-605 Moreira da Maia, Portugal
§Air Products & Chemicals, Inc., 7201 Hamilton Boulevard, Allentown, Pennsylvania 18195,
United States
Abstract
The maximum oxygen concentration obtained using a conventional single-stage pressure swing
adsorption unit is ca. 95% balanced mostly with argon. However, there are several applications
requiring simple and compact units for producing high-purity oxygen (≥99%), such as medical,
military, or aerospace. This article studies a single-stage vacuum pressure swing adsorption (VPSA)
unit, loaded with silver-based zeolite AgLiLSX, for producing ca. 1 LSTP·min−1 of high-purity
oxygen. The unit was designed on the basis of the experimental and simulation results obtained with
a lab-scale unit. For a product concentration of 99.0%, the recovery obtained was ca. 8.0% with a
productivity of 9.0 m3·h−1·ton−1.
INTRODUCTION
Since its invention, vacuum pressure swing adsorption (VPSA) technology for oxygen production
from air has significantly evolved toward more energy efficient and compact units, using improved
adsorption cycles, better adsorbents and new valve technologies.1−3 However, the oxygen product
concentration is limited to ca. 95%,4,5 since the equilibrium adsorbents used are not selective toward
argon, which is present in the atmospheric air at ca. 0.93%.6,7 To overcome this limitation, dual-stage
PSA units were developed when a high-purity product (≥99.0%) is required.8−10 This process,
initially disclosed by Armond et al. in 1980, consists of combining in series two PSA units: the first
packed with a carbon molecular sieve for kinetically removing argon (kinetic-stage), and the other
packed with zeolite to remove the nitrogen (equilibrium-stage).11 However, dual-stage PSA processes
are complex, energy consuming, and often unattractive. In addition, there are several applications
that require simple, low energy consuming and compact units, such as military aircrafts, submarines,
or field hospitals.8,12 Thus, the production of high-purity oxygen by single-stage PSA/VPSA

2
remained a goal.
More recently, a few new adsorbents, particularly silver- exchanged molecular sieves,13−16 were
developed with the ability to selectively adsorb both argon and nitrogen from the air feed. The
first silver-exchanged mordenite showing adsorption equilibrium selectivity to argon over oxygen
was reported by Wilkerson17 in 1990. A decade later, in 2002, Air Products and Chemicals, Inc.
patented a AgLiLSX (silver lithium low silica-X-type) zeolite, showing argon/oxygen equilibrium
selectivity and a high nitrogen adsorption capacity.18 In 2005, Sebastian and Jasra prepared several
silver-exchanged zeolites to assess their argon/oxygen adsorption capacity. These authors concluded
that AgA zeolite exhibited very high N2/O2 and Ar/O2 adsorption selectivities compatible with the
use in a single-stage PSA/VPSA for producing high-purity oxygen.19 Later, Anson et al.20 and Shi et
al.21 studied a composite adsorbent of Ag-ETS-10 crystals and Ludox HS-40 colloidal silica, weigh
ratio of 12:5, and obtained an adsorbent that has high capacity and adsorption selectivity, including
an argon/oxygen selectivity of 1.28 at 1 bar and 30 °C.
Despite the developments in argon/oxygen selective adsorbents, very few studies were conducted
using PSA or VPSA units with columns packed with them. In 1993, Knaebel and Kandybin disclosed
an equilibrium-based single-column PSA, using Ag-mordenite, and obtained a production stream
with 99.5+% of oxygen, with a recovery of 6.6%, from a feed of 95% of oxygen balanced with argon.22
In 2003, Air Products and Chemicals, Inc., disclosed a four-step VPSA unit that, according to
simulations, could produce a stream of 99.0% of oxygen from air, using their developed AgLiLSX
zeolite adsorbent.23 The unit operates between 1.4 and 0.34 bar at 38 °C and shows a recovery of
11%. In 2007, Santos et al.8 assembled a lab PSA unit with two columns packed with the AgLiLSX
zeolite from Air Products. The unit, operating between 1 and 3 bar, produced a stream of 98.7% of
oxygen from air with a recovery of 5.6%. No reports of single stage PSA/VPSA units producing 99%
of oxygen from air were found; the very few existing patents and reports refer only to process
simulations.8,21,23
In a previous work, the authors conducted a study characterizing the AgLiLSX zeolite adsorbent
by Air Products with respect to its ability for high-purity oxygen production in a single-stage
PSA/VPSA.13 The study comprises the experimental determination of adsorption isotherms and
breakthroughs; performance parameters obtained, such as nitrogen/oxygen selectivity, αN2/O2 =
4.98 at 1 bar and 25 °C, nitrogen working capacity of 0.45 mol·kg−1 between 1.4 and 0.2 bar at 25
°C, and argon/oxygen selectivity αAr/O2 ≥ 1.14 at low pressure range (below 1.5 bar), show an
adsorbent with great potential for producing a high concentration oxygen stream from air when used
in a VPSA unit.13 The authors also referred the extreme importance of protecting the AgLiLSX zeolite
from contaminants such as carbon dioxide or moisture during its use in pressure swing
operation.24,25
This work studies a high-purity oxygen single-stage VPSA unit, with columns packed with AgLiLSX
zeolite by Air Products, to produce 1 LSTP·min−1 of high-purity oxygen (≥99%) from air.
VPSA Units. The main goal of this work was the development of a stand-alone and
compact single-stage VPSA unit for the production of 1 LSTP·min−1 of high-purity oxygen. Such a
unit should be able to produce ≥99% of oxygen from atmospheric air within a limited volume (0.7 ×
0.5 × 0.85 m3,

3
≤ 0.3 m3), be lightweight (≤120 kg) and have low energy consumption (≤1.1 kW). The AgLiLSX
zeolite, used to selectively remove nitrogen and argon, is very sensitive to water vapor and carbon
dioxide, deactivating quickly when exposed to atmospheric air. A stand-alone unit should then
include a pretreatment section for removing water vapor and carbon dioxide down to −40 °C of the
dew point and to 5 ppm (at 1.4 bar), respectively, thus protecting the AgLiLSX adsorbent.24 Two
VPSA units were assembled and studied.
The design of the above-mentioned stand-alone unit was based on studies conducted in a lab unit
fed with air (78% N2, 21% O2, and 1% Ar) previously dried (down to −60 °C of dew point) and
carbon dioxide removed (down to ca. 5 ppm). A schematic representation of the lab VPSA unit is
presented in Figure 1. The adsorption columns were packed with the AgLiLSX zeolite from Air
Products and Chemicals, Inc.; the adsorbent was previously characterized concerning adsorption
equilibrium and kinetics, see Figure 2 and Table 1.13 The characteristics of the designed adsorption
beds are listed in Table 2. Sampling points (S1 to S5) placed along the beds were used to obtain the
concentration profile and history of the column; a mass spectrometer (Pfeiffer, Omnistar) analyzer
was used for this purpose. The feed flow rate was measured by a mass flow meter (Bronkhorst High-
tech, El Flow F-113C, 0− 100 dm3·min−1). The purge flow rate was measured using a mass flow
meter (Bronkhorst High-tech, El Flow F-111C, 0−2 dm3·min−1) and the product flow rate was
controlled using a mass flow controller (Bronkhorst High-tech, El-Flow F-201C, 0−2 dm3·min−1).
The feed, purge, and product flow rates were regulated using needle valves. Several pressure
transducers (Druck, PMP 4010, 0−7 bar), located along the unit, were used to measure the pressure
history inside adsorption beds and at product stream. A set of solenoid and check valves were used to
direct the flow according to the adsorption cycle. A vacuum pump (Vacuubrand, model ME 8 NT,
70 mbar) was used during regeneration steps to accomplish required vacuum. The unit includes a
storage column that allows to store part of the product and to use it in the backfill step. The product
stream concentration was measured using an oxygen analyzer (Servomex, model 5200, from 0 to
100%, with an accuracy of 0.05% FS) and a mass spectrometer.
The schematic representation of the developed stand-alone VPSA prototype is presented in Figure
3. This unit comprises two precolumns, for pretreating the feed air, packed with a highly moisture
tolerant silica, KC-Trockenperlen WS 2050 from BASF, followed by a special NaX type zeolite, ZEOX
OII from Zeochem, in a ratio of 1:4.24 The main columns, used to selectively remove nitrogen and
argon, were packed with AgLiLSX zeolite. The characteristics of adsorbents and adsorption beds
are listed in Table 2; the adsorption isotherm parameters are presented in Table 1. Sampling points
(S1 to S7) were used to obtain the concentration profile and history of the column; a mass spectrometer
analyzer was used for this purpose. The prototype unit was fed with atmospheric air (composition
of ca. 78% N2, 21% O2, and 1% Ar). An air compressor (GAST, model 75R645-P101-H302CX, 7.2
m3·h−1 at 1.4 bar, 0.25 kW) was used to feed the unit and the feed flow rate was measured using a
volumetric flow meter (SMC, PF2A521-F03-1, 1.2−12 m3·h−1). The purge and product flow rates,
both regulated using needle valves, were measured using also volumetric flow meters (SMC, PFM725-
F01-E, 0.03−1.5 m3·h−1). Several pressure transducers (SMC, ISE10-01-E, 0−11 bar) were used to
measure the pressure history inside the system during operation. A set of coaxial valves and one check
valve was used to direct the flow according to the adsorption cycle. A vacuum pump (Elmo Rietschle,
model VTL-10, 11.7 m3·h−1 at 150 mbar, 0.37 kW) was used during regeneration steps to attain the

4
required vacuum pressures. The unit includes two precolumns, two main columns, and two storage
columns. The first storage column, B-Col, was packed with a LiLSX-type zeolite, Z12-07, from
Zeochem, to increase the storage capacity of it. The product stream concentration was measured using
an oxygen analyzer and a mass spectrometer.
Adsorption Cycle. The VPSA runs a seven-step cycle as shown in Table 3. During pressurization
(PR), the bed is pressurized cocurrently with feed up to the high operating pressure. Following, during
adsorption (AD) high-pressure feed flows through the main bed and nitrogen and argon are selectively
retained; an oxygen-enriched stream then leaves the columns as product. During this step, a fraction
of the product is used to purge in counter-current the other main bed at the ow operating pressure.
After the adsorption step is completed the two main beds are connected to equalize the pressure (E).
Following, during the evacuation step (VA), the top end of this column is kept closed while vacuum
is applied to the feed end. After this step, vacuum is maintained for counter-current purge (VP) with
a fraction of the product stream. An equalization step then takes place, and afterward is the backfill
(B), in which part of the product stored in the backfill column is used to counter-currently pressurize
the adsorption bed. The backfill step, although not new is an unusual step, and it was considered here
as part of an innovative solution to increase the oxygen concentration in the product stream up to
high-purity levels.
The cycle described was applied for both lab and prototype units. As previously mentioned, the
stand-alone unit also comprises a pretreatment section for carbon dioxide and moisture removal. The
pretreatment cycle was designed to run combined with the main cycle, running a four-step cycle:
pressurization, adsorption, evacuation, and purge under vacuum (Table 3). The precycle continuously
supplies treated feed air (≤−40 °C dewpoint; ≤ 5 ppm of CO2) to the AgLiLSX columns during
pressurization and adsorption steps; the prebeds are vacuum regenerated, with and without a purging
stream using dried waste gas from the main columns.
Mathematical Model. The main assumptions of the mathematical model used for simulating both
VPSA units are
1) ideal gas behavior
2) negligible radial concentration and temperature gradients
3) nonisothermal and nonadiabatic conditions with gas and solid heat conduction
4) intraparticle mass transport according to linear driving force (LDF) model
5) uniform cross-sectional void fraction
6) adsorption equilibrium described by dual-site multi-component Langmuir isotherm
7) pressure drop described by Ergun’s equation According to these assumptions, the model can
be written as it follows:
Mass Balance:
where ci is the partial molar concentration, Dax is the axial dispersion coefficient, u is the interstitial
molar average velocity, εb is the interparticle voidage, εt is the total bed voidage, ρs is the adsorbent
apparent density, qi is the partial average molar concentration in the adsorbed phase, x is the spatial
coordinate, and t is time. The dispersion coefficient, Dax, varies along the length of the bed following
the correlation:27

5
where rp is the particle radius. The molecular diffusion coefficient, Dm, is estimated from the
Chapman−Enskog equation.28
The momentum balance is given by the Ergun’s equation as follows:29
Momentum balance:
where P is the total pressure, ρg is the gas-phase molar density, μ is the dynamic viscosity, and M is
the molecular weight.
The intraparticle mass transfer model is expressed by the linear driving force model:26
where qi is the adsorbed concentration of the component i in the particle inner surface, and ki is
LDF coefficient, here given by the macropore diffusion term as follows:30,31
where εp is the intraparticle voidage, and the macropore diffusion coefficient, Dpi, obtained from
the Bosanquet equation:6
where τp is the tortuosity factor, and DKi is the Knudsen
diffusion coefficient given by DKi =97rpore(T/Mi)0.5, where rpore is the mean macropore radius
and T is the absolute temperature.
The adsorbed amount of each species in the solid-phase is given by the dual-site Langmuir equation,
which renders Langmuir when qm,2 equals to zero, as follows:32
Adsorption equilibrium model:
where qi is the adsorbed concentration of the component i, P is the equilibrium pressure, qm is the
saturation adsorbed concentration, and b is the adsorption affinity constant, assumed to vary with
temperature, according to the Van’t-Hoff equation:32
6
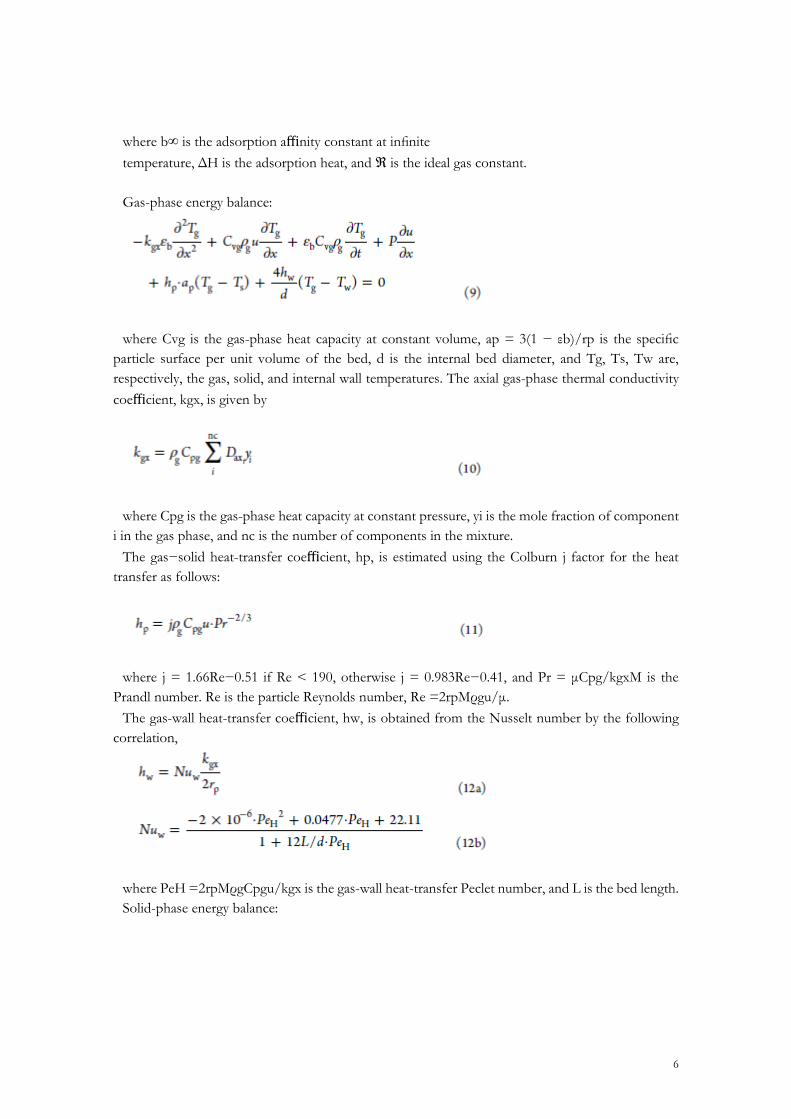
where b∞ is the adsorption affinity constant at infinite
temperature, ΔH is the adsorption heat, and ℜ is the ideal gas constant.
Gas-phase energy balance:
where Cvg is the gas-phase heat capacity at constant volume, ap = 3(1 − εb)/rp is the specific
particle surface per unit volume of the bed, d is the internal bed diameter, and Tg, Ts, Tw are,
respectively, the gas, solid, and internal wall temperatures. The axial gas-phase thermal conductivity
coefficient, kgx, is given by
where Cpg is the gas-phase heat capacity at constant pressure, yi is the mole fraction of component
i in the gas phase, and nc is the number of components in the mixture.
The gas−solid heat-transfer coefficient, hp, is estimated using the Colburn j factor for the heat
transfer as follows:
where j = 1.66Re−0.51 if Re < 190, otherwise j = 0.983Re−0.41, and Pr = μCpg/kgxM is the
Prandl number. Re is the particle Reynolds number, Re =2rpMρgu/μ.
The gas-wall heat-transfer coefficient, hw, is obtained from the Nusselt number by the following
correlation,
where PeH =2rpMρgCpgu/kgx is the gas-wall heat-transfer Peclet number, and L is the bed length.
Solid-phase energy balance:
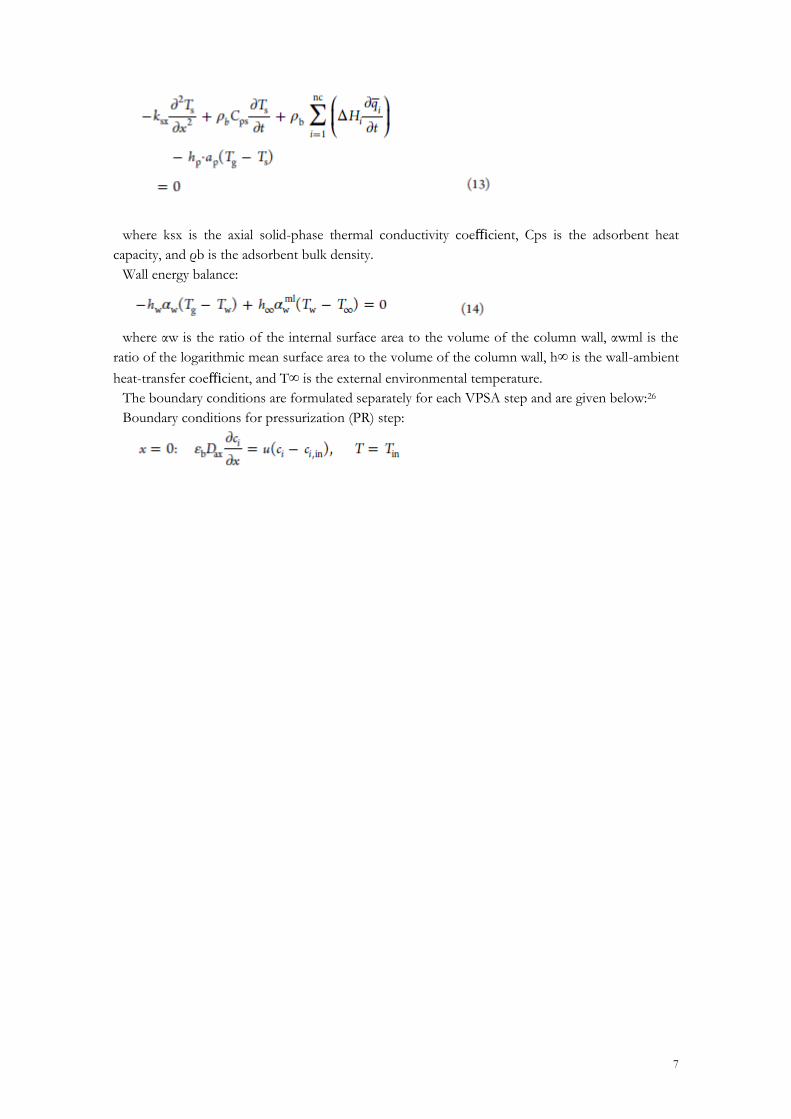
7
where ksx is the axial solid-phase thermal conductivity coefficient, Cps is the adsorbent heat
capacity, and ρb is the adsorbent bulk density.
Wall energy balance:
where αw is the ratio of the internal surface area to the volume of the column wall, αwml is the
ratio of the logarithmic mean surface area to the volume of the column wall, h∞ is the wall-ambient
heat-transfer coefficient, and T∞ is the external environmental temperature.
The boundary conditions are formulated separately for each VPSA step and are given below:26
Boundary conditions for pressurization (PR) step:

8
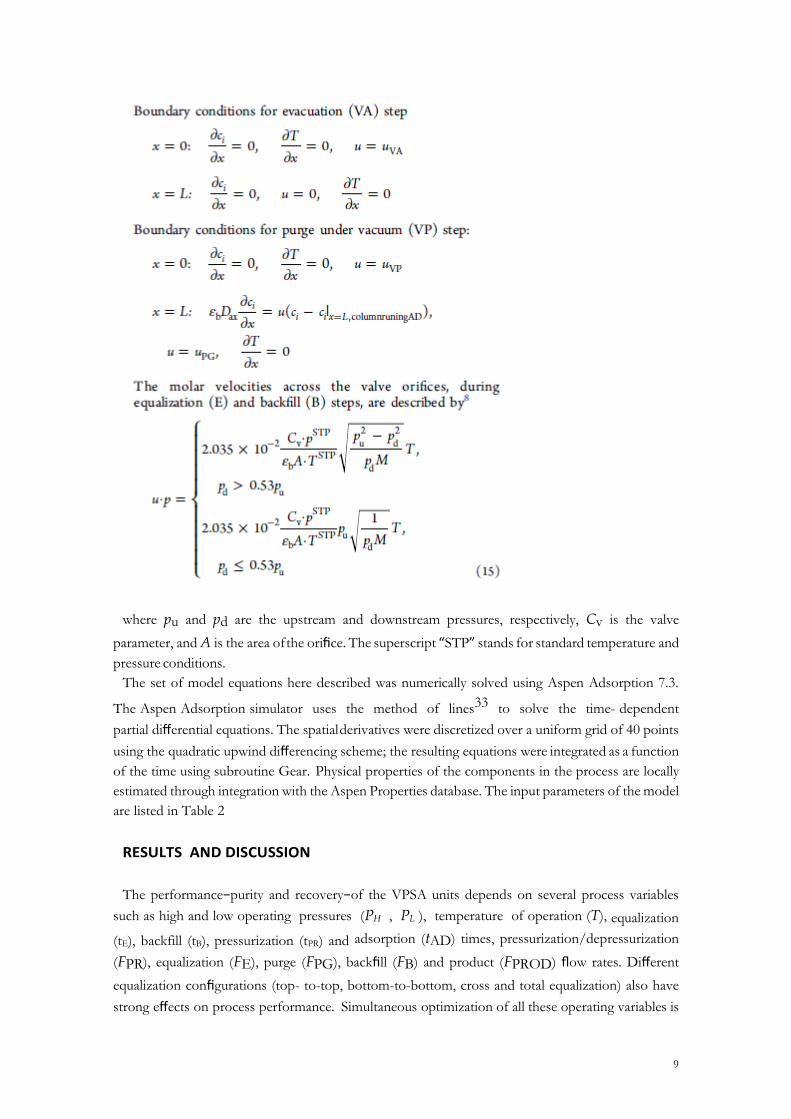
9
where pu and pd are the upstream and downstream pressures, respectively, Cv is the valve
parameter, and A is the area of the orifice. The superscript “STP” stands for standard temperature and
pressure conditions.
The set of model equations here described was numerically solved using Aspen Adsorption 7.3.
The Aspen Adsorption simulator uses the method of lines33 to solve the time- dependent
partial differential equations. The spatial derivatives were discretized over a uniform grid of 40 points
using the quadratic upwind differencing scheme; the resulting equations were integrated as a function
of the time using subroutine Gear. Physical properties of the components in the process are locally
estimated through integration with the Aspen Properties database. The input parameters of the model
are listed in Table 2
RESULTS AND DISCUSSION
The performance−purity and recovery−of the VPSA units depends on several process variables
such as high and low operating pressures (PH , PL ), temperature of operation (T), equalization
(tE), backfill (tB), pressurization (tPR) and adsorption (tAD) times, pressurization/depressurization
(FPR), equalization (FE), purge (FPG), backfill (FB) and product (FPROD) flow rates. Different
equalization configurations (top- to-top, bottom-to-bottom, cross and total equalization) also have
strong effects on process performance. Simultaneous optimization of all these operating variables is

10
an unreasonable task. Prior to operating cycle optimization, several tests were conducted in a lab unit
to select the best equalization configuration. All the above-mentioned configurations were tested, and
top-to-top equalization proved to be the best one, resulting in better performance. Backfill flow rate
(FB) was also evaluated and it was observed that it is not an operating variable with strong influence in
the performance of the unit and, because of that, the backfill flow rate should be high enough to allow
the equalization between the adsorption column and the backfill column to occur in the shortest time
possible. Therefore, no restrictions in the backfill flow rate were considered. As to
pressurization/depressurization flow rate (FPR), it was not fixed, depending on the high pressure and
flow rate delivered by the compressor and the vacuum pump. Product flow rate was set to 0.1
LSTP·min−1 for the lab unit and 1 LSTP·min−1 for the stand-alone prototype unit, according to the
main goal of this work. The operating temperature was the lab room temperature, ca. 25 °C for the
lab unit and slightly higher for the stand-alone unit, between 25 and 28 °C, due to higher ambient
temperature in the prototype surroundings.
Lab VPSA. The lab VPSA unit was studied and optimized using response surface methodology
(RSM), which is a combination of mathematical and statistic tools that are effective for studying and
modeling processes in which responses are dependent on several operating variables.34 RSM analysis
was conducted using JMP7.0 (Statistical Analysis Software). A central composite design (CCD), which
is the most used method for fitting second order models, was selected.34 The process responses are
purity (Pur) and recovery (Rec) and the factors considered were pressurization (tPR), adsorption
(tAD) and backfill (tB) times, purge flow rate (FPG) and high pressure (PH). These are key operating
variables controlling a VPSA unit. Some of these variables were preset, like equalization time (tE),
set to 4 s, since it was found to be the minimum time necessary to allow beds to equalize completely;
the complete equalization was found to give the best purity and recovery results. The low pressure
(PL) although not fixed, depends on the high pressure, cycle duration, and capacity of the vacuum
pump, and varies between 0.2 and 0.3 bar. Table 4 shows the design operating variables and their
levels, and also the values of the preset operating variables.
Table 5 summarizes the CCD runs and the experimental results obtained for each run. Runs 5, 16,
18, and 24 are center point replicates for assessing the experimental reproducibility. Second order
polynomial models were fitted for purity and recovery from the CCD results, which describe the effect
of the selected factors on the process responses. Model parameters with p-values higher than 0.15
were eliminated.35
where a0 to a11 parameters of eq 16 and eq 17 are given in Table 6.
An analysis of variance of the model was performed and p- values lower than 0.0001 were obtained

11
indicating that the polynomial model has a very high significance. The fitting models were used to
interpolate the response values for purity and recovery, and compared with the experimental ones,
parity plots (Table 5). The determination coefficients, R2, are very close to unity for both purity, R2
= 0.992, and recovery, R2 > 0.999, indicating that the empiric models accurately describe the
experimental results.
Table 5 shows product oxygen concentrations of 99.1+% at reasonable recoveries for various
operating conditions. Second order empirical models given by the JMP software were used to find the
optimum conditions for purity and recovery (Table 7). The maximum purity obtained was 99.12%
with 6.4% of recovery, when tPR = 5 s, tAD = 6 s, tE = 4 s, tB = 1.2 s, PH = 1.6 bar, PL = 0.25 bar,
and FPG = 0.1 LSTP·min−1 (run 31). For the conditions of run 33 (tPR = 9 s, tAD = 8.5 s, tE = 4
s, tB = 1.5 s, PH = 1.4 bar, PL = 0.2 bar, and FPG = 0.4 LSTP·min−1), high- purity oxygen, 99.0%,
and high recovery, 8.3% are obtained.
The productivity of the unit was computed from the ratio between the product flow rate and the
amount of adsorbent used. Reasonable productivity of ca. 7.0 m3·h−1·ton−1 was obtained.
ASPEN was used to simulate the experimental results. The results obtained by ASPEN simulations
are summarized in Table 5 and Table 7 and can be compared with RSM predicted ones and with
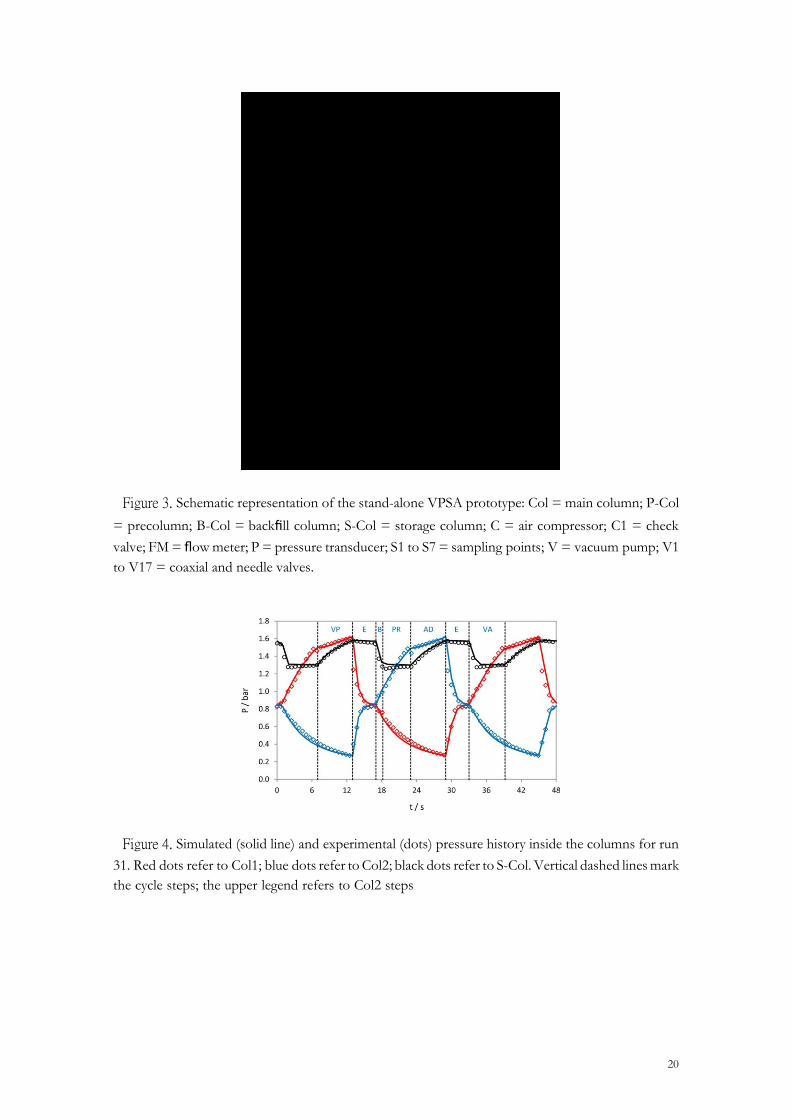
experimental results. Figure 4 presents the simulated and experimental pressure history for run 31;
vertical dashed lines mark the cycle steps. The simulated profile on this figure was obtained with
ASPEN simulations. By analyzing Table 5, Table 7, and Figure 4 it can be concluded that the ASPEN
phenomenological simulator is able to accurately represent the experimental results.
Oxygen concentration history inside the adsorption bed was recorded using a mass spectrometer
connected to the five sampling points placed along one of the main beds (S1 to S5, see Figure 3).
Figure 5 plots the concentration profiles obtained during one cycle of run 31. The axial position goes
from 0 (feed end) to 1 (product end). The adsorption cycle steps are marked with different colors for
readability. Figure 5 shows that the oxygen concentration inside the adsorption beds increases along
the bed, with the maximum obtained during the AD step at the column product end. This figure also
shows the importance of VP, E, and B steps on removing the impurities and increasing oxygen
concentration along the bed. The complete purge of the impurities adsorbed during PR and AD steps
are essential to obtain a high-purity product.
The ASPEN simulator was used to simulate the temperature profile inside the column during one
cycle of run 31. Again, the axial position goes from 0 (feed end) to 1 (product end). The temperature
variation inside the column is ca. 4.5 °C so that the process could be assumed isothermal.
Stand-Alone VPSA Prototype. As previously referred, the stand-alone VPSA prototype was
designed and assembled based on the results obtained in the lab unit. This stand-alone unit was
designed to produce a steam of 1 LSTP·min−1 with 99+% oxygen from air. The scale-up was made
to obtain equal or better productivity than the lab unit, for the same conditions of purity and recovery.
Also, the stand-alone unit was designed to minimize overall size. The length to diameter ratio (L/D)
of the lab size adsorbent beds is 9.6, unfeasible in a prototype scale, since the unit should be compact
and obey tight dimensions. The main columns of the stand-alone VPSA unit.
Since even gas distribution over the cross section of the adsorption column is critical for achieving
the high separation, several distributors configurations were tested for high and low flow rates in both
ends of the adsorption columns. Figure 7 illustrates the feed end of an adsorption bed; when feeding
the column, air contacts first with the central part of the adsorbent cross section spreading afterward

12
to cover the entire cross section, resulting in stagnant volumes. The same figure shows several
distributors tested. From left to right in Figure 7: (a) the first configuration tested showed central
preferential air flowing; (b) the second configuration tested showed central preferential air flowing
only for high velocities; (c) after several tests the optimum configuration resulted in an even gas
distribution for both low and high velocities, provided that a space of 8 mm is given between the
flange and the distributor. Figure 8 shows that the oxygen concentration profiles measured near to the
feed end of the column, at the center and periphery of the cross section, overlap. The same was
observed through the column. The stand-alone VPSA performance, purity (Pur) and recovery
(Rec), was optimized using the phenomenological model. The critical operating variables
controlling the process are pressurization (tPR) and adsorption (tAD) times and purge flow rate
(FPG). On the basis of the lab unit experiments some operating variables were preset, such as backfill
time (tB), since it was observed that the maximum product purity occurs at maximum backfill time
(Table 7); thus, tB was set to 2 s since it is the time required to allow the adsorption bed and the backfill
column to completely equalize the pressure. The high pressure (PH) was set to 1.4 bar based on lab
unit experiments and because the low pressure (PL), set to 0.3 bar, is limited by the PH since the
vacuum pump power was preset. Concerning the prototype unit, equalization flow rate was found to
be an extremely import operating variable, since it significantly affects the performance of the unit. The
equalization valve coefficient, CV, was found to be crucial and it was optimized. After several tests
the valve was modified to allow a complete equalization between adsorption beds in 2.5 s, and the
equalization time (tE) was therefore fixed. The preset operating conditions for the stand-alone VPSA
runs are summarized in Table 8.
Table 9 presents the experimental and ASPEN simulation results for several runs. Purity oxygen
concentrations of 99+% at reasonable recoveries can be observed for almost all operation conditions
tested. Table 9 shows that the ASPEN simulator was able to represent accurately the experimental
results (determination coefficients, R2, of the parity plots are 0.898 and 0.963 for purity and recovery,
respectively).
ASPEN simulations were conducted to study the effect of operating variables pressurization time
(tPR), adsorption time (tAD), and purge flow rate (FPG), in the product purity (Pur) and recovery
(Rec) (see Figure 9−14). The three variables studied have strong influence on product purity. Figure
9 shows a pronounced parabolic curvature describing the combined influence of tPR and tAD in the
purity. As it can be seen, purity slowly increases with tAD, reaching a maximum purity value when
tAD is equal to 10 s; and over that point, higher tAD causes an abrupt decrease in the purity. An
optimum tAD allows sufficient time for the oxygen concentration front to leave the column, and it is
short enough for preventing Ar front to breakthrough. Similar behavior is observed for tPR, with a
(local) maximum purity, 99.10%, obtained for tPR = 5.5 s and tAD = 10 s (with FPG = 0.8
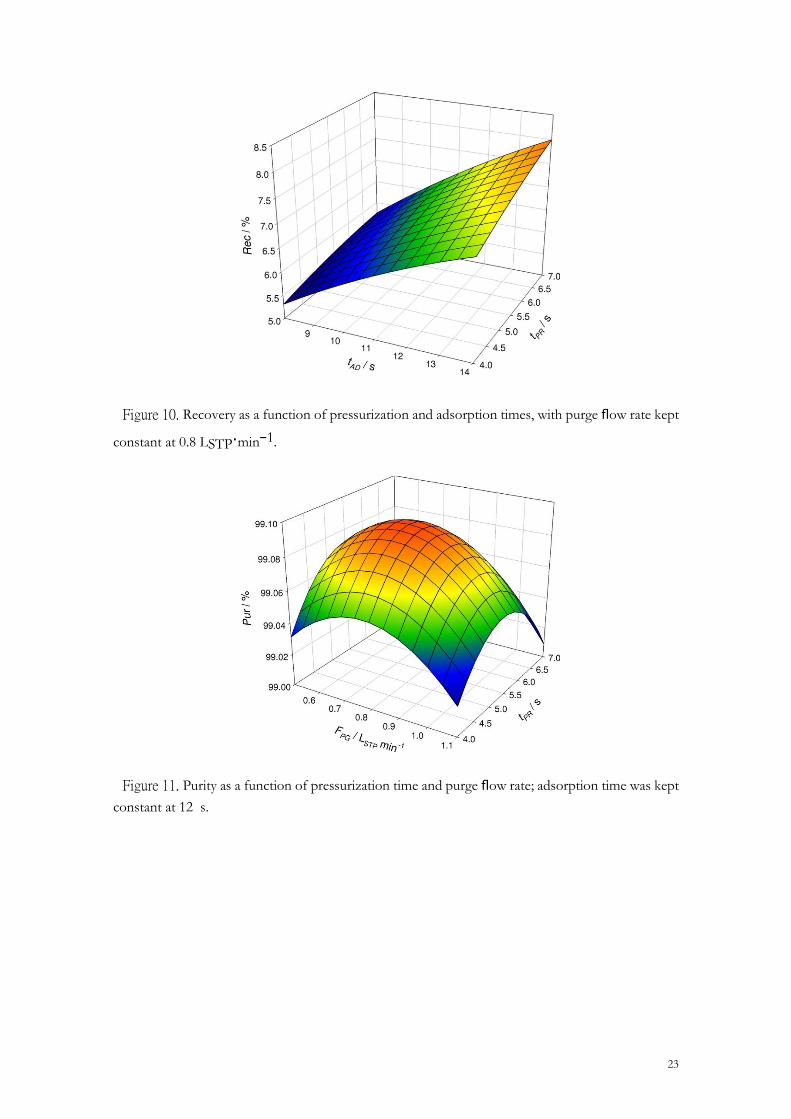
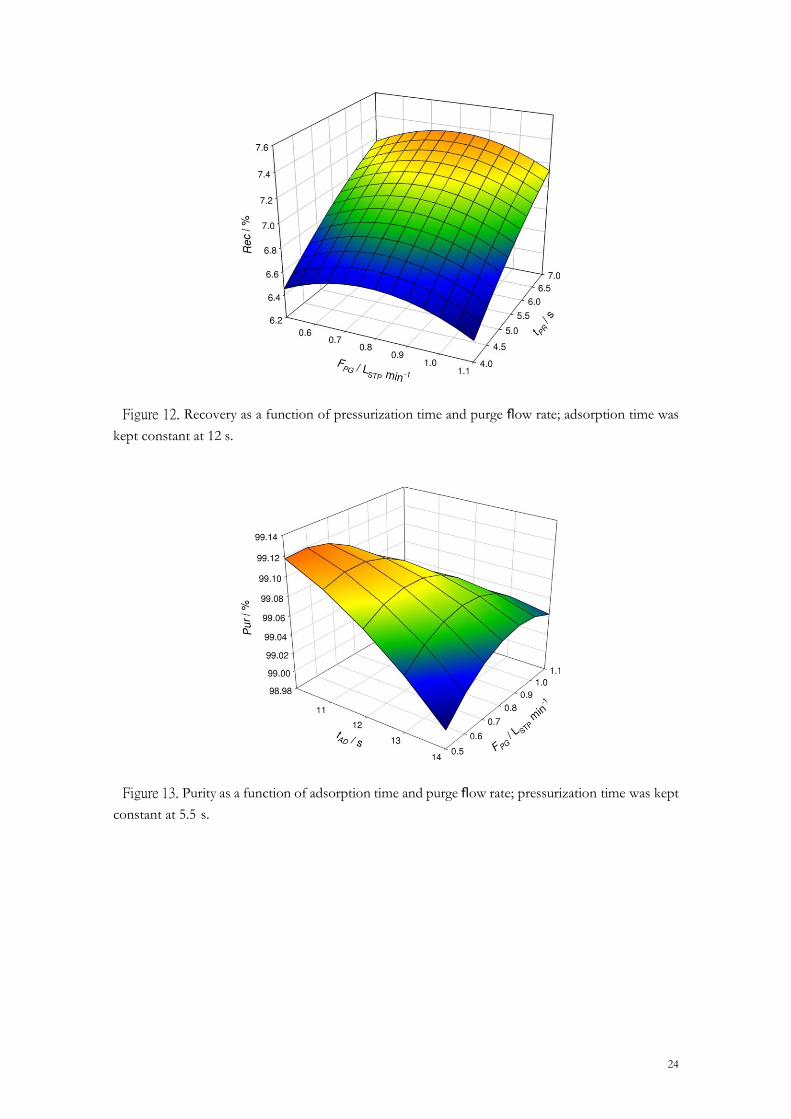
LSTP·min−1). Similarly, Figure 13 shows that the optimum purity, ca. 99.12%, can be obtained when
FPG is between 0.5 and 0.6 LSTP·min−1, and tAD is 10 s (with tPR = 5.5 s). This figure shows that,
for higher tAD values, FPG has no significant influence on the purity; however, for smaller tAD
values, the purity depends considerably on FPG, increasing as it decreases. Thus, a small part of the
product should be used to purge the beds; this is crucial to remove contaminants during evacuation
steps allowing better performance. Small FPG values are enough to guarantee high purity product if
vacuum conditions are sufficient to purge the beds, and the loss of FPG during this step causes

13
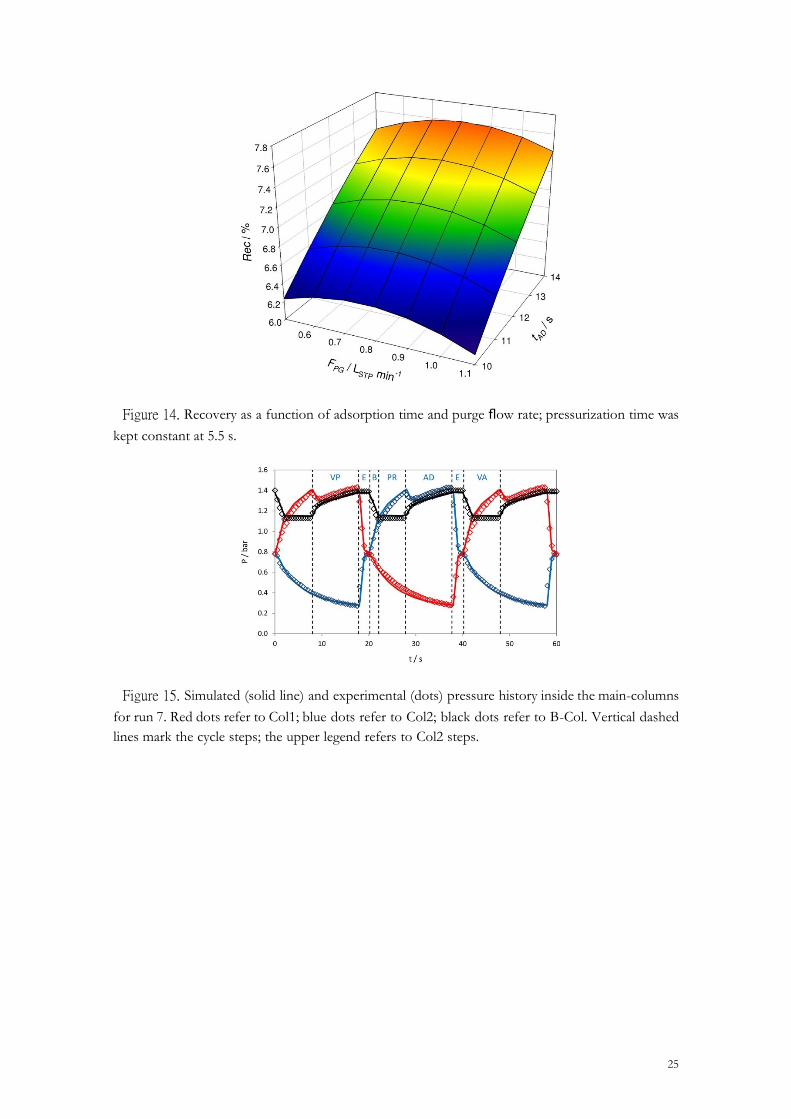
significant decrease in purity (Figure 13). Concerning recovery, Figure 12 and Figure 14 show that
variations in the FPG, within the range studied, do not affect significantly the product recovery;
product recovery increases with tPR and mainly with tAD (see Figure 10). This occurs because the
increase of tPR and tAD allow a more thorough retention of oxygen, avoiding being vented.
According to ASPEN simulator, the maximum oxygen purity that can be expected is 99.12% (with
6.2% of recovery) when tPR is 5.5 s, tAD is 10 s and FPG is 0.5 LSTP·min−1 (run 7). These
conditions were experimentally tested (run 7) and a slightly better purity was obtained, 99.13%
(with 6.2% of recovery). Also, run 15 shows that high-purity oxygen, ≥ 99.0%, can still
be obtained with a higher recovery, 8.0%, when tPR is 7 s, tAD is 14 s, and FPG is 0.8 LSTP·min−1;
experimental and simulated values are equal. The productivity of the unit was computed from the
ratio between the product flow rate and the amount of AgLiLSX used and a productivity of ca. 8.97
m3·h−1·ton−1 was obtained. This is similar to the productivity reported by Santos et al.8 in a
simulation study of a single-stage lab PSA unit using AgLiLSX for the production of 99% of oxygen,
which is 14 m3· h−1·ton−1. When compared to the productivity of a two-stage VPSA for the
production of 97% of oxygen, 0.21 m3·h−1·ton−1, one can find the productivity obtained in this
work is considerably higher.3
Figure 15 and Figure 16 show experimental and ASPEN simulated pressure histories for run 7 in
both main-columns and precolumns, respectively; vertical dashed lines mark the cycle steps. The
stand-alone VPSA prototype operates between 1.4 and 0.25 bar. Figure 17 shows the experimental
and simulated feed flow rate for the same run; an average feed flow rate of 76 LSTP·min−1 was
computed. Oxygen concentration profile inside the adsorption bed for run 7 was simulated, using
ASPEN, and it is plotted in Figure 18. Oxygen concentration increases through the column, and the
maximum oxygen concentration is observed near to the top of the column. The equalization step
plays a key role on this cycle, increasing oxygen concentration, thus preparing the bed to produce
high- purity product. The oxygen concentration of the feed stream during the pressurization step is
slightly above 21% because of the oxygen enrichment by the precolumns. Figure 19 plots the oxygen
concentration profile inside the precolumn for run 7. This figure shows that the precycle, besides
removing both carbon dioxide and moisture from the feed stream, slightly enriches the feeding
stream in oxygen. The experimental average oxygen concentration of the feed stream to the main
columns (packed with AgLiLSX zeolite) is 24.7% and the simulated one is 25.1%.
Figure 20 shows the temperature profile inside the adsorption bed for run 7, according to
ASPEN simulations. The operating temperature inside the bed varies between 24.2 °C and 30.8 °C,
corresponding to an amplitude of ca. 6.6 °C, slightly greater than the temperature amplitude observed
in the lab VPSA, where the amplitude was ca. 4.5 °C (Figure 6). This is due to the large difference in
the diameter of the adsorption columns of the two units, since smaller diameter columns dissipate
heat more easily.
The results obtained in the stand-alone unit (99.13% oxygen, with 6.2% of recovery and a
productivity of 9.0 m3·h−1·ton−1) are consistent with the ones obtained in the lab unit (99.12%
oxygen, with 6.4% of recovery and a productivity of 7.3 m3·h−1· ton−1). The differences in the
productivity of the two units are related to the oxygen enrichment by the precolumns of the stand-
alone unit. These prebeds, crucial in a stand-alone unit to prevent the contamination of AgLiLSX with
carbon dioxide and moisture present in atmospheric air, somewhat enrich the oxygen concentration

14
in the feed stream, slightly improving the separation.
CONCLUSIONS
A single-stage VPSA for the production of high-purity oxygen from air was designed built and
studied using AgLiLSX zeolite by Air Products. A lab VPSA unit was designed for producing
0.1 LSTP·min−1 of 99+% of oxygen stream from air (previously dried and carbon dioxide
removed). The unit comprises two adsorption beds packed with AgLiLSX zeolite, operating between
0.2 and 1.6 bar at room temperature running a seven-step cycle. The cycle comprises the following
steps: pressurization, adsorption, top-to-top equalization, evacuation, purge under vacuum, and
backfill. The unit was optimized using RSM methodology, and an optimum purity of 99.12% oxygen
from air, with 6.4% of recovery and productivity of 7.3 m3·h−1· ton−1 was obtained when the
following operation conditions were observed: tPR = 5 s, tAD = 6 s, tE = 4 s, tB = 1.2 s, PH = 1.6
bar, PL = 0.25 bar, and FPG = 0.1 LSTP·min−1. The unit was also simulated using ASPEN
simulator, which represented accurately the experimental results.
On the basis of the studies conducted in the lab unit, a compact (dimensions of 70 × 50 × 85 cm3,
0.3 m3 vol.), lightweight (120 kg) and low energy consuming (average power consumption of 1.0 kW)
stand-alone VPSA was designed and assembled for the production of 1 LSTP·min−1 of 99+%
oxygen stream from air. The unit, operating between 1.4 and 0.2 bar at 25 °C, includes two prebeds
running an innovative pretreatment four-step cycle synchronized with the seven-step main cycle to
continuously supply treated feed air (−40 °C dewpoint and 5 ppm of CO2) to the AgLiLSX beds.
This pretreatment section is crucial in such a stand-alone unit to protect and prevent AgLiLSX from
deactivation. The developed ASPEN-based simulator was used to study the influence of several
operating variables on the product purity and recovery and to optimize the performance of the unit.
The optimized stand-alone unit produced an experimental stream of 99.13% oxygen from air, with a
recovery of 6.2% when tPR = 5.5 s, tAD = 10 s, tE = 2.5 s, tB = 2 s, PH = 1.4 bar, PL = 0.25 bar, and
FPG = 1 LSTP·min−1. The unit was also able to produce a 99% oxygen stream with higher recovery,
8%, when the following conditions are observed: tPR = 7 s, tAD = 14 s, tE = 2.5 s, tB =2 s, PH = 1.4
bar, PL = 0.25 bar, and FPG = 0.8 LSTP·min−1. The productivity of the unit is 9.0 m3·h−1·ton−1.
It was concluded that the stand-alone unit was able to produce high-purity oxygen from air, with
good recovery and productivity, using a single-stage VPSA packed with AgLiLSX.
Notes
The authors declare no competing financial interest.
ACKNOWLEDGMENTS
Daniel Ferreira acknowledges Fundação para a Ciencia e Tecnologia (FCT) and Sysadvance,
Sistemas de Engenharia S.A. for the Ph.D. grant (SFRH/BDE/51186/2010). The authors
acknowledge the funding provided by Agência de Inovação (AdI) (project HPOVPSA, ref
13488). We kindly thank Pedro Taveira for the relevant assistance on designing the cycle of the
stand-alone unit.

15
NOMENCLATURE
A = area, m2
ap = specific particle surface per unit volume of the bed, m−1
b = Langmuir affinity constant, bar−1
b∞ = Langmuir affinity constant at infinite temperature, bar−1
c = fluid-phase molar concentration, mol·m−3
Cp = heat capacity, J·kg−1·K−1
Cpg = gas-phase heat capacity at constant pressure, J·kg−1·K−1
Cvg = gas-phase heat capacity at constant volume, J·kg−1·K−1 CV = valve parameter
d = diameter, m
Dax = axial dispersion coefficient, m2·s−1
DK = Knudsen diffusion coefficient, m2·s−1
Dm = molecular diffusion coefficient, m2·s−1
Dp = macropore diffusion coefficient, m2·s−1 F = flow rate, LSTP·min−1
hp = gas−solid heat transfer coefficient, W·m−2·K−1
hw = gas-wall heat transfer coefficient, W·m−2·K−1
h∞ = wall-environmental heat transfer coefficient, W·m−2· K−1
ΔH = adsorption heat, J·mol−1
k = LDF coefficient, s−1
kf = film mass-transfer coefficient, s−1
kgx = axial gas-phase thermal conductivity, W·m−1·K−1
ksx = axial solid-phase thermal conductivity, W·m−1·K−1 KK = dimensionless Henry’s constant
L = length, m
M = molecular weight, kg·mol−1
Nuw = Nusselt number for gas-wall heat transfer, Nuw = 2rphw/kgx
p = partial pressure, Pa−1
P = total pressure, bar or Pa−1
PeH = gas-wall heat-transfer Peclet number, PeH = 2rpMρgCpgu/kgx
Pr = Prandl number, Pr = μC /k M
Pur = product purity, %

16
q = molar concentration in the adsorbed phase, mol·kg
qm = isotherm parameter, maximum adsorption capacity, mol·kg−1
r = radius, m
ℜ = ideal gas constant, J·mol−1·K−1
Re = particle Reynolds number, Re = 2rpMρgu/μ
Rec = product recovery, %
t = time variable, s
T = temperature, K
u = interstitial molar average velocity, m·s−1
x = spatial coordinate, m
y = gas-phase mole fraction
Greek Symbols
αw = ratio of the internal surface area to the volume of the column wall, m−1
εb = interparticle voidage
εp = intraparticle voidage
εt = total bed void fraction
ρ = density, kg·m−3
μ = dynamic viscosity, N·s·m−2
τp = tortuosity
Subscripts
b = adsorbent bulk d = downstream
F = feed
g = gas
H = high
i = component in = initial
L = low
nc = number of mixture components
p = particle
PG = purge
PROD = product
s = adsorbent
u = upstream
w = wall
∞ = environmental
AD = adsorption (or production) step
B = backfill step
E = equalization step
PR = pressurization step
VA = evacuation step
VP = purge under vacuum step

17
Superscripts
ml = mean logarithm
STP = standard temperature and pressure conditions
REFERENCES
(1) Grande, C. A. Advances in Pressure Swing Adsorption for Gas Separation. ISRN Chem. Eng.
2012, 2012, 13.
(2) Jee, J.-G.; Lee, S.-J.; Moon, H.-M.; Lee, C.-H. Adsorption Dynamics of Air on Zeolite 13X
and CMS Beds for Separation and Purification. Adsorption 2005, 11, 415−420.
(3) Lee, S.-J.; Jung, J.-H.; Moon, J.-H.; Jee, J.-G.; Lee, C.-H. Parametric Study of the Three-Bed
Pressure−Vacuum Swing Adsorption Process for High Purity O2 Generation from Ambient Air.
Ind. Eng. Chem. Res. 2007, 46, 3720−3728.
(4) Jee, J.-G.; Lee, S.-J.; Lee, C.-H. Comparison of the Adsorption Dynamics of Air on Zeolite
5A and Carbon Molecular Sieve Beds. Korean J. Chem. Eng. 2004, 21, 1183−1192.
(5) Park, Y.-J.; Lee, S.-J.; Moon, J.-H.; Choi, D.-K.; Lee, C.-H. Adsorption Equilibria of O2,
N2, and Ar on Carbon Molecular Sieve and Zeolites 10X, 13X, and LiX. J. Chem. Eng. Data 2006,
51, 1001− 1008.
(6) Ruthven, D., Farooq, S., Knaebel, K. Pressure Swing Adsorption; VCH Publishers: New York,
1994.
(7) Yang, R. T. Gas Separation by Adsorption Processes; Imperial College Press: London, 1997.
(8) Santos, J. C.; Cruz, P.; Regala, T.; Magalhaes, F. D.; Mendes, A. High-Purity Oxygen Production
by Pressure Swing Adsorption. Ind. Eng. Chem. Res. 2006, 46, 591−599.
(9) Hayashi, S.; Kawai, M.; Kaneko, T. Dynamics of High Purity Oxygen PSA. Gas Sep. Purif.
1996, 10, 19−23.
(10) Haruna, K., Ueda, K., Inoue, M., Someda, H. Process for Producing High Purity Oxygen Gas
from Air. U.S. Patent 4,985,052, 1991.
(11) Armond, J. W., Webber, D. A., Smith, K. C. Gas Separation. U.S. Patent 4,190,424, 1980.
(12) Santos, J. C.; Portugal, A. F.; Magalhaes, F. D.; Mendes, A. Optimization of Medical PSA Units
for Oxygen Production. Ind. Eng. Chem. Res. 2006, 45, 1085−1096.
(13) Ferreira, D.; Magalhaes, R.; Bessa, J.; Taveira, P.; Sousa, J.; Whitley, R. D.; Mendes, A. Study
of AgLiLSX for Single-Stage High- Purity Oxygen Production. Ind. Eng. Chem. Res. 2014, 53,
15508− 15516.
(14) Bae, Y.-S.; Moon, J.-H.; Ahn, H.; Lee, C.-H. Effects of Adsorbate Properties on Adsorption
Mechanism in a Carbon Molecular Sieve. Korean J. Chem. Eng. 2004, 21, 712−720.
(15) Kim, M.-B.; Jee, J.-G.; Bae, Y.-S.; Lee, C.-H. Parametric Study of Pressure Swing Adsorption
Process To Purify Oxygen Using Carbon Molecular Sieve. Ind. Eng. Chem. Res. 2005, 44, 7208−7217.
(16) Jee, J.-G.; Jung, J.-H.; Lee, J.-W.; Suh, S.-H.; Lee, C.-H. Comparison of Vacuum Swing
Adsorption Process for Air Separation Using Zeolite 10X and 13X. Rev. Roum. Chim. 2006, 51,
1095−1108.
(17) Wilkerson, B. E. The Adsorption of Argon and Oxygen on Silver Mordenite. Master Thesis,
Graduate School of Ohio State University, Ohio, USA, 1990.
(18) Chiang, R. L., Whitley, R. D., Ostroski, J. E., Dee, D. P. Argon/ Oxygen Selective X-Zeolite.
U.S. Patent 6,432,170, 2002.
18
(19) Sebastian, J.; Jasra, R. V. Sorption of Nitrogen, Oxygen, and Argon in Silver-Exchanged
Zeolites. Ind. Eng. Chem. Res. 2005, 44, 8014−8024.
(20) Anson, A.; Kuznicki, S. M.; Kuznicki, T.; Haastrup, T.; Wang, Y.; Lin, C. C. H.; Sawada, J. A.;
Eyring, E. M.; Hunter, D. Adsorption of Argon, Oxygen, and Nitrogen on Silver Exchanged
ETS-10 Molecular Sieve. Microporous Mesoporous Mater. 2008, 109, 577−580.
(21) Shi, M.; Kim, J.; Sawada, J. A.; Lam, J.; Sarabadan, S.; Kuznicki, T. M.; Kuznicki, S. M.
Production of Argon Free Oxygen by Adsorptive Air Separation on Ag-ETS-10. AIChE J. 2013, 59,
982− 987.
(22) Knaebel, K. S., Kandybin, A. Pressure Swing Adsorption System to Purify Oxygen. U.S. Patent
5,226,933, 1993.
(23) Dee, D. P., Chiang, R. L., Miller, E. J., Whitley, R. D. High Purity Oxygen Production by
Pressure Swing Adsorption. U.S. Patent 6,544,318, 2003.
(24) Ferreira, D.; Magalhaes, R.; Taveira, P.; Mendes, A.l. Effective Adsorption Equilibrium
Isotherms and Breakthroughs of Water Vapor and Carbon Dioxide on Different Adsorbents. Ind.
Eng. Chem. Res. 2011, 50, 10201−10210.
(25) Santos, J. C.; Magalhaes, F. D.; Mendes, A. Contamination of Zeolites Used in Oxygen
Production by PSA: Effects of Water and Carbon Dioxide. Ind. Eng. Chem. Res. 2008, 47,
6197−6203.
(26) Cruz, P.; Santos, J. C.; Magalhaes, F. D.; Mendes, A. Cyclic Adsorption Separation Processes:
Analysis Strategy and Optimization Procedure. Chem. Eng. Sci. 2003, 58, 3143−3158.
(27) Ruthven, D. M. Principles of Adsorption and Adsorption Processes; John Wiley Wiley and Sons
Sons: New York, 1984.
(28) Bird, R., Stewart, W., Ligthfoot, E. Transport Phenomena; John Wiley Wiley and Sons Sons:
New York, 2002.
(29) Ergun, S. Fluid Flow Through Packed Columns. Chem. Eng. Prog. 1952, 48, 89−94.
(30) Barcia, P. S.; Silva, J. A. C.; Rodrigues, A.r.E. Adsorption Dynamics of C5−C6 Isomerate
Fractions in Zeolite Beta for the Octane Improvement of Gasoline. Energy Fuels 2010, 24,
1931−1940.
(31) Barcia, P. S.; Silva, J. A. C.; Rodrigues, A.r.E. Octane Upgrading of C5/C6 Light Naphtha by
Layered Pressure Swing Adsorption. Energy Fuels 2010, 24, 5116−5130.
(32) Do, D. D. Adsorption Analysis: Equilibria and Kinetics; Imperial College Press: London, 1997.
(33) Schiesser, W. The Numerical Method of Lines; Academic Press: San Diego, CA, 1991.
(34) Catarino, M.; Ferreira, A.; Mendes, A. Study and Optimization of Aroma Recovery From Beer
by Pervaporation. J. Membr. Sci. 2009, 341, 51−59.
(35) Montgomery, D. C. Design and Analysis of Experiments; John Wiley & Sons: New York,
2001.

19
Figure 1. Schematic representation of the lab VPSA unit: Col = column; S-Col = storage column;
C1 to C5 = check valves; FM = flow meter; FC = flow controller; P = pressure transducer; S1 to S5
= sampling points; V = vacuum pump; V1 to V16 = electric valves.
Figure 2. Adsorption isotherms for: ○, nitrogen; □, oxygen; and △, argon, on AgLiLSX at 25 °C.
20
Figure 3. Schematic representation of the stand-alone VPSA prototype: Col = main column; P-Col
= precolumn; B-Col = backfill column; S-Col = storage column; C = air compressor; C1 = check
valve; FM = flow meter; P = pressure transducer; S1 to S7 = sampling points; V = vacuum pump; V1
to V17 = coaxial and needle valves.
Figure 4. Simulated (solid line) and experimental (dots) pressure history inside the columns for run
31. Red dots refer to Col1; blue dots refer to Col2; black dots refer to S-Col. Vertical dashed lines mark
the cycle steps; the upper legend refers to Col2 steps

21
Figure 5. Experimental oxygen concentration 3D profile inside the column during one cycle of run
31. The axial position goes from 0 (feed end) to 1 (product end). Different steps are marked with
different colors according to the figure label.
Figure 6. Simulated temperature 3D profile inside the column during one cycle of run 31. Axial
position goes from 0 (feed end) to 1 (product end).
Figure 7. Schematic representation of the column feed end, with the distributor indicated with blue
color and the distributors tested showing: (a) central preferential air flowing; (b) peripheral preferential
air flowing; (c) even gas distribution.

22
Figure 8. Experimental oxygen concentration profiles measured, near the column feed end
(sampling point S2): blue line, at the center of the column; and red line, at the periphery of the
column
Figure 9. Purity as a function of pressurization and adsorption times, with purge flow rate kept
constant at 0.8 LSTP·min−1.
23
Figure 10. Recovery as a function of pressurization and adsorption times, with purge flow rate kept
constant at 0.8 LSTP·min−1.
Figure 11. Purity as a function of pressurization time and purge flow rate; adsorption time was kept
constant at 12 s.
24
Figure 12. Recovery as a function of pressurization time and purge flow rate; adsorption time was
kept constant at 12 s.
Figure 13. Purity as a function of adsorption time and purge flow rate; pressurization time was kept
constant at 5.5 s.
25
Figure 14. Recovery as a function of adsorption time and purge flow rate; pressurization time was
kept constant at 5.5 s.
Figure 15. Simulated (solid line) and experimental (dots) pressure history inside the main-columns
for run 7. Red dots refer to Col1; blue dots refer to Col2; black dots refer to B-Col. Vertical dashed
lines mark the cycle steps; the upper legend refers to Col2 steps.

26
Figure 16. Simulated (solid line) and experimental (dots) pressure history inside the precolumns for
run 7. Red dots refer to P-Col1; blue dots refer to P-Col2. Vertical dashed lines mark the precycle steps;
the upper legend refers to P-Col2 steps.
Figure 17. Simulated (solid line) and experimental (dots) feed flow rate measured for run 7.
Figure 18. Simulated oxygen concentration 3D profile inside the main column during one cycle of
run 7. The axial position goes from 0 (feed end) to 1 (product end). Different steps are marked with
different colors according to the figure label.

27
Figure 19. Simulated oxygen concentration 3D profile inside the precolumn during one cycle of run
7. The axial position goes from 0 (feed end) to 1 (product end). Different steps are marked with
different colors according to the figure label
Figure 20. Simulated temperature 3D profile inside the main column during one cycle of run 7. The
axial position goes from 0 (feed end) to 1 (product end).
28
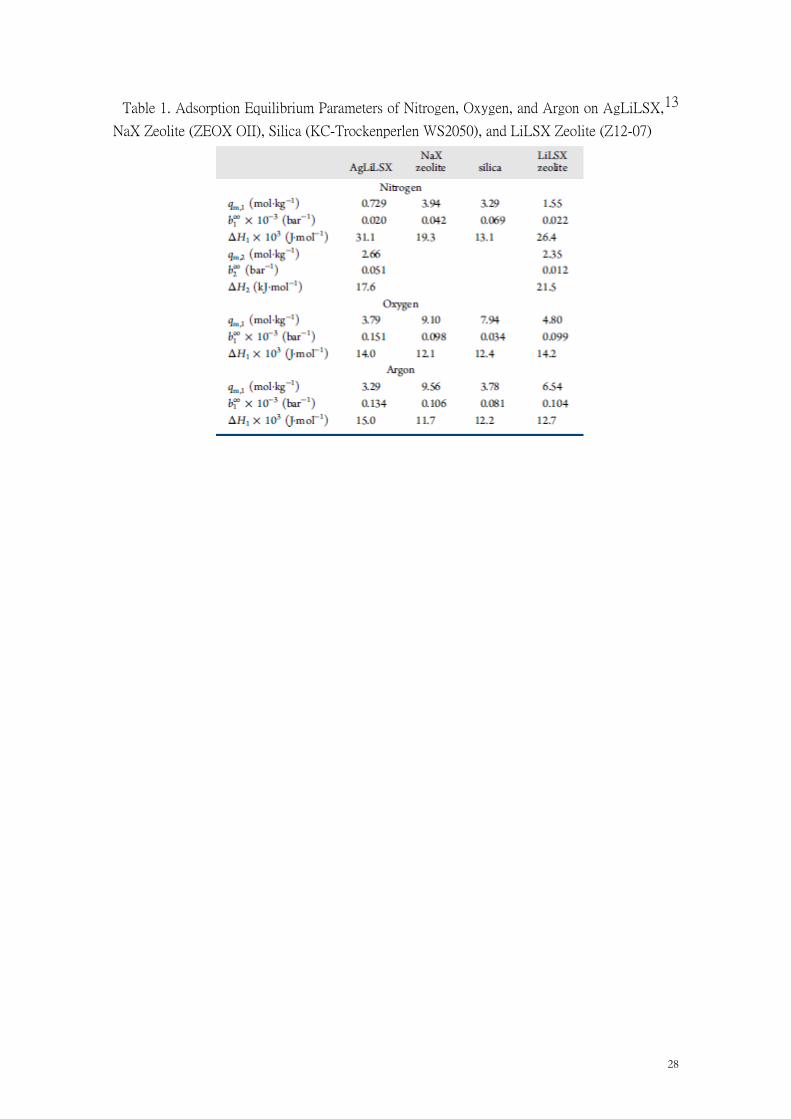
Table 1. Adsorption Equilibrium Parameters of Nitrogen, Oxygen, and Argon on AgLiLSX,13
NaX Zeolite (ZEOX OII), Silica (KC-Trockenperlen WS2050), and LiLSX Zeolite (Z12-07)

29
Table 2. Characteristics of Adsorbents and Adsorption Beds of Lab and Stand-Alone VPSA Units

30
Table 3. Sequence of the Seven-Step VPSA Cycle
Table 4. Operating Conditions for Lab VPSA Runs

31
Table 5. Design of Experiments and Experimental and Simulation Results of the Lab VPSA

32
Table 6. Parameters of Second Order Polynomial eqs 16 and 17
Table 7. Optimum Conditions and Results Predicted by RSM, Simulation, and Experimentally Tested on Lab VPSAa

33
Table 8. Preset Operating Conditions for Stand-Alone VPSA Runs
Table 9. Experimental (expt) and Simulation (sim) Results of the Stand-Alone VPSA Unit