
TPF/IDE Single Source Suite Updates TPF/IDE Single Source Updates Jeff Longwell TPF Software.
Upload
cliff-pittmanCategory
view
152download
0
What’s your next move?™
SINGLE SOURCE • INTERMODAL • DEDICATED • FINAL MILE • TRUCKLOAD • LESS THAN TRUCKLOAD • REFRIGERATED • FLATBED • EXPEDITED
J.B. Hunt Single SourceBuilding Partnerships

2What’s your next move?™ |
Agenda
4 Overview of Solutions4 Operations – CVD®
4 Transportation Management Systems
4 Q&A

3What’s your next move?™ |
J.B. Hunt Solutions
4 Intermodal4 Dedicated4 Truckload4 LTL4 Delivery4 Refrigerated4 Flatbed4 Expedited

4What’s your next move?™ |
Intermodal Advantages
h Largest company-owned container fleet
h Proprietary company-owned chassis
h Company drivers
h Integration with other JBHT asset offerings
h Delta Intermodal Service Group
h Experienced Network Management
h Carbon Emission Reduction / Calculation
h On Site Load Securement Analysis
h Long standing, mutually-beneficial relationships
h Favorable contracts
h Expedited rail ramp entry/exit
h Expedited or standard service available
Ownership ExecutionRail
Partnerships

5What’s your next move?™ |
Dry Van Solutions
4 Over 21,500 capacity providers
4 Over 3,100 company tractors
4 Over 13,000 company trailers
4 Tractor and trailer tracking available
4 Team and expedited transit available
4 Multiple equipment types
4 Service to all Canada and Mexico

6What’s your next move?™ |
LTL Solutions
4 Customized solutions
4 Online rate quotes & booking
4 Online BOL, track and trace
4 Multiple pricing options
4 Special handling capabilities
7What’s your next move?™ |
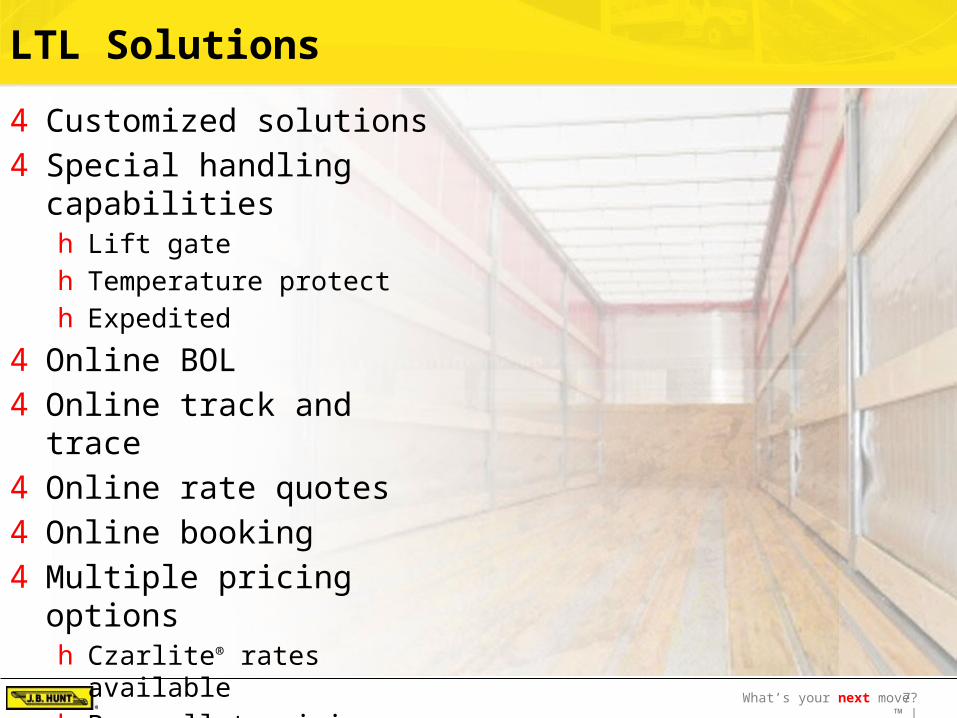
LTL Solutions
4 Customized solutions4 Special handling capabilities
h Lift gateh Temperature protecth Expedited
4 Online BOL4 Online track and trace4 Online rate quotes4 Online booking4 Multiple pricing options
h Czarlite® rates availableh Per pallet pricingh Contracted rates
4 Multiple carrier options

8What’s your next move?™ |
LTL Consolidation
4 Cross Dock4 Pool Points4 Zone Skipping4 Warehousing4 Transloading4 Distribution Services4 ETP – Enterprise Transportation
Planning

9What’s your next move?™ |
4 Over 3,000 teams available
4 Service to US and Canada
4 Specialized Services Available
4 Equipment Availableh 48’ and 53’ Vansh Refrigeratedh Flatbedh Straight Truck & Cargo Van
Team & Expedited Solutions

10What’s your next move?™ |
Final Mile Solutions
4 Home & Office Deliveryh Dedicated equipment usedh Warehousing availableh Product set-up available
4 Drop off and white glove delivery
4 Full delivery visibility technology
4 Uniformed staff4 Branded equipment
11What’s your next move?™ |
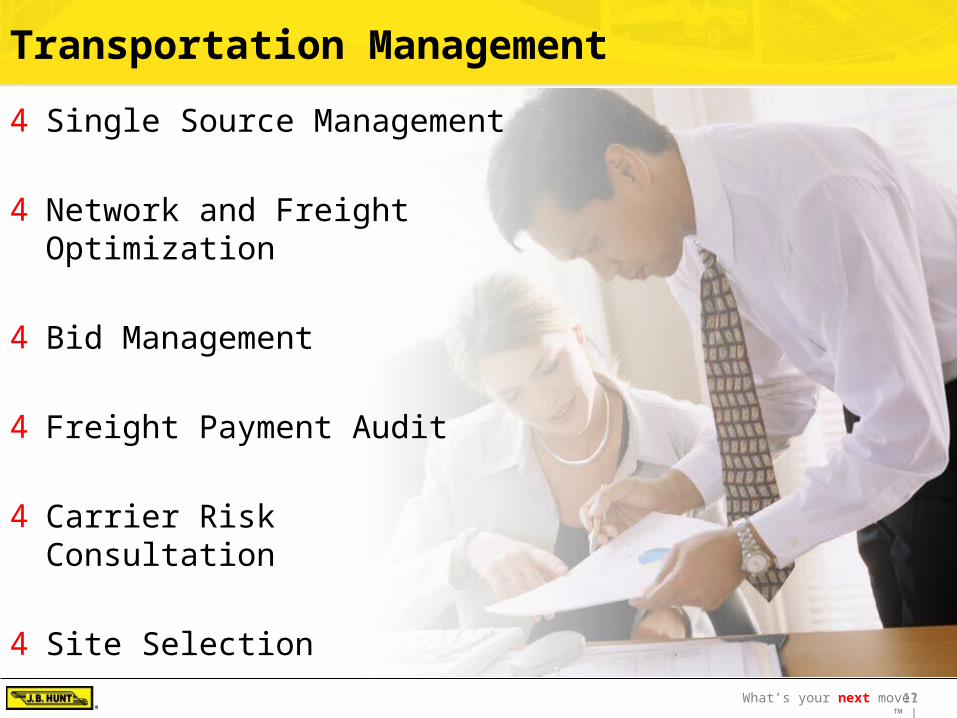
Transportation Management
4 Single Source Management
4 Network and Freight Optimization
4 Bid Management
4 Freight Payment Audit
4 Carrier Risk Consultation
4 Site Selection
4 Consulting

What’s your next move?™
SINGLE SOURCE • INTERMODAL • DEDICATED • FINAL MILE • TRUCKLOAD • LESS THAN TRUCKLOAD • REFRIGERATED • FLATBED • EXPEDITED
Operations - CVDWhat’s your next move?
13What’s your next move?™ |
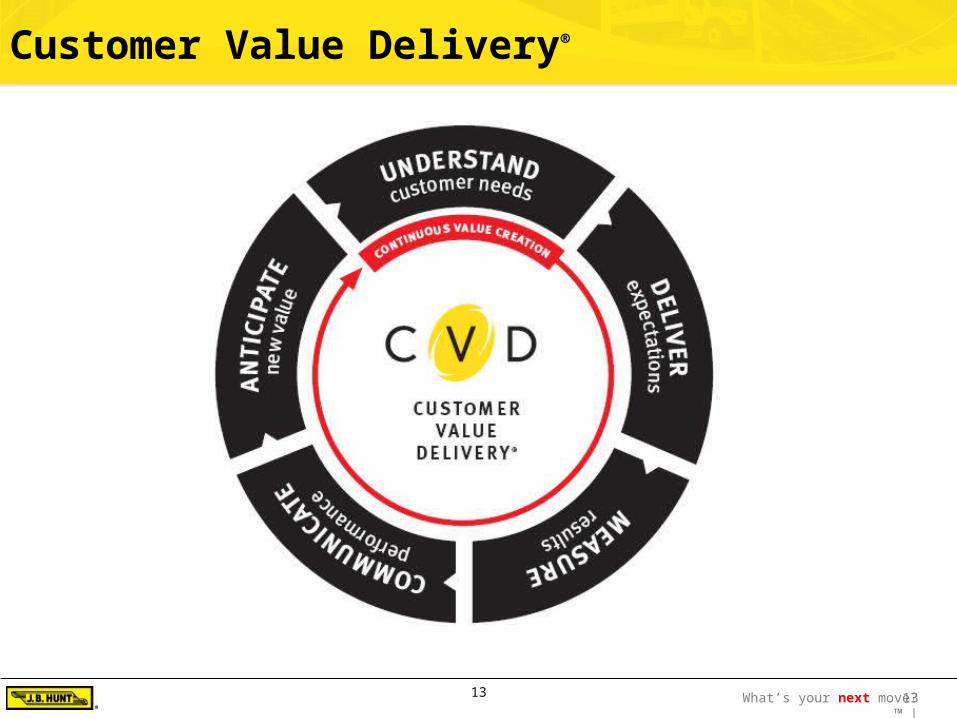
Customer Value Delivery®
13

14What’s your next move?™ |
Customer Value Delivery®
UNDERSTAND4 Cross-functional process involving sales, operations & IT groups
4 Calls and meetings scheduled to ensure a clear understanding of specific needs, connectivity and activities
4 Key performance indicators mutually identified
4 Enables a seamless startup process

15What’s your next move?™ |
Customer Value Delivery®
DELIVER4 Implementation process started
4 People, equipment, and systems placed
4 Systems connectivity finalized
4 Operations team begins executing designed solution
4 Manage exceptions

16What’s your next move?™ |
Customer Value Delivery®
MEASURE4 Award-winning technology measures performance
4 Weekly, monthly, and year-to-date intervals
4 Evaluate planned vs. actual performance
4 Review successes or issues
4 Establish priorities for continuous improvement
17What’s your next move?™ |
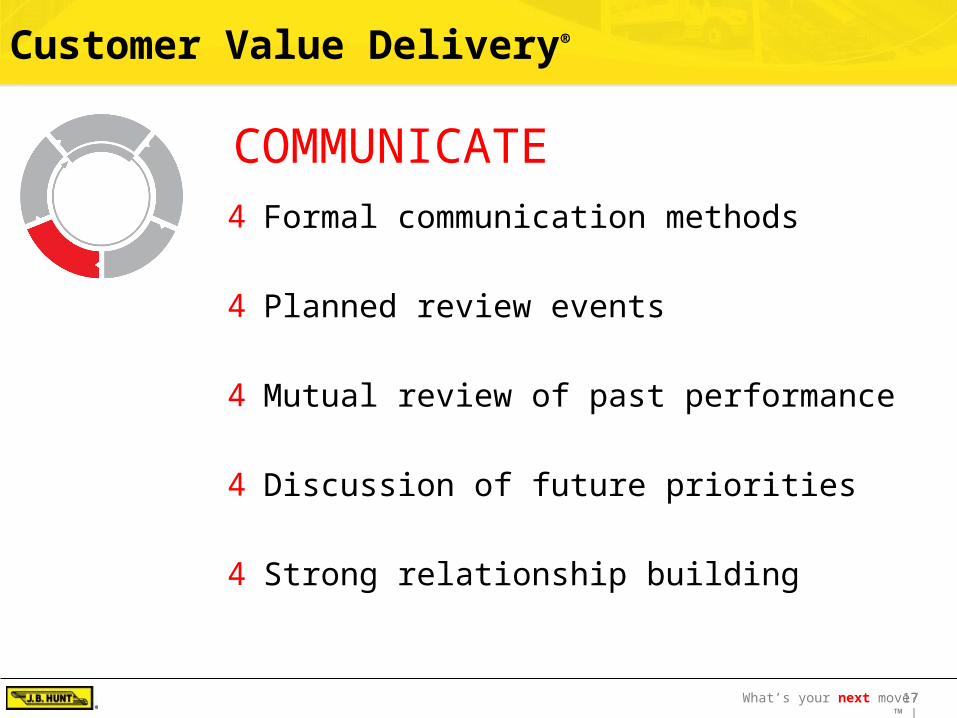
Customer Value Delivery®
COMMUNICATE4 Formal communication methods
4 Planned review events
4 Mutual review of past performance
4 Discussion of future priorities
4 Strong relationship building

18What’s your next move?™ |
Customer Value Delivery®
ANTICIPATE
4 Always seeking to improve performance
4 Create more value and control costs
4 Analysis and idea creation
4 Improve position in respective markets

What’s your next move?™
SINGLE SOURCE • INTERMODAL • DEDICATED • FINAL MILE • TRUCKLOAD • LESS THAN TRUCKLOAD • REFRIGERATED • FLATBED • EXPEDITED
ConnectivityWhat’s your next move?

20What’s your next move?™ |
Information Technology Overview
4Award-Winningh 350 internal technology employeesh 40+ industrial engineersh 40+ offshore developersh Premier 100 Leader – Kay Palmer, CIOh Premier 100 Leader – Tracy Black, SVP IT
4Differentiatorsh Handheld Technologyh Full feature “in-cab” systemsh State of the art call center technologyh Proprietary optimization technology (ETP)h Best-in-class safety technologiesh Complete carrier management
4Complete system integrationh Proven integration with3rd Parties (SAP, Oracle, etc...)h Internet enabled self-service support (myJBHunt)h Web services and automation to integrate corporate web sitesh EDI and XML supports large volume data exchange
CRM Software
Most Innovative Third Party Service Provider
21What’s your next move?™ |
TMS Customers

What’s your next move?™
SINGLE SOURCE • INTERMODAL • DEDICATED • FINAL MILE • TRUCKLOAD • LESS THAN TRUCKLOAD • REFRIGERATED • FLATBED • EXPEDITED
Critical TMS ComponentsWhat’s your next move?

23What’s your next move?™ |
Our System
Manage Freight-Tender-Optimize-Appointment Scheduling
-Track & Trace
Manage Carriers-Tender -Status - Invoicing
Manage Drivers -Safety-Directions-Fueling
Analysis
Contract Management
Rate Publication
Spot Quote Management
Routing Guide
Perfect Invoice-Auto Pay
Freight Charge Calculation
Freight Payment Interface
Reporting-KPI Reporting-Cost Analysis-Carrier Turndown-Mode Conversion-Routing Guide Compliance
-Data Storage-Proof of Delivery
Shipment Consolidation
Routing & Scheduling
Mode Selection -LTL-Multi-stop TL-Dedicated Fleet- Intermodal-Truck
Carrier Selection
Optimization

24What’s your next move?™ |
Modeling and Optimization Capabilities
4 Enterprise Transportation Planning (ETP)h Consolidate Shipmentsh Route and scheduleh Select best mode
4 LTL4 Multi-stop TL4 Dedicated fleet4 Intermodal4 Truck4 Other
h Select Best Carrierh Subject to service and other constraints
4 Best-in-Class Optimization Technology
Planning
25What’s your next move?™ |
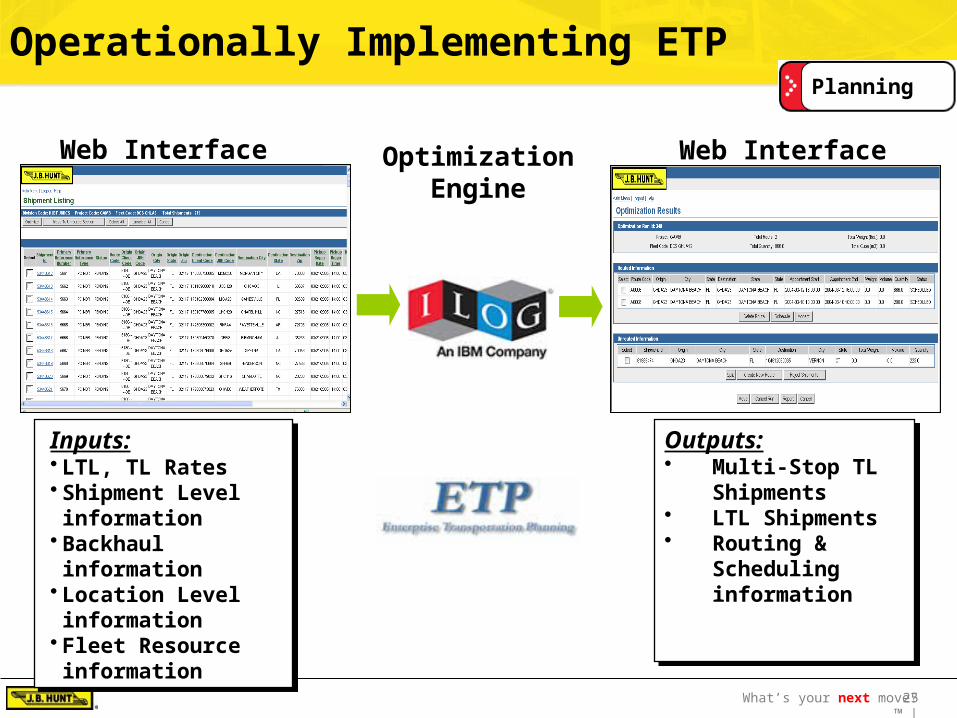
Operationally Implementing ETP
Inputs:• LTL, TL Rates• Shipment Level
information• Backhaul information• Location Level
information• Fleet Resource
information
Inputs:• LTL, TL Rates• Shipment Level
information• Backhaul information• Location Level
information• Fleet Resource
information
Outputs:• Multi-Stop TL
Shipments• LTL Shipments• Routing &
Scheduling information
Outputs:• Multi-Stop TL
Shipments• LTL Shipments• Routing &
Scheduling information
Web Interface Web InterfaceOptimization Engine
Planning

26What’s your next move?™ |
Example – Mode Optimization, Truck to Intermodal Conv.
4 Results:hA large retailer significantly converted their truck volume to intermodalhCarbon savings and transportation cost savings always move together
OTR IM OTR IMLoads 1,701 12,810 1,681 19,084
Avg LOH 468 1,737 426 1,452Point to Point Miles 795,000 22.23MM 716,000 27.7MM
Tonnes CO2e 1,725 25,167 1,583 30,876
Total CO2e Carbon Savings 0 18,425 0 24,229
Total footprint redution %
2007 2008
32,45926,892
43%41%
4 Approach:hLeverage 20 yrs of Intermodal Exp.
4 Network understanding4 Service and schedules understanding4 Intermodal economics
hOptimize for low-cost solution4 Meeting service requirements
Planning

27What’s your next move?™ |
Example – Multi-Stop TL Routing and LTL Consolidation
Data Detail4 606 shippers/receivers4 Shipment data:
MONTH Shipments WEIGHT
Sep 07 588 11,879,205
Oct 07 759 15,251,076
Nov 07 722 13,639,369
Dec 07 677 13,649,556
Jan 08 774 14,996,096
Feb 08 691 13,842,830
Mar 08 667 13,847,616
Apr 08 664 13,381,047
May 08 611 11,857,716
Jun 08 564 11,361,615
Jul 08 520 9,854,582
Aug 08 511 10,092,189
TOTAL 7748 153,652,897
Planning

28What’s your next move?™ |
Web Portal – Routing/Transit Guide
4 Displays available transit modes and costs:h LTLh Dry Vanh Intermodal
4 Calculates transit times
Lane Optimization & Mode SelectionProcurement

29What’s your next move?™ |
Rating & Publication System
4 Customer specific rate publication systemh Point to Pointh Zip to Ziph Zip Rangeh State to Stateh Backup Matricesh Accessorialsh Contracted time periods
Procurement

30What’s your next move?™ |
Streamlined Menu Quick Track Automatic Notifications Logon As External User (web based) J.B. Hunt Transport News Quick Reports Customized Reports Online Forms Quick Links
Detailed list of loads-delivered, scheduled, in progress, history
View and print documents as needed (POD, Invoices)
Design custom reports that meet your individual needs.
Create automated notifications to stay informed.
Access to updated J.B. Hunt documentation, information and services
Internet Enabled Self ServiceExecution

31What’s your next move?™ |
Auto-Tendering Capabilities
Internet, Spreadsheet, and EDI Load Tendering
EDI Load Tender Data StreamISA*00* *00* *14*098630254OMD *ZZ*HJCS1 *070726*0438*U*00301*000098507*0*P*> GS*SM*098630254OMD*HJCS1*070726*0438*98506*X*003040 ST*204*001857615 B2**HJCS****11285856**DF B2A*00*LT G62*BB*070726*W*0418*LT G62*10*070731*U*0700*LT R3*HJCS*B**J S5*1*CL LAD*PLT*25*L*50922***ON*0000025021 N9*QN*001 N9*IA*TIER4 N9*CO*0000025021 G62*69*070731*U*1400*LT N1*SF*ST. LOUIS MO*92*52400 S5*2*CU LAD*PLT*25*L*50922***ON*0000025021 N9*QN*002
Execution

32What’s your next move?™ |
Shipment ConsolidationExecution

33What’s your next move?™ |
LTL Consolidation – Basic Structure
ConsolidationLocation
Shipper #1 Receiver #1
Receiver #2
Receiver #3
2
OTR (ICS / JBT)
Teams
ConsolidationLocation
Intermodal
Shipper #2
Shipper #3
Step 1:
LTL Pickup
Step 2:
Cross Dock
Step 3:
Line Haul
Step 4:
Cross Dock
Step 5:
LTL Delivery
Execution

34What’s your next move?™ |
Best In Class Load Management
4 Dynamic Carrier Selection4 Automated Freight Charges
h Line Haulh Fuel Surchargeh Accessorial Management
4 Load Tender and Trace4 Dynamic Planning4 Monitoring Options
Execution

35What’s your next move?™ |
Best In Class Carrier Tools
4 Proprietary Routingh Customer Establishedh Hunt Established
4 Fully Integrated CMSh Carrier Contacth Payment Optionsh Insurance & Safety Data
4 Automated Uplink With DOT
4 Fully Staffed Carrier Relations Department
4 Carrier Communications
Execution

36What’s your next move?™ |
Supply Chain Visibility
4 On-Time performance is measured daily, weekly and monthly
4 Appointment reset actions are tracked by category
4 The customer report card identifies key performance metrics by customer and facility
4 Real-time load monitoring
Execution

37What’s your next move?™ |
Perfect Invoice
4 Rating engine4 Invoice processing4 Payment processing4 Claims Management4 Financial Reporting
Settlement

38What’s your next move?™ |
Reporting and Analysis
MM_ YYYY MODE COST MODE COST $ %
LTL $ 91,404 LTL $ 17,313
TL $ 805,389 TL $ 813,255 $ 896,793 $ 830,569 66,225$ 7%
LTL $ 54,158 LTL $ 5,735
TL $ 658,017 TL $ 676,445 $ 712,175 $ 682,180 29,995$ 4%
LTL $ 45,093 LTL $ 7,615
TL $ 747,241 TL $ 747,486 $ 792,334 $ 755,102 37,232$ 5%
LTL $ 34,483 LTL $ 1,469
TL $ 662,473 TL $ 678,083 $ 696,957 $ 679,553 17,404$ 2%
LTL $ 33,575 LTL $ 6,544
TL $ 745,473 TL $ 753,418 $ 779,049 $ 759,963 19,086$ 2%
LTL $ 23,654 LTL $ 1,273
TL $ 666,264 TL $ 677,016 $ 689,918 $ 678,289 11,628$ 2%
LTL $ 37,633 LTL $ 13,139
TL $ 756,796 TL $ 751,068 $ 794,430 $ 764,207 30,223$ 4%
LTL $ 21,282 LTL $ 9,280
TL $ 613,688 TL $ 616,285 $ 634,970 $ 625,565 9,405$ 1%
LTL $ 28,420 LTL $ 4,571
TL $ 603,202 TL $ 617,190 $ 631,622 $ 621,761 9,861$ 2%
LTL $ 45,074 LTL $ 11,437
TL $ 620,596 TL $ 639,297 $ 665,670 $ 650,734 14,936$ 2%
LTL $ 32,006 LTL $ 5,949
TL $ 580,742 TL $ 591,054 $ 612,748 $ 597,004 15,744$ 3%
LTL $ 28,004 LTL $ 6,034
TL $ 605,749 TL $ 620,855 $ 633,753 $ 626,890 6,863$ 1%
SUMMARY $ 8,540,418 $ 8,271,815 268,603$ 3%
ACTUAL OPTIMAL SAVINGS
J an-08
Feb-08
Mar-08
Apr-08
May-08
Oct-08
Nov-08
Dec-08
J un-08
J ul-08
Aug-08
Sep-08
Settlement
h Optimization Savings:
h Spend Trends:
h Rate Benchmarking:
39What’s your next move?™ |
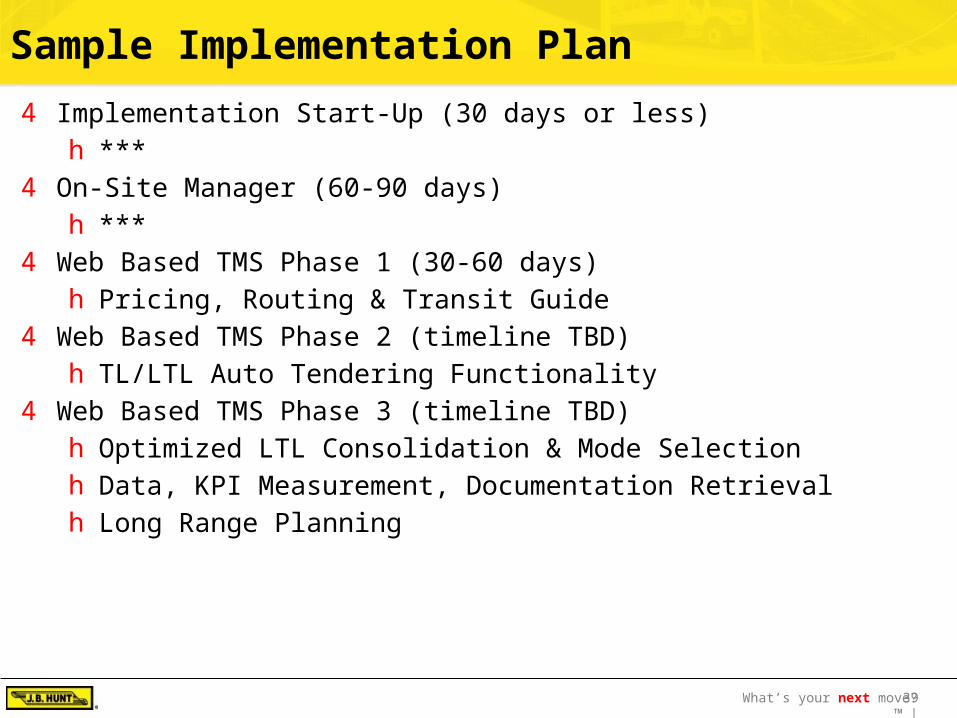
Sample Implementation Plan
4 Implementation Start-Up (30 days or less)h ***
4 On-Site Manager (60-90 days)h ***
4 Web Based TMS Phase 1 (30-60 days)h Pricing, Routing & Transit Guide
4 Web Based TMS Phase 2 (timeline TBD)h TL/LTL Auto Tendering Functionality
4 Web Based TMS Phase 3 (timeline TBD)h Optimized LTL Consolidation & Mode Selectionh Data, KPI Measurement, Documentation Retrievalh Long Range Planning

40What’s your next move?™ |
What’s your next move?