Single Molecules, Cells, and Super-Resolution Optics
46
Eric Betzig Janelia Research Campus, HHMI Single Molecules, Cells, and Super-Resolution Optics 1992 2014 1993 1994 1 9 9 5 2006 2007 2008
Transcript of Single Molecules, Cells, and Super-Resolution Optics

Eric BetzigJanelia Research Campus, HHMI
Single Molecules, Cells, and Super-Resolution Optics
1992
2014
1993
1994
1995
20062007
2008

Cornell and the Beginnings of Near-Field Optical Microscopy
Mike Isaacson and his STEM Me, Alec Harootunian, and Aaron Lewis, 1983
A. Lewis, et al., Ultramicroscopy 13,
227 (1984)
concept

The Long History of Breaking Abbe’s Law: Near-Field
E.A. Ash, G. Nicholls, Nature 237, 510 (1972)
Sir Eric Ash
Edward “Hutchie” Synge, Phil. Mag. 6,
356 (1928)
J.A. O’Keefe (1956)
A.V. Baez (acoustics, 1956)
C.W. McCutchen (1967)
U. Ch. Fischer (lithography, 1981)
D.W. Pohl (1984)
G.A. Massey (1984)
J. Wessel (1985)
one wavelength
near-field microwave ( = 3 cm) microscopy
object image
Resolution of 1/60 of the wavelength!
sub-wavelength aperture

The Long History of Breaking Abbe’s Law: Far-Field
A. Bachl, W. Lukosz, JOSA 57, 163 (1967)
W. Lukosz, JOSA 56, 1463 (1966)
Structured Light Nonlinear Interaction with Sample
integrated circuit linewidth control
A Priori Information: wafer inspection
Resolution 3beyond Abbe’s
Limit!
test pattern, conventional
test pattern, super-resolved
nominal exposure
intentional overexposure
Sir Eric Ash

Making Near-field Optical Microscopy Work
Me, Alec Harootunian, and Aaron Lewis, 1983Edwin Neher and Bert Sakmann, Nobel 1991
patch clamp: single ion channel recording
E. Betzig, et al., Biophys. J. 49, 269 (1986)
end of aluminum coated pipette
50 nm aperture

Making Near-field Optical Microscopy Work
my near-field scanning optical microscope (NSOM)
microscope control room
diffraction limited
NSOM
NSOM

AT&T Bell Labs, Murray Hill, NJ
Initial Struggles at Bell Labs
Horst Störmer, 1998 Nobel in Physics
TE11
TM01
TE21
retroreflection in pipette
lowest order waveguide modes at tip

Making NSOM Routine
E. Betzig, J.K. Trautman, et al., Science 251, 1468 (1991)
adiabatically tapered optical fiber probe shear force distance regulation
E. Betzig, et al., Appl. Phys. Lett.60, 2484 (1992)
SEM widefield NSOM
1 m
Jay Trautman

The Golden Age of NSOM
2 m
photolithography
high density data storage
1 m
J. Hwang, et al., Science 270, 610 (1995)
10 mN/m 20 mN/m 30 mN/m
fluorescence: phase change in phospholipid monolayers
histological section, monkey hippocampus
nanoscale spectroscopic imaging
E. Betzig, J.K. Trautman, Science 257, 189 (1992)
E. Betzig, et al., Appl. Phys. Lett. 61, 142 (1992)
x
H.F. Hess, et al., Science 61, 142 (1994)

Single Molecule Detection (SMD)
NSOMwidefield
2 m
E. Betzig, et al., Bioimaging 1, 129 (1993)
fluorescence: actin, mouse fibroblast cell
single molecule absorption spectra, 1.6K
W.E. Moerner, L. Kador, Phys. Rev. Lett. 62, 2535
(1989)
M. Orrit, J. Bernard, Phys. Rev. Lett. 65,
2716 (1990)
W.E. Moerner
SM fluorescence excitation spectrum, 1.8K
Michel Orrit
SM fluorescence bursts at room temp
E.B. Shera, et al., Chem. Phys. Lett 174, 553 (1990)
Time gated:
R. Rigler, J. Widengren, Bioscience 3, 180
(1990)
FCS:
Nobel, 2014

NSOM and the Birth of Single Molecule Microscopy
Rob Chichester
random
single molecule fluorescence anisotropy
500 nm
diI-C18-(3) molecules on
PMMA
E. Betzig, R.J. Chichester, Science 262, 1422 (1993)
Horst Störmer
2D1D
single molecule NSOM signal 2
( ) E x p

NSOM and the Birth of Single Molecule Microscopy
Rob Chichester
random
single molecule fluorescence anisotropy
500 nm
diI-C18-(3) molecules on
PMMA
E. Betzig, R.J. Chichester, Science 262, 1422 (1993)
E fields at aperture: theory vs. experimentHans Bethe, 1967 Nobel in Physics
H.A. Bethe, Phys. Rev. 66, 163 (1944)
2xE
2yE
2zE
/ 0.1z a / 0.2z a / 0.4z a / 0.8z a data
200 nm

NSOM and the Birth of Single Molecule Microscopy
Rob Chichester
random
single molecule fluorescence anisotropy
500 nm
diI-C18-(3) molecules on
PMMA
E. Betzig, R.J. Chichester, Science 262, 1422 (1993)
single molecule dipole orientations first imaging of single molecules at
room temp
first super-resolution imaging of single
molecules
first measurement of single molecule
dipole orientations
first localization of single molecules to
fraction of PSF width (12 nm xy, 6 nm z)

Harald Hess
Cryogenic Near-field Spectroscopy
Harald’s low temp STM
scanning tunnel spectroscopy of Abrikosov flux lattice in NbSe2
Alexei Abrikosov, 2003 Nobel in Physics
H.F. Hess, et al., Phys. Rev. Lett. 62, 1691 (1989)

Harald Hess
Cryogenic Near-field Spectroscopy
Harald’s low temp STM
Alferov & Kroemer, 2000 Nobel in Physics
NSOM fiber probe
GaAs / AlGaAs multiple
quantum well
semiconductor laser diode

Cryogenic Near-field Spectroscopy
H.F. Hess, E. Betzig, et al., Science 264, 1740 (1994)
isolation of discrete sites in x,y, space
single exciton transitions, 23Å quantum well, 2°K
1 m
exciton recombination sitesscrolling from = 700 to = 730 nm
exciton energy variations due to interface roughness
single exciton transitions, 23Å quantum well, 2°K
quantum well

My First Mid-Life Crisis
NSOM engineering limitations:
poor yield during manufacture
fragile probes
weak signals
probe tips get hot
probe perturbs fields at sample
complex contrast mechanisms
nonlinear image formation - artifacts
NSOM fundamental limitations:
the near-field is VERY, VERY short
z = 0 nm z = 5 nm z = 10 nm
z = 25 nm z = 100 nm z = 400 nm
large probe tip (0.25 m)
E. Betzig, J.K. Trautman, Science 257, 189 (1992)
Cells aren’t flat!
3D lattice light sheet microscopy, D. Mullins, T. Ferrin, E. Betzig, et al.
topographical artifacts

My First Mid-Life Crisis
probe perturbs fields at sample
complex contrast mechanisms
nonlinear image formation - artifacts
NSOM fundamental limitations:
the near-field is very, very short
z = 0 nm z = 5 nm z = 10 nm
z = 25 nm z = 100 nm z = 400 nm
E. Betzig, J.K. Trautman, Science 257, 189 (1992)
me and Harald, 1989
me and Harald, 1994

Multidimensional Localization Microscopy
original image
higher dimensional
isolation
localization
A.M. van Oijen, et al., JOSA A16, 909 (1999)
spectral isolation
Photobleaching: X. Qu, et al., PNAS 101, 11298 (2004)
M.P. Gordo, et al., PNAS 101, 6462 (2004)
Lifetime: M. Heilemann, et al., Anal. Chem. 74, 3511 (2002)
Blinking: K.A. Lidke, et al., Opt. Express 13, 7052 (2005)

Spatial Resolution and the Nyquist Criterion
Image Dimensionality
1D
2D
25
500
2.9 x 10⁴
Molecules Required per Diffraction Limited Region for 20 nm Resolution
20 samples / period
2 samples / period
Sampling interval must be at least twice as fine as the desired resolution
Nyquist criterion:initial molecular density
2 µm
4 greater molecular density
Diffraction Limited Region: 0.25 m dia, 0.6 m long
3D

And Now for Something Completely Different
Flexible Adaptive Servohydraulic Technology (FAST)
• moves 4000 kg load at 8g acceleration
• positioning precision to 5 µm
Robert Betzig

My Second Mid-Life Crisis

Searching for a New Direction
me in Joshua Tree National Park
me in Oahu, Hawaii
Harald in Sedona, Arizona
Harald in Yosemite National Park

Fluorescent Proteins Revolutionize Biological Imaging
Shimomura, Chalfie, & Tsien 2008: Chemistry Nobel1994: green fluorescent protein
microtubule ends endoplasmic reticulum golgi (green), mitochondria (red)

Switching Behavior in Green Fluorescent Protein
H. Yokoe, T. Meyer, Nat. Biotech. 14, 909 (1996)
before PA after PA
in vivo UV photoactivation (PA) of wtGFP488 nm absorption increase under 398
nm illumination
proposed mechanism
M. Chattoraj, et al., PNAS 93, 8362 (1996)
R.M. Dickson, et al., Nature 388, 355 (1997)
photoactivation energy diagram
W.E. Moerner, 2014 Nobel in Chemistry

Directed Mutagenesis of Photoactivated Fluorescent Proteins (PA-FPs)
Jennifer Lippincott-Schwartz
George Patterson
G.H. Patterson, J. Lippincott-Schwartz, Science 297, 1873 (2002)
increased on/off contrast of PA-GFP
pulse chase: nuclear vs cytosolic diffusion

A Fateful Trip
Greg Boebinger National High Magnetic Field Lab
Mike Davidson Neckties
website tutorials
Olympus
Zeiss
Nikon
Tallahassee, Florida

Finding the Missing Link
time
E. Betzig, et al., Science 313, 1642 (2006)

La Jolla Labs
me

Assembling the Rest of the Team
Rob Tycko, NIDDK
Jennifer Lippincott-Schwartz
George Patterson
the microscope in the darkroom in Jennifer’s lab

single molecule frames integrated image PALM image
0.5 m
Photoactivated Localization Microscopy (PALM)
lysosomes, COS-7 cell, Kaede-tagged CD63
80 nm cryosection: • low autofluorescence
• immobile PA-FPs
• image internal organelles
0.5 sec/frame
E. Betzig, et al., Science 313, 1642 (2006)

0.5 m
TIRF PALM
lysosomes, COS-7 cell, Kaede-tagged CD63
20,000 frames
51,736 molecules
E. Betzig, et al., Science 313, 1642 (2006)
Photoactivated Localization Microscopy (PALM)

A High On/Off Contrast Ratio is Essential for High Resolution
EosFP > 2000:1 PA-GFP < 75:1
diffraction limited TIRF
caged Q-rhodamine, > 1000:1
paxillin, focal adhesions
E. Betzig, et al., Science313, 1642 (2006)
Eos FP and caged Q-rhodamine support Nyquist-defined sub-20 nm
resolution
time

From Rags to Riches, Thanks to HHMI
Janelia Research Campus The Boss: Gerry RubinEndless Coffee
my PALMHari Shroff
Harald’s iPALMGleb Shtengel

PALM Application Examples
Chemotaxis Receptors in E. coli
D. Greenfield,et al., PLoS Biol. 7, 137 (2009)
Actin Polymerization
in Dendritic Spines
N. Frost, et al., Neuron 67, 86 (2010)
cell boundary
focal adhesions
Two-Color Imaging of Focal Adhesion Proteins
conventional
PALM
H. Shroff, et al., PNAS 104, 20308 (2007)
Regulation of Gene Expression During
Myogenesis
J. Yao, et al., Genes Dev. 25, 569 (2011)
1 μm
Hari Shroff

iPALM: Ultrasensitive PALM in 3D
iPALM schematic
P. Kanchanawong, et al., Nature 468, 580 (2010)
vertical architecture of
adhesions
HaraldHess
single focal adhesion
iPALM xz view
three phase single molecule interferometry
?
S.B. Van Engelenburg, et al., Science 343, 653 (2014)
ESCRT machinery at HIV budding sites

500 nm
B.G. Kopek, et al., PNAS, 109, 6136 (2012)
50
iPALM
3D TEMtomogram
Overlaid
iPALM –
TEM
0.5
micron
K. Sochaki, et. al, Nat. Methods, 11 305 (2014)
3D correlative EM/PALMmitochondria (B&W – FIB SEM)
mitochondrial DNA (red - iPALM)
cell membrane (B&W - TEM) & clathrin (color - iPALM)
first correlative EM with super-resolution:
mitochondria
E. Betzig, et al., Science313, 1642 (2006)
Correlative Electron Microscopy and PALM
scrolling plane-by-plane thru 3D

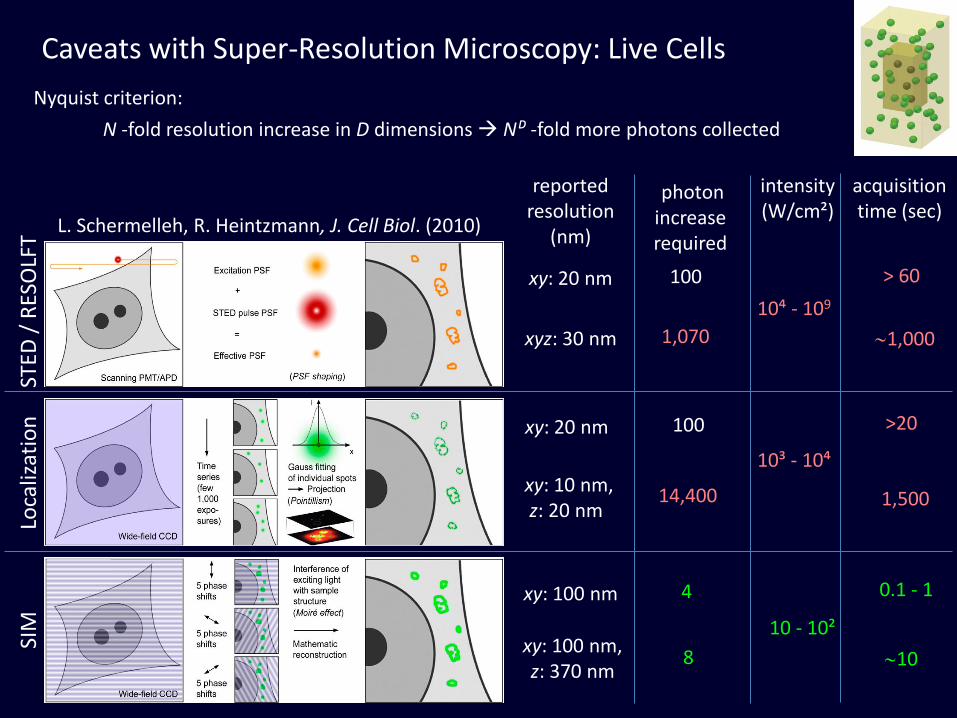
Caveats with Super-Resolution Microscopy: Fixed Cells
extremely high labeling densities required
fixation artifacts, endoplasmic reticulum
live cell fixedoverexpressed
physiologically expressed
overexpression of protein
initial density 4x higher densityexogenous dyes: limited affinity & high background

Particle Averaging Improves Resolution of Stereotypic Structures
A. Szymborska, et al. Science 341, 655 (2013)
nuclear pore complex proteins
positions determined
to < 1 nm
0.5 m 0.1 m
Nup107-160 subcomplex
STED
/ R
ESO
LFT
Loca
lizat
ion
SIM
reported resolution
(nm)
intensity(W/cm²)
acquisitiontime (sec)
Nyquist criterion:
N -fold resolution increase in D dimensions Nᴰ -fold more photons collected
photon increase required
xy: 20 nm
xyz: 30 nm
xy: 20 nm
xy: 10 nm,z: 20 nm
xy: 100 nm, z: 370 nm
100
1,070
14,400
xy: 100 nm
100
4
8
10⁴ - 109
10³ - 10⁴
10 - 10²
0.1 - 1
10
>20
1,500
> 60
1,000
L. Schermelleh, R. Heintzmann, J. Cell Biol. (2010)
Caveats with Super-Resolution Microscopy: Live Cells

Live Cell Structured Microscopy
Dong Li
Lin Shao
2D SIM, 98 nm resolution0.1 sec acquisition, 1800 frames
TIRF-SIM, 82 nm resolution0.5 sec acquisition, 90 frames
Nonlinear SIM, 62 nm resolution1.5 sec acquisition, 34 frames
endoplasmic reticulum
clathrin coated pits and cortical actin
early endosomes and cortical actin
Mats Gustafsson, 1960-2011

The Challenges and Importance of Studying Live Cell Dynamics
spatial resolution
temporal resolution
photo-toxicity
imaging depth
tradeoffs, tradeoffs, tradeoffs Life is Animate
dividing HeLa cell

Lattice Light Sheet Microscopy: Non-Invasive 4D Live Cell Imaging
Bi-Chang Chen Kai WangWes Legant
B-C Chen, et al., Science 346,1257998 (2014)
concept
chromosomes, mitos, and ER during mitosis
Tetrahymena thermophila
C. elegans early embryo
T cell and its target cell

Ultra-High Density 3D Localization MicroscopyWesley Legant
widefield PAINT
A. Sharonov, R.M. Hochstrasser, PNAS 103, 18911 (2006)
Points Accumulation for Imaging in Nanoscale Topography (PAINT)
3D PAINT with lattice: dividing cell
over 300 million localized molecules
intracellular membranes,
COS-7 cell

Adaptive Optics (AO): Moving Cell Biology Away from the Cover Slip
Na Jiscattering media: mouse visual
cortex
dendritic spines, 600 m deep
AO off AO on
5 m
non-scattering media: zebrafish embryonic brain
functional imaging of neural activity, 400 m deep
Kai Wang

The Beauty and Complexity of Living Systems