Determination of Suitable Thin Layer Drying Curve Model for Apple Slices

Revue des Energies Renouvelables Vol. 10 N°2 (2007) 191 – 203
191
Single layer drying behaviour of grenade peel in a forced convective solar dryer
A. Idlimam, C.S. Ethmane Kane and M. Kouhila *
Laboratoire d’Energie Solaire et des Plantes Médicinales, Ecole Normale Supérieure, B.P. 2400, Marrakech, Maroc
(reçu le 10 Mai 2007 – accepté le 25 Juin 2007)
Abstract - Solar drying experiments in thin layer of grenade peel were conducted in forced convection solar dryer consisting of a solar air collector, an auxiliary heater and a drying cabinet. Moreover, grenade peel is sufficiently dried in the ranges of 32 °C to 36 °C of ambient air temperature, 45 to 70 °C of drying air temperature, 32 to 53 % of relative humidity, 0.028 to 0.056 m3s-1 of drying air flow rate and 200 to 950 W/m2 of daily solar radiation. The experimental drying curves show only the falling drying rate period. The main factor in controlling the drying rate was the drying air temperature. The drying rate equation is determined empirically from the characteristic drying curve. Twelve mathematical models were tested to fit the experimental data. The Midilli-Kucuk model was found to satisfactorily describe the solar drying curves. Résumé – L’écorce de grenadier est séchée dans un séchoir indirect partiellement solaire à couche mince fonctionnant en convection forcée et muni d’une source auxiliaire d’énergie. Les expériences sont réalisées pour une température ambiante variant de 32 à 36 °C, une température de séchage de 45 à 70 °C, une humidité de l’air ambiant de 32 à 53 %, un débit d’air asséchant de 0.028 à 0.056 m3s-1 et un rayonnement solaire de 200 à 950 W/m2. Les courbes de séchage ont montré l’existence seule de la phase à allure décroissante. La température de l’air asséchant est le facteur principal qui influence la cinétique de séchage. La vitesse de séchage est déterminée empiriquement à partir de la courbe caractéristique de séchage. Douze modèles mathématiques ont été utilisés pour la description des courbes de séchage. Le modèle de Midilli-Kucuk est le plus satisfaisant pour décrire les courbes de séchage de l’écorce de grenadier. Keywords: Drying kinetics - Experimental study - Grenade peel - Solar energy.
1. INTRODUCTION
The grenade is originating in Asia and famous to have therapeutic virtues. The peel, flower, leaves and fruit of grenade are used in both traditional and modern Maghrebean medicine [1, 2]. It has been cultivated for at least 5000 years in occidental Asia and in North Africa. The grenade is used commonly in persistent cough; it is effective in the event of fever, of diarrhoeas, colic and can also be used as a vermifuge. It would be used as a simulative cardiac. The strong decoction of the peel is employed for the dysentery, the fresh flowers are used against asthma and the peel is used against the tapeworm.
Solar drying is essential for preserving the agricultural products, so it is necessary to know the process of drying and storage of grenade peel. Using solar dryer, the drying time can be shortened by 65 % as compared to sun drying because inside the dryer it is warmer than outside, the quality of the dried products can be improved in terms of hygiene, cleanliness, safe moisture content, colour and taste, the product is also completely protected from rain, dust, insects and its payback period ranges from 2 to 4 years depending on the rate of utilization. The most important feature of solar dryers is that product doesn't include any kind of preservatives or other added chemical stuffs, which allows its use for people suffering from various allergic reactions from chemical conservators and other added stuffs. Further more, products aren’t exposed to any kind of harmful electromagnetic radiation or electromagnetic poles [3-6].

A. Idlimam et al.
192
Although other sources of energy, solar energy is preferred because it is abundant in Marrakech, inexhaustible and non-polluting. It can be tapped at relatively low cost and has no associated environmental dangers [3, 7].
There have been many researches on the mathematical modelling and experimental studies of the solar drying process of various vegetables, fruits and medicinal plants, such as Chenopodium ambrosioides [8, 9], grapes [10], apricots [11, 12], green pepper [13], Citrus aurantium [3], Eucalyptus [14], mint, verbena, and sage [15], pistachio [5,6], prickly pear fruit, peel and cladode [17-19], red pepper [4] and garlic slices [20]. There is no literature specific to the drying behaviour of grenade peel.
The main objectives of this study are to: study the drying kinetics of grenade peel in a convective solar dryer; determine the effect of drying air temperature and air flow rate on the drying kinetics of the
grenade peel; determine the characteristic drying curve (CDC); fit the solar drying curves with twelve mathematical models.
2. MATHEMATICAL FORMULATION
2.1 Determination of moisture ratio and dimensionless drying rate Literature provides a large number of authors [3, 14, 16, 18, 19, 21], based on the Van Meel
transformation [22], have used simply the initial moisture content ( ) with the equilibrium
moisture content ( ) and initial drying rate
0M
eM0td
Md⎟⎟⎠
⎞⎜⎜⎝
⎛− to normalize the moisture ratio and the
dimensionless drying rate {Eq. (1), (2)} as follows :
( ) ( )e0
eMMMtMtRM
−−
= (1)
0t tdMd
tdMdf ⎟⎟
⎠
⎞⎜⎜⎝
⎛−⎟⎟
⎠
⎞⎜⎜⎝
⎛−= (2)
where ( ) is the moisture ratio and (f) stands for the dimensionless drying rate. MRThe equilibrium moisture content ( ) was determined from the desorption isotherm (Fig.
1). More details about the experiments and the instruments used for determined ( ) may be found elsewhere [23]. The general form of the characteristic drying curve is given by
. Marquardt-Levenberg non-linear optimization method, using the computer program “Curve Expert 3.1” was used to find the best equation for the grenade peel characteristic drying curve [13, 14].
eM
eM
(MRff = )
Fig. 1: Desorption isotherm of grenade peel

Single layer drying behaviour of grenade peel in a forced convective solar dryer
193
2.2 Mathematical modelling of solar drying curves A review of literature revealed that the most widely used thin layer models in the drying
process of agricultural products are the semi-empirical and the empirical models [3, 5, 10, 18, 19, 24]. The solar drying curves of grenade peel were fitted with 13 different moisture ratio equations (Table 1). The correlation coefficient ( 2r ) was one of the primary criteria for selecting the best equation to describe the solar drying curves of grenade peel. In addition to ( 2r ), the various statistical parameters such as, reduced chi-square (χ2) and mean bias error (MBE) were used to determine the quality of the fit [10, 6]. These statistical parameters {Eq. (3), (4)} can be calculated as follows:
( )
nN
MRMRN
1i
2ipre,iexp,
2−
−
=χ∑= (3)
( )∑=
−=N
1iiexp,i,pre MRMR
N1EBM (4)
where stands for the iiexp,RM th experimental moisture ratio, for the ii,preRM th predicted
moisture ratio, for the number of observations, and for the number of constants. To calculate the coefficients of each model and to determine the suitable model for describing the drying curves, Marquardt-Levenberg non linear optimisation method, using the computer program “Curve Expert 3.1” was applied.
N n
Table 1: Mathematical models applied to the solar drying curves
Model name Model equation Ref.
Newton ( )tkexpRM −= [16]
Page ( )ntkexpRM −= [16]
Modified Page1 ( )( )ntkexpRM −= [5]
Modified Page2 ( )( )ntkexpRM −= [5]
Henderson and Pabis ( )tkexpaRM −= [10] Logarithmic ( ) ctkexpaRM +−= [12] Two-term ( ) ( )tkexpbtkexpaRM 10 −+−= [16] Two-term exponential ( ) ( ) ( )takexpa1tkexpaRM −−+−= [16] Diffusion approach ( ) ( ) ( )tbkexpa1tkexpaRM −−+−= [10] Modified Henderson and Pabis
( ) ( ) ( )tkexpctkexpbtkexpaRM 10 −+−+−= [20]
Verma et al. ( ) ( ) ( )tkexpa1tkexpaRM 0−−+−= [20]
Midilli-Kucuk ( ) tbtkexpaRM n +−= [24]
3. EXPERIMENTAL SET-UP AND PROCEDURE
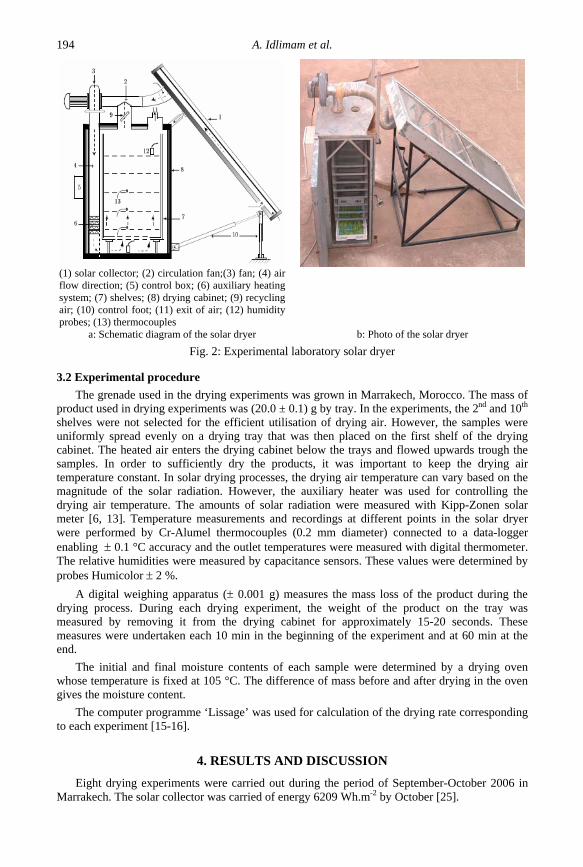
3.1 Experimental set-up The experimental apparatus consists of an indirect forced convection solar dryer with a solar
air collector, an auxiliary heater, a circulation fan and a drying cabinet as shown in Fig. 2. It was described in detail in references [3, 14, 15, 17, 18, 19 & 23].
A. Idlimam et al.
194
(1) solar collector; (2) circulation fan;(3) fan; (4) air flow direction; (5) control box; (6) auxiliary heating system; (7) shelves; (8) drying cabinet; (9) recycling air; (10) control foot; (11) exit of air; (12) humidity probes; (13) thermocouples
a: Schematic diagram of the solar dryer b: Photo of the solar dryer Fig. 2: Experimental laboratory solar dryer
3.2 Experimental procedure The grenade used in the drying experiments was grown in Marrakech, Morocco. The mass of
product used in drying experiments was (20.0 ± 0.1) g by tray. In the experiments, the 2nd and 10th shelves were not selected for the efficient utilisation of drying air. However, the samples were uniformly spread evenly on a drying tray that was then placed on the first shelf of the drying cabinet. The heated air enters the drying cabinet below the trays and flowed upwards trough the samples. In order to sufficiently dry the products, it was important to keep the drying air temperature constant. In solar drying processes, the drying air temperature can vary based on the magnitude of the solar radiation. However, the auxiliary heater was used for controlling the drying air temperature. The amounts of solar radiation were measured with Kipp-Zonen solar meter [6, 13]. Temperature measurements and recordings at different points in the solar dryer were performed by Cr-Alumel thermocouples (0.2 mm diameter) connected to a data-logger enabling ± 0.1 °C accuracy and the outlet temperatures were measured with digital thermometer. The relative humidities were measured by capacitance sensors. These values were determined by probes Humicolor ± 2 %.
A digital weighing apparatus (± 0.001 g) measures the mass loss of the product during the drying process. During each drying experiment, the weight of the product on the tray was measured by removing it from the drying cabinet for approximately 15-20 seconds. These measures were undertaken each 10 min in the beginning of the experiment and at 60 min at the end.
The initial and final moisture contents of each sample were determined by a drying oven whose temperature is fixed at 105 °C. The difference of mass before and after drying in the oven gives the moisture content.
The computer programme ‘Lissage’ was used for calculation of the drying rate corresponding to each experiment [15-16].
4. RESULTS AND DISCUSSION Eight drying experiments were carried out during the period of September-October 2006 in
Marrakech. The solar collector was carried of energy 6209 Wh.m-2 by October [25].

Single layer drying behaviour of grenade peel in a forced convective solar dryer
195
During the experiments, ambient air temperature ranged from 25 to 35 °C, ambient air relative humidity from 32 to 53 %, drying air temperature from 45 to 70°C, and drying air flow rate from 0.028 m3s-1 to 0.056 m3s-1. Table 2 shows the drying conditions during experiments in the solar dryer.
Table 2: Drying conditions during experiments in the convective solar dryer Experiment
number vD (m3s-1) 1.0T ± (°C) 2Rh ± (%) t (min)
1 0.028 45 38.9 437 2 0.028 50 50.4 368 3 0.028 60 53.1 264 4 0.028 70 37.6 95 5 0.056 45 50.6 285 6 0.056 50 35.5 193 7 0.056 60 32.2 100 8 0.056 70 48.1 55
4.1 Drying curves Figs. 3 and 4 represent the moisture content versus drying time and the drying rate versus
moisture ratio, respectively. These figures shows that there is an absence of phase 0, the increasing drying rate period, where the temperature of the product is increased without any substantial loss of water, and phase 1, the constant drying rate period. There is only the presence of the falling drying rate period (phase 2). These results are in agreement with the drying literature [3, 8, 10, 11, 14].
Fig. 3: Variation of moisture content as a
function of drying time Fig. 4: Variation of drying rate as a function of
moisture ratio for different drying air conditions
The drying air conditions have an important influence on the rate of these curves. At constant drying air flow rate, the change in the drying rate versus drying time is shown in Fig. 5. It was apparent that drying rate decreased continuously with drying time. The drying rate increased with increase in the drying air temperature and the highest values of drying rate were obtained in the experiment eight (T = 70 °C and Dv = 0.056 m3s-1). The results indicated that diffusion is the most likely physical mechanism governing moisture movement in the grenade peel. The phase 0 disappears when the product is compact or in leaves and that the constant drying rate period (phase 1) is not observed in several biological products [3, 8, 14, 17, 18, 19]. Drying during the falling drying rate period is thus governed by water diffusion in the solid. This is complex mechanism involving water in both liquid and vapour states, which is very often characterized by a so-called effective diffusivity [11].

A. Idlimam et al.
196
Fig. 5: Influence of drying air temperature on drying rate of grenade peel
During the falling drying rate period, at constant drying air flow rate, the drying rate increased with the increase in drying air temperature and drying time decreased with the increase in drying air temperature (Fig. 5). It was observed that the main factor influencing the drying kinetics is the drying air temperature, as noted in other studies on various food products [11, 14, 16, 21]. Thus, a higher air temperature produced a higher drying rate and consequently the drying time decreased. This is due to the increase of the air heat supply rate to the product and the acceleration of water migration inside the grenade peel.
Similarly, at constant drying air temperature, the drying rate increased with the increase in drying air flow rate and consequently the drying time decreased with the increase in drying air flow rate (Fig. 6). Thus, a higher drying air flow rate produced a higher drying rate and consequently the drying time decreased but the drying rate does not vary much as a function of air flow rate. This influence is less important than the drying air temperature [14, 17-19].
Fig. 6: Influence of drying air flow rate on drying rate of grenade peel
4.2 Characteristic drying curve Fig. 7 representing dimensionless drying rate f versus the moisture ratio MR shows that all
solar drying curves obtained for the different tested conditions, fall into a tight band, indicating that the effect of variation in different conditions is small over the range tested. A polynomial model was found to fit the best the experimental data of the grenade peel.
432 RM0291.1RM6066.2RM4288.1RM8546.00489.0f −+−+= (5)
The criteria used to evaluate goodness of fit was the standard error ( 764.0SE = ) and the
correlation coefficient ( ). 945.0r2 =

Single layer drying behaviour of grenade peel in a forced convective solar dryer
197
4.3 Fitting of the drying curves The drying data as moisture ratio MR versus drying time were fitted to the 13 single layer
drying models (Table 1). The drying model coefficients were determined and presented in Tables 3 and 4.
Fig. 7: Characteristic drying curve of grenade peel
The results have shown that the highest values of r2 and the lowest values of could be
obtained with the Midilli-Kucuk drying model. Generally
2χ2r and values varied between
0.9731 and 0.9999, 5.27 10
2χ-3 and 7.6 10-6, respectively. The Midilli-Kucuk equation {Eq. (6)} is
the appropriate model to describe thin layer drying curves of grenade peel with and
. The performance of the model at different drying air temperatures and drying air flow rates was illustrated in Fig. 8. The predicted data generally banded around the straight line which showed the Midilli-Kucuk mathematical model in describing drying behaviour of grenade peel. The coefficients of the accepted model for the convective solar drying of grenade peel were determined {Eqs. (7-10)}. These coefficients depend on the drying air temperature.
1r2 ≅62 106.7 −=χ
Fig. 8: Experimental and predicted Midilli-Kucuk model moisture ratio values for different drying air conditions
( ) tbtkexpaRM n +−= (6)
Where: 362 T1078.5T8405.9T0551.00158.0a −+−+−= (7)

A. Idlimam et al.
198
3624 T1073.4T1099.7T0451.08267.0k −− +−+−= (8)
352 T1080.9T0171.0T9762.02036.12n −−+−= (9)
38264 T1073.7T1026.7T1043.10014.0b −−− −+−−= (10)
The four expressions {Eqs. (7-10)} predicted the moisture ratio ( ) well at four drying
temperatures 45, 50, 60, and 70 °C for the grenade peel with an
RM2r of 1 and S of 0. E
These results can be proved consequently from Fig. 9 which plotted Midilli-Kucuk predicted moisture ratios versus drying time at 45, 50, 60, and 70 °C. Also from this figure, it can be concluded that the predicted moisture ratio decreased with increase in the drying air temperature and consequently the drying time decreased.
Accordingly, it can be concluded that the Midilli-Kucuk drying model described adequately the drying behaviour of grenade peel in the forced convection solar drying process in a temperature range 45-70 °C, and drying air flow rates (0.028 m3s-1 and 0.056 m3s-1).
Fig. 9: Influence of drying air temperature on experimental and predicted moisture ratios
Figure 10 illustrates the photos of fresh grenade and dried grenade peel at T = 60 °C and . 13
v sm056.0D −=
a: Fresh grenade b: Dried grenade peel at
T = 60 °C and Dv=0.056 m3s-1
Fig 10: Fresh and dried grenade peel

Single layer drying behaviour of grenade peel in a forced convective solar dryer
199
5. CONCLUSION The following results may be drawn from the drying kinetics of grenade peel (Fig. 10) in a
single layer convective solar dryer functioning under Marrakech prevailing conditions. From the experimental drying curves obtained, it was observed that only the falling drying rate period existed and the drying air temperature was the main factor influencing the drying kinetics of grenade peel. The characteristic drying curve was obtained and the drying rate equation was determined empirically.
According to the results of the multiple linear regression analysis, among twelve thin layer drying models tested, the Midilli-Kucuk model was found to be the most suitable for describing the solar drying curves of grenade peel with a correlation coefficient and . The drying parameters ,
1r2 ≅ 62 106.7 −=χ
a k , and b in Midilli-Kucuk's equation can be expressed as a linear
function of the temperature with an
n2r of 1 and SE of 0.
NOMENCLATURE
CDC Characteristic drying curve N Number of observations
0tdMd
⎟⎟⎠
⎞⎜⎜⎝
⎛−
Initial drying rate, (kgwater/(kgdry matter min))
n Number of constants
ttdMd
⎟⎟⎠
⎞⎜⎜⎝
⎛−
Drying rate at any time of drying, (kgwater/(kgdry matter min))
2r Correlation coefficient
vD Drying air flow rate, (m3s-1) Rh Equilibrium relative humidity, (%)
.Exp Experiment ES Standard error
f Dimensionless drying rate t drying time (min) M Moisture content at any time of
drying (% dry matter) T drying air temperature,
(°C) 0M Initial moisture content,
(% dry matter) 2χ Educed chi-square
eM Equilibrium moisture content, (% dry matter)
MBE Mean bias error
RM Moisture ratio
REFERENCES [1] M. Hmamouchi, M. Lahlou and A. Agoumi, ‘Molluscicidal Activity of Some Moroccan Medicinal
Plants’, Fitoterapia, Vol. 71, pp. 308 - 314, 2000.
[2] M.J. Jeff, ‘Therapeutic Research Facility’, Natural Medicines Comprehensive Database, 4th edition, 2002.
[3] L. Ait Mohamed, M. Kouhila, A. Jamali, S. Lahsasni, N. Kechaou and M. Mahrouz, ‘Single Layer Solar Drying Behaviour of Citrus aurantium Leaves under Forced Convection’, Energy Conversion and Management, Vol. 46, pp. 1473 - 1483, 2005.
[4] K.A. Ebru, B. Yasar and Y. Cengiz, ‘Thin Layer Drying of Red Pepper’, Journal of Food Engineering, Vol. 59, pp. 99 – 104, 2003.
[5] A. Midilli and H. Kucuk, ‘Mathematical Modelling of Thin Layer Drying of Pistachio by Using Solar Energy’, Energy Conversion and Management, Vol. 44, N°7, pp. 1111 - 1122, 2003.
[6] C. Tiris, M. Tiris and I. Dincer, ‘Energy Efficiency of a Solar Drying System’, International Journal of Energy Research, Vol. 20, pp. 767 - 770, 1996.

A. Idlimam et al.
200
[7] M.A. Basunia and T. Abe, ‘Thin-Layer Solar Drying Characteristics of Rough Rice under Natural Convection’, Journal of Food Engineering, Vol. 47, pp. 295 - 301, 2001.
[8] A. Jamali, ‘Etude des Isothermes de Sorption et des Cinétiques de Séchage Solaire Convectif des Feuilles d’Anserine (Chenopodium ambrosioides) et de mandarinier Citrus reticulata) pour une Meilleure Conservation’, Thèse d’Habilitation, Université Cadi Ayyad, Marrakech, Maroc, 250 p, 2006a..
[9] A. Jamali, M. Kouhila, L. Ait Mohamed, J.T. Jaouhari, A. Idlimam and N. Abdenouri, ‘Sorption Isotherms of Chenopodium ambrosioides Leaves at Three Temperatures’, Journal of Food Engineering, Vol. 72, pp. 77 - 84, 2006b.
[10] O. Yaldiz, C. Ertekin and H.I. Uzun, ‘Mathematical Modelling of Thin Layer Solar Drying of Sultana Grapes’, Energy, Vol. 26, pp. 457 - 465, 2001.
[11] R. Al Hodali, ‘Numerical Simulation of an Agricultural Foodstuffs Drying Unit Using Solar Energy and Adsorption Process’, Ph.D. Thesis, University of Bruxelles, Belgium, 1997.
[12] T.I. Togrul and D. Pehlivan, ‘Mathematical Modelling of Solar Drying of Apricot in Thin Layers’, Journal of Food Engineering, Vol. 55, N°3, pp. 209-216, 2002.
[13] O. Yaldiz and C. Ertekin, ‘Thin Layer Solar Drying of Some Vegetables’, Drying Technology, Vol. 19, N°3-4, pp. 583 – 597, 2001.
[14] M. Kouhila, N. Kechaou, M. Otmani, M. Fliyou and S. Lahsasni, ‘Experimental Study of Sorption Isotherms and Drying Kinetics of Moroccan Eucalyptus globulus’, Drying Technology, Vol. 20, N°10, pp. 2027 - 2039, 2002.
[15] M. Kouhila, ‘Etude Expérimentale et Théorique de Cinétiques de Séchage Convectif Partiellement Solaire des Plantes Médicinales et Aromatiques (Menthe, Verveine, Sauge et Eucalyptus) de la Région de Marrakech’, Thèse de Doctorat d’Etat, Université Cadi Ayyad, Marrakech, Maroc, 170 p., 2001.
[16] A. Midilli, ‘Determination of Pistachio Drying Behaviour and Conditions in a Solar Drying System’, International Journal of Energy Research, Vol. 25, N°8, pp. 715 - 725, 2001.
[17] S. Lahsasni, M. Kouhila, M. Mahrouz and J.T. Jaouhari, ‘Drying Kinetics of Prickly Pear Fruit (Opuntia Ficus Indica)’, Journal of Food Engineering, Vol. 61, N°2, pp. 173 - 179, 2003.
[18] S. Lahsasni, M. Kouhila, M. Mahrouz, A. Idlimam and A. Jamali, ‘Thin Layer Convective Solar Drying of Prickly Pear Peel (Opuntia Ficus Indica)’, Energy, Vol. 29, N°2, pp. 211 - 224, 2004a.
[19] S. Lahsasni, M. Kouhila, M. Mahrouz, L. Ait Mohamed and B. Agorram, ‘Characteristic Drying Curve and Mathematical Modelling of Thin-Layer Solar Drying of Prickly Pear Cladode (Opuntia Ficus Indica)’, Journal of Food Process Engineering, Vol. 27, N°2, pp. 103 - 117, 2004b.
[20] P.S. Madamba, R.H. Driscoll and K.A. Buckle, ‘The Thin Layer Drying Characteristics of Garlic slices’, Journal of Food Engineering, Vol. 29, pp. 75 – 97.
[21] A. Belghit, M. Kouhila and B.C. Boutaleb, ‘Experimental Study of Drying Kinetics by Forced Convection of Aromatic Plants’, Energy Conversion & Management, Vol. 44, pp. 1303 - 1321, 2000.
[22] D.A. Van Meel, ‘Adiabatic Convection Batch Drying with Recirculation of Air’, Chemical Engineering Science, Vol. 9, pp. 36 - 44, 1958.
[23] A. Jamali, M. Kouhila, L. Ait Mohamed, A. Idlimam and A. Lamharrar, ‘Moisture Adsorption-Desorption Isotherms of Citrus reticulata Leaves at Three Temperatures’, Journal of Food Engineering, Vol. 77, pp. 71 - 78, 2006.
[24] A. Midlli, H. Kucuk and Z. Yapar, ‘A New Model for Single Layer Drying’, Drying Technology, Vol. 20, N°7, pp. 1503 – 1513, 2002.
[25] A. Idlimam, A. Jamali, M. Kaoua et M. Fliyou, ‘Etude Expérimentale et Statistique des Puissances Solaires à Marrakech’, Actes du Forum International sur les Energies Renouvelables (FIER’2002), Faculté des Sciences de Tétouan, Morocco, pp. 94 - 101, 8-10 Mai 2002.

Single layer drying behaviour of grenade peel in a forced convective solar dryer
201
Table 3: Modelling of moisture ratio according to drying time for grenade peel for 13
v sm028.0D −=
Model T Coefficients 2r 2χ 45C k=0.0060 0.9959 7.67 10-4
50°C k=0.0094 0.9935 1.2 10-3
60°C k=0.0128 0.9880 2.17 10-3Newton
70°C k=0.0246 0.9952 9.66 10-4
45°C k=0.0121; n=0.8614 0.9997 5.97 10-5
50°C k=0.0204; n=0.8301 0.9996 7.94 10-5
60°C k=0.0318; n=0.7866 0.9974 5.23 10-4Page
70°C k=0.0232; n=1.0165 0.9953 1.12 10-3
45°C k=0.0059; n=0.8614 0.9997 5.97 10-5
50°C k=0.0092; n=0.8301 0.9996 7.94 10-5
60°C k=0.0125; n=0.7866 0.9974 5.23 10-4Modified Page1
70°C k=0.0246; n=1.0166 0.9953 1.12 10-3
45°C k=0.0144; n=0.4141 0.9960 8.37 10-4
50°C k=0.0192; n=0.4902 0.9935 1.31 10-3
60°C k=0.0212; n=0.6048 0.9880 2.44 10-3Modified Page2
70°C k=0.0316; n=0.7781 0.9952 1.13 10-3
45°C a=0.9603; k=0.0056 0.9978 3.13 10-4
50°C a=0.9410; k=0.0087 0.9960 4.42 10-3
60°C a=0.9442; k=0.0118 0.9917 1.30 10-3Henderson and
Pabis 70°C a=0.9922; k=0.0244 0.9953 1.10 10-3
45°C a=0.913; k=0.0067; c=0.0633 0.9991 1.4 10-4
50°C a=0.9045; k=0.0106; c=0.0677 0.9985 3.87 10-3
60°C a=0.8682; k=0.0159; c=0.1062 0.9983 3.94 10-4Logarithmic
70°C a=1.0993; k=0.019; c=-0.1272 0.9976 5.21 10-4
45°C a=0.8739; k0=0.005; b=0.1269; k1=0.0373 0.9997 8.05 10-5
50°C a=0.7479; k0=0.0068; b=0.2514; k1=0.0311 0.9996 9.76 10-5
60°C a=0.0786; k0=-0.0012; b=0.8941; k1=0.0153 0.9983 3.30 10-4Two term
70°C a=0.8777; k0=0.0244; b=0.1144; k1=0.0242 0.9953 1.61 10-3
45°C a=0.1223; k=0.0413 0.9997 6.81 10-5
50°C a=1.0002; k=0.0077 0.9786 4.27 10-3
60°C a=0.214; k=0.0455 0.9959 8.33 10-4Two term
exponential 70°C a=1.0075; k=0.0246 0.9952 1.13 10-3
45C a=1.7449; k=0.006; b=0.9987 0.9959 9.13 10-4
50°C a=1.9332; k=0.0094; b=1.0006 0.9935 1.44 10-3
60°C a=1.0157; k=0.0127; b=1.0044 0.9880 2.45 10-3Diffusion approach
70°C a=1.5537; k=0.0285; b=1.3102 0.9955 1.27 10-3
45°C a=0.8815; k=0.0058; b=0.0791 ; k0=0.0596; c=0.0414; h=0.0003 0.9998 5.93 10-5
50°C a=0.5566; k=0.01; b=0.1437; k0=0.0449; c=0.3; h=0.0047 0.9997 9.48 10-5
60°C a=0.8893; k=0.0154; b=-0.0287 ; k0=-0.0004; c=0.1125; k1=-0.0008 0.9983 8.26 10-3
Modified Henderson and Pabis
70°C a=0.1423; k=0.1736; b=-0.1507 ; k0=-0.005; c=1.0085; k1=0.0136 0.99998 1.31 10-5

A. Idlimam et al.
202
Table 3 (to continue)
Model T Coefficients 2r 2χ 45°C a=7.4755 10-4 ; k=0.008; k0=0.008 0.9936 1.46 10-3
50°C a=1.96 10-4; k=0.008; k0=0.008 0.9927 1.61 10-3
60°C a=1.6023 10-5; k=0.008; k0=0.008 0.9792 4.83 10-3Verma et al.
70°C a=1.4414 10-6; k=0.0088; k0=0.0089 0.9917 2.34 10-3
45°C a=0.9987; k=0.0119; n=0.8659; b=4.4776 10-6 0.9997 7.246 10-5
50°C a=1.0019; k=0.0195 ; n=0.8445; b=3.7721 10-6 0.9997 9.70 10-5
60°C a=0.9898; k=0.0217; n=0.8943; b=0.0003 0.9989 2.67 10-4Midilli and
Kucuk 70°C a=0.9997; k=0.0499; n=0.7072; b=-0.0026 0.99997 1.2 10-5
Table 4: Modelling of moisture ratio according to drying time for grenade peel for 13
v sm056.0D −=
Model T Coefficients 2r 2χ 45°C k=0.0149 0.9972 6.74 10-4
50°C k=0.0086 0.995 8.80 10-4
60°C k=0.0227 0.9941 1.36 10-3Newton
70°C k=0.0304 0.9896 2.25 10-3
45°C k=0.0111; n=1.0709 0.9979 6.04 10-4
50°C k=0.0173; n=0.8487 0.9999 1.61 10-5
60°C k=0.0117; n=1.1766 0.9979 5.71 10-4Page
70°C k=0.0104; n=1.3133 0.9992 2.28 10-4
45°C k=0.0149; n=1.0709 0.9979 6.04 10-4
50°C k=0.0084; n=0.8487 0.99992 1.60 10-5
60°C k=0.0227; n=1.1766 0.9979 5.71 10-4Modified Page1
70°C k=0.031; n=1.3133 0.9992 2.28 10-4
45°C k=0.0179; n=0.8288 0.9972 7.87 10-4
50°C k=0.0138; n=0.6235 0.9950 9.77 10-4
60°C k=0.0218; n=1.0426 0.9941 1.59 10-3Modified Page2
70°C k=0.025; n=1.2092 0.9896 2.82 10-3
45°C a=1.0064; k=0.015 0.9973 7.68 10-4
50°C a=0.9567; k=0.008 0.9976 2.47 10-4
60°C a=1.0262; k=0.0234 0.9948 1.29 10-3Henderson and Pabis
70°C a=1.0366; k=0.0317 0.9913 2.04 10-3
45°C a=1.0636; k=0.0128; c=-0.0715 0.9987 4.27 10-4
50°C a=0.8992; k=0.0096; c=0.0726 0.9989 1.34 10-4
60°C a=1.2128; k=0.0159; c=-0.2159 0.9999 3 10-5Logarithmic
70°C a=1.545; k=0.0159; c=-0.5383 0.9997 1.02 10-4
45°C a=0.7465; k0=0.015; b=0.2599; k1=0.015 0.9973 1.15 10-3
50°C a=0.1197; k0=0.0607; b=0.8788; k1=0.0072 0.99995 1.33 10-5
60°C a=0.282; k0=0.0235; b=0.7442; k1=0.0234 0.9948 1.94 10-3Two term
70°C a=0.3193; k0=0.0318; b=0.7174; k1=0.0317 0.9913 4.08 10-3

Single layer drying behaviour of grenade peel in a forced convective solar dryer
203
Table 4 (to continue)
Model T Coefficients 2r 2χ 45°C a=1.0026; k=0.0149 0.9972 7.86 10-3
50°C a=0.122; k=0.059 0.99994 1.13 10-5
60°C a=1; k=0.0226 0.9941 1.59 10-3Two term
exponential 70°C a=1.8456; k=0.0458 0.9988 3.24 10-4
45°C a=3.7603; k=0.0099; b=0.8605 0.9986 4.73 10-4
50°C a=1.2366; k=0.0086; b=1.0001 0.995 1.1 10-3
60°C a=4.3159; k=0.0113; b=0.7879 0.9998 4.74 10-5Diffusion approach
70°C a=8.3838; k=0.0097; b=0.8037 0.9997 1.19 10-4
45°C a=1.1241; k=0.0144; b=-0.1134; k0=0.0237; c=-0.0183; k1=-0.0053 0.9987 1.07 10-3
50°C a=1.0917; k=0.008; b=-0.1135; k0=0.008; c=-0.0214; k1=0.0081 0.9977 4.50 10-4
60°C a=1.1181; k=0.0173; b=-0.1035; k0=-0.0006; c=-0.0162; k1=-0.0128 0.99991 6.95 10-5
Modified Henderson And Pabis
70°C a=0.5234; k=0.0317; b=0.2263; k0=0.0321; c=0.2869; k1=0.0315 0.99999 8.16 10-3
45°C a=7.4755 10-4 ; k=0.008; k0=0.008 0.9936 1.46 10-3
50°C a=1.96 10-4; k=0.008; k0=0.008 0.9927 1.61 10-3
60°C a=1.6023 10-5; k=0.008; k0=0.008 0.9792 4.83 10-3Verma et al.
70°C a=1.4414 10-6; k=0.0088; k0=0.0089 0.9917 2.34 10-3
45°C a=0.9987; k=0.0119; n=0.8659; b=4.4776 10-6 0.9997 7.246 10-5
50°C a=1.0019; k=0.0195 ; n=0.8445; b=3.7721 10-6 0.9997 9.70 10-5
60°C a=0.9898; k=0.0217; n=0.8943; b=0.0003 0.9989 2.67 10-4Midilli and
Kucuk 70°C a=0.9997; k=0.0499; n=0.7072; b=-0.0026 0.99997 1.2 10-5