Single-cell RNA-seq transcriptome analysis of linear …...METHOD Open Access Single-cell RNA-seq...
17
METHOD Open Access Single-cell RNA-seq transcriptome analysis of linear and circular RNAs in mouse preimplantation embryos Xiaoying Fan 1,2† , Xiannian Zhang 1,3† , Xinglong Wu 1,5,7 , Hongshan Guo 1,2 , Yuqiong Hu 1,5,7 , Fuchou Tang 1,2,4,5,6* and Yanyi Huang 1,3,5* Abstract Circular RNAs (circRNAs) are a new class of non-polyadenylated non-coding RNAs that may play important roles in many biological processes. Here we develop a single-cell universal poly(A)-independent RNA sequencing (SUPeR-seq) method to sequence both polyadenylated and non-polyadenylated RNAs from individual cells. This method exhibits robust sensitivity, precision and accuracy. We discover 2891 circRNAs and 913 novel linear transcripts in mouse preimplantation embryos and further analyze the abundance of circRNAs along development, the function of enriched genes, and sequence features of circRNAs. Our work is key to deciphering regulation mechanisms of circRNAs during mammalian early embryonic development. Background The transcriptome encompasses all the RNA species transcribed within a cell or an ensemble of cells. Even within the same type of cell, intrinsic heterogeneity ex- ists among the transcriptomes of different individual cells [1]. To fully reveal such complexity, the ideal tran- scriptome analysis should be performed with individual cells and cover all the RNA species within each cell. Since we first developed a single cell RNA-seq transcrip- tome analysis technology in 2009 (the ‘Tang2009’ protocol) [2], a wide variety of single cell RNA-seq methods, such as Smart-seq [3–5], CEL-Seq [6] and Quartz-Seq [7], have been developed. These methods have quickly become powerful tools for dissecting the transcriptome complexity of individ- ual cells, especially in embryonic and neural development, cell reprogramming and cancer progression [4, 8–11]. All of the known single cell RNA-seq protocols for eukaryotic cells are limited to detecting mRNAs with poly(A) tails (poly(A)+ RNAs). There is, however, a sub- stantial amount of non-polyadenylated RNAs (poly(A)- RNAs) expressed in mammalian cells [12]. The standard approach relies on oligo(dT) to prime reverse transcrip- tion (RT). Priming through oligo(dT) avoids the prepon- derance of uninformative ribosomal RNA (rRNA) sequencing reads, which otherwise account for over 90 % of the total RNAs for mammalian cells [13]. However, this approach inevitably precludes the information of other RNA species without the poly(A) tails. In particular, circular RNAs (circRNAs), a unique set of poly(A)- RNAs [14], have recently been discovered within eukaryotic cells [14–18]. The majority of these circRNAs are formed by exons of coding genes, while some intronic circRNAs were also reported [19, 20]. CircRNAs have been linked to important cellular functions such as the binding and repressing of microRNA (miRNAs) as a sponge [15, 16]. It is desirable to develop a method to de- tect the complete transcriptome, including both poly(A)+ and poly(A)- RNAs, within single cells. Here we report a novel single-cell transcriptome profil- ing method, named single-cell universal poly(A)-inde- pendent RNA sequencing (SUPeR-seq), using random primers with fixed anchor sequences to replace the com- monly used oligo(dT) primers for cDNA synthesis. SUPeR-seq is able to detect both poly(A)+ and poly(A)- RNAs within a single cell with minimal contamination from rRNAs. This method shows higher sensitivity and detects more genes than the Tang2009 protocol. The * Correspondence: [email protected]; [email protected] † Equal contributors 1 Biodynamic Optical Imaging Center (BIOPIC), Peking University, Beijing 100871, China 3 College of Engineering, Peking University, Beijing 100871, China Full list of author information is available at the end of the article © 2015 Fan et al. This is an Open Access article distributed under the terms of the Creative Commons Attribution License (http://creativecommons.org/licenses/by/4.0), which permits unrestricted use, distribution, and reproduction in any medium, provided the original work is properly credited. The Creative Commons Public Domain Dedication waiver (http:// creativecommons.org/publicdomain/zero/1.0/) applies to the data made available in this article, unless otherwise stated. Fan et al. Genome Biology (2015) 16:148 DOI 10.1186/s13059-015-0706-1
Transcript of Single-cell RNA-seq transcriptome analysis of linear …...METHOD Open Access Single-cell RNA-seq...
Fan et al. Genome Biology (2015) 16:148 DOI 10.1186/s13059-015-0706-1
METHOD Open Access
Single-cell RNA-seq transcriptome analysisof linear and circular RNAs in mousepreimplantation embryos
Xiaoying Fan1,2†, Xiannian Zhang1,3†, Xinglong Wu1,5,7, Hongshan Guo1,2, Yuqiong Hu1,5,7, Fuchou Tang1,2,4,5,6*and Yanyi Huang1,3,5*
Abstract
Circular RNAs (circRNAs) are a new class of non-polyadenylated non-coding RNAs that may play important rolesin many biological processes. Here we develop a single-cell universal poly(A)-independent RNA sequencing(SUPeR-seq) method to sequence both polyadenylated and non-polyadenylated RNAs from individual cells. Thismethod exhibits robust sensitivity, precision and accuracy. We discover 2891 circRNAs and 913 novel linear transcriptsin mouse preimplantation embryos and further analyze the abundance of circRNAs along development, the functionof enriched genes, and sequence features of circRNAs. Our work is key to deciphering regulation mechanisms ofcircRNAs during mammalian early embryonic development.
BackgroundThe transcriptome encompasses all the RNA speciestranscribed within a cell or an ensemble of cells. Evenwithin the same type of cell, intrinsic heterogeneity ex-ists among the transcriptomes of different individualcells [1]. To fully reveal such complexity, the ideal tran-scriptome analysis should be performed with individualcells and cover all the RNA species within each cell.Since we first developed a single cell RNA-seq transcrip-
tome analysis technology in 2009 (the ‘Tang2009’ protocol)[2], a wide variety of single cell RNA-seq methods, such asSmart-seq [3–5], CEL-Seq [6] and Quartz-Seq [7], have beendeveloped. These methods have quickly become powerfultools for dissecting the transcriptome complexity of individ-ual cells, especially in embryonic and neural development,cell reprogramming and cancer progression [4, 8–11].All of the known single cell RNA-seq protocols for
eukaryotic cells are limited to detecting mRNAs withpoly(A) tails (poly(A)+ RNAs). There is, however, a sub-stantial amount of non-polyadenylated RNAs (poly(A)-RNAs) expressed in mammalian cells [12]. The standard
* Correspondence: [email protected]; [email protected]†Equal contributors1Biodynamic Optical Imaging Center (BIOPIC), Peking University, Beijing100871, China3College of Engineering, Peking University, Beijing 100871, ChinaFull list of author information is available at the end of the article
© 2015 Fan et al. This is an Open Access artic(http://creativecommons.org/licenses/by/4.0),provided the original work is properly creditedcreativecommons.org/publicdomain/zero/1.0/
approach relies on oligo(dT) to prime reverse transcrip-tion (RT). Priming through oligo(dT) avoids the prepon-derance of uninformative ribosomal RNA (rRNA)sequencing reads, which otherwise account for over 90 %of the total RNAs for mammalian cells [13]. However, thisapproach inevitably precludes the information of otherRNA species without the poly(A) tails.In particular, circular RNAs (circRNAs), a unique set of
poly(A)- RNAs [14], have recently been discovered withineukaryotic cells [14–18]. The majority of these circRNAsare formed by exons of coding genes, while some introniccircRNAs were also reported [19, 20]. CircRNAs havebeen linked to important cellular functions such as thebinding and repressing of microRNA (miRNAs) as asponge [15, 16]. It is desirable to develop a method to de-tect the complete transcriptome, including both poly(A)+and poly(A)- RNAs, within single cells.Here we report a novel single-cell transcriptome profil-
ing method, named single-cell universal poly(A)-inde-pendent RNA sequencing (SUPeR-seq), using randomprimers with fixed anchor sequences to replace the com-monly used oligo(dT) primers for cDNA synthesis.SUPeR-seq is able to detect both poly(A)+ and poly(A)-RNAs within a single cell with minimal contaminationfrom rRNAs. This method shows higher sensitivity anddetects more genes than the Tang2009 protocol. The
le distributed under the terms of the Creative Commons Attribution Licensewhich permits unrestricted use, distribution, and reproduction in any medium,. The Creative Commons Public Domain Dedication waiver (http://) applies to the data made available in this article, unless otherwise stated.
Fan et al. Genome Biology (2015) 16:148 Page 2 of 17
contamination from genomic DNA and rRNA is negli-gible. Using SUPeR-seq, we identified in total 141 cir-cRNA transcripts from single HEK293T cells and 2891circRNA transcripts from single mouse early embryos. Inaddition, we found hundreds of novel non-circular tran-scripts by de novo assembly of SUPeR-seq reads generatedfrom individual mouse preimplantation embryos. By com-paring the SUPeR-seq reads from mouse oocytes to thosefrom two-cell stage embryos, we identified both maternaland zygotic genes; 81 % of the zygotic genes were furthervalidated by sequencing the two-cell embryos treated withα-Amanitine, a potent inhibitor of gene transcription.These results indicate the high robustness and potentialutility of SUPeR-seq.
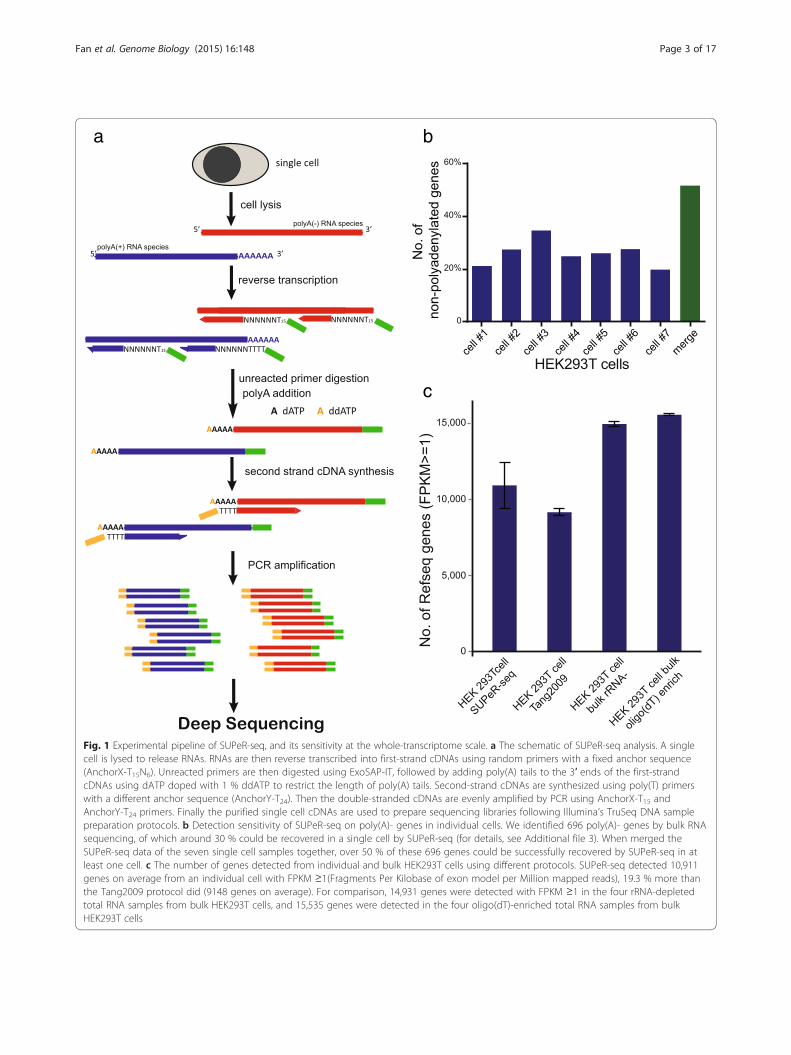
Results and discussionThe sensitivity and accuracy of the SUPeR-seq methodIn contrast to our previous Tang2009 protocol thatemployed oligo(dT)24 primers to convert the poly(A)+mRNAs into cDNAs, SUPeR-seq uses random(AnchorX-T15N6) primers to enable the simultaneousdetection of both poly(A)+ and poly(A)- RNA speciesfrom a single cell (Fig. 1a). This primer design also ef-fectively reduced 3′ bias during RT while providing amore balanced sequence coverage along the wholetranscript (Fig. S1a in Additional file 1). After the syn-thesis of the first strand cDNA, we digested the excessprimers using ExoSAP-IT to eliminate the formation ofprimer dimers. Then we added a poly(A) tail to the 3′end of newly synthesized first-strand cDNA using ter-minal deoxynucleotidyl transferase (TdT) and dATPdoped with 1 % ddATP. The lengths of these artificiallyadded poly(A) tails are crucial because they diminishthe sequencing quality if too long whereas they reducethe efficiency of second-strand cDNA synthesis if tooshort. Using ddATP to terminate the poly(A) extension,we found that a specific ratio of dATP to ddATP(100:1) ensured optimal lengths of poly(A) addition.The second-strand cDNA was subsequently synthesizedusing a different primer (AnchorY-T24) to eliminateprimer-dimer formation during the following PCRamplification step. In the second round of PCR, weused 5′-amine-terminated primers to prevent theprimers from ligating with Illumina library adaptors,further reducing the amplification bias while improvingthe sequencing quality.To determine the coverage of poly(A)- RNA species, we
added three types of in vitro transcribed, non-polyadenylated RNAs (green fluorescent protein (GFP),red fluorescent protein (RFP) and Cre RNAs withoutpoly(A) tails; Additional file 2) in each SUPeR-seq reactionof single mouse embryonic stem cells (mESCs). The ex-pression levels of these exogenous spike-ins werelinearly correlated with the molecule numbers added,
demonstrating that poly(A)- RNAs can be accuratelydetected (Fig. S1b in Additional file 1). To further con-firm the detection of endogenous non-polyadenylatedRNAs, we performed three types of transcriptome ana-lyses using total RNA extracted from bulk amounts ofHEK293T cells with different enrichment/depletionmethods: rRNA-depleted, poly(A)+ mRNA enriched,and co-depletion of rRNA and poly(A)+ RNA. Thepoly(A)- genes were then identified as the ones thatwere detected in rRNA-depleted samples at least twofoldhigher than in poly(A)+ enriched samples (p value < 0.05),and also showed high expression levels (FPKM ≥ 1) inthe samples with co-depletion of rRNA and poly(A)+RNA. Using this method, we identified 696 such genes(Additional file 3). SUPeR-seq analysis of a singleHEK293T cell covered 30 % of these potential poly(A)-RNAs, and the coverage was over 50 % with the ensem-ble of seven individual cells (Fig. 1b). We also checkedthe coverage on histone RNAs [21], and found thatSUPeR-seq recovered more poly(A)- RNAs comparedwith the Tang2009 protocol (Fig. S1c in Additional file 1).To assess potential genomic DNA contamination, we
sequenced oocyte samples both with and without the nu-clear region removed. There was no significant differencein the percentage of reads mapped to exons, introns andintergenic regions between them (Fig. S1d in Additionalfile 1). This indicates that the intron and intergenic re-gions detected through SUPeR-seq did not result fromcontamination with genomic DNAs. These non-exonreads might be derived from novel exons of known genesor from primary transcripts before splicing. In addition,the correlation coefficient of gene expression levels be-tween oocyte samples with and without nuclei showed nolarger difference compared with that between samples inthe same group (Fig. S1e in Additional file 1), indicatingthat the genomic DNA contamination in the SUPeR-seqdata is negligible. Only six genes (Gm12264, Gm12364,Gm16832, Gm8817, Grb14, Klrblc) were detected (FPKM> 1) in these three intact oocytes but absent (FPKM = 0)in the two nuclei-removed oocytes. These genes are likelynuclear-specific transcripts in the mature mouse oocytes.Additionally, we also found three genes (C87198, Atxn7and Xlr4a) with four or more detected reads across theexon–intron boundaries (with at least 10 bp covering bothexon and intron regions) only in the intact oocyte samples(but not in the nuclear region removed oocytes). We sus-pect that such rare pre-splicing primary transcripts wereprobably due to transcription arrest in MII oocytes [22].Unexpectedly, SUPeR-seq showed no significant ampli-
fication of rRNAs, the major RNA species in a cell. Nomore than 1.5 % of the total SUPeR-seq reads weremapped to rRNAs (Rn5s, Rn5.8s, Rn18s, and Rn28s) whenstarting with a single cell or single-cell amount of totalRNAs (Fig. S1f in Additional file 1). Several factors might
a b
c
Fig. 1 Experimental pipeline of SUPeR-seq, and its sensitivity at the whole-transcriptome scale. a The schematic of SUPeR-seq analysis. A singlecell is lysed to release RNAs. RNAs are then reverse transcribed into first-strand cDNAs using random primers with a fixed anchor sequence(AnchorX-T15N6). Unreacted primers are then digested using ExoSAP-IT, followed by adding poly(A) tails to the 3′ ends of the first-strandcDNAs using dATP doped with 1 % ddATP to restrict the length of poly(A) tails. Second-strand cDNAs are synthesized using poly(T) primerswith a different anchor sequence (AnchorY-T24). Then the double-stranded cDNAs are evenly amplified by PCR using AnchorX-T15 andAnchorY-T24 primers. Finally the purified single cell cDNAs are used to prepare sequencing libraries following Illumina’s TruSeq DNA samplepreparation protocols. b Detection sensitivity of SUPeR-seq on poly(A)- genes in individual cells. We identified 696 poly(A)- genes by bulk RNAsequencing, of which around 30 % could be recovered in a single cell by SUPeR-seq (for details, see Additional file 3). When merged theSUPeR-seq data of the seven single cell samples together, over 50 % of these 696 genes could be successfully recovered by SUPeR-seq in atleast one cell. c The number of genes detected from individual and bulk HEK293T cells using different protocols. SUPeR-seq detected 10,911genes on average from an individual cell with FPKM ≥1(Fragments Per Kilobase of exon model per Million mapped reads), 19.3 % more thanthe Tang2009 protocol did (9148 genes on average). For comparison, 14,931 genes were detected with FPKM ≥1 in the four rRNA-depletedtotal RNA samples from bulk HEK293T cells, and 15,535 genes were detected in the four oligo(dT)-enriched total RNA samples from bulkHEK293T cells
Fan et al. Genome Biology (2015) 16:148 Page 3 of 17
Fan et al. Genome Biology (2015) 16:148 Page 4 of 17
account for the significant preference of SUPeR-seq formRNAs compared with rRNAs: the limited amount ofRNA as starting material, lysis and RT conditions. Whenthe amount of input RNA was increased from 10 pg to 1ng with SUPeR-seq protocol, the rRNA ratio jumped from1.2 % to 5.1 % (Fig. S1f in Additional file 1). Also, when wereplaced the lysis buffer with commercial RT buffer andfollowed with the conventional RT step, we indeed ob-served a higher portion of rRNA reads, but the rRNA map-ping ratio was still less than 15 % (Fig. S1f in Additionalfile 1). Therefore, we speculate that the lysis and RT pro-cedure of SUPeR-seq could not fully break down the strongsecondary structures of rRNAs, leading to low RT effi-ciency of rRNAs.We further evaluated the sensitivity and accuracy of
SUPeR-seq by comparing results by this method with thosefrom multiple bulk samples. We found that SUPeR-seqcould detect 10,911 genes (FPKM ≥ 1) within an individualHEK293T cell whereas our previous Tang2009 protocolonly detected 9148 genes (FPKM ≥ 1). When comparedwith rRNA-depleted bulk samples from which 13,773genes were detected, SUPeR-seq could cover 79 % of thesegenes from just a single cell (Fig. S2a in Additional file 1).These data show that the SUPeR-seq method can detectthe majority of the transcriptome of an individual cell(Fig. 1c). Furthermore, we found that the SUPeR-seq databased on 10 pg, 100 pg and 1 ng total RNA samples allhad good concordance with standard RNA-seq of bulkamounts of mESCs (r > 0.85). SUPeR-seq achieved bettercorrelation with regard to gene expression levels witholigo(dT)-enriched bulk RNA-seq than the previousTang2009 approach did (Fig. S2c in Additional file 1). Alsothe average Pearson correlation coefficient (r) betweengene expression levels in 10-pg total RNA samples andbulk sample was higher than that reported when usingSmart-Seq [3]. These results indicate that SUPeR-seq de-tects gene expression in single cells with higher accuracythan other single cell RNA-seq methods do, and has lesssystematic bias. The higher consistency with bulk analysisis likely due to the random primers used in both theSUPeR-seq and bulk methods, as they might provide amore uniform coverage on the transcripts. Thus, theSUPeR-seq method is less biased than previous single cellRNA-seq methods.To evaluate the reproducibility of SUPeR-seq, we per-
formed the experiments using various amounts of pooledRNAs in lieu of single cells to avoid biological variabilitybetween samples. A typical mammalian cell contains ap-proximately 10 pg total RNAs. The mean Pearson correl-ation coefficient (r) for the four technical replicates of 10pg total RNAs was 0.95, suggesting high reproducibility ofSUPeR-seq, comparable to that of Smart-Seq2 [4] (Fig. S2bin Additional file 1). Of the genes with FPKM ≥ 1, 81.7 %show less than a fourfold change between expression levels
in two 10 pg replicates of Smart-seq2 [4], while withSUPeR-seq this was slightly lower at 74.3 % (Fig. S2b inAdditional file 1) [23]. To address this problem further, wepooled ten HEK293T cells together, lysed them and splitthem into ten equal fractions to create ten ‘averaged’ singlecells, and then processed them separately by SUPeR-seq.We evaluated the technical variations with these ten ‘aver-aged’ single HEK293T cells. The high correlation amongthese cells indicates that the quantitative expressionlevels of the endogenous RNAs are maintained (Fig. S3in Additional file 1; r = 0.97 on average). By analyzingthe coefficient of variance (CV) of the expression levelsof the genes in these ‘averaged’ cells, we found thatgenes with FPKM ≥ 6.3 showed, on average, a mean CVvalue of less than 1, indicating high precision in quanti-fying the majority of the expressed genes in these ‘aver-aged’ cells (Fig. S2d in Additional file 1). For the 696poly(A)- genes we identified, these cells showed acceptablecorrelation with each other with an average correlationcoefficient of 0.67. Also, the non-poly(A) spike-in mol-ecule RFP could be consistently detected in all ‘average’single cells (Fig. S2e in Additional file 1), indicating thatthe relative expression levels of both poly(A)-tailed andnon-poly(A)-tailed transcripts could be maintained withSUPeR-seq. When applying the method to mouse oocytesand preimplantation embryos, we also achieved highcorrelation coefficients between replicates in each stage(Fig. S4a in Additional file 1). Therefore, embryo samplesfrom different stages could be clearly separated accordingto their gene expression either by principal componentanalysis or by a multidimensional scaling strategy analysis(Fig. S4b in Additional file 1).
Analysis of circRNAs in mouse preimplantation embryosby SUPeR-seqWe then tested if SUPeR-seq was able to detect circRNAs,a unique class of poly(A)- RNA that was recently discov-ered, and we found abundant circRNAs in mouse preim-plantation embryos. Such attempts have been challengingdue to limited quantity of starting materials. Hundreds ofcircRNAs have been previously reported [15] in HEK293Tcells through RNA-seq analysis of bulk samples. We devel-oped an analysis pipeline similar to the previous method[15] which can detect junction reads joining the first andlast exons of a circRNA (Fig. 2a). By requiring thatpaired-end reads mapped to the same transcript in a cir-cularized order, we eliminated false positive cases suchas trans-splicing or exon tandems. SUPeR-seq of sevensingle HEK293T cells revealed 141 candidate circRNAs(Additional file 4), out of which we chose 20 for valid-ation; 15 of these were novel and the other five were previ-ously reported. We were able to validate 19 (95 %) of themat single-base resolution by targeted amplification of theend-joining region unique to the circRNAs using RT-
a b
c d
e
f
Fig. 2 (See legend on next page.)
Fan et al. Genome Biology (2015) 16:148 Page 5 of 17
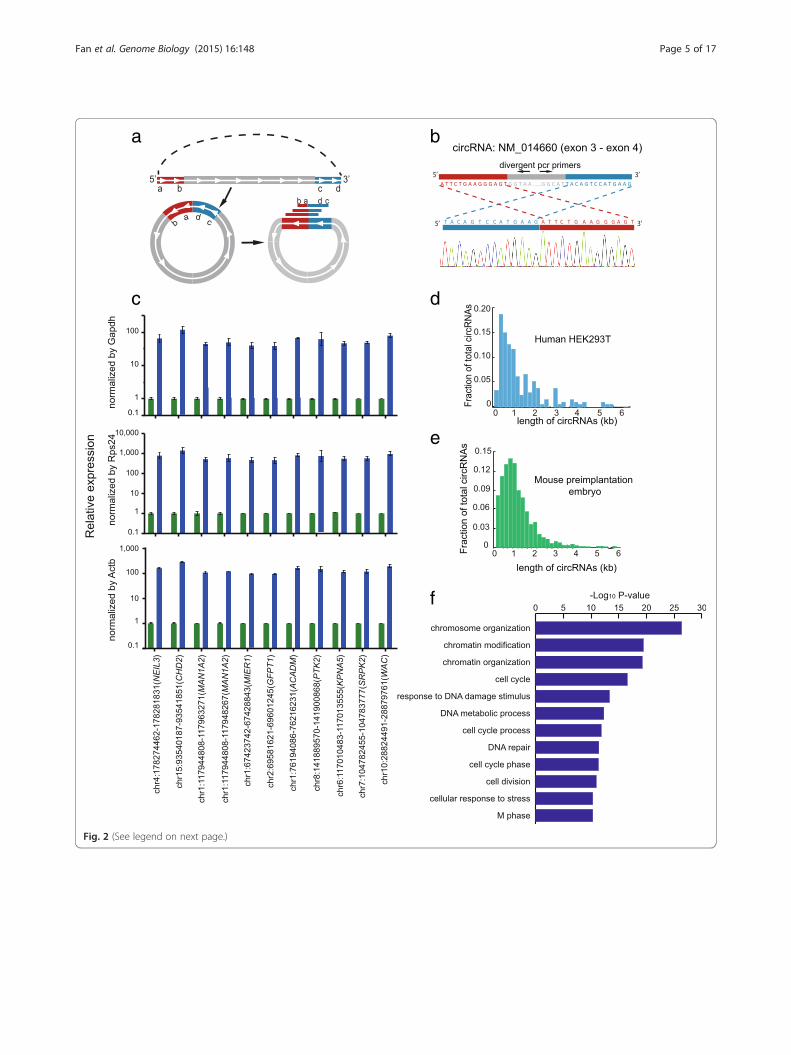
(See figure on previous page.)Fig. 2 Detection of circRNAs by SUPeR-seq in individual HEK293T cells and mouse preimplantation embryos. a Identification of circRNAs in theSUPeR-seq dataset. The termini of two exons are in a sequential order (a–-b……c–-d) along the genome, the red part shows the upstream exonat the 5′ end of the gene while the blue part shows the downstream exon at the 3′ end of the gene (top). When looped, the two exons jointogether from head to tail in a reversed order (c–d–a–b, bottom). Various sequencing reads covering the junction site can identify the cyclizationof a circRNA. b Sanger sequencing validation of a newly discovered circRNA through SUPeR-seq in a single HEK293T cell. The end-joining regionof the circRNA is PCR amplified to confirm the reversed order of the joined exons. The sequence of the end-joining region is unique to the circRNAbut not the host linear RNA. The joint region of the circRNA is chr7:11021999–11030474, and the host gene is PHF14. c Quantitative RT-PCR of HEK293Tcell total RNA treated with RNase R or mock treatment as a control. The circRNA candidates showed ten- to hundred-fold enrichment compared withcommon linear mRNAs after treatment with RNase R (here we use Gapdh, Rps24 and Actb as linear RNA controls). This clearly demonstrates that allthe circRNA candidates are circular. For each circRNA, we made two replicates in the RT-qPCR step. d The length distribution of the circRNAs (141 intotal) detected in single HEK293T cells. e The length distribution of circRNAs (2891 in total) detected in mouse preimplantation embryos. f The top GOterms are displayed for 1316 genes from which circRNAs are generated in mouse preimplantation embryos
Fan et al. Genome Biology (2015) 16:148 Page 6 of 17
coupled PCR (RT-PCR) followed by standard Sanger se-quencing (Fig. 2b; Fig. S5 in Additional file 1). These cir-cRNA candidates were also resistant to RNase R treatment,confirming their circularized characteristics (Fig. 2c). Full-length Sanger sequencing of the cDNAs of these circRNAcandidates also verified that they were indeed real circRNAsand not linear trans-splicing products between two RNAmolecules (Fig. S6 in Additional file 1). Interestingly, wefound that the majority of circRNAs are composed of in-ternal exons but not the first and the last exons within thesame host gene, and that their lengths are usually shorterthan 2 kb (Fig. 2d, e). Most (91 %) circRNAs are formed bymultiple exons with only 9 % formed by a single exon. Wethen applied our method to mouse oocytes and early em-bryos, including zygotes, two-cell, four-cell, and eight-cellembryos, morulae and blastocysts. circRNAs had neverbeen analyzed at these developmental stages due to the verylimited amount of material available for analysis. We identi-fied 2891 circRNAs from 1316 host genes in these earlyembryo samples (Additional file 4). We selected eight ofthese circRNAs for independent validation and verifiedseven of them at single-base resolution in the mouse oo-cytes by RT-PCR followed by standard Sanger sequencing(Fig. S7 in Additional file 1). This indicates that the majorityof novel circRNAs found in mouse preimplantation em-bryos are authentic circRNAs. We next tested if they hadthe potential to bind miRNAs as other circRNAs had beenreported to function as miRNA sponges in various cell lines[13, 14]. However, only 17 (0.9 %) of these circRNAscontained more than 20 potential miRNA binding sites(Additional file 5), indicating that the majority of thecircRNAs in mouse preimplantation embryos are unlikelyto play a role as miRNA sponges, which is consistent withprevious studies [24]. Gene ontology (GO) analysis of allthe 1316 host genes producing these circRNA transcriptsshowed strong enrichment for terms related to chromatinorganization, cell division, and response to DNA damagestimulus (Fig. 2f), suggesting potential roles of thesecircRNAs in these functional areas.An analysis of the expression dynamics of circRNAs dur-
ing preimplantation development showed that circRNAs
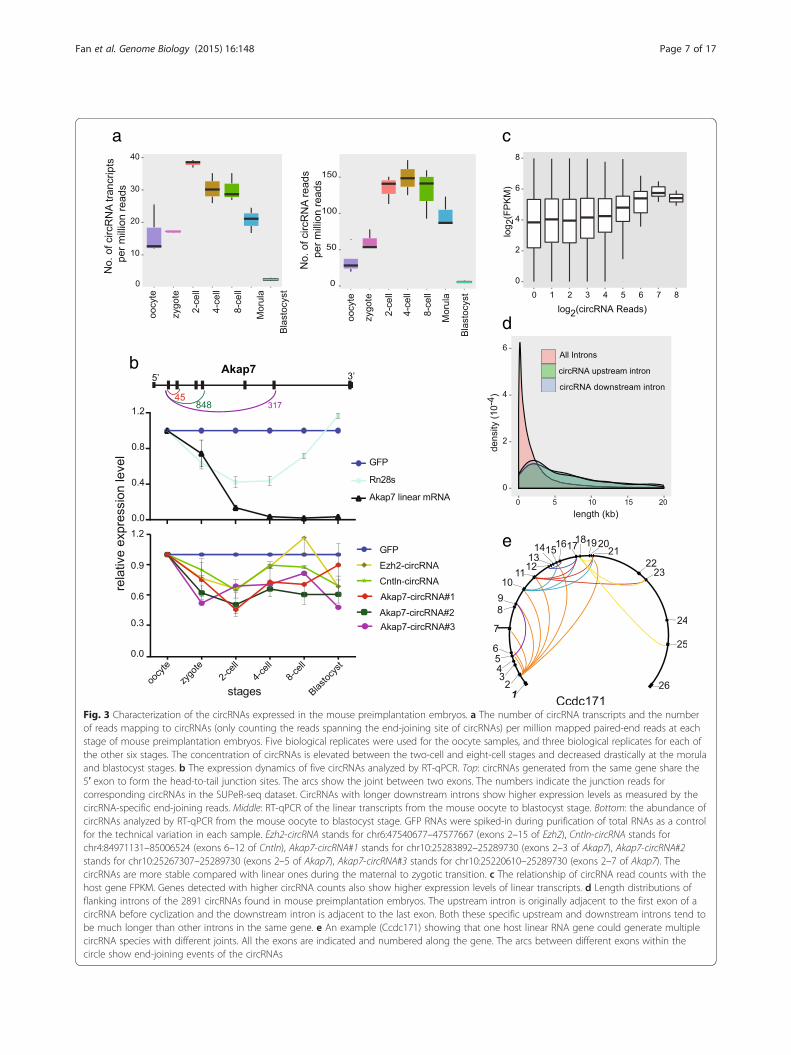
are already expressed in mature oocytes and continue toincrease until the four- to eight-cell stage, after which theybegin to decline, falling below the oocyte levels by theblastocyst stage (Fig. 3a). Quantitative RT-PCR (RT-qPCR)of several circRNAs during these stages also confirmed thehigh dynamic nature of circRNA expression (Fig. 3b). Theabundance of circRNAs was only about 1 % compared withpoly(A)+ RNAs [16]; hence, the circRNA repertoire couldhardly be completely discovered in each sample at currentsequencing depths. With about 15 million 100-bp paired-end reads sequenced for each sample, it is still far from sat-urated for coverage of all circRNAs in an individual cell(Fig. S8d in Additional file 1). Notably, in contrast to theglobal degradation of maternal linear mRNAs during thematernal to zygotic transition of mouse preimplantationembryos, circRNAs seem to be much more stable and re-sistant to this global degradation process (Fig. 3b).
Analysis of the formation of the circRNAs in mousepreimplantation embryosSeveral recent studies elucidated the mechanisms of cir-cRNA formation [25, 26], illustrating that circRNAs arenot just cellular byproducts [17, 27]. First, we analyzedthe characteristics of the circRNAs expressed in themouse preimplantation embryos. By analyzing the rela-tionship between circRNA amounts and their host geneexpression, we found that genes producing larger amountsof circRNAs also showed higher expression of their lineartranscripts (Fig. 3c). Second, to help compare the expres-sion levels of different circRNAs, we normalized circRNAexpression with their host gene RNA abundance. Then weexamined the lengths of the introns of the circRNA hostgenes and found that the introns flanking the circRNAsbefore cyclization (median of 7.0 kb and 5.2 kb for theupstream and downstream introns, respectively) weremuch longer than other introns in the same host gene(1.1 kb on average) or the randomly picked introns (me-dian of 1.2 kb) (Fig. 3d; Fig. S8a in Additional file 1),similar to the situation of longer surrounding intronsfor circRNAs expressed in H9 cells [25]. Third, it hasbeen shown that one host gene may produce several
a c
b
d
e
Fig. 3 Characterization of the circRNAs expressed in the mouse preimplantation embryos. a The number of circRNA transcripts and the numberof reads mapping to circRNAs (only counting the reads spanning the end-joining site of circRNAs) per million mapped paired-end reads at eachstage of mouse preimplantation embryos. Five biological replicates were used for the oocyte samples, and three biological replicates for each ofthe other six stages. The concentration of circRNAs is elevated between the two-cell and eight-cell stages and decreased drastically at the morulaand blastocyst stages. b The expression dynamics of five circRNAs analyzed by RT-qPCR. Top: circRNAs generated from the same gene share the5′ exon to form the head-to-tail junction sites. The arcs show the joint between two exons. The numbers indicate the junction reads forcorresponding circRNAs in the SUPeR-seq dataset. CircRNAs with longer downstream introns show higher expression levels as measured by thecircRNA-specific end-joining reads. Middle: RT-qPCR of the linear transcripts from the mouse oocyte to blastocyst stage. Bottom: the abundance ofcircRNAs analyzed by RT-qPCR from the mouse oocyte to blastocyst stage. GFP RNAs were spiked-in during purification of total RNAs as a controlfor the technical variation in each sample. Ezh2-circRNA stands for chr6:47540677–47577667 (exons 2–15 of Ezh2), Cntln-circRNA stands forchr4:84971131–85006524 (exons 6–12 of Cntln), Akap7-circRNA#1 stands for chr10:25283892–25289730 (exons 2–3 of Akap7), Akap7-circRNA#2stands for chr10:25267307–25289730 (exons 2–5 of Akap7), Akap7-circRNA#3 stands for chr10:25220610–25289730 (exons 2–7 of Akap7). ThecircRNAs are more stable compared with linear ones during the maternal to zygotic transition. c The relationship of circRNA read counts with thehost gene FPKM. Genes detected with higher circRNA counts also show higher expression levels of linear transcripts. d Length distributions offlanking introns of the 2891 circRNAs found in mouse preimplantation embryos. The upstream intron is originally adjacent to the first exon of acircRNA before cyclization and the downstream intron is adjacent to the last exon. Both these specific upstream and downstream introns tend tobe much longer than other introns in the same gene. e An example (Ccdc171) showing that one host linear RNA gene could generate multiplecircRNA species with different joints. All the exons are indicated and numbered along the gene. The arcs between different exons within thecircle show end-joining events of the circRNAs
Fan et al. Genome Biology (2015) 16:148 Page 7 of 17
Fan et al. Genome Biology (2015) 16:148 Page 8 of 17
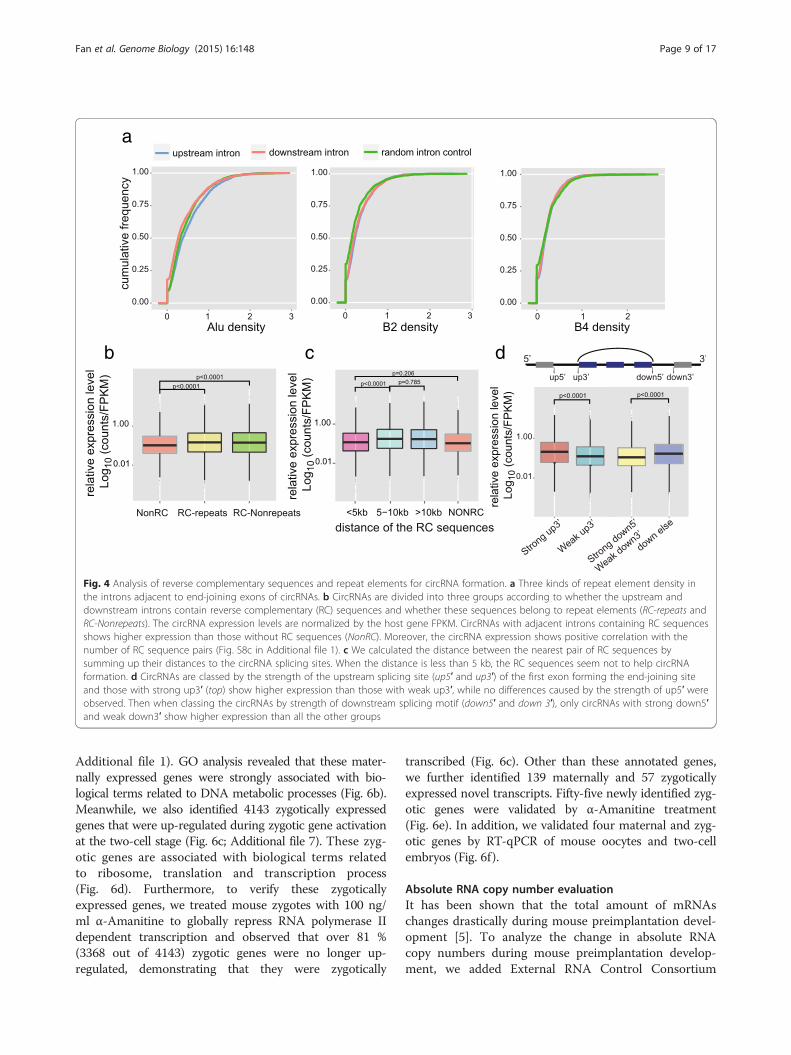
different circRNAs. This is also consistent with our mousepreimplantation embryo data (Fig. 3b, e). Quite often, cir-cRNAs derived from the same host gene share the same 5′exon but different 3′ exons for joining (Fig. 3b). Notably,for those circRNA isoforms sharing the same 5′ exon, theones with longer downstream introns tended to be moreabundant (p value 1.04e-11). Similarly, for circRNAs sharingthe same 3′ exon, the ones with longer upstream intronstended to be more abundant (p value 0.03). These trendsfurther support the notion that longer ‘outside’ flanking in-trons favor the formation of circRNAs (Figs. 3b; Fig. S8b inAdditional file 1). Fourth, it has been shown [26, 28–30]that the inversely orientated repeat elements (especially theAlu family) within the introns flanking the circRNAs playimportant roles in the formation of circRNAs. We furtheranalyzed the repeat elements in the introns flanking the2891 circRNAs expressed in the mouse preimplantationembryos. The densities of these repeat elements were notsignificantly different between introns flanking the cir-cRNAs and other random-selected control sequences(Fig. 4a). However, since the introns flanking the circRNAsare much longer, each of them contains, on average, sixtimes more repeats than other introns (Fig. S8a inAdditional file 1). This difference indicates that repeat ele-ments might facilitate circRNA formation in mouse pre-implantation embryos in vivo, similar to that in culturedcells in vitro. We further classified circRNAs into threegroups based on the existence of complementary se-quences and repeat elements in adjacent flanking introns,and then compared the normalized expression level(circRNA counts per host gene FPKM) of each group.If the adjacent flanking introns of circRNAs containcomplementary sequences, these circRNAs are indeedmore abundant. Moreover, the circRNAs with uniquenon-repeat complementary sequences in their adjacentflanking introns show higher expression levels thanthose with repeat element complementary sequencesin their adjacent flanking introns (Figs. 4b; Fig. S8c inAdditional file 1). Interestingly, the complementary se-quences in the adjacent flanking introns seem to workonly when they are located more than 5 kb away fromeach other (Fig. 4c). These results agree well with previ-ous findings in cultured cell lines [26, 27], indicating thesame mechanism of circRNA formation occurs in bothcell lines in vitro and mouse preimplantation embryosin vivo. It was previously shown that linear RNA splicingcompeted with circRNA formation in the same host gene.When upstream and downstream flanking exons con-tained splicing sites of stronger motifs, circRNA formationefficiency decreased [25]. We examined if this competitionalso existed in mouse early embryos. According to our re-sults, circRNAs showed higher relative expression levelswhen the upstream exons contained stronger splicing mo-tifs, but circRNAs with strong downstream splicing motifs
showed less relative expression than circRNAs with weakerdownstream splicing motifs (Fig. 4d).
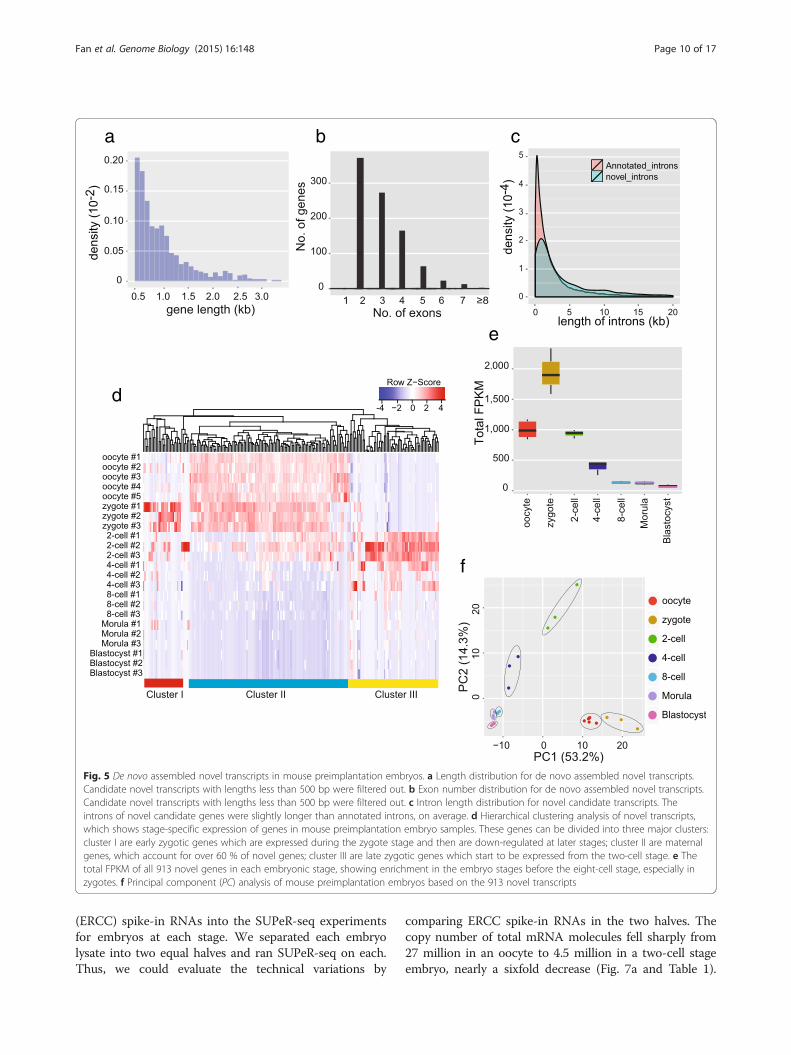
Analysis of novel linear RNAs in mouse preimplantationembryos by SUPeR-seqThe use of random primers for RT also brings the possibil-ity to identify novel RNAs or genes within mouse preim-plantation embryos. Reads mapped to the mouse genomebut not to any RefSeq or Ensembl transcripts were ex-tracted, and then de novo assembled using Trinity [31].The newly assembled transcripts were mapped to themouse genome with BLAT [32], and only those transcriptsthat fell into genome regions at least 10 kb away from anyannotated Ensembl genes were selected as candidates ofnovel transcripts. The strand and transcription directionof the novel transcripts were determined by analyzing theintron sequences since the splicing sites usually had strandspecificity. Moreover, to exclude any false positive callsfrom potential genomic DNA contamination, we onlyconsidered novel transcripts that contained at least twoexons with length over 500 bp and had clear strandspecificity. From the SUPeR-seq reads of mouse oo-cytes, and two-cell, four-cell, eight-cell, morula andblastocyst stage embryos, we assembled 913 novel tran-scripts in total (Additional file 6). Most of the transcripts(92 %) are separated from other novel transcripts by atleast 5 kb in the genome, indicating their independenceand uniqueness. These novel transcripts range from 500bp to 3 kb in length (Fig. 5a, b) and contain longer in-trons than the annotated transcripts (Fig. 5c). Most ofthem (95 %) lack coding potential and are probablynovel long non-coding RNAs (lncRNAs). We performedhierarchical clustering of the expression levels of thesenovel transcripts in early embryo samples, and found thatmost of them showed developmental stage-specific expres-sion patterns. In particular, most novel transcripts areenriched in oocytes and zygotes (Fig. 5d, e). Principal com-ponent analysis of these novel genes separated embryos ofdifferent developmental stages into distinct groups, indi-cating that they are potentially functionally relevant forpreimplantation development (Fig. 5f), similar to anno-tated genes which were differentially expressed in each ofthe embryonic stages (Fig. S4b in Additional file 1).
Analysis of the maternally and zygotically expressedgenes in mouse preimplantation embryosNext we used SUPeR-seq to analyze both the maternalgenes and the zygotic genes in mouse embryos. A previ-ous report [33] that relied on microarray analysis was re-stricted to known genes and had limited sensitivity and arelatively narrow dynamic range. With SUPeR-seq, weidentified 1238 maternal genes that were down-regulated from oocytes to two-cell embryos (fold change[Two-cell/oocyte] < 0.25, p value < 0.05 Fig. 6a and
a
b c d
Fig. 4 Analysis of reverse complementary sequences and repeat elements for circRNA formation. a Three kinds of repeat element density inthe introns adjacent to end-joining exons of circRNAs. b CircRNAs are divided into three groups according to whether the upstream anddownstream introns contain reverse complementary (RC) sequences and whether these sequences belong to repeat elements (RC-repeats andRC-Nonrepeats). The circRNA expression levels are normalized by the host gene FPKM. CircRNAs with adjacent introns containing RC sequencesshows higher expression than those without RC sequences (NonRC). Moreover, the circRNA expression shows positive correlation with thenumber of RC sequence pairs (Fig. S8c in Additional file 1). c We calculated the distance between the nearest pair of RC sequences bysumming up their distances to the circRNA splicing sites. When the distance is less than 5 kb, the RC sequences seem not to help circRNAformation. d CircRNAs are classed by the strength of the upstream splicing site (up5′ and up3′) of the first exon forming the end-joining siteand those with strong up3′ (top) show higher expression than those with weak up3′, while no differences caused by the strength of up5′ wereobserved. Then when classing the circRNAs by strength of downstream splicing motif (down5′ and down 3′), only circRNAs with strong down5′and weak down3′ show higher expression than all the other groups
Fan et al. Genome Biology (2015) 16:148 Page 9 of 17
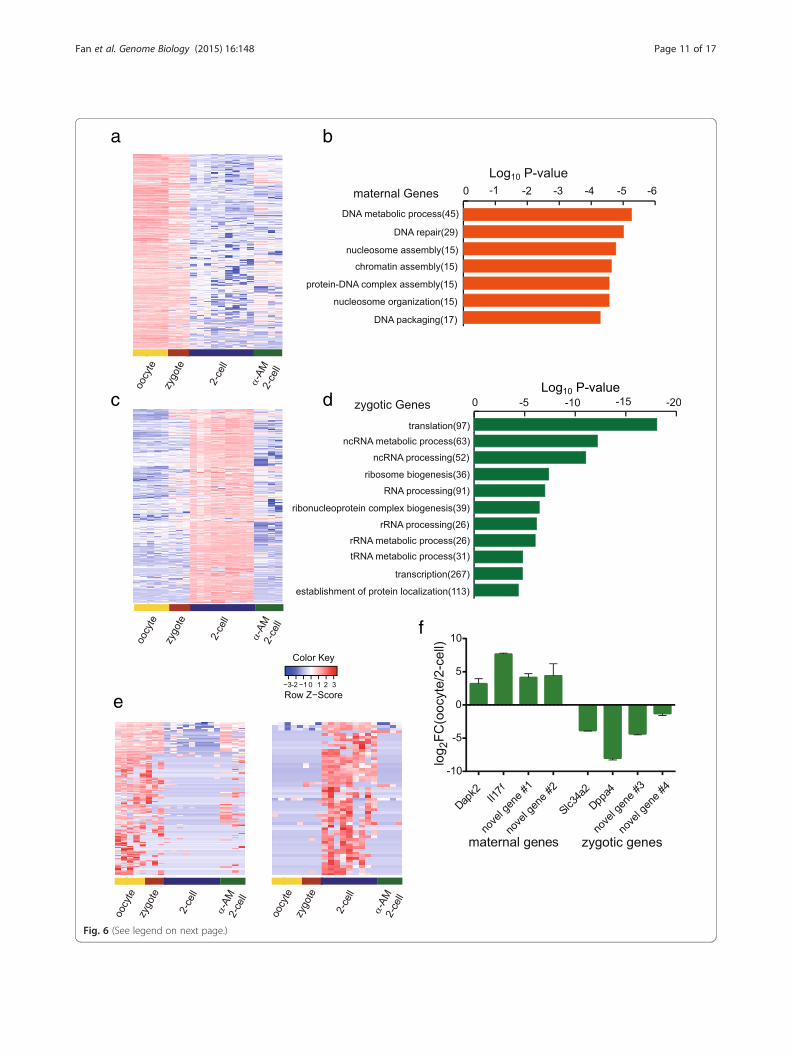
Additional file 1). GO analysis revealed that these mater-nally expressed genes were strongly associated with bio-logical terms related to DNA metabolic processes (Fig. 6b).Meanwhile, we also identified 4143 zygotically expressedgenes that were up-regulated during zygotic gene activationat the two-cell stage (Fig. 6c; Additional file 7). These zyg-otic genes are associated with biological terms relatedto ribosome, translation and transcription process(Fig. 6d). Furthermore, to verify these zygoticallyexpressed genes, we treated mouse zygotes with 100 ng/ml α-Amanitine to globally repress RNA polymerase IIdependent transcription and observed that over 81 %(3368 out of 4143) zygotic genes were no longer up-regulated, demonstrating that they were zygotically
transcribed (Fig. 6c). Other than these annotated genes,we further identified 139 maternally and 57 zygoticallyexpressed novel transcripts. Fifty-five newly identified zyg-otic genes were validated by α-Amanitine treatment(Fig. 6e). In addition, we validated four maternal and zyg-otic genes by RT-qPCR of mouse oocytes and two-cellembryos (Fig. 6f).
Absolute RNA copy number evaluationIt has been shown that the total amount of mRNAschanges drastically during mouse preimplantation devel-opment [5]. To analyze the change in absolute RNAcopy numbers during mouse preimplantation develop-ment, we added External RNA Control Consortium
a
d
b c
e
f
Fig. 5 De novo assembled novel transcripts in mouse preimplantation embryos. a Length distribution for de novo assembled novel transcripts.Candidate novel transcripts with lengths less than 500 bp were filtered out. b Exon number distribution for de novo assembled novel transcripts.Candidate novel transcripts with lengths less than 500 bp were filtered out. c Intron length distribution for novel candidate transcripts. Theintrons of novel candidate genes were slightly longer than annotated introns, on average. d Hierarchical clustering analysis of novel transcripts,which shows stage-specific expression of genes in mouse preimplantation embryo samples. These genes can be divided into three major clusters:cluster I are early zygotic genes which are expressed during the zygote stage and then are down-regulated at later stages; cluster II are maternalgenes, which account for over 60 % of novel genes; cluster III are late zygotic genes which start to be expressed from the two-cell stage. e Thetotal FPKM of all 913 novel genes in each embryonic stage, showing enrichment in the embryo stages before the eight-cell stage, especially inzygotes. f Principal component (PC) analysis of mouse preimplantation embryos based on the 913 novel transcripts
Fan et al. Genome Biology (2015) 16:148 Page 10 of 17
(ERCC) spike-in RNAs into the SUPeR-seq experimentsfor embryos at each stage. We separated each embryolysate into two equal halves and ran SUPeR-seq on each.Thus, we could evaluate the technical variations by
comparing ERCC spike-in RNAs in the two halves. Thecopy number of total mRNA molecules fell sharply from27 million in an oocyte to 4.5 million in a two-cell stageembryo, nearly a sixfold decrease (Fig. 7a and Table 1).
a b
c d
f
e
Fig. 6 (See legend on next page.)
Fan et al. Genome Biology (2015) 16:148 Page 11 of 17
(See figure on previous page.)Fig. 6 Maternally and zygotically expressed genes in mouse preimplantation embryos. a Heatmap of maternally expressed genes. b The top enrichedGO terms overrepresented in 1238 maternally expressed genes. c Heatmap of zygotically expressed genes. The zygotic genes are down-regulated afterblocking of transcription with α-Amanitine treatment of the embryos. d The top enriched GO terms overrepresented in 4143 zygotically expressedgenes. e Expression levels of 139 novel maternal genes and 57 novel zygotic genes in mouse oocytes, normal two-cell embryos and α-Amanitinetreated two-cell embryos were analyzed. e (lLeft: the maternal genes show high expression levels in oocyte samples and are largely down-regulated innormal two-cell embryos. Some maternal genes are also still highly expressed in α-Amanitine treated two-cell embryos. (rRight: the zygotic genes arehighly expressed in normal two-cell embryos. Out of the 57 novel zygotic genes, 54 could be validated, which means they are not transcribed intwo-cell embryos treated with 100 ng/ml α-Amanitine. f RT-qPCR validation of both annotated and novel maternal and zygotic candidate genes.Maternal genes have ΔΔCt(two-cell-oocyte) > 1 and zygotic genes have ΔΔCt(two-cell-oocyte) < −1. Novel gene #1 to novel gene #4 refer tocomp20337_c0, comp46577_c0, comp46858_c0 and comp89562_c0, respectively (also see Additional file 6)
Fan et al. Genome Biology (2015) 16:148 Page 12 of 17
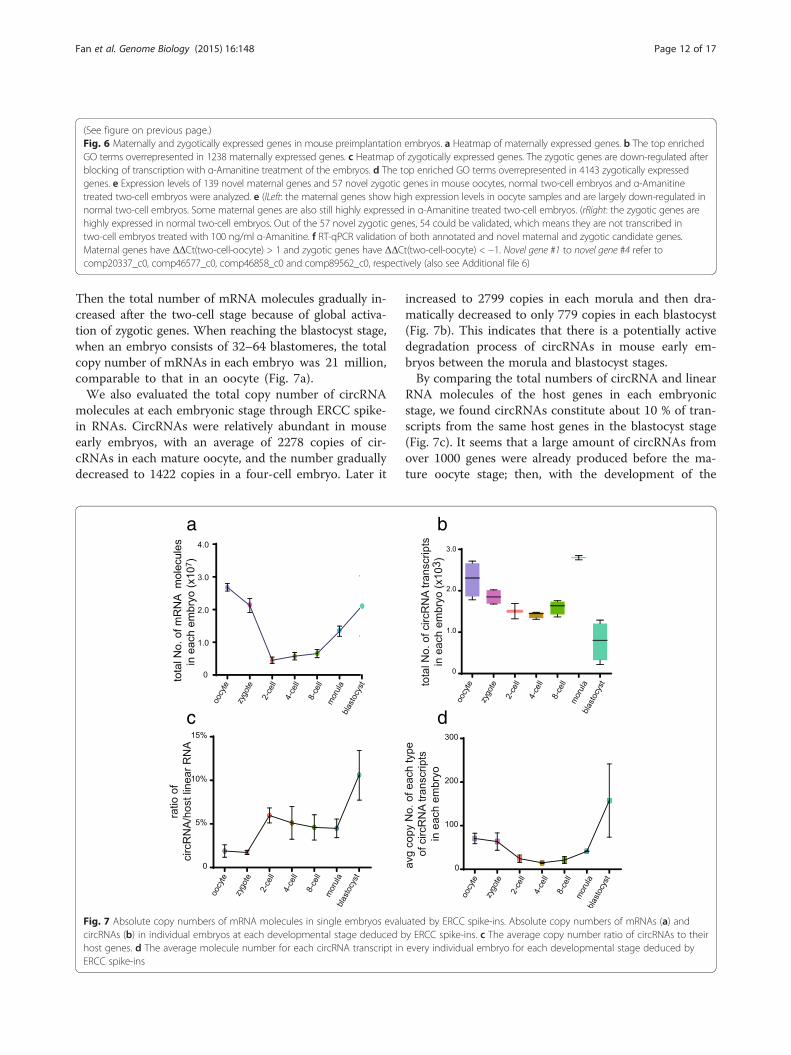
Then the total number of mRNA molecules gradually in-creased after the two-cell stage because of global activa-tion of zygotic genes. When reaching the blastocyst stage,when an embryo consists of 32–64 blastomeres, the totalcopy number of mRNAs in each embryo was 21 million,comparable to that in an oocyte (Fig. 7a).We also evaluated the total copy number of circRNA
molecules at each embryonic stage through ERCC spike-in RNAs. CircRNAs were relatively abundant in mouseearly embryos, with an average of 2278 copies of cir-cRNAs in each mature oocyte, and the number graduallydecreased to 1422 copies in a four-cell embryo. Later it
a
c
Fig. 7 Absolute copy numbers of mRNA molecules in single embryos evalucircRNAs (b) in individual embryos at each developmental stage deduced bhost genes. d The average molecule number for each circRNA transcript inERCC spike-ins
increased to 2799 copies in each morula and then dra-matically decreased to only 779 copies in each blastocyst(Fig. 7b). This indicates that there is a potentially activedegradation process of circRNAs in mouse early em-bryos between the morula and blastocyst stages.By comparing the total numbers of circRNA and linear
RNA molecules of the host genes in each embryonicstage, we found circRNAs constitute about 10 % of tran-scripts from the same host genes in the blastocyst stage(Fig. 7c). It seems that a large amount of circRNAs fromover 1000 genes were already produced before the ma-ture oocyte stage; then, with the development of the
b
d
ated by ERCC spike-ins. Absolute copy numbers of mRNAs (a) andy ERCC spike-ins. c The average copy number ratio of circRNAs to theirevery individual embryo for each developmental stage deduced by
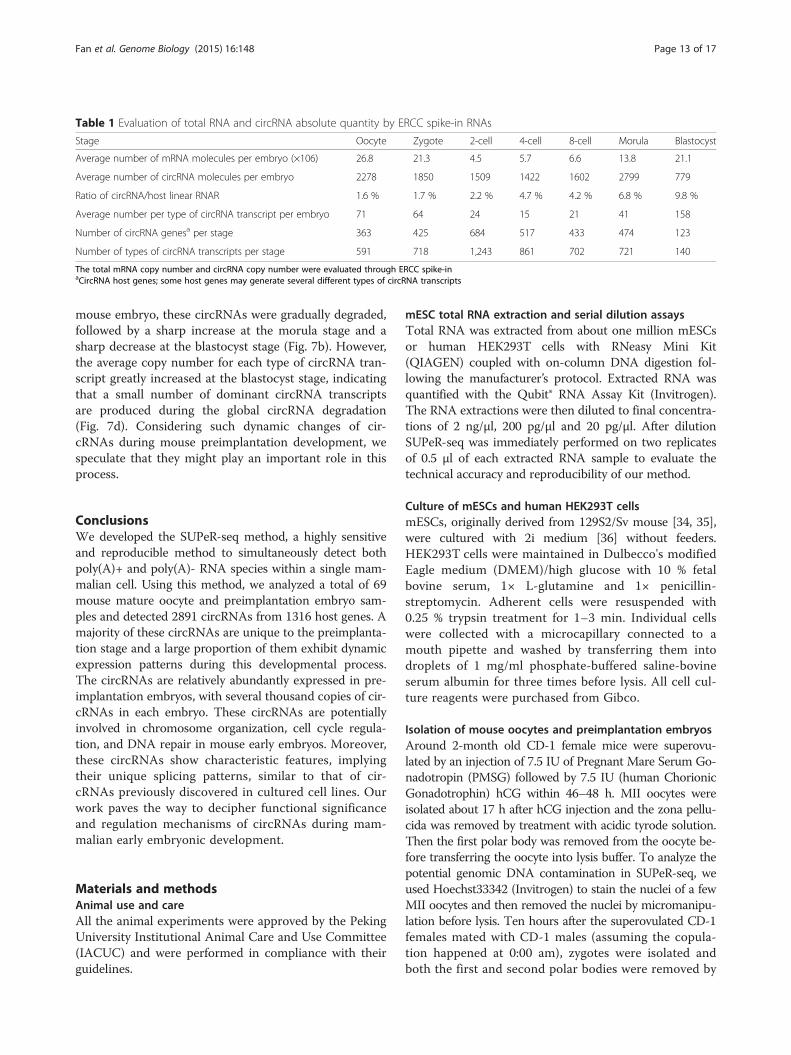
Table 1 Evaluation of total RNA and circRNA absolute quantity by ERCC spike-in RNAs
Stage Oocyte Zygote 2-cell 4-cell 8-cell Morula Blastocyst
Average number of mRNA molecules per embryo (×106) 26.8 21.3 4.5 5.7 6.6 13.8 21.1
Average number of circRNA molecules per embryo 2278 1850 1509 1422 1602 2799 779
Ratio of circRNA/host linear RNAR 1.6 % 1.7 % 2.2 % 4.7 % 4.2 % 6.8 % 9.8 %
Average number per type of circRNA transcript per embryo 71 64 24 15 21 41 158
Number of circRNA genesa per stage 363 425 684 517 433 474 123
Number of types of circRNA transcripts per stage 591 718 1,243 861 702 721 140
The total mRNA copy number and circRNA copy number were evaluated through ERCC spike-inaCircRNA host genes; some host genes may generate several different types of circRNA transcripts
Fan et al. Genome Biology (2015) 16:148 Page 13 of 17
mouse embryo, these circRNAs were gradually degraded,followed by a sharp increase at the morula stage and asharp decrease at the blastocyst stage (Fig. 7b). However,the average copy number for each type of circRNA tran-script greatly increased at the blastocyst stage, indicatingthat a small number of dominant circRNA transcriptsare produced during the global circRNA degradation(Fig. 7d). Considering such dynamic changes of cir-cRNAs during mouse preimplantation development, wespeculate that they might play an important role in thisprocess.
ConclusionsWe developed the SUPeR-seq method, a highly sensitiveand reproducible method to simultaneously detect bothpoly(A)+ and poly(A)- RNA species within a single mam-malian cell. Using this method, we analyzed a total of 69mouse mature oocyte and preimplantation embryo sam-ples and detected 2891 circRNAs from 1316 host genes. Amajority of these circRNAs are unique to the preimplanta-tion stage and a large proportion of them exhibit dynamicexpression patterns during this developmental process.The circRNAs are relatively abundantly expressed in pre-implantation embryos, with several thousand copies of cir-cRNAs in each embryo. These circRNAs are potentiallyinvolved in chromosome organization, cell cycle regula-tion, and DNA repair in mouse early embryos. Moreover,these circRNAs show characteristic features, implyingtheir unique splicing patterns, similar to that of cir-cRNAs previously discovered in cultured cell lines. Ourwork paves the way to decipher functional significanceand regulation mechanisms of circRNAs during mam-malian early embryonic development.
Materials and methodsAnimal use and careAll the animal experiments were approved by the PekingUniversity Institutional Animal Care and Use Committee(IACUC) and were performed in compliance with theirguidelines.
mESC total RNA extraction and serial dilution assaysTotal RNA was extracted from about one million mESCsor human HEK293T cells with RNeasy Mini Kit(QIAGEN) coupled with on-column DNA digestion fol-lowing the manufacturer’s protocol. Extracted RNA wasquantified with the Qubit® RNA Assay Kit (Invitrogen).The RNA extractions were then diluted to final concentra-tions of 2 ng/μl, 200 pg/μl and 20 pg/μl. After dilutionSUPeR-seq was immediately performed on two replicatesof 0.5 μl of each extracted RNA sample to evaluate thetechnical accuracy and reproducibility of our method.
Culture of mESCs and human HEK293T cellsmESCs, originally derived from 129S2/Sv mouse [34, 35],were cultured with 2i medium [36] without feeders.HEK293T cells were maintained in Dulbecco's modifiedEagle medium (DMEM)/high glucose with 10 % fetalbovine serum, 1× L-glutamine and 1× penicillin-streptomycin. Adherent cells were resuspended with0.25 % trypsin treatment for 1–3 min. Individual cellswere collected with a microcapillary connected to amouth pipette and washed by transferring them intodroplets of 1 mg/ml phosphate-buffered saline-bovineserum albumin for three times before lysis. All cell cul-ture reagents were purchased from Gibco.
Isolation of mouse oocytes and preimplantation embryosAround 2-month old CD-1 female mice were superovu-lated by an injection of 7.5 IU of Pregnant Mare Serum Go-nadotropin (PMSG) followed by 7.5 IU (human ChorionicGonadotrophin) hCG within 46–48 h. MII oocytes wereisolated about 17 h after hCG injection and the zona pellu-cida was removed by treatment with acidic tyrode solution.Then the first polar body was removed from the oocyte be-fore transferring the oocyte into lysis buffer. To analyze thepotential genomic DNA contamination in SUPeR-seq, weused Hoechst33342 (Invitrogen) to stain the nuclei of a fewMII oocytes and then removed the nuclei by micromanipu-lation before lysis. Ten hours after the superovulated CD-1females mated with CD-1 males (assuming the copula-tion happened at 0:00 am), zygotes were isolated andboth the first and second polar bodies were removed by
Fan et al. Genome Biology (2015) 16:148 Page 14 of 17
micromanipulation. Two-cell stage embryos were iso-lated from the oviduct of the mice 36 h after mating.For these embryos, we mechanically dissected the blas-tomeres of each embryo with a glass needle after re-moving the zona pellucida and polar bodies. The four-cell, eight-cell and morula stage embryos were isolatedfrom mouse oviduct at 44 h, 57 h and 64 h after copu-lation. Then some morulae were cultured in KSOM(Millipore) for another 20 h to obtain blastocysts.
Single cell cDNA amplificationSingle cells were lysed to release all RNAs, which thenwere reverse transcribed into first cDNA strands bySuperScript III reverse transcriptase (Invitrogen) and ran-dom primers with an anchor sequence (AnchorX-T15N6)at 25 °C for 5 min, and 50 °C for 30 min. Then the reversetranscriptase was inactivated by heat treatment at 70 °Cfor 15 min. We digested the unreacted primers withExoSAP-IT (USB). Then poly(A) tails were added to thefirst-strand cDNAs at their 3′ ends by terminal deoxynu-cleotidyl transferase (Invitrogen) with final dATP andddATP concentrations of 3 mM and 30 μM, respectively.Next, the second-strand cDNAs were synthesized usingpoly(T) primers with another anchor sequence (AnchorY-T24). These cDNAs were then pre-amplified by PCR with16 cycles of 95 °C for 30 s, 67 °C for 1 min, 72 °C for 6min (plus 12 s more after each cycle). Then the PCR prod-ucts were purified by PCR Purification Kit (QIAGEN) and0.2–5 kb fragments were recovered from agarose-gel elec-trophoresis. These purified cDNAs were further amplifiedby another ten cycles of PCR using poly(T) primers withanchor sequences and C6-amine-blocked 5′ ends (NH2-AnchorX-T15 and NH2-AnchorY-T24). After purification,the cDNAs were ready for sequencing library preparation.The sequence of AnchorX is 5′-GTCGACGGCGCGCCGGATCCATA-3′ and the sequence of AnchorY is 5′-ATATCTCGAGGGCGCGCCGGATCC-3′.
Sequencing library generation and next-generationsequencing of single cell cDNA samplesTypically 200–300 ng amplified cDNAs were sonicatedto around 200 bp long fragments using a Covaris acous-tic shearing instrument and then used to construct Illu-mina sequencing libraries following Illumina’s TruSeqDNA sample preparation protocols. The fragmentedcDNAs were end-repaired, a single A base was added tothe 3′ end, and then ligated with illumina PE adaptors.Then the ligated DNA fragments were enriched andamplified with ten cycles of PCR. The libraries were se-quenced on either Illumina’s HiSeq 2000, or HiSeq 2500instruments with 100-bp pair-end reads. All clusters thatpassed the quality filter were exported into fastq files.
Sequencing library generation for bulk amount of mouseES cell RNA and HEK293T cell RNATotal RNA (1 μg) was used for deep-sequencing libraryconstruction following the instructions of the TruSeqRNA sample preparation kit (Illumina). The final quality-ensured libraries were sequenced on a HiSeq 2000 se-quencer generating 100 bp paired-end reads.
Single cell lysis buffer replacementThe original lysis condition of SUPeR-seq consists of0.9× PCR buffer II and 5 mM MgCl2 (Geneamp), 0.45 %NP40 (Roche), 4.5 mM DTT (Invitrogen), 0.36 U/ulRNase inhibitor (Invitrogen), 0.18 U/μl SUPERase-In(Invitrogen), 0.125 mM dNTP (Takara) and 50 nM RTprimer in a total volume of 4.5 μl. When checkingwhether the bias on rRNA is because of the cell lysiscomponents, we replaced the lysis buffer with conven-tional RT buffer which consisted of 1× First Strand Buf-fer (Invitrogen), 4.5 mM DTT (Invitrogen), 0.36 U/μlRNase inhibitor (Invitrogen), 0.25 mM dNTP (Takara)and 50 nM RT primer in a total volume of 4.5 μl. Inboth conditions, the lysis reaction set as 70 °C for 90 son the thermocycler.
rRNA-depleted HEK293T cell total RNA library preparationTotal RNA (5 μg) was used for removing the rRNAs usingRibo-Zero rRNA Removal Kits (Epicentre) following themanufacturer's instructions. The rRNA-depleted RNAswere then used for library construction using the IlluminaTruSeq RNA sample preparation kit.
Alignment of sequencing reads and gene-expressionanalysisThe raw reads were filtered with a quality control pipelinein Perl script to remove low quality reads (reads with 50 %of bases with quality value ≤ 5 and >10 % bases undeter-mined). The adaptor sequences and poly (A)24/(T)24 se-quences were trimmed off. We also removed the reads withATcontent higher than 80 %, which were probably a bypro-duct of cDNA synthesis. We mapped the filtered reads tomm10/hg19 with TopHat (version 2.0.6) [37]. Then geneexpression levels were calculated and normalized as FPKMwith Cufflinks (version 2.1.1) [38]. The gene annotationGTF files for mm10 and hg19 were downloaded from En-semble (release 73) and Gencode (v18), respectively.
Poly(A)- gene detection in HET293T cellsWe prepared four replicates of rRNA-depleted RNA-seqsamples, four replicates of oligo(dT)-enriched RNA-seqsamples and three replicates depleted of both rRNA andpoly(A)-tailed mRNA samples. The expression level(FPKM) of GENCODE genes was estimated using Cuf-flinks (version 2.1.1). Student’s t-test was used to calcu-late the p value between expression of genes from two
Fan et al. Genome Biology (2015) 16:148 Page 15 of 17
groups. Genes that showed at least a twofold enrichmentin the rRNA-depleted group compared with the oli-go(dT)-enriched group (p value < 0.05), and at the sametime with FPKM > 1 in the group in which both rRNAand polyadenylated RNA were depleted, were consideredas poly(A)- genes. Also, genes with length less than 300bp were filtered out.
Detection of circRNAs from single cellsFor every filtered read with length over 60 bp, anchor-pair sequences were extracted by cutting the first andlast 25 bp of the read. Two fastq files were generated,with the first storing all anchors in the first 25 bp andthe second storing the last 25 bp anchor sequences inorder. Then anchor pairs were mapped to the mm10/hg19 genome with bowtie2. The anchor pairs flankingthe joining end of a circRNA should be mapped to thesame chromatin within 100 kb at the same strand but inthe reversed order. To improve reliability, we only con-sidered circRNA events which were joined by two exonsfrom a single Ensembl transcript. We further inspectedthe pair-mate of the anchor pairs, and for most of thecircRNAs, the pair-mate was mapped to the same geneand within the span of the circRNAs.To verify our data analysis pipeline, we processed the
raw data from Memczak et al. [16]. In our pipeline, wemainly considered the circRNAs with junctions using thewell-annotated splicing sites. We found 191 circRNAs,out of which 173 matched with those reported by Mem-czak et al., an overlap ratio of 93.5 %. On the other hand,we adopted Memczak’s analysis pipeline to process ourexperimental data. For SUPeR-seq data of seven singleHEK293T cells, the Memczak pipeline and our pipelinereported 119 and 141 circRNAs with at least two junctionreads, respectively, and the overlap between them was 113(overlap coverage ratio of 86.9 %). These results clearlydemonstrated the sensitivity and reliability of our dataanalysis pipeline. The pipeline presented by Memczaket al. [16] did report circRNAs with unannotated splicingsites when analyzing our SUPeR-seq data. However, we ran-domly chose five of them (chr11:118363842–118372449,chr1:178745855–178846761, chr1:182567912–182571214,chr22:30093929–30094454, chr5:78533474–78611974) tovalidate the junction sites joining the first and last exons ofthe circRNA by RT-PCR and all failed to generate a bandwith the expected size when running the PCR products onagarose gels.
circRNA validation by RT-PCRTwenty circRNAs from the circRNA list of HEK293T cellsand eight circRNAs from the list of mouse oocytes werepicked out for verification. For each circRNA we designeda pair of divergent PCR primers at the circRNA positionon the genome. Then the HEK293T cell or the mouse
oocyte total RNAs reverse transcribed with randomprimers were used as a PCR template. PCR amplificationwas carried out by the following program: 95 °C for 5minfollowed by 35 cycles of 95 °C for 30 s, 54 °C for 30 s and72 °C for 30 s, then 72 °C for 7 min. The PCR productswere then run on 1.5 % agarose gels. The predictedstrands were cut out directly for Sanger sequencing.
Maternal and zygotic gene validation and RT-qPCR of cir-cRNAs to detect expression along mouse preimplantationembryosFor each stage, about 40 embryos were isolated and totalRNA was extracted with the RNeasy Micro Kit (QIAGEN).When lysing the embryos in RLT buffer, correspondingGFP molecules were added (for each embryo we added 106
GFP molecules). The RNAs were eluted in 10 μl elutionbuffer and reverse transcribed by SuperScript III(Invitrogen). The cDNAs in the reaction buffer were pre-cipitated by 2.5 volumes of alcohol. The cDNAs in the sed-iments were resuspended by nuclease-free water accordingto the initial number of embryos (1 μl H2O for two em-bryos). Then qPCR was carried out using these dissolvedcDNAs. For circRNAs we used the divergent primers onthe genome to amplify the end-joining site. For the linearRNAs, we designed primers on the last exon of the genes.
RNase R resistance validation of circRNA candidatesHEK293T cell total RNA (4 μg) was treated withRNase R (Epicentre) or nuclease-free water (mockcontrol) at 37 °C for 15 min. Then the treated RNAswere reverse transcribed with random primers bySuperScript III (Invitrogen). The cDNAs were thenused as qPCR templates.
Analysis of the sensitivity and reproducibility of SUPeR-seqThe sequencing data from four 10-pg mESC total RNAsamples were used to analyze the technical reproducibilityof SUPeR-seq. We calculated the pairwise Pearson correl-ation coefficients of FPKM values between samples. Genesthat did not show any expression in both samples were ex-cluded from the calculation. The gene expression of two10-pg samples by Smart-seq2 were downloaded from theGene Expression Omnibus database (accession GSE49321)[4]. The sequencing data from different methods wereprocessed and gene expression level was estimated inthe same way using TopHat (version 2.0.6) and Cuf-flinks (version 2.2.1). The gene annotation GTF file wasdownloaded from GENCODE (version V18).
De novo assembly of new transcripts and genesFor mouse preimplantation embryonic cells, we de novoassembled RNA reads that did not map to annotatedgenes. Together there were 29 early embryonic samplesincluding five oocytes, three zygotes, six two-cell stage
Fan et al. Genome Biology (2015) 16:148 Page 16 of 17
blastomeres, and three embryos each for the two-cell,four-cell, eight-cell, morula and blastocyst stages. Readsunmapped to RefSeq and Ensembl were exported to afastq format file and then transferred to a Trinity [37]pipeline. After filtering the transcripts with length lessthan 500 bp, the remaining transcripts were mapped togenome genes with BLAT [38], and the structure of thenovel transcripts was recovered including introns andexons. To exclude possible genome contamination and in-crease the accuracy of prediction, we only considered thetranscripts containing at least two exons. To exclude thepossibility of relationship with known Ensembl genes, weremoved the transcripts that had Ensembl genes in theneighboring 10 kb up- or downstream along the genome.Furthermore, we predicted the strand of the transcriptsbased on the notion that the first and last two bases of al-most all introns is GT and AG. The GTF files of these 913genes were output and the expression levels of the assem-bled transcripts (FPKM) were estimated with Cufflinks(version 2.1.1).
Analysis of maternal and zygotic genesThe number of fragments that mapped to each mouseEnsembl gene was counted with Cufflinks (version 2.2.1) inall five oocyte, nine two-cell stage and four α-Amanitine-treated two-cell stage embryonic samples. Then we usedthe edgeR package in R to detect the differentially expressedgenes. The maternal genes were defined as those thatshowed fourfold enrichment in oocytes and a p value <0.05, while zygotic genes showed a fourfold enrichment intwo-cell stage embryos. We identified 4143 annotated zyg-otic genes and 1238 annotated maternal genes under thecriteria above. At the same time, we identified 139 novelmaternal genes and 57 novel zygotic genes. Global valid-ation of zygotic genes was performed by comparing geneexpression levels in normal two-cell embryos to those in100 ng/ml α-Amanitine-treated two-cell embryos: 3368 outof 4143 (81 %) annotated zygotic genes and 55 out of 57novel zygotic genes (96 %) showed fourfold down-regulation in α-Amanitine treated samples.
Reverse complementary sequences between intronsupstream and downstream of circRNAsBlastn was used to analyze the reverse complementary se-quences between the flanking introns of circRNAs withthe upstream intron sequence being the subject anddownstream intron sequence being the query. The param-eter is word_size 11 -gapopen 5 -gapextend 2 -penalty −3-reward 2. Reverse complementary sequences longer than25 were considered.
Data processing workflow for circRNA analysis
1. Raw data from illumina Hiseq2000 or Hiseq2500
2. Quality control (QC): cut adaptor and low qualityreads
3. Map to genome: using TopHat2 default setting4. Output unmapped reads: using Samtools view -f 45. Create anchor reads: cut 25 bp from two ends of
each 100 bp read6. Map anchor reads to genome: using Bowtie2 default
setting7. Filter candidate reads: find sequence with two
anchors mapping to the same chromsome ofopposite directions within distance <200 kb
8. Filtering with existing exon junctions: the twoanchors of candidate circRNA reads are thenmapped to the exons within the same transcript andthey must match the flanking sequences of exons.
Accession codesRaw sequencing data, mapped data and data forvisualization of all SUPeR-seq analyses have been de-posited to the Gene Expression Omnibus (accessionGSE53386).
Additional files
Additional file 1: Maternal and zygotic genes found in the mouseembryos. Figure S1. SUPeR-seq could detect non-poly(A) geneswithout rRNA or genome contamination. Figure S2. SUPeR-seq showshigh sensitivity, reproducibility and more accuracy. Figure S3.Correlations of gene expression levels among the pool-and-splitHEK293T cells. Figure S4. SUPeR-seq achieves high correlation betweenbiological replicates. Figure S5. Validation of circRNAs in HEK293T cells.Figure S6. CircRNA full-length validation. Figure S7. CircRNA validationin mouse oocytes. CircRNA abundance is related to introns adjacent toexons forming the circRNA. Figure S8. CircRNA abundance is related tointrons adjacent to exons forming the circRNA.
Additional file 2: Spike-in RNAs in SUPeR-seq mESC samples.
Additional file 3: Poly(A)- genes in HEK293T cells.
Additional file 4: CircRNAs in mouse preimplantation embryos andHEK293T cells.
Additional file 5: MicroRNA binding sites on the circRNAs.
Additional file 6: De novo assembled genes in the mousepreimplantation embryos.
Additional file 7: Maternal and zygotic genes found in the mouseembryos.
Abbreviationsbp: base pair; circRNA: circular RNA; ERCC: External RNA Control Consortium;GFP: green fluorescent protein; GO: gene ontology; kb: kilobase;mESC: mouse embryonic stem cell; miRNA: microRNA; rRNA: ribosomal RNA;FPKM: Fragments Per Kilobase of exon model per Million mapped reads;PCR: polymerase chain reaction; RFP: red fluorescent protein; RT: reversetranscription; RT-qPCR: quantitative RT-PCR; SUPeR-seq: single cell universalpoly(A)-independent RNA sequencing.
Competing interestsThe authors declare that they have no competing interests.
Authors’ contributionsFT and YaH conceived and designed the study. XF developed the protocol,conducted the main experiments and XZ was in charge of all thebioinformatic analyses. XW contributed to the collection of mouse oocytes
Fan et al. Genome Biology (2015) 16:148 Page 17 of 17
and early embryos. HG prepared mESC total RNA and bulk samplesequencing. YuH did the validation experiment on circRNAs. XF, XZ, FT andYaH wrote the paper with the help from all of the authors. All authors readand approved the final manuscript.
Authors’ informationXiaoying Fan and Xiannian Zhang are co-first authors.
AcknowledgementsWe thank Dr Zemin Zhang and Dr Aaron Streets for help and criticalcomments during manuscript preparation. This work was supported by theMinistry of Science and Technology of China (2012CB966704, 2011CB809106,and 2011CB966303), the National Natural Science Foundation of China(21222501, 91313302, 21327808, 31322037, and 31271543) and the BeijingMunicipal Science and Technology Commission (D15110700240000).
Author details1Biodynamic Optical Imaging Center (BIOPIC), Peking University, Beijing100871, China. 2College of Life Sciences, Peking University, Beijing 100871,China. 3College of Engineering, Peking University, Beijing 100871, China.4Ministry of Education Key Laboratory of Cell Proliferation and Differentiation,Peking University, Beijing 100871, China. 5Peking-Tsinghua Center for LifeSciences, Peking University, Beijing 100871, China. 6Center for Molecular andTranslational Medicine, Peking University Health Science Center, Beijing100191, China. 7Academy for Advanced Interdisciplinary Studies, PekingUniversity, Beijing 100871, China.
Received: 3 March 2015 Accepted: 26 June 2015
References1. Shalek AK, Satija R, Adiconis X, Gertner RS, Gaublomme JT, Raychowdhury R,
et al. Single-cell transcriptomics reveals bimodality in expression and splicingin immune cells. Nature. 2013;498:236–40.
2. Tang FC, Barbacioru C, Wang YZ, Nordman E, Lee C, Xu NL, et al. mRNA-Seqwhole-transcriptome analysis of a single cell. Nat Methods. 2009;6:377–U386.
3. Ramskold D, Luo SJ, Wang YC, Li R, Deng QL, Faridani OR, et al. Full-lengthmRNA-Seq from single-cell levels of RNA and individual circulating tumorcells. Nat Biotechnol. 2012;30:777–82.
4. Picelli S, Bjorklund AK, Faridani OR, Sagasser S, Winberg G, Sandberg R.Smart-seq2 for sensitive full-length transcriptome profiling in single cells.Nat Methods. 2013;10:1096–8.
5. Mahata B, Zhang XW, Kolodziejczyk AA, Proserpio V, Haim-Vilmovsky L, TaylorAE, et al. Single-Cell RNA Sequencing Reveals T Helper Cells SynthesizingSteroids De Novo to Contribute to Immune Homeostasis. Cell Reports.2014;7:1130–42.
6. Hashimshony T, Wagner F, Sher N, Yanai I. CEL-Seq: Single-Cell RNA-Seq byMultiplexed Linear Amplification. Cell Reports. 2012;2:666–73.
7. Sasagawa Y, Nikaido I, Hayashi T, Danno H, Uno KD, Imai T, et al. Quartz-Seq: ahighly reproducible and sensitive single-cell RNA sequencing method, revealsnon-genetic gene-expression heterogeneity. Genome Biol. 2013;14.
8. Buganim Y, Faddah DA, Cheng AW, Itskovich E, Markoulaki S, Ganz K, et al.Single-Cell Expression Analyses during Cellular Reprogramming Reveal anEarly Stochastic and a Late Hierarchic Phase. Cell. 2012;150:1209–22.
9. Flynn JM, Spusta SC, Rosen CJ, Melov S. Single cell gene expressionprofiling of cortical osteoblast lineage cells. Bone. 2013;53:174–81.
10. Deng QL, Ramskold D, Reinius B, Sandberg R. Single-Cell RNA-Seq RevealsDynamic, Random Monoallelic Gene Expression in Mammalian Cells. Science.2014;343:193–6.
11. Yan LY, Yang MY, Guo HS, Yang L, Wu J, Li R, et al. Single-cell RNA-Seq profilingof human preimplantation embryos and embryonic stem cells. Nat Struct MolBiol. 2013;20:1131.
12. Yang L, Duff MO, Graveley BR, Carmichael GG, Chen LL. Genomewidecharacterization of non-polyadenylated RNAs. Genome Biol. 2011;12.
13. Slomovic S, Laufer D, Geiger D, Schuster G. Polyadenylation of ribosomalRNA in human cells. Nucleic Acid Res. 2006;34:2966–75.
14. Jeck WR, Sharpless NE. Detecting and characterizing circular RNAs. NatBiotechnol. 2014;32:453–61.
15. Hansen TB, Jensen TI, Clausen BH, Bramsen JB, Finsen B, Damgaard CK, et al.Natural RNA circles function as efficient microRNA sponges. Nature.2013;495:384–8.
16. Memczak S, Jens M, Elefsinioti A, Torti F, Krueger J, Rybak A, et al. CircularRNAs are a large class of animal RNAs with regulatory potency. Nature.2013;495:333–8.
17. Nigro JM, Cho KR, Fearon ER, Kern SE, Ruppert JM, Oliner JD, et al.Scrambled Exons. Cell. 1991;64:607–13.
18. Salzman J, Chen RE, Olsen MN, Wang PL, Brown PO. Cell-Type Specific Featuresof Circular RNA Expression. Plos Genetics. 2013;9.
19. Suzuki H, Zuo YH, Wang JH, Zhang MQ, Malhotra A, Mayeda A.Characterization of RNase R-digested cellular RNA source that consists of lariatand circular RNAs from pre-mRNA splicing. Nucleic Acid Res. 2006;34.
20. Zhang Y, Zhang XO, Chen T, Xiang JF, Yin QF, Xing YH, et al. CircularIntronic Long Noncoding RNAs. Mol Cell. 2013;51:792–806.
21. Marzluff WF. Metazoan replication-dependent histone mRNAs: a distinct setof RNA polymerase II transcripts. Curr Opin Cell Biol. 2005;17:274–80.
22. Wickramasinghe D, Ebert KM, Albertini DF. Meiotic Competence AcquisitionIs Associated with the Appearance of M-Phase Characteristics in GrowingMouse Oocytes. Dev Biol. 1991;143:162–72.
23. Nakamura T, Yabuta Y, Okamoto I, Aramaki S, Yokobayashi S, Kurimoto K,et al. SC3-seq: a method for highly parallel and quantitative measurementof single-cell gene expression. Nucleic Acid Res. 2015;43.
24. Guo JU, Agarwal V, Guo HL, Bartel DP. Expanded identification andcharacterization of mammalian circular RNAs. Genome Biol. 2014;15.
25. Ashwal-Fluss R, Meyer M, Pamudurti NR, Ivanov A, Bartok O, Hanan M, et al.circRNA Biogenesis Competes with Pre-mRNA Splicing. Mol Cell.2014;56:55–66.
26. Zhang XO, Wang HB, Zhang Y, Lu XH, Chen LL, Yang L. ComplementarySequence-Mediated Exon Circularization. Cell. 2014;159:134–47.
27. Cocquerelle C, Daubersies P, Majerus MA, Kerckaert JP, Bailleul B. Splicingwith Inverted Order of Exons Occurs Proximal to Large Introns. EmboJournal. 1992;11:1095–8.
28. Chen LL, DeCerbo JN, Carmichael GG. Alu element-mediated gene silencing.Embo Journal. 2008;27:1694–705.
29. Dubin RA, Kazmi MA, Ostrer H. Inverted repeats are necessary forcircularization of the mouse testis Sry transcript. Gene. 1995;167:245–8.
30. Jeck WR, Sorrentino JA, Wang K, Slevin MK, Burd CE, Liu JZ, et al. CircularRNAs are abundant, conserved, and associated with ALU repeats (vol 19, pg141, 2013). RNA-a Publication of the RNA Society. 2013;19:426–6.
31. Grabherr MG, Haas BJ, Yassour M, Levin JZ, Thompson DA, Amit I, et al.Full-length transcriptome assembly from RNA-Seq data without areference genome. Nat Biotechnol. 2011;29:644–U130.
32. Kent WJ. BLAT - The BLAST-like alignment tool. Genome Res. 2002;12:656–64.33. Hamatani T, Carter MG, Sharov AA, Ko MSH. Dynamics of global gene
expression changes during mouse preimplantation development.Developmental Cell. 2004;6:117–31.
34. Bao SQ, Tang FC, Li XH, Hayashi K, Gillich A, Lao KQ, et al. Epigeneticreversion of post-implantation epiblast to pluripotent embryonic stem cells.Nature. 2009;461:1292–5.
35. Tang FC, Barbacioru C, Nordman E, Li B, Xu NL, Bashkirov VI, et al. RNA-Seqanalysis to capture the transcriptome landscape of a single cell. Nat Protocols.2010;5:516–35.
36. Ying QL, Wray J, Nichols J, Batlle-Morera L, Doble B, Woodgett J, et al. Theground state of embryonic stem cell self-renewal. Nature. 2008;453:519–U515.
37. Kim D, Pertea G, Trapnell C, Pimentel H, Kelley R, Salzberg SL. TopHat2:accurate alignment of transcriptomes in the presence of insertions,deletions and gene fusions. Genome Biol. 2013;14.