Single Case Desing
41
206 CHAPTER 7 Single-Subject Design Foundations of Single-Subject Design 208 Repeated Measurement 208 Baseline Phase 209 Patterns 209 Internal Validity 212 Treatment Phase 214 Graphing 214 Measuring Targets of Intervention 214 Analyzing Single-Subject Designs 217 Visual Analysis 218 Level 218 Trend 218 Variability 220 Interpreting Visual Patterns 220 Problems of Interpretation 222 Types of Single-Subject Designs 225 Basic Design: A-B 228 Withdrawal Designs 229 A-B-A Design 230 A-B-A-B Design 231 Multiple Baseline Designs 231 Multiple Treatment Designs 236 Designs for Monitoring Subjects 237 Implications for Evidence-Based Practice 239 Single-Subject Design in a Diverse Society 240 Ethical Issues in Single-Subject Design 241 Conclusion 242 Key Terms 242 Highlights 243 Discussion Questions 243 Practice Exercises 244 Web Exercises 244 Developing a Research Proposal 245 A Question of Ethics 245 07-Engel-45816:01-Papa-45411.qxd 9/27/2008 7:24 PM Page 206
-
Upload
naruto-zen -
Category
Documents
-
view
129 -
download
1
description
Single Case Desing
Transcript of Single Case Desing
206
C H A P T E R 7
Single-Subject Design
Foundations of Single-Subject Design 208Repeated Measurement 208Baseline Phase 209
Patterns 209Internal Validity 212
Treatment Phase 214Graphing 214
Measuring Targets of Intervention 214Analyzing Single-Subject Designs 217
Visual Analysis 218Level 218Trend 218Variability 220
Interpreting Visual Patterns 220Problems of Interpretation 222
Types of Single-Subject Designs 225Basic Design: A-B 228Withdrawal Designs 229
A-B-A Design 230A-B-A-B Design 231
Multiple Baseline Designs 231Multiple Treatment Designs 236Designs for Monitoring Subjects 237
Implications for Evidence-Based Practice 239Single-Subject Design in a Diverse Society 240Ethical Issues in Single-Subject Design 241Conclusion 242Key Terms 242Highlights 243Discussion Questions 243Practice Exercises 244Web Exercises 244Developing a Research Proposal 245A Question of Ethics 245
07-Engel-45816:01-Papa-45411.qxd 9/27/2008 7:24 PM Page 206
Jody was a 26-year-old Caucasian female employed as a hairdresser. . . . She livedwith her two children, ages 7 and 3 in a substandard basement apartment in thehouse of her mother-in-law, a woman who was emotionally and sometimesphysically abusive to Jody. Jody came from a divorced family where she had beenphysically abused by both parents. . . . In the second session she expressed feelingseverely depressed because her estranged husband had abducted the children andrefused to return them. . . . She and her husband had lived together for five years,split for 7 years, and until the recent separation, had lived together for 3 years. . . .Jody said she felt helpless, immobilized and unable to protect her children. Shereported difficulty in sleeping and eating and had frequent crying episodes. Shereported a 25-pound weight loss in the past 3 months. She had been unable towork for 1 week because of a high level of anxiety and fatigue. Jody also said shehad recurring suicidal thoughts. (Jensen, 1994, p. 273)
It is not unusual for social work practitioners to have clients such as Jody who have amental health condition such as depression. As practitioners, we often think we “know”when a client is improving. Yet when we use our own subjective conclusions, we are proneto human error. In this chapter, you learn how single-subject designs can be used to sys-tematically test the effectiveness of a particular intervention as well as monitor clientprogress.
Single-subject (sometimes referred to as single-case or single-system) designs offer analternative to group designs. The very name suggests that the focus is on an N = 1, a sin-gle subject, in which the “1” can be an individual, an agency, or a community. The struc-ture of these designs, which are easily adapted to social work practice, makes them usefulfor research on interventions in direct and community practice. The process of assessment,establishing intervention goals and specific outcomes, providing the intervention, and eval-uating progress have direct parallels to the structure of single-subject designs, whichdepend on identifying target problems, taking preintervention measures, providing theintervention, taking additional measures, and making decisions about the efficacy of theintervention. Because of these parallels, social work educators have increasingly describedhow single-subject design can be used to evaluate practice and improve client outcomesthrough monitoring a client’s progress.
Contrast this design with group designs. In chapter 6, we noted that group designs do notnaturally conform to practice, particularly when the practice involves interventions withindividuals. The analysis of group designs typically refers to the “group’s average changescore” or “the number of subjects altering their status.” By describing the group, we misseach individual’s experience with the intervention. Once a group design is implemented,it is difficult to change the nature of the treatment, yet individual participants within thegroup may not respond to the particular type of treatment offered.
In this chapter, we first take you through the components of single-subject designs,including their basic features, measurement of the target problem, and interpretation of thefindings. We then describe different designs and connect them to their different roles forsocial work research, practice evaluation, and client monitoring. Finally, we end thechapter with a discussion about the implications of single-subject designs for evidence-based practice and the ethical issues associated with single-subject designs.
CHAPTER 7 Single-Subject Design 207
07-Engel-45816:01-Papa-45411.qxd 9/27/2008 7:24 PM Page 207
FOUNDATIONS OF SINGLE-SUBJECT DESIGN
The underlying principle of a single-subject design as a social work research method is thatif an intervention with a client, agency, or community is effective, it should be possible to seea change in status from the period prior to intervention to the period during and after theintervention. As a social work research tool, this type of design minimally has three com-ponents: (a) repeatedmeasurement, (b) baseline phase, and (c) treatment phase. Furthermore,the baseline and treatment phase measurements are usually displayed using graphs.
Repeated Measurement
Single-subject designs require the repeated measurement of a dependent variable or, inother words, the target problem. Prior to starting an intervention and during the interven-tion itself, you must be able to measure the subject’s status on the target problem at regu-lar time intervals, whether the intervals are hours, days, weeks, or months. In the idealresearch situation, measures of the target problem are taken with the client prior to actu-ally implementing the intervention, for example, during the assessment process, and thencontinued during the course of the intervention. Gathering information may mean with-holding the intervention until the repeated measures can be taken. Alternatively, repeatedmeasures of the dependent variable can begin when the client is receiving an interventionfor other problems. For example, a child may be seen for behavioral problems, but even-tually communication issues will be a concern. The repeated measurement of the com-munication issues could begin prior to that specific intervention focus.
There are times when it is not possible to delay the intervention either because there isa crisis or because to delay intervention would not be ethically appropriate. Yet youmay stillbe able to construct a set of preintervention measures using data already collected or ask-ing about past experiences. Client records may have information fromwhich a baseline canbe constructed. Some client records, such as report cards, may have complete information,but other client records, such as case files, may or may not. When using client records, youare limited to the information that is available, and even that information may be incom-plete. Another option is to ask clients about past behavior, such as how many drinks theyhad each week in the last several weeks. Similarly, if permission is granted, significantmembers of the client’s network could be asked questions about the client’s behaviors.Trying to construct measures by asking clients or family members depends on the client’sor family member’s memories or opinions and assumes that the information is bothremembered and reported accurately. Generally, behaviors and events are easier to recallthan moods or feelings. Even the recall of behaviors or events becomes more difficult withthe passage of time and probably should be limited to the preceding month. Although rec-ognizing the limits of these retrospective data-collection methods is important, the limita-tions should not preclude using the information if that is all that is available, particularlyfor evaluating practice.
There are other times when using retrospective data is quite feasible. Agencies often col-lect quite a bit of data about their operations, and these data can be used to obtain repeatedmeasurements. For example, if an agency director was trying to find an outreach method
208 THE PRACTICE OF RESEARCH IN SOCIAL WORK
07-Engel-45816:01-Papa-45411.qxd 9/27/2008 7:24 PM Page 208
that would increase the number of referrals, previous monthly referral information couldbe used and the intervention begun immediately. Or if an organizer was interested in theimpact of an empowerment zone on levels of employment in a community, the preinter-vention employment data are likely to exist.
Baseline Phase
The baseline phase (abbreviated by the letter A) represents the period in which the inter-vention to be evaluated is not offered to the subject. During the baseline phase, repeatedmeasurements of the dependent variable are taken or reconstructed. Thesemeasures reflectthe status of the client (agency or community) on the dependent variable prior to the imple-mentation of the intervention. The baseline phase measurements provide two aspects ofcontrol analogous to a control group in a group design. First, in a group design, we expectthe treatment group to have different scores than the control group after the intervention.In a single-subject design, the subject serves as the control as the repeated baseline mea-surements establish the pattern of scores that we expect the intervention to change.Without the intervention, researchers assume that the baseline pattern of scores would con-tinue its course. Second, in a control group design, random assignment controls for threatsto internal validity. In a single-subject design, the repeated baselinemeasurements allow theresearcher to discount most threats to the internal validity of the design.
PPaatttteerrnnss
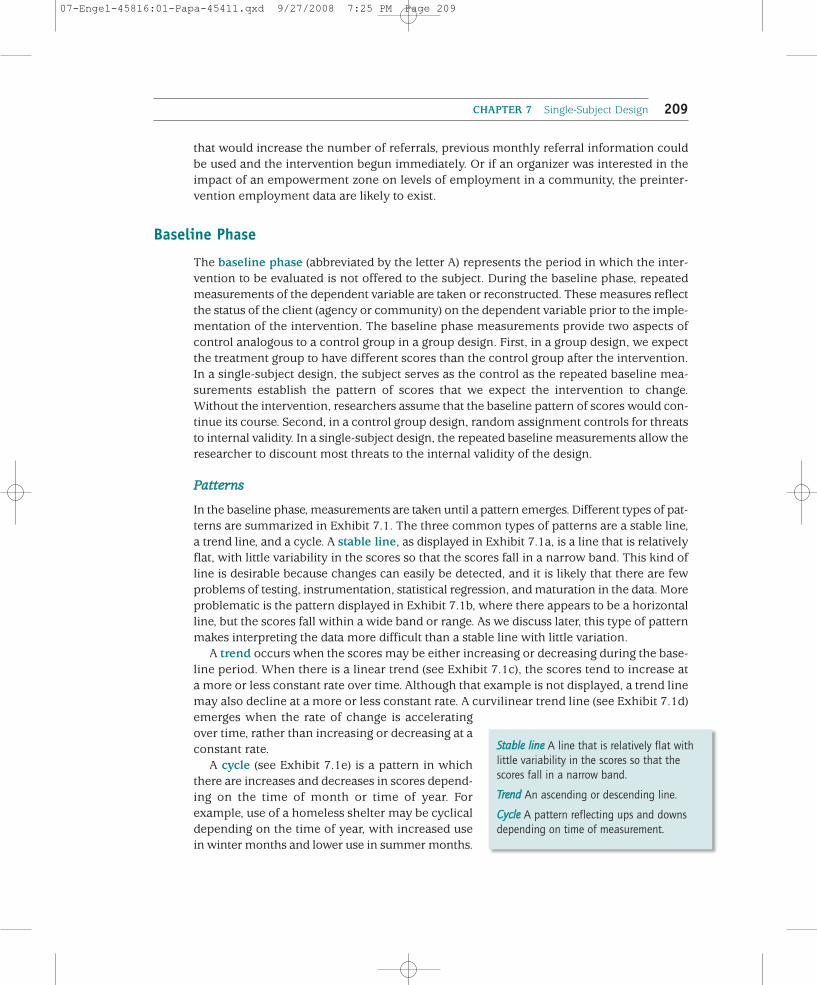
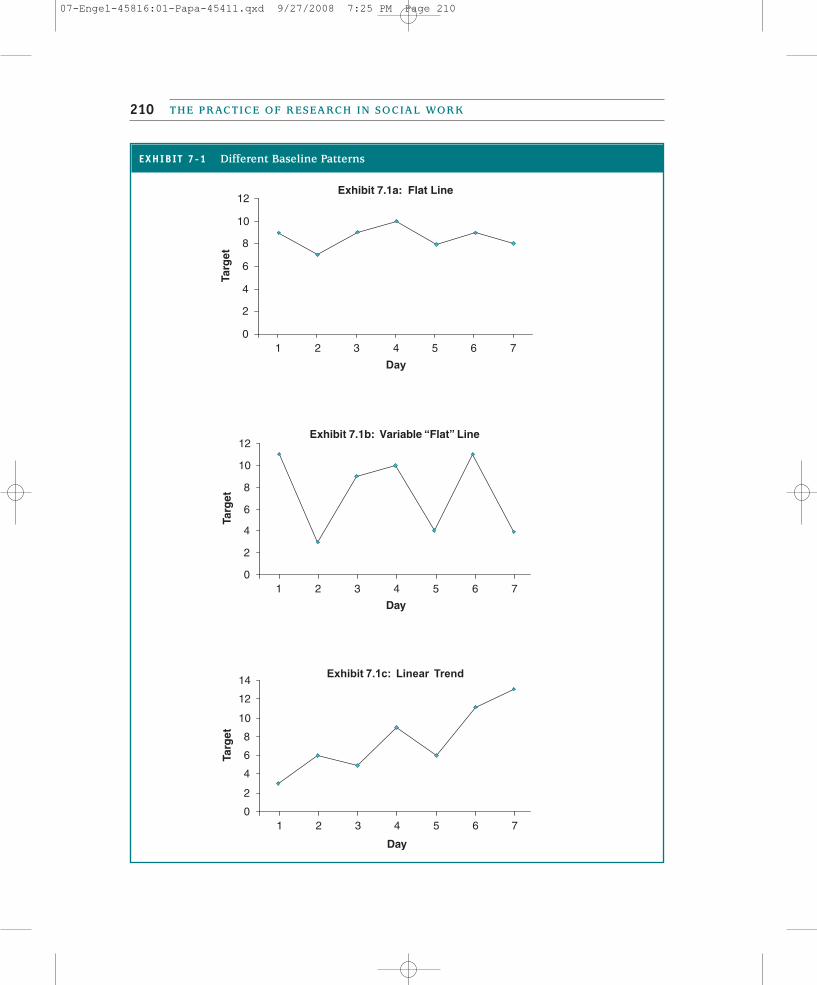
In the baseline phase, measurements are taken until a pattern emerges. Different types of pat-terns are summarized in Exhibit 7.1. The three common types of patterns are a stable line,a trend line, and a cycle. A stable line, as displayed in Exhibit 7.1a, is a line that is relativelyflat, with little variability in the scores so that the scores fall in a narrow band. This kind ofline is desirable because changes can easily be detected, and it is likely that there are fewproblems of testing, instrumentation, statistical regression, and maturation in the data. Moreproblematic is the pattern displayed in Exhibit 7.1b, where there appears to be a horizontalline, but the scores fall within a wide band or range. As we discuss later, this type of patternmakes interpreting the data more difficult than a stable line with little variation.
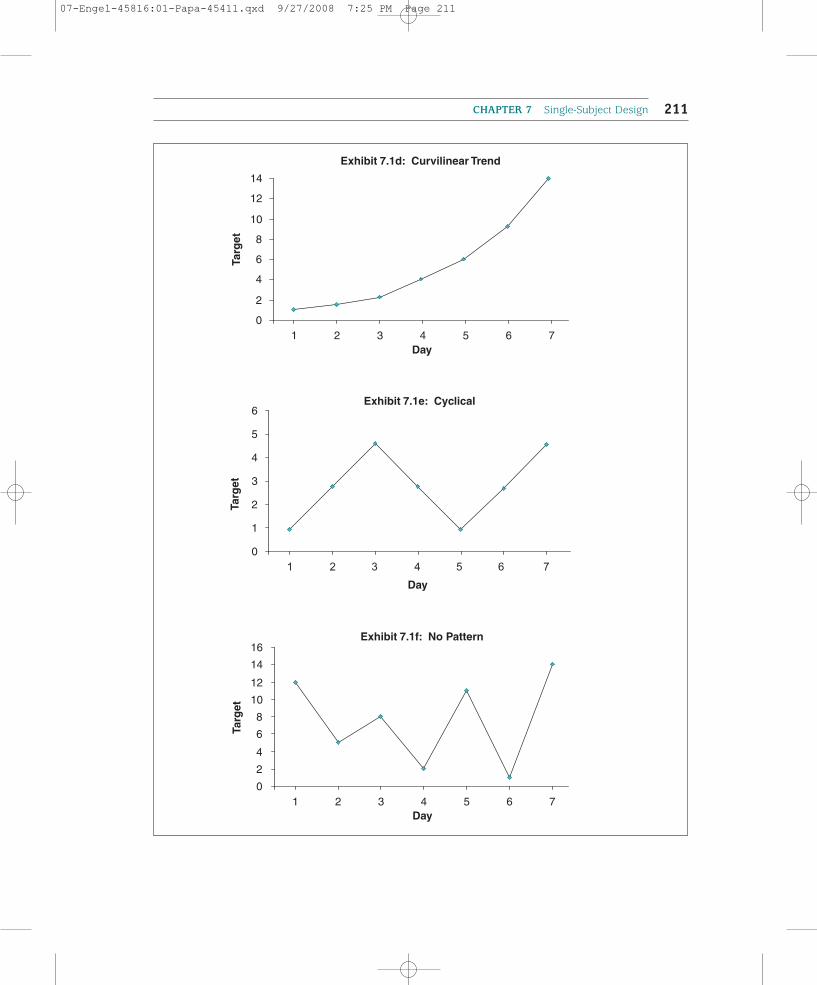
A trend occurs when the scores may be either increasing or decreasing during the base-line period. When there is a linear trend (see Exhibit 7.1c), the scores tend to increase ata more or less constant rate over time. Although that example is not displayed, a trend linemay also decline at a more or less constant rate. A curvilinear trend line (see Exhibit 7.1d)emerges when the rate of change is acceleratingover time, rather than increasing or decreasing at aconstant rate.
A cycle (see Exhibit 7.1e) is a pattern in whichthere are increases and decreases in scores depend-ing on the time of month or time of year. Forexample, use of a homeless shelter may be cyclicaldepending on the time of year, with increased usein winter months and lower use in summer months.
CHAPTER 7 Single-Subject Design 209
SSttaabbllee lliinnee A line that is relatively flat withlittle variability in the scores so that thescores fall in a narrow band.
TTrreenndd An ascending or descending line.
CCyyccllee A pattern reflecting ups and downsdepending on time of measurement.
07-Engel-45816:01-Papa-45411.qxd 9/27/2008 7:25 PM Page 209
THE PRACTICE OF RESEARCH IN SOCIAL WORK210
EXHIBIT 7-1 Different Baseline Patterns
Exhibit 7.1b: Variable “Flat” Line
0
2
4
6
8
10
12
1 2 3 4 5 6 7
Day
Targ
et
Exhibit 7.1a: Flat Line
0
2
4
6
8
10
12
1 2 3 4 5 6 7
Day
Targ
et
Exhibit 7.1c: Linear Trend
0
2
4
6
8
10
12
14
1 2 3 4 5 6 7
Day
Targ
et
07-Engel-45816:01-Papa-45411.qxd 9/27/2008 7:25 PM Page 210
CHAPTER 7 Single-Subject Design 211
Exhibit 7.1d: Curvilinear Trend
0
2
4
6
8
10
12
14
1 2 3 4 5 6 7Day
Targ
et
Exhibit 7.1f: No Pattern
0
2
4
6
8
10
12
14
16
1 2 3 4 5 6 7Day
Targ
et
0
1
2
3
4
5
6
1 2 3 4 5 6 7Day
Targ
et
Exhibit 7.1e: Cyclical
07-Engel-45816:01-Papa-45411.qxd 9/27/2008 7:25 PM Page 211
There are situations, such as the display in Exhibit 7.1f, in which no pattern is evident.With such baseline patterns, it is important to consider the reasons for the variability inscores. Is it due to the lack of reliability of the measurement process? If so, then an alter-native measure might be sought. The client may be using a good measure, but not report-ing information consistently, for example, completing a depression scale at different timesof day. Or the variability in scores may be due to some changing circumstance in the life ofthe client.
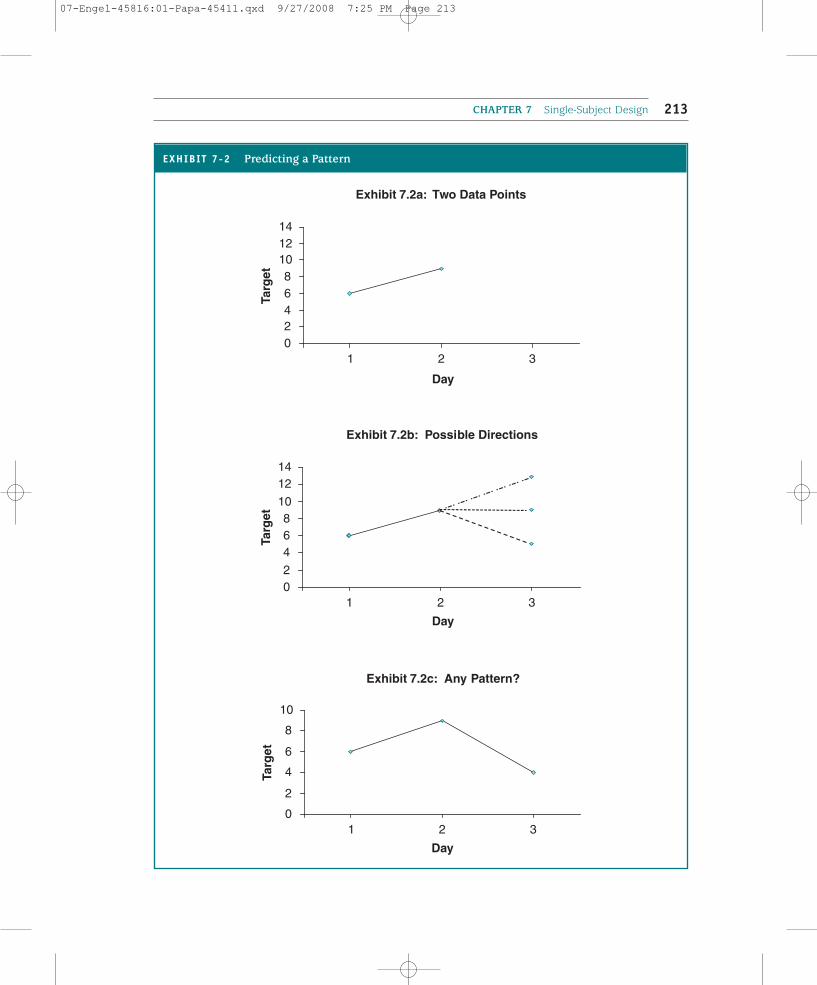
You know you have a pattern when you can predict with some certainty what might bethe next score. To predict the next score requires a minimum of three observations in thebaseline stage. When there are only two measures, as shown in Exhibit 7.2a, can you pre-dict the next score with any certainty? The next data point could be higher, lower, or thesame as the previous data points (see Exhibit 7.2b). With three measures, your certaintyincreases about the nature of the pattern. But even three measures might not be enoughdepending on the pattern that is emerging. In Exhibit 7.2c, is the pattern predictable? Youprobably should take at least two more baseline measures, but three or four additional mea-sures may be necessary to see a pattern emerge. As a general rule, the more data points, themore certain you will be about the pattern; it takes at least three consecutive measures thatfall in some pattern for you to have confidence in the shape of the baseline pattern.
IInntteerrnnaall VVaalliiddiittyy
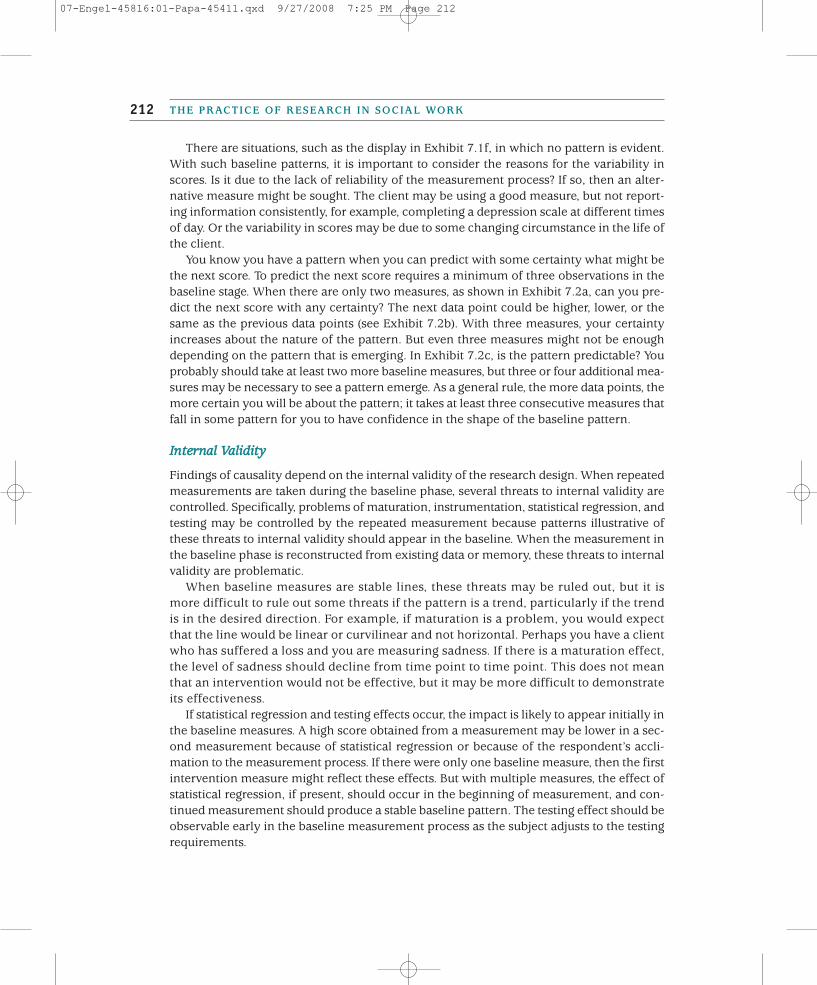
Findings of causality depend on the internal validity of the research design. When repeatedmeasurements are taken during the baseline phase, several threats to internal validity arecontrolled. Specifically, problems of maturation, instrumentation, statistical regression, andtesting may be controlled by the repeated measurement because patterns illustrative ofthese threats to internal validity should appear in the baseline. When the measurement inthe baseline phase is reconstructed from existing data or memory, these threats to internalvalidity are problematic.
When baseline measures are stable lines, these threats may be ruled out, but it ismore difficult to rule out some threats if the pattern is a trend, particularly if the trendis in the desired direction. For example, if maturation is a problem, you would expectthat the line would be linear or curvilinear and not horizontal. Perhaps you have a clientwho has suffered a loss and you are measuring sadness. If there is a maturation effect,the level of sadness should decline from time point to time point. This does not meanthat an intervention would not be effective, but it may be more difficult to demonstrateits effectiveness.
If statistical regression and testing effects occur, the impact is likely to appear initially inthe baseline measures. A high score obtained from a measurement may be lower in a sec-ond measurement because of statistical regression or because of the respondent’s accli-mation to the measurement process. If there were only one baseline measure, then the firstintervention measure might reflect these effects. But with multiple measures, the effect ofstatistical regression, if present, should occur in the beginning of measurement, and con-tinued measurement should produce a stable baseline pattern. The testing effect should beobservable early in the baseline measurement process as the subject adjusts to the testingrequirements.
THE PRACTICE OF RESEARCH IN SOCIAL WORK212
07-Engel-45816:01-Papa-45411.qxd 9/27/2008 7:25 PM Page 212
CHAPTER 7 Single-Subject Design 213
Exhibit 7.2a: Two Data Points
02468
101214
1 2 3
Day
Targ
et
Exhibit 7.2b: Possible Directions
02
468
10
1214
1 2 3
Day
Targ
et
Exhibit 7.2c: Any Pattern?
0
2
4
6
8
10
1 2 3
Day
Targ
et
EXHIBIT 7-2 Predicting a Pattern
07-Engel-45816:01-Papa-45411.qxd 9/27/2008 7:25 PM Page 213
The most significant threat to internal validity is history. Repeated measurement in abaseline will not control for an extraneous event (history) that occurs between the last base-line measurement and the first intervention measurement. The longer the time periodbetween the two measurement points, the greater the possibility that an event might influ-ence the subject’s scores. After the study is complete, the researcher should debrief subjectsto determine whether some other event may have influenced the results.
Treatment Phase
The treatment phase (signified by the letter B) represents the time period during which theintervention is implemented. During the treatment phase, repeated measurements of thesame dependent variable using the same measures are obtained. Ultimately, the patternsand magnitude of the data points are compared to the data points in the baseline phase todetermine whether a change has occurred. Tony Tripodi (1994) and David Barlow andMichel Hersen (1984) recommend that the length of the treatment phase be as long as thebaseline phase.
Graphing
The phases of a single-subject design are almost always summarized on a graph. Graphingthe data facilitates monitoring and evaluating the impact of the intervention. The y axis isused to represent the scores of the dependent variable, whereas the x axis represents a unitof time, such as an hour, a day, a week, or a month. Although you may make your graph byhand, both statistical software and spreadsheet software have the capacity to present dataon graphs.
MEASURING TARGETS OF INTERVENTION
Measurement, as we described in chapter 3, requires answers to a set of questions, includ-ing: (a) what to measure, (b) how to measure the target of the intervention, and (c) who willdo the measuring. With each decision, there are important issues to consider. For socialwork research as well as for other uses of single-subject design, there should be some cer-tainty based on theoretical literature, empirical support, or practice experience to suggestthat the chosen intervention is an appropriate method to address the target problem.
The dependent variable in a single-subject design is the concern or issue that is the focusof the intervention. For research purposes, the target and intervention are usually estab-lished as part of the research project. In contrast, social work practitioners using single-subject design methods to evaluate practice or monitor their work typically arrive at thetarget problem through their interaction with clients or client systems. So clients may startwith some general problem or need that, through the processes of assessment and discus-sion, becomes narrowed to a specific set of treatment goals. Similarly, a community orga-nizer may identify the general needs of a community, and through discussion and meetings,specific outcomes are identified.
THE PRACTICE OF RESEARCH IN SOCIAL WORK214
07-Engel-45816:01-Papa-45411.qxd 9/27/2008 7:25 PM Page 214
The target may focus on one specific problem or different aspects of that problem. Forexample, with an adolescent who is having behavioral problems in school, you may decideto measure the frequency of the behavioral problems or you may hypothesize that the ado-lescent’s behavioral problems are caused by poor family communication and low self-esteem. Therefore, you would measure family communication and self-esteem in additionto school behavior. The target problems can be measured simultaneously or sequentially.
But we want you to remember that single-subject design is applicable to other systems,such as agencies and communities. Therefore, an agency director may decide to evaluatethe efficacy of different methods to improve agency functioning or examine the extent towhich a community-based program produces changes in the community. The choice of thetarget becomes a question of determining the information that is important to the agencyor community.
Once the target of the intervention has been identified, you must determine how you willoperationalize the outcome. Generally, in a research study, operationalization occurs priorto the beginning of the study. When evaluating practice or monitoring clients, operational-ization occurs through client–practitioner interactions. For example, if you are evaluatingthe impact of positive parenting techniques on altering a child’s behavior, you would iden-tify jointly with the parents a behavior such as tantrums. You would then guide the parentsto be able to distinguish a tantrum from other behaviors or verbal expressions. Thisengagement is particularly important because there may be gender and ethnic differencesin how a general problem may manifest itself (Nelson, 1994).
Measures of behaviors, status, or functioning are often characterized in four ways: fre-quency, duration, interval, and magnitude:
•• Frequency refers to counting the number of times a behavior occurs or thenumber of times people experience different feelings within a particular timeperiod. Based on the prior example, you could ask the parents to count thenumber of tantrums their child had each week. Frequency counts are useful formeasuring targets that happen regularly, but counting can be burdensome if thebehavior occurs too often. However, if the behavior happens only periodically, thecounts will not be meaningful.
•• Duration refers to the length of time an event or some symptom lasts and usuallyis measured for each occurrence of the event or symptom. Rather than countingthe number of tantrums in a week, the parents could be asked to time the lengthof each tantrum. The parents would need a clear operational definition thatspecifies what constitutes the beginning and end of a tantrum. A measure ofduration requires fewer episodes than do frequency counts of the target problem.
•• Rather than look at the length of an event, we can examine the interval, or thelength of time between events. Using a measure of interval, the parents in ourexample would calculate the length of time between tantrums. Just as a clearoperational definition was necessary for the duration measure, the parents wouldneed a clear definition when measuring the interval between tantrums. This kindof measure may not be appropriate for events or symptoms that happenfrequently unless the intent of the intervention is to delay their onset.
CHAPTER 7 Single-Subject Design 215
07-Engel-45816:01-Papa-45411.qxd 9/27/2008 7:25 PM Page 215
•• Finally, the magnitude or intensity of a particular behavior or psychological statecan be measured. A scale might be developed by which the parents rate or scorethe intensity of the tantrum—how loud the screaming is, whether there is rollingaround on the floor or hitting, and the like. Often magnitude or intensity measuresare applied to psychological symptoms or attitudes such as measures ofdepressive symptoms, quality of peer interactions, or self-esteem.
Social work researchers and practitioners have a variety of alternative methods availableto measure the target problem. Standardized instruments and rapid assessment tools covera wide range of psychological dimensions, family functioning, individual functioning, andthe like. Another option is to collect data based on clinical observations. Observations areparticularly useful when the target problem involves a behavior. A third option is todevelop measures within the agency such as a goal attainment scale. Regardless of how thedata are collected, the principles about measurement reliability and validity described inchapter 3 apply to measurement in single-subject designs. In particular, the reliability andvalidity of the instruments should have been tested on subjects of the same age, gender, andethnicity as the client who is the focus of the single-subject design (Nelson, 1994).
It is important to consider who will gather the data and to understand the potential con-sequence of each choice. Participants or clients can be asked to keep logs and to recordinformation in the logs. Participants can complete instruments at specified time points,either through self-administration or an interview; or the social work researcher maychoose to observe the participant’s behavior.
A particular problem in gathering the data is the issue of reactivity. The process of mea-surement might change a subject’s behavior. If you ask a subject to keep a log and recordeach time a behavior occurred, the act of keeping the log may reduce the behavior.Observing a father interacting with his children might change the way the father behaveswith the children. Staff, knowing that supervisors are looking for certain activities, mayincrease the number of those activities. Tony Tripodi (1994) suggests that changes due toreactivity may be short in duration and observable in the baseline, so repeated measure-ments in the baseline might mitigate this problem. Nonetheless, it is important to recognizethat there might be reactivity and to choose methods that limit reactivity.
Yet reactivity is not always a problem. If you were testing an intervention to improve afather’s interaction skills with his children and you decided to observe the interactions, reac-tivity is likely to occur. The father, knowing that he is under observation, is likely to performat his best. But in this case, reactivity is useful for the researcher who wants to see what thefather thinks is the best way of interacting. It could be that the “best” is not very good, andthe intervention could work on improving those skills. Moreover, reactivity may have clin-ical utility for practice interventions. A client engaged in self-monitoring, such as by keep-ing a log, may enhance the impact of the intervention. This finding could then be integratedinto the actual intervention. But we would still have to test whether different methods ofgathering data produce different outcomes.
An additional concern about measurement is the feasibility of the measurement process.Repeatedly taking measures can be cumbersome, inconvenient, and difficult. Is it going tobe possible to use the method time and time again? Is the method too time-consuming for
THE PRACTICE OF RESEARCH IN SOCIAL WORK216
07-Engel-45816:01-Papa-45411.qxd 9/27/2008 7:25 PM Page 216
the subject and/or the researcher or practitioner? Will continuous measurements reduce theincentive of the subject to participate in the research or treatment?
Finally, the choice of measurement must be sensitive enough to detect changes. If themeasuring device is too global, it may be impossible to detect incremental or small changes,particularly in such target problems as psychological status, feelings, emotions, and atti-tudes. In addition, whatever is measured must occur frequently enough or on a regular basisso that repeated measurements can be taken. If an event is a fairly rare occurrence, unlessthe research is designed to last a long time, it will be impractical to take repeated measures.
ANALYZING SINGLE-SUBJECT DESIGNS
When you are engaged with a client, you are typically most concerned about the client’s sta-tus and whether the intervention is making a difference for that client. If the interventionseems to be making a difference, then you continue with the intervention as it is needed; ifthe intervention is not leading to meaningful change, then you will likely abandon the inter-vention and try another intervention or vary the intensity of the intervention you arealready providing. Because the methods described in this chapter help you to systematicallydescribe the changes that have or have not occurred with your clients, how then can we usesingle-subject designs to decide whether the intervention has been effective? One way is tovisually examine the graphed data. Visual inspection is the most common method of eval-uating the data, and in the following sections, we describe the presentation and possibleinterpretations of the data. A second option is to use a statistical technique such as the two-standard deviation-band, chi-square analysis, or time series to analyze the data (see Barlow& Hersen, 1984; Bloom, Fischer, & Orme, 2003; Franklin, Allison, & Gorman, 1997).
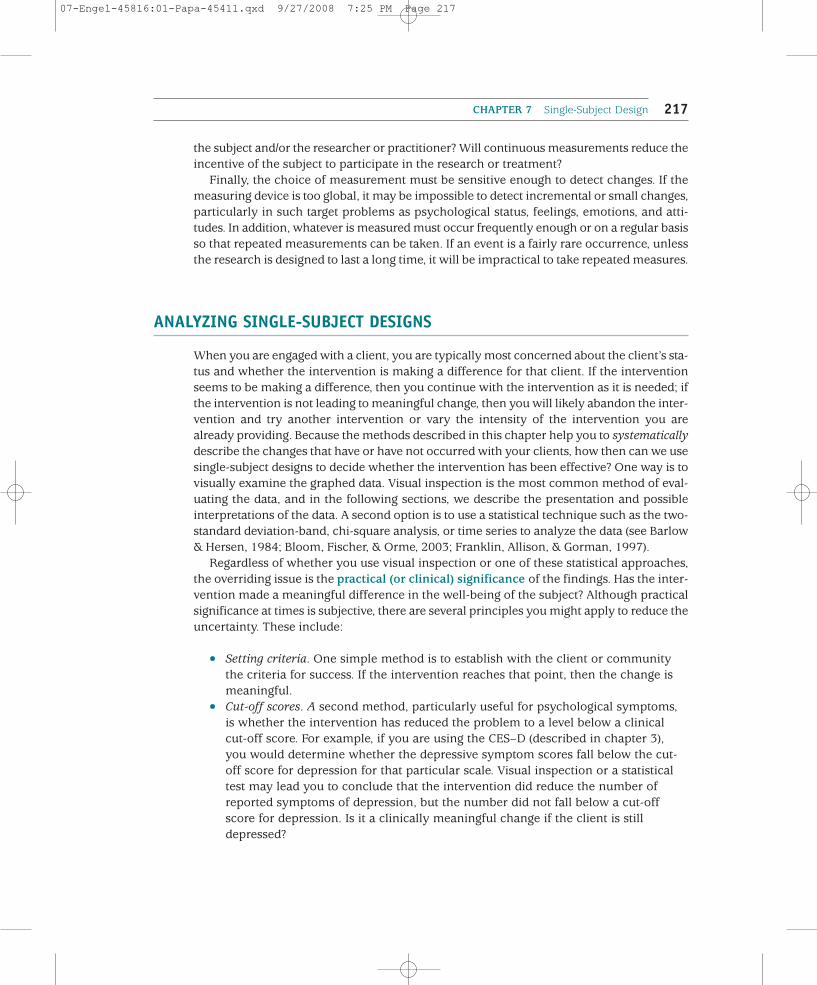
Regardless of whether you use visual inspection or one of these statistical approaches,the overriding issue is the practical (or clinical) significance of the findings. Has the inter-vention made a meaningful difference in the well-being of the subject? Although practicalsignificance at times is subjective, there are several principles you might apply to reduce theuncertainty. These include:
•• Setting criteria. One simple method is to establish with the client or communitythe criteria for success. If the intervention reaches that point, then the change ismeaningful.
•• Cut-off scores. A second method, particularly useful for psychological symptoms,is whether the intervention has reduced the problem to a level below a clinicalcut-off score. For example, if you are using the CES–D (described in chapter 3),you would determine whether the depressive symptom scores fall below the cut-off score for depression for that particular scale. Visual inspection or a statisticaltest may lead you to conclude that the intervention did reduce the number ofreported symptoms of depression, but the number did not fall below a cut-offscore for depression. Is it a clinically meaningful change if the client is stilldepressed?
CHAPTER 7 Single-Subject Design 217
07-Engel-45816:01-Papa-45411.qxd 9/27/2008 7:25 PM Page 217
•• Costs and benefits. A third way to view practical significance is to weigh the costsand benefits to produce the change (see chapter 11). Do efforts to increaseemployment in a community result in sufficient change to be worth the cost andeffort to produce the improvement in employment?
Visual Analysis
Visual analysis is the process of looking at a graph of the data points to determine whetherthe intervention has altered the subject’s preintervention pattern of scores. Three conceptsthat help guide visual inspection are level, trend, and variability.
LLeevveell
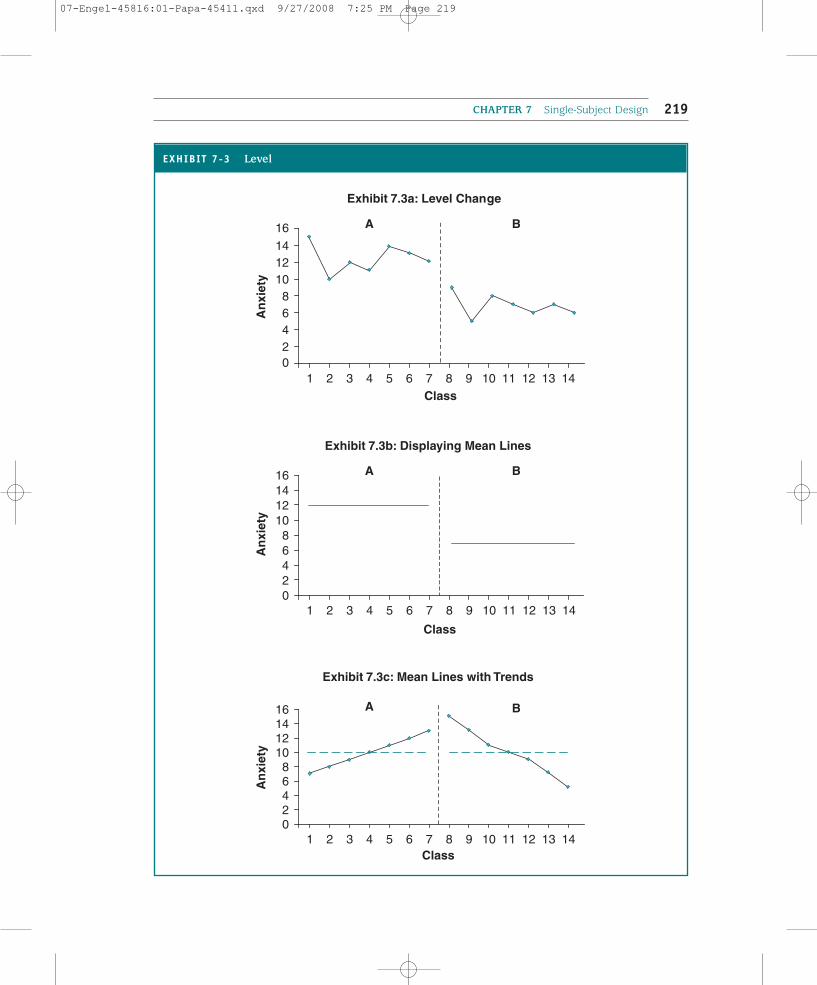
You might examine the level or the amount or magnitude of the target variable. Has theamount of the target variable changed from the baseline to the intervention period? Asimple method to describe the level is to inspect the actual data points, as illustrated in Exhibit 7.3a. It appears that the actual amount of the target variable—anxiety—hasdecreased.
Alternatively, the level of the phase scores may be summarized by drawing a line at thetypical score for each phase separately. For example, the level may be summarized into asingle observation using the mean (the average of the observations in the phase), or themedian (the value at which 50% of the scores in the phase are higher and 50% are lower).The median is typically used in place of the mean when there are outliers or one or twoextreme scores that greatly alter the mean. The mean of the baseline scores is calculated,and a horizontal line is drawn across the baseline phase at the mean. Then the mean of theintervention scores is calculated, and a horizontal line is drawn at the mean score acrossthe intervention phase. How these lines appear is displayed in Exhibit 7.3b. The summaryline for the baseline phase is compared to the summary line for the intervention phase. Youcan see how this method simplifies the interpretation of the level.
Changes in level are typically used when the observations fall along relatively stablelines. Imagine the case, displayed in Exhibit 7.3c, where there is an ascending trend in thebaseline phase and a descending trend in the intervention phase. As you can see, thedirection has changed, but the mean for each phase may not have changed or changedonly insignificantly.
TTrreenndd
Another way to view the data is to compare trends in the baseline and intervention stages.A trend refers to the direction in the pattern of the data points and can be increasing,decreasing, cyclical, or curvilinear. When there is a trend in the baseline, you might askwhether the intervention altered the direction of the trend. When the direction does notchange, you may be interested in whether the rate of increase or decrease in the trend haschanged. Does it alter the slope of the line?
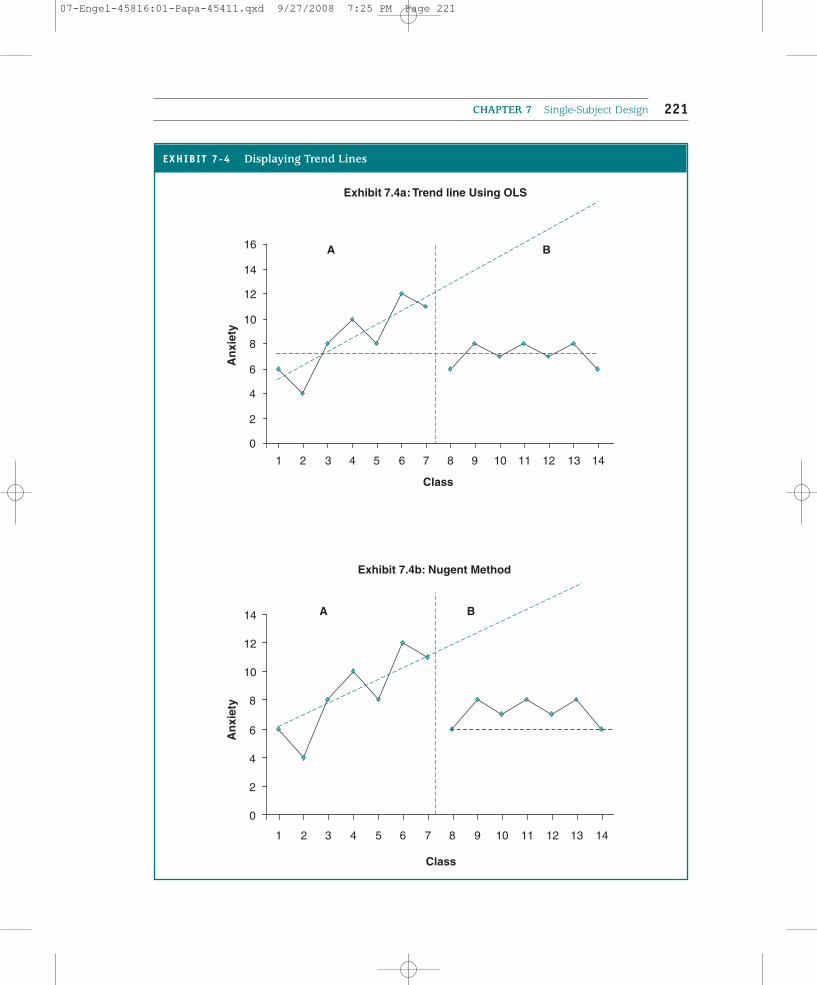
A visual inspection of the lines might provide an answer, but trends can also be repre-sented by summary lines. Different methods may be used to represent the best line todescribe the trend, as displayed in Exhibit 7.4. Ordinary least squares (OLS) regression is
THE PRACTICE OF RESEARCH IN SOCIAL WORK218
07-Engel-45816:01-Papa-45411.qxd 9/27/2008 7:25 PM Page 218
CHAPTER 7 Single-Subject Design 219
EXHIBIT 7-3 Level
Exhibit 7.3b: Displaying Mean Lines
02468
10121416
An
xiet
y
Exhibit 7.3a: Level Change
02468
101214
16
An
xiet
y
1 2 3 4 5 6 7 8 9 10 11 12 13 14Class
Exhibit 7.3c: Mean Lines with Trends
02468
10121416
1 2 3 4 5 6 7 8 9 10 11 12 13 14Class
An
xiet
y
A
A B
A B
B
1 2 3 4 5 6 7 8 9 10 11 12 13 14
Class
07-Engel-45816:01-Papa-45411.qxd 9/27/2008 7:25 PM Page 219
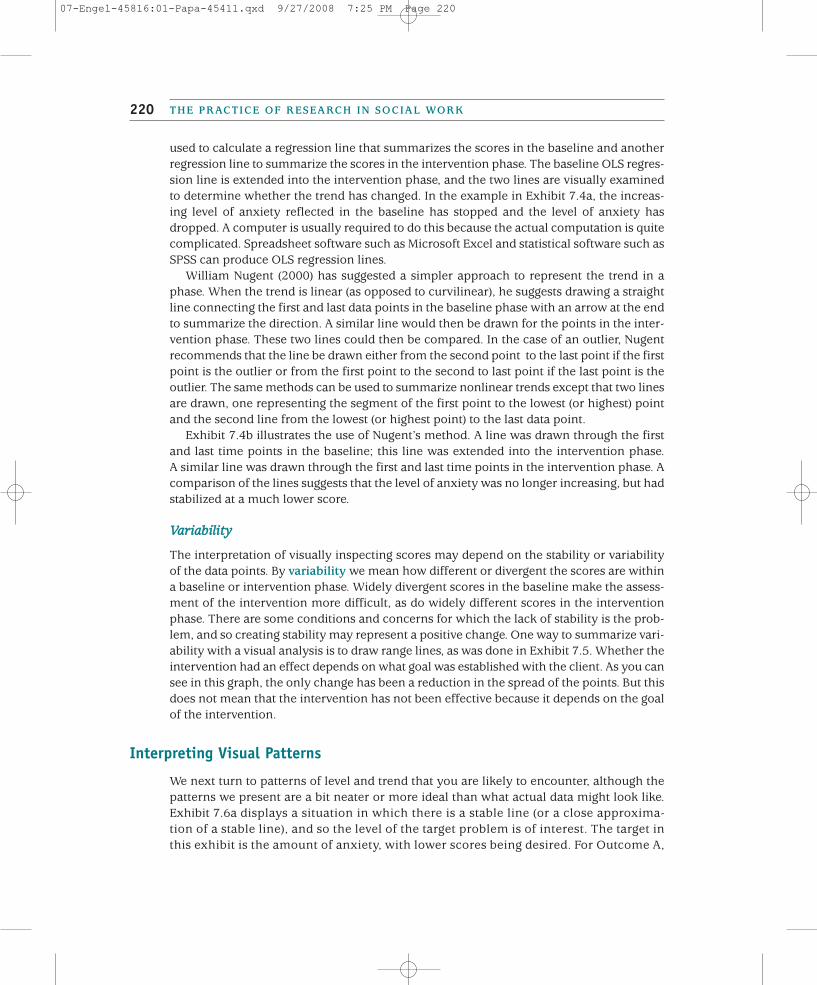
used to calculate a regression line that summarizes the scores in the baseline and anotherregression line to summarize the scores in the intervention phase. The baseline OLS regres-sion line is extended into the intervention phase, and the two lines are visually examinedto determine whether the trend has changed. In the example in Exhibit 7.4a, the increas-ing level of anxiety reflected in the baseline has stopped and the level of anxiety hasdropped. A computer is usually required to do this because the actual computation is quitecomplicated. Spreadsheet software such as Microsoft Excel and statistical software such asSPSS can produce OLS regression lines.
William Nugent (2000) has suggested a simpler approach to represent the trend in aphase. When the trend is linear (as opposed to curvilinear), he suggests drawing a straightline connecting the first and last data points in the baseline phase with an arrow at the endto summarize the direction. A similar line would then be drawn for the points in the inter-vention phase. These two lines could then be compared. In the case of an outlier, Nugentrecommends that the line be drawn either from the second point to the last point if the firstpoint is the outlier or from the first point to the second to last point if the last point is theoutlier. The same methods can be used to summarize nonlinear trends except that two linesare drawn, one representing the segment of the first point to the lowest (or highest) pointand the second line from the lowest (or highest point) to the last data point.
Exhibit 7.4b illustrates the use of Nugent’s method. A line was drawn through the firstand last time points in the baseline; this line was extended into the intervention phase. A similar line was drawn through the first and last time points in the intervention phase. Acomparison of the lines suggests that the level of anxiety was no longer increasing, but hadstabilized at a much lower score.
VVaarriiaabbiilliittyy
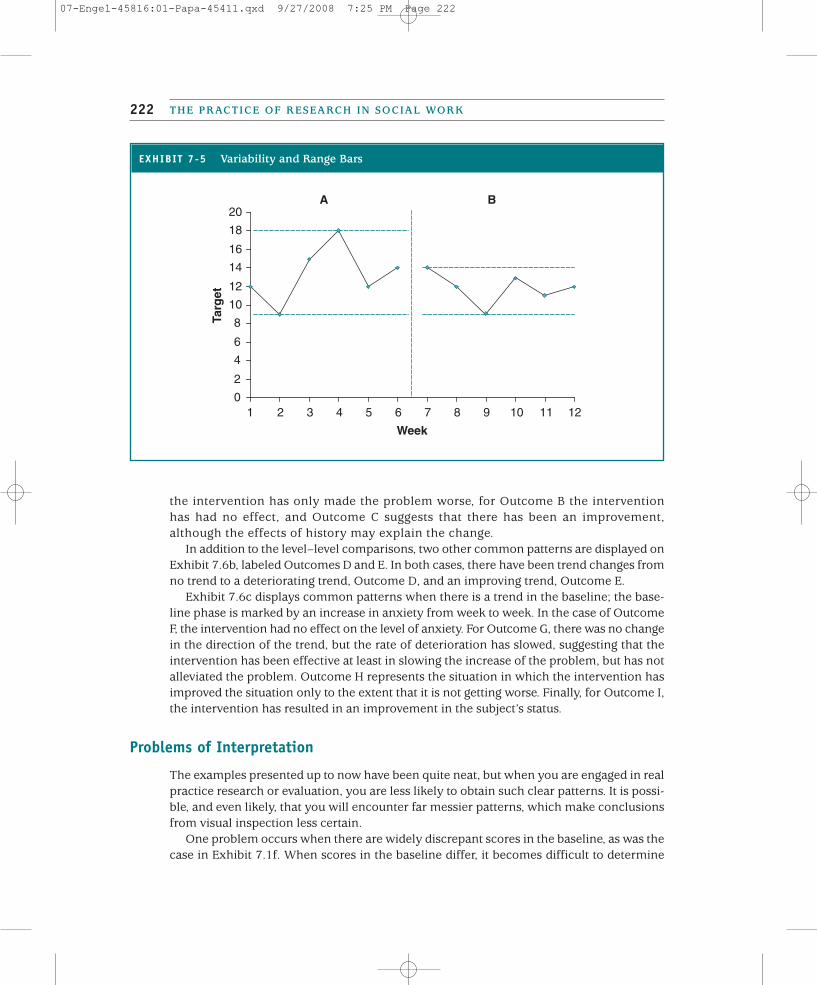
The interpretation of visually inspecting scores may depend on the stability or variabilityof the data points. By variability we mean how different or divergent the scores are withina baseline or intervention phase. Widely divergent scores in the baseline make the assess-ment of the intervention more difficult, as do widely different scores in the interventionphase. There are some conditions and concerns for which the lack of stability is the prob-lem, and so creating stability may represent a positive change. One way to summarize vari-ability with a visual analysis is to draw range lines, as was done in Exhibit 7.5. Whether theintervention had an effect depends on what goal was established with the client. As you cansee in this graph, the only change has been a reduction in the spread of the points. But thisdoes not mean that the intervention has not been effective because it depends on the goalof the intervention.
Interpreting Visual Patterns
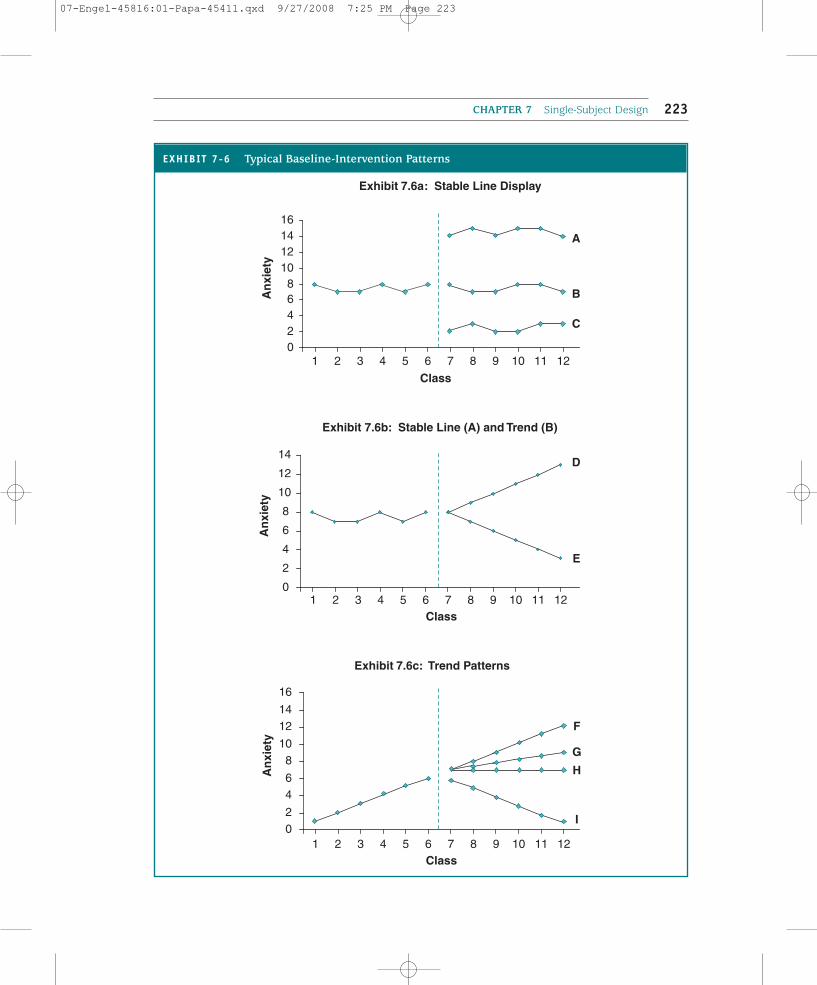
We next turn to patterns of level and trend that you are likely to encounter, although thepatterns we present are a bit neater or more ideal than what actual data might look like.Exhibit 7.6a displays a situation in which there is a stable line (or a close approxima-tion of a stable line), and so the level of the target problem is of interest. The target inthis exhibit is the amount of anxiety, with lower scores being desired. For Outcome A,
THE PRACTICE OF RESEARCH IN SOCIAL WORK220
07-Engel-45816:01-Papa-45411.qxd 9/27/2008 7:25 PM Page 220
CHAPTER 7 Single-Subject Design 221
Exhibit 7.4a: Trend line Using OLS
0
2
4
6
8
10
12
14
16A
nxi
ety
Exhibit 7.4b: Nugent Method
0
2
4
6
8
10
12
14
1 2 3 4 5 6 7 8 9 10 11 12 13 14
Class
An
xiet
y
A B
1 2 3 4 5 6 7 8 9 10 11 12 13 14
Class
A B
EXHIBIT 7-4 Displaying Trend Lines
07-Engel-45816:01-Papa-45411.qxd 9/27/2008 7:25 PM Page 221
the intervention has only made the problem worse, for Outcome B the interventionhas had no effect, and Outcome C suggests that there has been an improvement,although the effects of history may explain the change.
In addition to the level–level comparisons, two other common patterns are displayed onExhibit 7.6b, labeled Outcomes D and E. In both cases, there have been trend changes fromno trend to a deteriorating trend, Outcome D, and an improving trend, Outcome E.
Exhibit 7.6c displays common patterns when there is a trend in the baseline; the base-line phase is marked by an increase in anxiety from week to week. In the case of OutcomeF, the intervention had no effect on the level of anxiety. For Outcome G, there was no changein the direction of the trend, but the rate of deterioration has slowed, suggesting that theintervention has been effective at least in slowing the increase of the problem, but has notalleviated the problem. Outcome H represents the situation in which the intervention hasimproved the situation only to the extent that it is not getting worse. Finally, for Outcome I,the intervention has resulted in an improvement in the subject’s status.
Problems of Interpretation
The examples presented up to now have been quite neat, but when you are engaged in realpractice research or evaluation, you are less likely to obtain such clear patterns. It is possi-ble, and even likely, that you will encounter far messier patterns, which make conclusionsfrom visual inspection less certain.
One problem occurs when there are widely discrepant scores in the baseline, as was thecase in Exhibit 7.1f. When scores in the baseline differ, it becomes difficult to determine
THE PRACTICE OF RESEARCH IN SOCIAL WORK222
EXHIBIT 7-5 Variability and Range Bars
0
2
4
6
8
10
12
14
16
18
20
1 2 3 4 5 6 7 8 9 10 11 12
Week
Targ
etBA
07-Engel-45816:01-Papa-45411.qxd 9/27/2008 7:25 PM Page 222
CHAPTER 7 Single-Subject Design 223
Exhibit 7.6a: Stable Line Display
02468
10121416
An
xiet
y
1 2 3 4 5 6 7 8 9 10 11 12
Class
A
B
C
0
2
4
6
8
10
12
14
An
xiet
y
Exhibit 7.6b: Stable Line (A) and Trend (B)
1 2 3 4 5 6 7 8 9 10 11 12Class
E
D
02
46
810
1214
16
An
xiet
y
Exhibit 7.6c: Trend Patterns
1 2 3 4 5 6 7 8 9 10 11 12Class
F
H
I
G
EXHIBIT 7-6 Typical Baseline-Intervention Patterns
07-Engel-45816:01-Papa-45411.qxd 9/27/2008 7:25 PM Page 223
whether there is any pattern at the baseline, and measures of level or a typical score maynot be at all representative of the data points. Therefore, judging whether the interventionhas made a difference is more difficult.
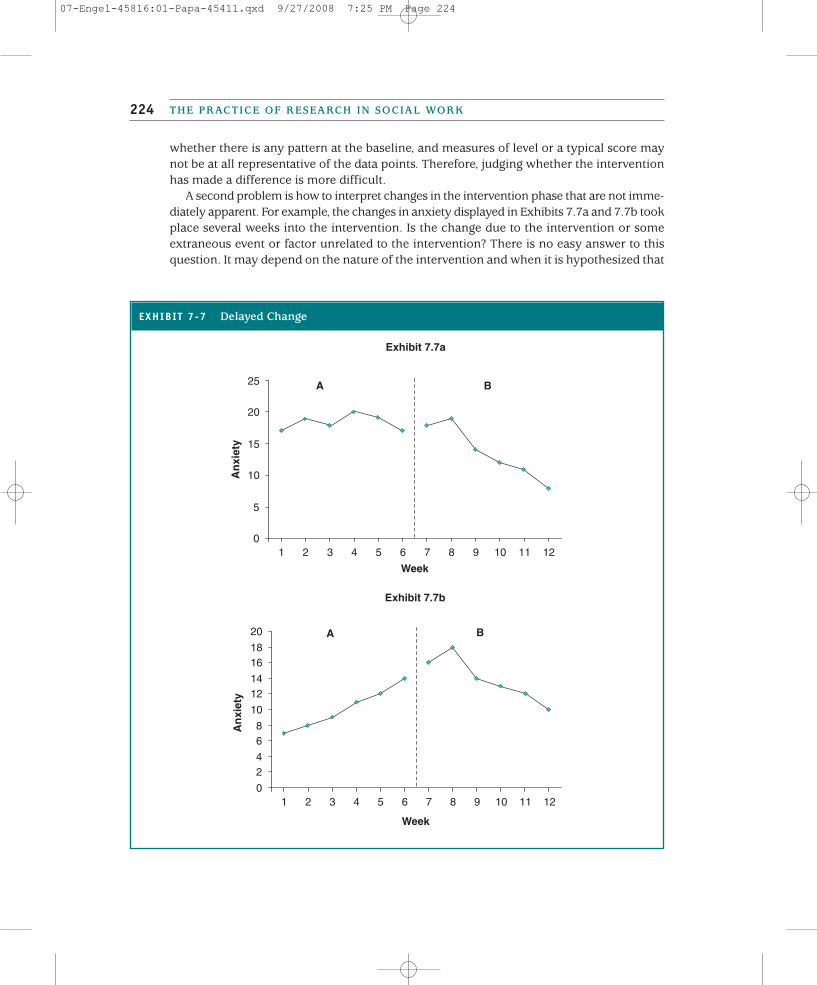
A second problem is how to interpret changes in the intervention phase that are not imme-diately apparent. For example, the changes in anxiety displayed in Exhibits 7.7a and 7.7b tookplace several weeks into the intervention. Is the change due to the intervention or someextraneous event or factor unrelated to the intervention? There is no easy answer to thisquestion. It may depend on the nature of the intervention and when it is hypothesized that
THE PRACTICE OF RESEARCH IN SOCIAL WORK224
EXHIBIT 7-7 Delayed Change
Exhibit 7.7a
0
5
10
15
20
25
1 2 3 4 5 6 7 8 9 10 11 12
Week
An
xiet
y
A B
Exhibit 7.7b
0
24
68
10
1214
1618
20
1 2 3 4 5 6 7 8 9 10 11 12
Week
An
xiet
y
A B
07-Engel-45816:01-Papa-45411.qxd 9/27/2008 7:25 PM Page 224
change will occur. Not all treatment modalities will produce instantaneous improvement.The alternative interpretation that “something happened” (i.e., history) is equally plausible.
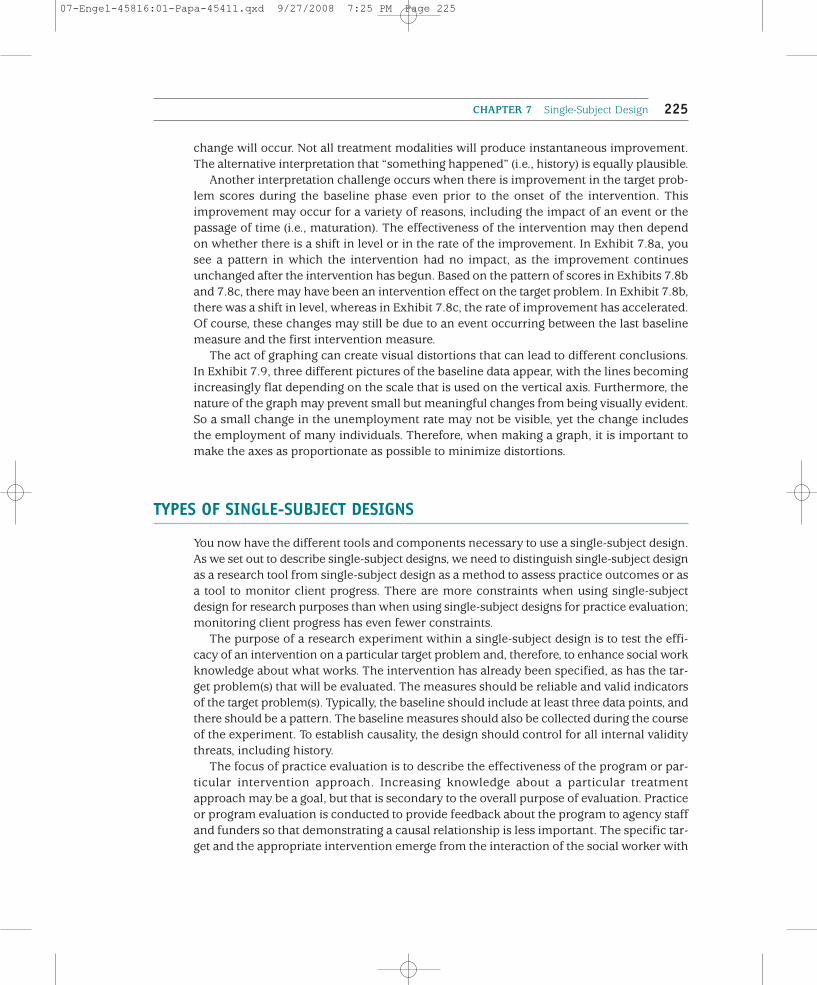
Another interpretation challenge occurs when there is improvement in the target prob-lem scores during the baseline phase even prior to the onset of the intervention. Thisimprovement may occur for a variety of reasons, including the impact of an event or thepassage of time (i.e., maturation). The effectiveness of the intervention may then dependon whether there is a shift in level or in the rate of the improvement. In Exhibit 7.8a, yousee a pattern in which the intervention had no impact, as the improvement continuesunchanged after the intervention has begun. Based on the pattern of scores in Exhibits 7.8band 7.8c, there may have been an intervention effect on the target problem. In Exhibit 7.8b,there was a shift in level, whereas in Exhibit 7.8c, the rate of improvement has accelerated.Of course, these changes may still be due to an event occurring between the last baselinemeasure and the first intervention measure.
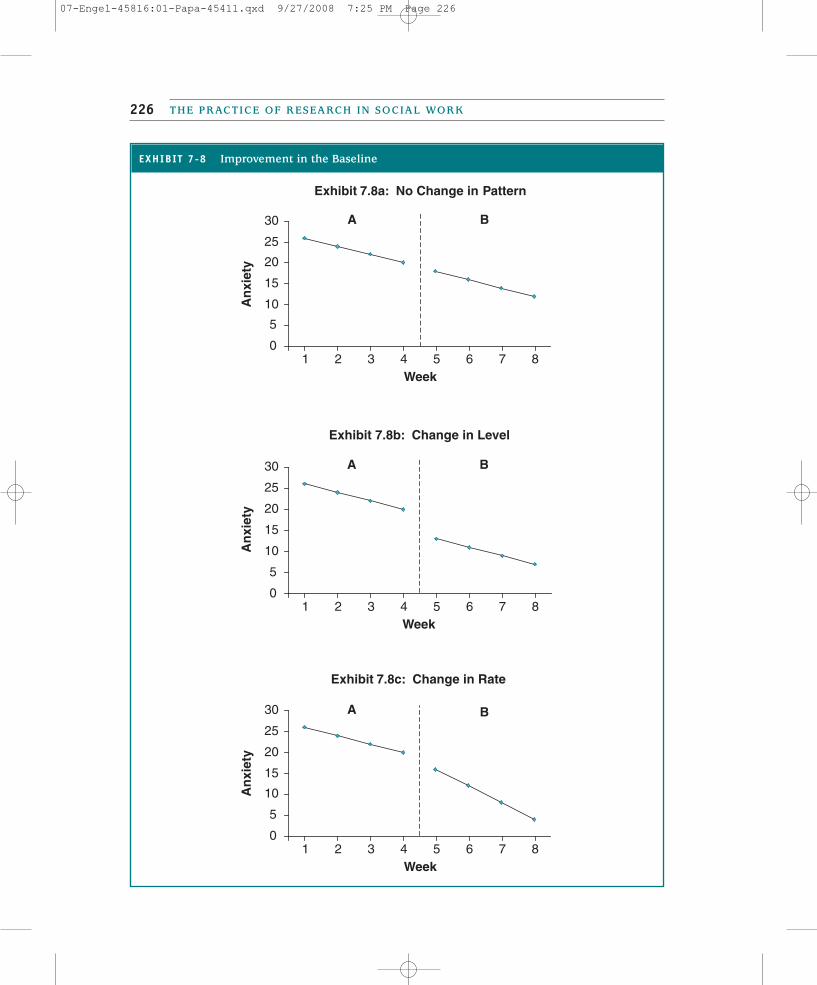
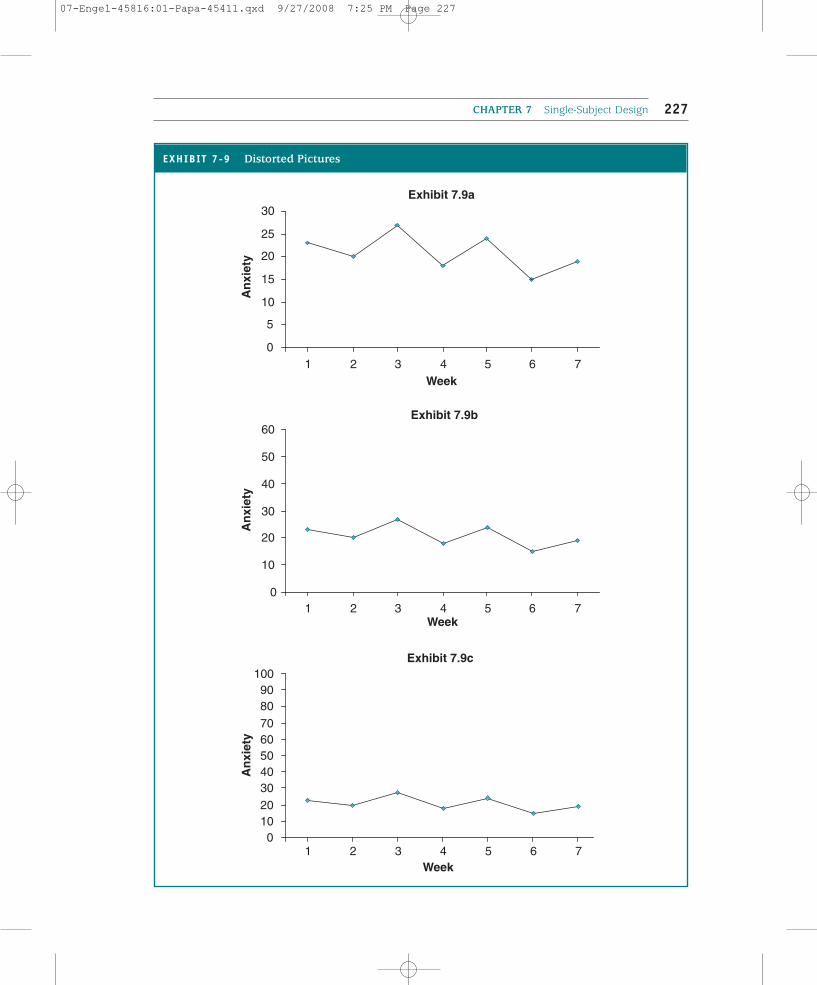
The act of graphing can create visual distortions that can lead to different conclusions.In Exhibit 7.9, three different pictures of the baseline data appear, with the lines becomingincreasingly flat depending on the scale that is used on the vertical axis. Furthermore, thenature of the graph may prevent small but meaningful changes from being visually evident.So a small change in the unemployment rate may not be visible, yet the change includesthe employment of many individuals. Therefore, when making a graph, it is important tomake the axes as proportionate as possible to minimize distortions.
TYPES OF SINGLE-SUBJECT DESIGNS
You now have the different tools and components necessary to use a single-subject design.As we set out to describe single-subject designs, we need to distinguish single-subject designas a research tool from single-subject design as a method to assess practice outcomes or asa tool to monitor client progress. There are more constraints when using single-subjectdesign for research purposes than when using single-subject designs for practice evaluation;monitoring client progress has even fewer constraints.
The purpose of a research experiment within a single-subject design is to test the effi-cacy of an intervention on a particular target problem and, therefore, to enhance social workknowledge about what works. The intervention has already been specified, as has the tar-get problem(s) that will be evaluated. The measures should be reliable and valid indicatorsof the target problem(s). Typically, the baseline should include at least three data points, andthere should be a pattern. The baseline measures should also be collected during the courseof the experiment. To establish causality, the design should control for all internal validitythreats, including history.
The focus of practice evaluation is to describe the effectiveness of the program or par-ticular intervention approach. Increasing knowledge about a particular treatmentapproach may be a goal, but that is secondary to the overall purpose of evaluation. Practiceor program evaluation is conducted to provide feedback about the program to agency staffand funders so that demonstrating a causal relationship is less important. The specific tar-get and the appropriate intervention emerge from the interaction of the social worker with
CHAPTER 7 Single-Subject Design 225
07-Engel-45816:01-Papa-45411.qxd 9/27/2008 7:25 PM Page 225
THE PRACTICE OF RESEARCH IN SOCIAL WORK226
EXHIBIT 7-8 Improvement in the Baseline
0
5
10
15
20
25
30
An
xiet
y
0
5
10
15
20
25
30
An
xiet
y
Exhibit 7.8b: Change in Level
1 2 3 4 5 6 7 8Week
A B
Exhibit 7.8a: No Change in Pattern
1 2 3 4 5 6 7 8Week
A B
0
5
10
15
20
25
30
An
xiet
y
Exhibit 7.8c: Change in Rate
1 2 3 4 5 6 7 8Week
A B
07-Engel-45816:01-Papa-45411.qxd 9/27/2008 7:25 PM Page 226
CHAPTER 7 Single-Subject Design 227
EXHIBIT 7-9 Distorted Pictures
Exhibit 7.9b
0
10
20
30
40
50
60
1 2 3 4 5 6 7Week
An
xiet
y
1 2 3 4 5 6 7
0102030405060708090
100Exhibit 7.9c
1 2 3 4 5 6 7Week
An
xiet
y
Exhibit 7.9a
Week
0
5
10
15
20
25
30
An
xiet
y
07-Engel-45816:01-Papa-45411.qxd 9/27/2008 7:25 PM Page 227
THE PRACTICE OF RESEARCH IN SOCIAL WORK228
the client, rather than being established before the interaction. As in a research study, themeasures should be reliable and valid indicators of the target problem. Ideally, the base-line should include at least three measures and be characterized by a stable pattern, butthis may not be possible; only one or two measures may be available. Furthermore, unlikethe case in a research design, the baseline measures may be produced through the recol-lection of the client, significant others, or client records. Finally, controlling for causalityis less important.
The purpose of monitoring is to systematically keep track of the client’s progress.Monitoring using single-subject design provides ongoing feedback that may be more objec-tive than just relying on the practitioner’s impressions. Monitoring helps to determinewhether the intervention should continue without change or whether the interventionshould be modified. As with practice evaluation, the target problem and intervention are notspecified in advance; rather, they emerge through the client–social worker interaction.Ideally, the measures are reliable and valid indicators. There may not be any baseline, or thebaseline may be limited to a single assessment. When the techniques are used to monitora client’s progress, threats to internal validity are not a concern.
As we describe different designs, it is important to keep these distinctions clear. Somedesigns can be used for both research and practice evaluation. Other designs are more lim-ited and relevant only for monitoring.
Basic Design (A-B)
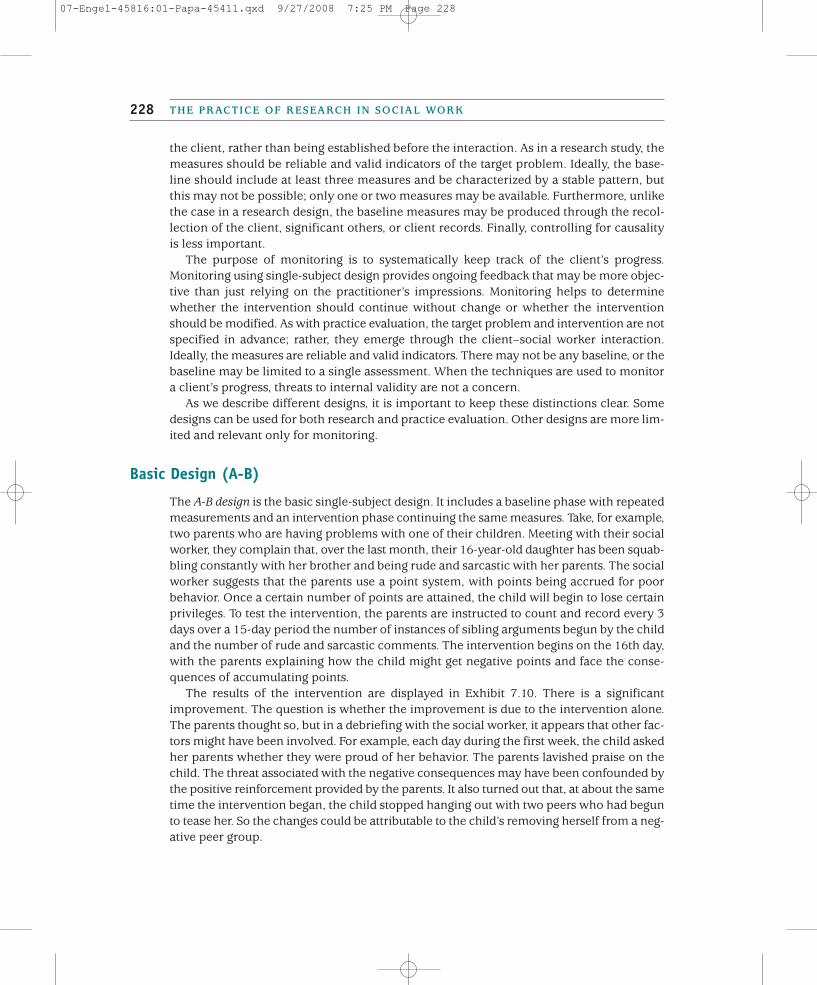
The A-B design is the basic single-subject design. It includes a baseline phase with repeatedmeasurements and an intervention phase continuing the same measures. Take, for example,two parents who are having problems with one of their children. Meeting with their socialworker, they complain that, over the last month, their 16-year-old daughter has been squab-bling constantly with her brother and being rude and sarcastic with her parents. The socialworker suggests that the parents use a point system, with points being accrued for poorbehavior. Once a certain number of points are attained, the child will begin to lose certainprivileges. To test the intervention, the parents are instructed to count and record every 3days over a 15-day period the number of instances of sibling arguments begun by the childand the number of rude and sarcastic comments. The intervention begins on the 16th day,with the parents explaining how the child might get negative points and face the conse-quences of accumulating points.
The results of the intervention are displayed in Exhibit 7.10. There is a significantimprovement. The question is whether the improvement is due to the intervention alone.The parents thought so, but in a debriefing with the social worker, it appears that other fac-tors might have been involved. For example, each day during the first week, the child askedher parents whether they were proud of her behavior. The parents lavished praise on thechild. The threat associated with the negative consequences may have been confounded bythe positive reinforcement provided by the parents. It also turned out that, at about the sametime the intervention began, the child stopped hanging out with two peers who had begunto tease her. So the changes could be attributable to the child’s removing herself from a neg-ative peer group.
07-Engel-45816:01-Papa-45411.qxd 9/27/2008 7:25 PM Page 228
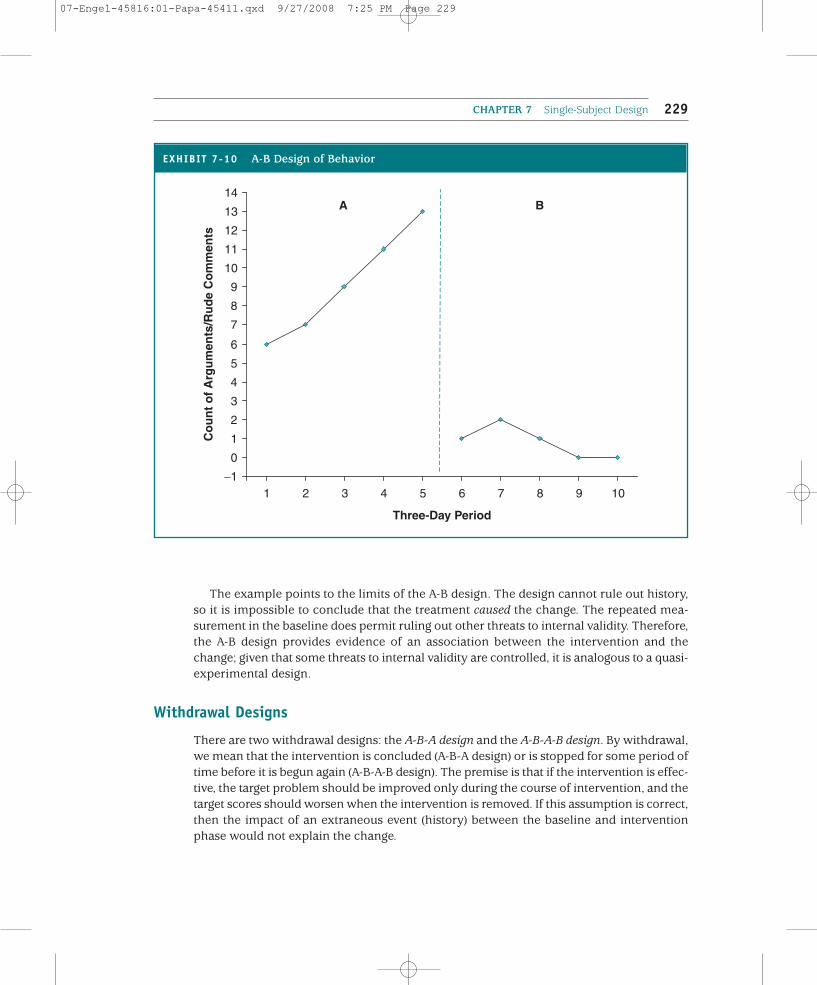
The example points to the limits of the A-B design. The design cannot rule out history,so it is impossible to conclude that the treatment caused the change. The repeated mea-surement in the baseline does permit ruling out other threats to internal validity. Therefore,the A-B design provides evidence of an association between the intervention and thechange; given that some threats to internal validity are controlled, it is analogous to a quasi-experimental design.
Withdrawal Designs
There are two withdrawal designs: the A-B-A design and the A-B-A-B design. By withdrawal,we mean that the intervention is concluded (A-B-A design) or is stopped for some period oftime before it is begun again (A-B-A-B design). The premise is that if the intervention is effec-tive, the target problem should be improved only during the course of intervention, and thetarget scores should worsen when the intervention is removed. If this assumption is correct,then the impact of an extraneous event (history) between the baseline and interventionphase would not explain the change.
CHAPTER 7 Single-Subject Design 229
EXHIBIT 7-10 A-B Design of Behavior
−1
0
1
2
3
4
5
6
7
8
9
10
11
12
13
14
1 2 3 4 5 6 7 8 9 10
Three-Day Period
Co
un
t o
f A
rgu
men
ts/R
ud
e C
om
men
tsA B
07-Engel-45816:01-Papa-45411.qxd 9/27/2008 7:25 PM Page 229
This premise, however, is problematic for social work research. Ideally, the point of inter-vention is to reduce or eliminate the target problem without the need for ongoing inter-vention. We would like the impact of the intervention to be felt long after the client hasstopped the intervention. Practice theories, such as behavioral or cognitive behavioral treat-ment, are based on the idea that the therapeutic effects will persist. This concern, referredto as the carryover effect, may inhibit the use of these designs. To be used for research, theimplementation of each of the withdrawal designs may necessitate limiting the length ofthe intervention and ending it prematurely. If the designs are being used for evaluation, itis unnecessary to prematurely withdraw the intervention; rather, the second baseline pro-vides important follow-up information.
AA--BB--AA DDeessiiggnn
The A-B-A design builds on the A-B design by integrating a posttreatment follow-up thatwould typically include repeated measures. This design answers the question left unan-swered by the A-B design: Does the effect of the intervention persist beyond the period inwhich treatment is provided? Depending on the length of the follow-up period, it may alsobe possible to learn how long the effect of the intervention persists.
The follow-up period should include multiple measures until a follow-up patternemerges. This arrangement is built into the research study. For practice evaluation, the prac-ticality of this depends on whether the relationship with the client extends beyond theperiod of the actual intervention. For example, the effect of an intervention designed toreduce problem behaviors in school might be amenable to repeated measurement after theend of the intervention given that the client is likely to still be in school. Some involuntaryclients are monitored after the end of the intervention period. The effects of communitypractice interventions or organizational changes are more amenable to follow-up repeatedmeasurements.
However, a voluntary client who has come to a family service agency for treatment ofdepression might be more difficult to locate or might be unwilling to go through repeatedfollow-up measurements. Nevertheless, do not be dissuaded from trying to obtain follow-up measures. Some clients may not find the continued monitoring cumbersome particu-larly if they understand that they may benefit as well. The methods of collecting data maybe simplified and adapted to further reduce the burden on ex-clients, such as using phoneinterviews rather than face-to-face interviews.
Through replication and the aggregation of findings, the A-B-A design provides additionalsupport for the effectiveness of an intervention. For example, Kirsten Ferguson and MargaretRodway (1994) explored the effectiveness of cognitive-behavioral treatment on perfec-tionism by applying an A-B-A design to nine clients. They used two standardized scales tomeasure perfectionist thoughts and a nonstandardized client rating of perfectionist behav-iors. In the baseline stage, clients completed the measurement twice a week (once a weekat the beginning of an assessment with the practitioner and once a week at home 3 daysafter the session). Data were collected over 4 weeks. The intervention stage lasted 8 weeks,with assessment prior to each counseling session; but only one follow-up measure wasobtained, 3 weeks after the last counseling session.
THE PRACTICE OF RESEARCH IN SOCIAL WORK230
07-Engel-45816:01-Papa-45411.qxd 9/27/2008 7:25 PM Page 230
AA--BB--AA--BB DDeessiiggnn
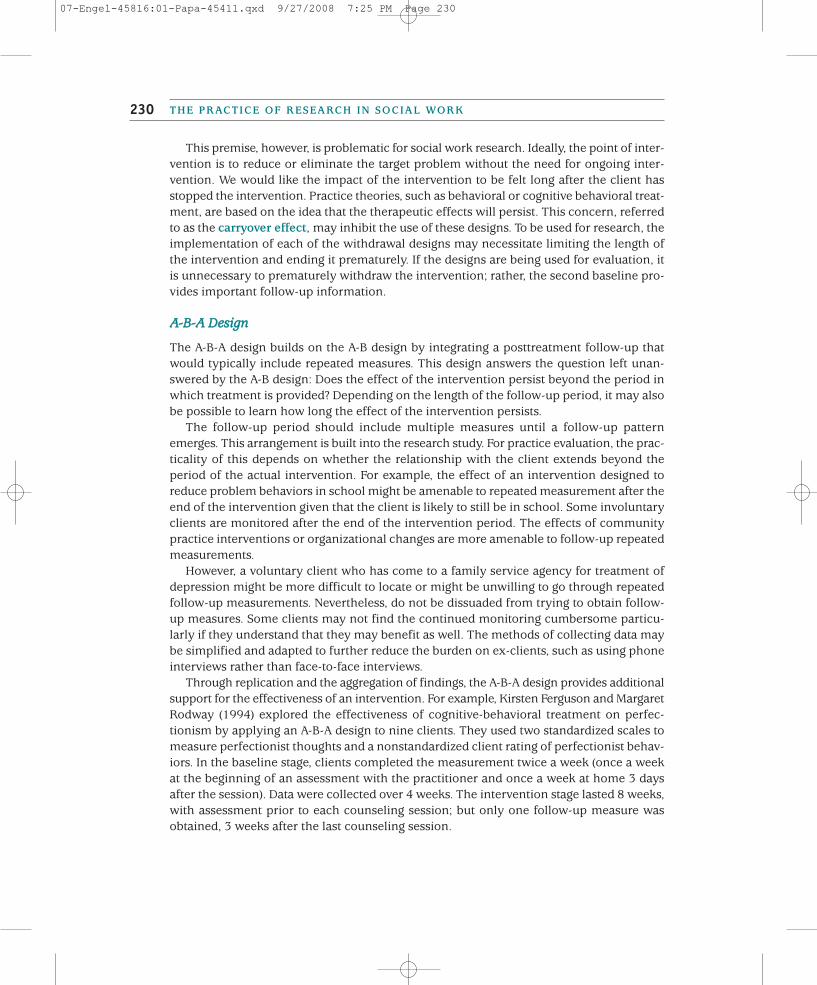
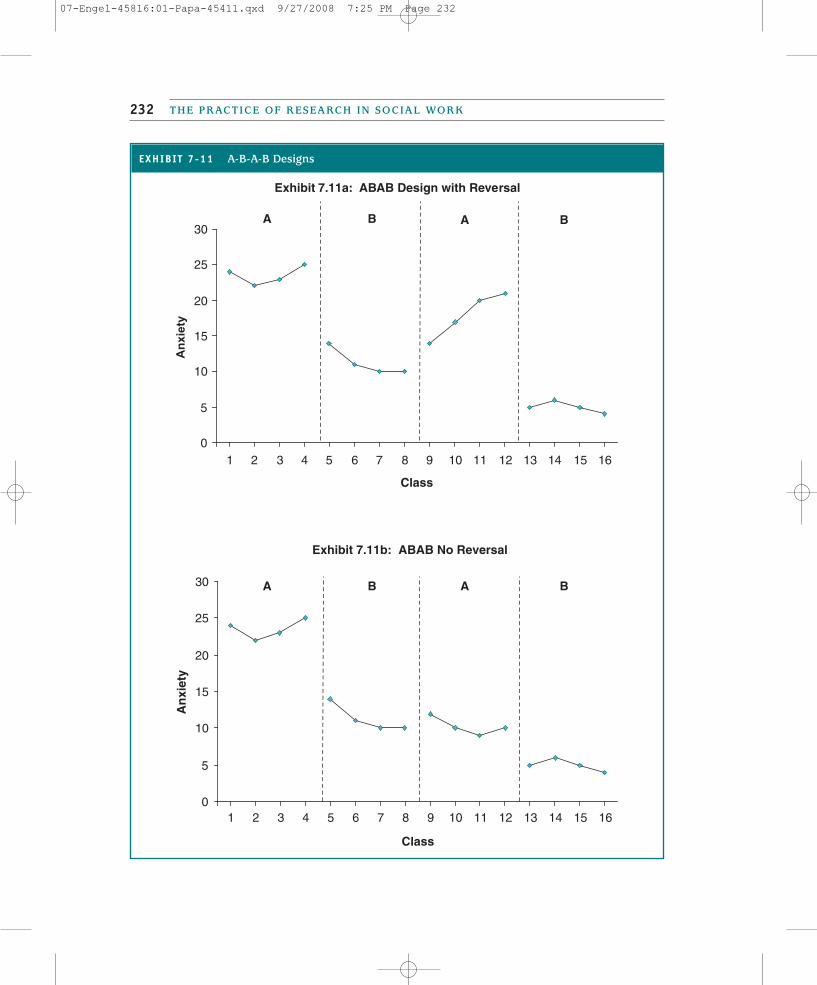
The A-B-A-B design builds in a second intervention phase. The intervention in this phase is iden-tical to the intervention used in the first B phase. The replication of the intervention in the sec-ond intervention phase makes this design useful for social work practice research. For example,if, during the follow-up phase, the effects of the intervention began to reverse (see Exhibit 7.11a),then the effects of the intervention can be established by doing it again. If there is a secondimprovement, the replication reduces the possibility that an event or history explains the change.
Just as with the A-B-A design, there is no guarantee that the effects will be reversed by with-drawing the intervention. If the practice theory holds, then it is unlikely that the effects willactually be reversed. So it may be that this first intervention period has to be short and endedjust as evidence of improvement appears. Even if the effect is not reversed during the follow-up, reintroducing the intervention may demonstrate a second period of additional improve-ment, as displayed in Exhibit 7.11b. This pattern suggests that the changes between theno-treatment and treatment phases are due to the intervention and not the result of history.
Kam-fong Monit Cheung (1999) used an A-B-A-B design to evaluate the effectiveness ofa combination of massage therapy and social work treatment on six residents in three nurs-ing homes. Measurements included an assessment of activities of daily living and theamount of assistance received. Each phase took 7 weeks, with the massage therapy appliedin Weeks 8 through 14 and Weeks 22 through 28. In the first 7 weeks (the A phase), resi-dents received their usual social work services; in the second 7 weeks (the B phase), resi-dents received massage therapy and social work services. In the third 7-week period (thesecond A phase), residents received just social work services; and in the fourth 7-weekperiod (the second B phase), massage therapy resumed. The measurements at the baselinewere retrospectively constructed from client, nursing aide, and social work assessments.Subsequent measurements were taken from logs and reported behavior by the clients.
Multiple Baseline Designs
In the withdrawal designs, the individual serves as the control for the impact of the interven-tion. Yet the withdrawal designs suffer from the problem that often the target behavior can-not be reversed, and it may not be ethical to withdraw treatment early. A solution to theseproblems is to add additional subjects, target problems, or settings to the study. This methodprovides social work researchers with a feasible method of controlling for the effects of history.
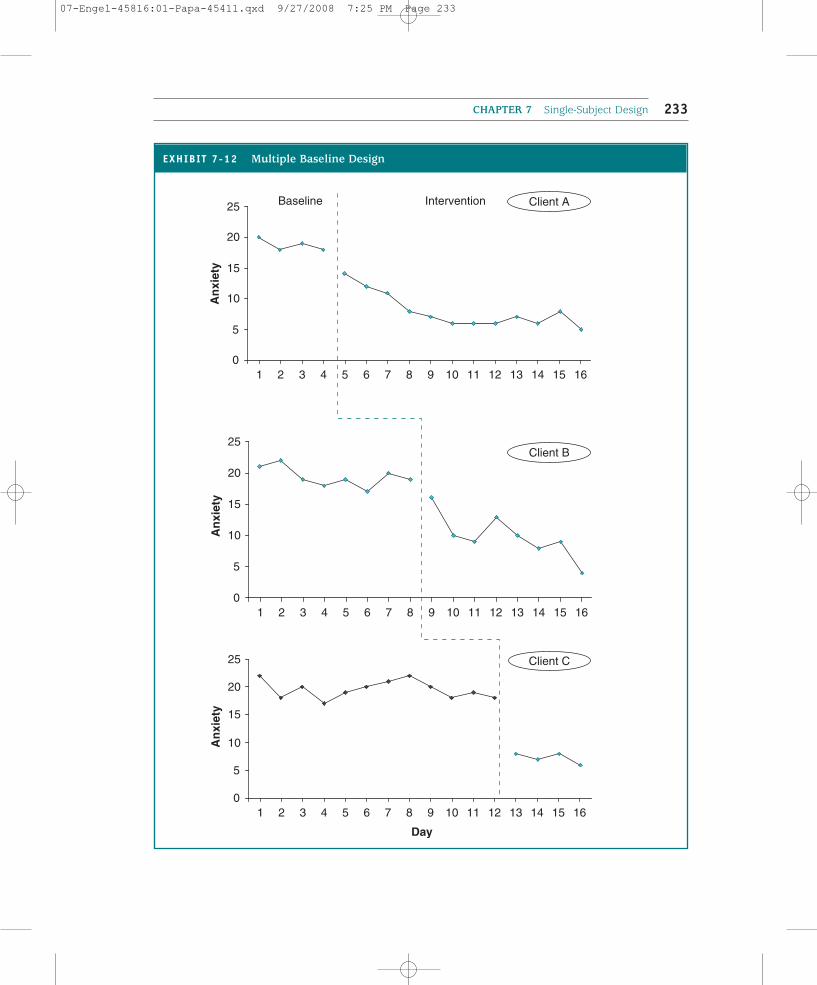
The basic format is a concurrent multiple baseline design, in which a series of A-Bdesigns (although A-B-A or A-B-A-B designs could also be used) are implemented at the sametime for at least three cases (clients, target problems, or settings). Therefore, the data are col-lected at the same time. The unique feature of this design is that the length of the baselinephase is staggered (see Exhibit 7.12) to control for external events (i.e., history) across thethree cases. The baseline phase for the second case extends until the intervention datapoints for the first case become more or less stable. Similarly, the intervention for the thirdcase does not begin until the data points in the intervention phase for the second casebecome stable. The second and third cases act as a control for external events in the firstcase, and the third case acts as a control for the second case.
CHAPTER 7 Single-Subject Design 231
07-Engel-45816:01-Papa-45411.qxd 9/27/2008 7:25 PM Page 231
THE PRACTICE OF RESEARCH IN SOCIAL WORK232
EXHIBIT 7-11 A-B-A-B Designs
Exhibit 7.11a: ABAB Design with Reversal
0
5
10
15
20
25
30
1 2 3 4 5 6 7 8 9 10 11 12 13 14 15 16
Class
Anx
iety
A B A B
Exhibit 7.11b: ABAB No Reversal
0
5
10
15
20
25
30
1 2 3 4 5 6 7 8 9 10 11 12 13 14 15 16
Class
An
xiet
y
A B A B
07-Engel-45816:01-Papa-45411.qxd 9/27/2008 7:25 PM Page 232
CHAPTER 7 Single-Subject Design 233
EXHIBIT 7-12 Multiple Baseline Design
0
5
10
15
20
25
1 2 3 4 5 6 7 8 9 10 11 12 13 14 15 16
An
xiet
yBaseline Intervention
0
5
10
15
20
25
1 2 3 4 5 6 7 8 9 10 11 12 13 14 15 16
An
xiet
y
Client B
Client C
Client A
0
5
10
15
20
25
1 2 3 4 5 6 7 8 9 10 11 12 13 14 15 16
Day
An
xiet
y
07-Engel-45816:01-Papa-45411.qxd 9/27/2008 7:25 PM Page 233
THE PRACTICE OF RESEARCH IN SOCIAL WORK234
One problem with a design requiring that all subjects start at the same time is havingenough available subjects. An alternative that has been used is a nonconcurrent multiplebaseline design. In this case, the researcher decides on different lengths of time for thebaseline period. Then as clients or subjects meeting the selection criteria become available,they are randomly assigned into one of the baseline phases. For example, Carla Jensen(1994) used this approach to test the effectiveness of an integrated short-term model of cog-nitive behavioral therapy and interpersonal psychotherapy. Jensen randomly assignedclients to a baseline phase of 3, 4, or 5 weeks.
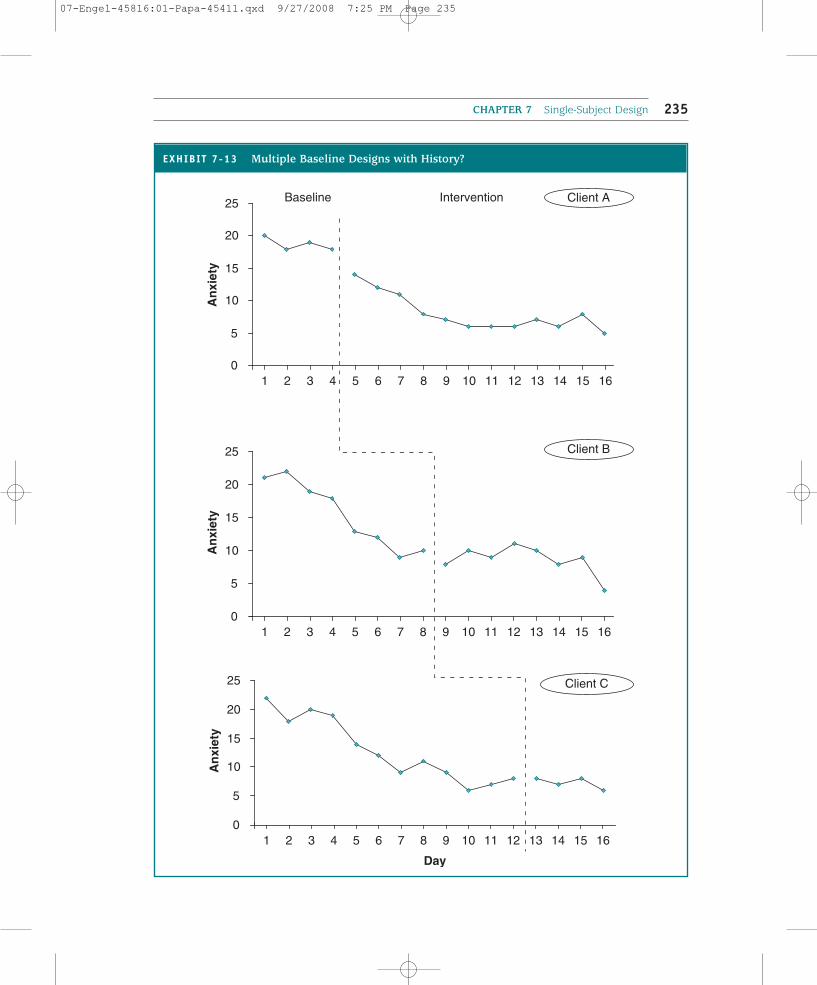
As a research method, multiple baseline designs are particularly useful. They introducetwo replications so that if consistent results are found, the likelihood that some externalevent is causing the change is reduced. If some extraneous event might impact all threecases, the effect of the event may be picked up by the control cases. The pattern of changein Exhibit 7.13 suggests that something occurred that affected not only Client A, but alsosimultaneously Clients B and C, as they reported changes and improvement even beforethey received the intervention.
Across subjects. When a multiple baseline is used across subjects, each subject receives thesame intervention sequentially to address the same target problem. For example, David Besa(1994) used a multiple baseline design to assess the effectiveness of narrative family ther-apy to reduce parent–child conflict in six families. Besa used a nonconcurrent approachbecause he could not find six family pairs to start at the same time. Families were startedsequentially and essentially paired together based on the similarity of the problem. Eachfamily identified a child’s behavior that produced conflict. The length of the baseline var-ied: Family 1, 7 weeks; Family 2,10 weeks; Family 3, 10 days; Family 4, 15 days; Family 5,3 weeks; and Family 6, 4 weeks.
Across target problems. In this case there is one client, and the same intervention is appliedto different but related problems or behaviors. The application of the intervention as itrelates to the target problems or behaviors is staggered. For example, Christina Johnson andJeannie Golden (1997) used a multiple baseline design to examine whether an interventionusing both prompting and reinforcement would have a positive impact on different aspectsof peer interactions for a child with language delays. The three behaviors measured weresocial response, verbal or nonverbal efforts to join in play with another child; approachbehavior, approaching another child using vocal expressions or gestures; and play organizer,the child organizing play by specifying an activity, its rules, or inviting another child to play.The baseline period for social response lasted 3 sessions, the baseline for approach behav-ior overlapped these 3 sessions and continued for 7 more sessions, and the baseline for playorganizer overlapped the above two baselines and continued for 4 more sessions, lasting 14sessions. Measuring these different behaviors for different periods allowed Johnson andGolden to determine which behaviors were influenced by the intervention while control-ling for external events.
Across different settings. Multiple baseline designs can be applied to test the effect of anintervention as it is applied to one client, dealing with one behavior but sequentiallyapplied as the client moves to different settings. You might imagine a client with behavioral
07-Engel-45816:01-Papa-45411.qxd 9/27/2008 7:25 PM Page 234
CHAPTER 7 Single-Subject Design 235
0
5
10
15
20
25
1 2 3 4 5 6 7 8 9 10 11 12 13 14 15 16
An
xiet
yBaseline Intervention
0
5
10
15
20
25
1 2 3 4 5 6 7 8 9 10 11 12 13 14 15 16
An
xiet
y
Client B
Client A
0
5
10
15
20
25
1 2 3 4 5 6 7 8 9 10 11 12 13 14 15 16
Day
An
xiet
y
Client C
EXHIBIT 7-13 Multiple Baseline Designs with History?
07-Engel-45816:01-Papa-45411.qxd 9/27/2008 7:25 PM Page 235
problems in school, at home, and at play with friends. A behavioral intervention might beused, with the application of rewards introduced sequentially across the three settings, start-ing with home, then school, and then play.
Multiple Treatment Designs
In a multiple treatment design, the nature of the intervention changes over time, and eachchange represents a new phase of the design. One type of change that might occur is theintensity of the intervention. For example, you might be working with a family that is hav-ing communication problems. The actual amount of contact you have with the family maychange over time, starting with counseling sessions twice a week, followed by a period ofweekly sessions, and concluding with monthly interactions. In this case, the amount of con-tact declines over time. Changing intensity designs are characterized by A-B1-B2-B3.
Another type of changing intensity design is when, during the course of the intervention,you add additional tasks to be accomplished. For example, older adults who lose their visionin later life need to relearn how to do different independent activities of daily living takinginto account their vision loss. The intervention is learning independent self-care. The B1 mayinvolve walking safely within the house, the B2 may add methods for using a checkbook,the B3 adds a component on cooking, and the like.
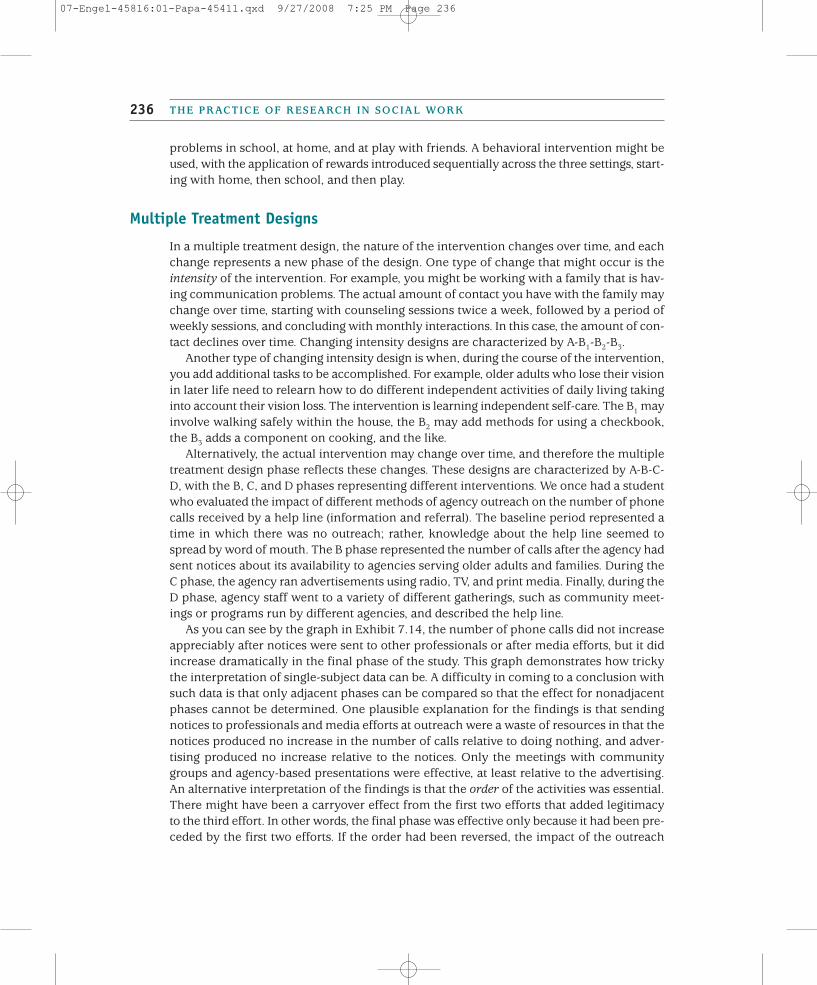
Alternatively, the actual intervention may change over time, and therefore the multipletreatment design phase reflects these changes. These designs are characterized by A-B-C-D, with the B, C, and D phases representing different interventions. We once had a studentwho evaluated the impact of different methods of agency outreach on the number of phonecalls received by a help line (information and referral). The baseline period represented atime in which there was no outreach; rather, knowledge about the help line seemed tospread by word of mouth. The B phase represented the number of calls after the agency hadsent notices about its availability to agencies serving older adults and families. During theC phase, the agency ran advertisements using radio, TV, and print media. Finally, during theD phase, agency staff went to a variety of different gatherings, such as community meet-ings or programs run by different agencies, and described the help line.
As you can see by the graph in Exhibit 7.14, the number of phone calls did not increaseappreciably after notices were sent to other professionals or after media efforts, but it didincrease dramatically in the final phase of the study. This graph demonstrates how trickythe interpretation of single-subject data can be. A difficulty in coming to a conclusion withsuch data is that only adjacent phases can be compared so that the effect for nonadjacentphases cannot be determined. One plausible explanation for the findings is that sendingnotices to professionals and media efforts at outreach were a waste of resources in that thenotices produced no increase in the number of calls relative to doing nothing, and adver-tising produced no increase relative to the notices. Only the meetings with communitygroups and agency-based presentations were effective, at least relative to the advertising.An alternative interpretation of the findings is that the order of the activities was essential.There might have been a carryover effect from the first two efforts that added legitimacyto the third effort. In other words, the final phase was effective only because it had been pre-ceded by the first two efforts. If the order had been reversed, the impact of the outreach
THE PRACTICE OF RESEARCH IN SOCIAL WORK236
07-Engel-45816:01-Papa-45411.qxd 9/27/2008 7:25 PM Page 236
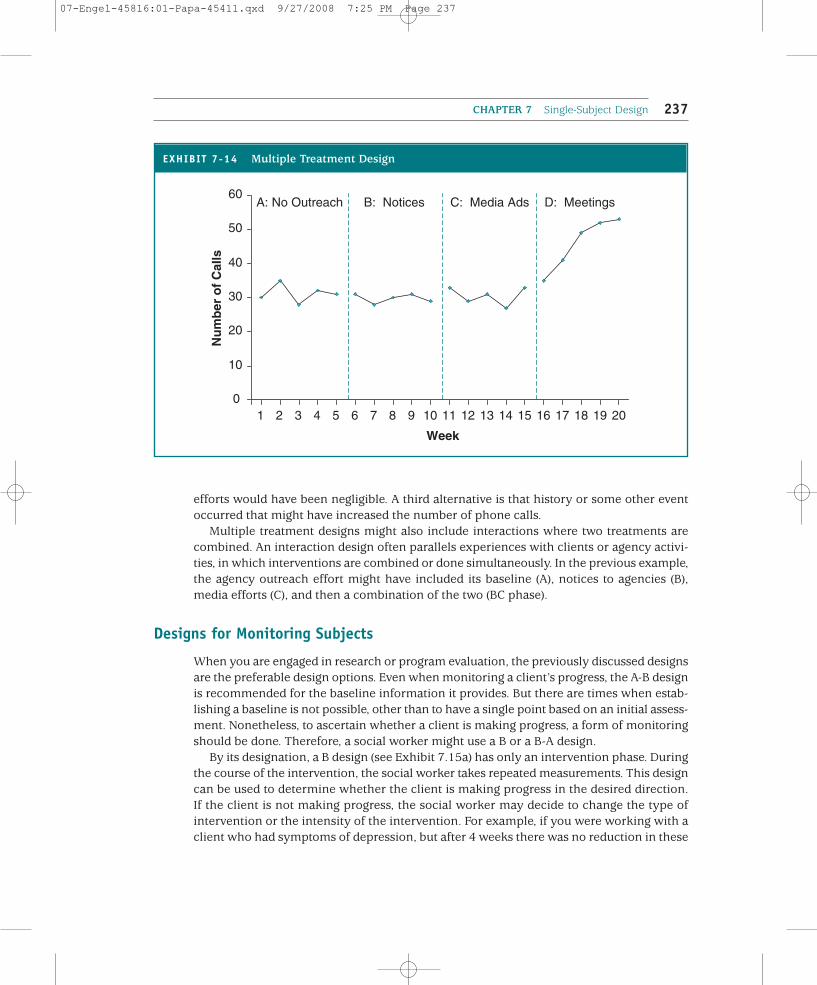
efforts would have been negligible. A third alternative is that history or some other eventoccurred that might have increased the number of phone calls.
Multiple treatment designs might also include interactions where two treatments arecombined. An interaction design often parallels experiences with clients or agency activi-ties, in which interventions are combined or done simultaneously. In the previous example,the agency outreach effort might have included its baseline (A), notices to agencies (B),media efforts (C), and then a combination of the two (BC phase).
Designs for Monitoring Subjects
When you are engaged in research or program evaluation, the previously discussed designsare the preferable design options. Even when monitoring a client’s progress, the A-B designis recommended for the baseline information it provides. But there are times when estab-lishing a baseline is not possible, other than to have a single point based on an initial assess-ment. Nonetheless, to ascertain whether a client is making progress, a form of monitoringshould be done. Therefore, a social worker might use a B or a B-A design.
By its designation, a B design (see Exhibit 7.15a) has only an intervention phase. Duringthe course of the intervention, the social worker takes repeated measurements. This designcan be used to determine whether the client is making progress in the desired direction.If the client is not making progress, the social worker may decide to change the type ofintervention or the intensity of the intervention. For example, if you were working with aclient who had symptoms of depression, but after 4 weeks there was no reduction in these
CHAPTER 7 Single-Subject Design 237
0
10
20
30
40
50
60
1 2 3 4 5 6 7 8 9 10 11 12 13 14 15 16 17 18 19 20
Week
Nu
mb
er o
f C
alls
A: No Outreach B: Notices C: Media Ads D: Meetings
EXHIBIT 7-14 Multiple Treatment Design
07-Engel-45816:01-Papa-45411.qxd 9/27/2008 7:25 PM Page 237
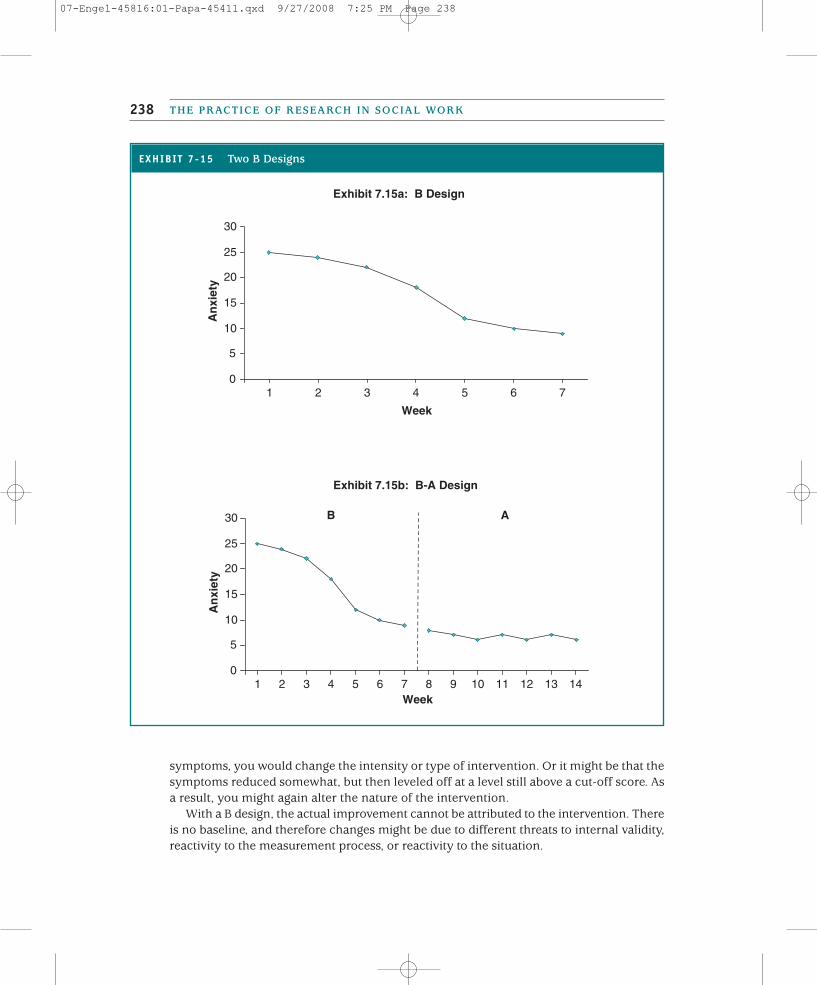
symptoms, you would change the intensity or type of intervention. Or it might be that thesymptoms reduced somewhat, but then leveled off at a level still above a cut-off score. Asa result, you might again alter the nature of the intervention.
With a B design, the actual improvement cannot be attributed to the intervention. Thereis no baseline, and therefore changes might be due to different threats to internal validity,reactivity to the measurement process, or reactivity to the situation.
THE PRACTICE OF RESEARCH IN SOCIAL WORK238
EXHIBIT 7-15 Two B Designs
Exhibit 7.15a: B Design
0
5
10
15
20
25
30
1 2 3 4 5 6 7
Week
An
xiet
y
Exhibit 7.15b: B-A Design
0
5
10
15
20
25
30
1 2 3 4 5 6 7 8 9 10 11 12 13 14Week
An
xiet
y
B A
07-Engel-45816:01-Papa-45411.qxd 9/27/2008 7:25 PM Page 238
If a period of follow-up measurements can be introduced, then a B-A design is a betteralternative (see Exhibit 7.15b). The intervention period is followed by a period of no inter-vention for the specific problem. Although it is harder to get repeated measurements of aclient after the intervention has concluded, if treatment about other problems continues,then follow-up measures are possible. Having reduced depressive symptoms to an accept-able level, the social worker may address social support network building with the client.Measurement of the depressive symptoms might still continue.
IMPLICATIONS FOR EVIDENCE-BASED PRACTICE
Single-subject designs offer a range of evidence to assess the impact of different interven-tions. The most rigorous designs control for threats to internal validity, while monitoringdesigns demonstrate client outcomes but without the ability to suggest it was the inter-vention that mattered. Therefore, understanding the differences in these designs is crucialto weighing the evidence derived from such studies.
One benefit of single-subject design is the focus on the individual as opposed to a group.The evidence derived from single-subject designs differs from that of group designs in thatthe question of interest is different (Johnston, Sherer & Whyte, 2006). In a single-subjectdesign, the question is: Does an intervention work for an individual? In contrast, the ques-tion in a group design is: Does the group average change? Does the treatment group aver-age differ in comparison to a second group? In a group design, the impact on any oneindividual is obscured by the impact on the group.
This different focus is particularly important for social workers because much of theirpractice involves interventions with individuals. Given the focus on the individual, cul-tural and other contextual variables are considered in evaluating outcomes (Arbin &Cormier, 2005). Single-subject designs are likely to pay greater consideration to clientcharacteristics such as gender, age, ethnicity, sexual orientation, or class. Therefore, the evidence may be quite compelling because it reflects more accurately findings fromactual practice.
However, the strength of single-subject designs with its focus on an individual is also sug-gested to be its weakness. How are we to judge findings about a single individual? How isevidence about that single individual relevant to other clients? We can think about this crit-icism as a statistical problem and/or as a problem about building the generalizability of thefindings. The statistical problem is being addressed by statisticians who are developingmeta-analytic methods to assess single-subject design research; these methods are designedto take the findings of many single-subject design studies and aggregate them (Jenson, Clark,Kircher, & Kristjansson, 2007).
The problem of generalizability of single-subject design research is not unlike that ofgroup design research—it is an issue of external validity. Ideally, we want to take what hasbeen tested in one research context and apply the findings to different settings, clients, orcommunities; to other providers; and even to other problems related to the target concernof the research. To do so when the sample consists of a single subject engaged in a partic-ular intervention provided by a particular individual is challenging. To demonstrate the
CHAPTER 7 Single-Subject Design 239
07-Engel-45816:01-Papa-45411.qxd 9/27/2008 7:25 PM Page 239
external validity of single-subject design requires replication of both the research conditionsand beyond the research conditions.
David Barlow and Michel Hersen (1984) suggest that three sequential replication strate-gies be used to enhance the external validity of single-subject design. These are: direct repli-cation, systematic replication, and clinical replication.
Direct replication. Direct replication involves repeating the same procedures, by the sameresearchers, including the same providers of the treatment, in the same setting, and in thesame situation, with different clients who have similar characteristics (Barlow & Hersen,1984). The strength of the findings is enhanced by having successful outcomes with theseother clients. When the results are inconsistent, differences in the clients can be examinedto identify characteristics that may be related to success or failure.
Systematic replication. The next step is systematic replication, which involves repeating theexperiment in different settings, using different providers, and other related behaviors(Barlow & Hersen, 1984). Systematic replication also increases the number and type ofclients exposed to the intervention. Through systematic replication, the applicability of theintervention to different conditions is evaluated. Like direct replication, systematic repli-cation helps to clarify conditions in which the intervention may be successful and condi-tions in which the intervention may not be successful.
Clinical replication. The last stage is clinical replication, which Barlow and Hersen (1984)define as combining different interventions into a clinical package to treat multiple prob-lems. The actual replication takes place in the same setting and with clients who have thesame types of problems. In many ways, findings from practice evaluation can enhance clin-ical replications.
For any replication effort to be successful, the treatment procedures must be clearly artic-ulated, identified, and followed. Failing to adhere to the treatment procedures changes theintervention, and therefore there is not a true replication of the experiment.
Social work practitioners can be active in building this evidence as part of their ongoingpractice. Integrating systematically single-subject designs can provide additional clinical evi-dence for practice. You can become your own researcher!
SINGLE-SUBJECT DESIGN IN A DIVERSE SOCIETY
Throughout this chapter, we have noted instances when special attention must be paid toissues of diversity. These issues are not unique to research, but are relevant to practice. Thatis no surprise because single-subject design is so closely aligned to a practice model(Staudt, 1997). Researchers and practitioners must understand that how problems are iden-tified and defined may depend on client characteristics such as gender, ethnicity, sexual ori-entation, and class. Measures must be acceptable and applicable (reliable and valid) todifferent population subgroups. Similarly, issues regarding informed consent are relevantfor all population subgroups (Martin & Knox, 2000; Nelson, 1994).
THE PRACTICE OF RESEARCH IN SOCIAL WORK240
07-Engel-45816:01-Papa-45411.qxd 9/27/2008 7:25 PM Page 240
Single-subject design may be a useful method for engaging diverse groups that have beenunderrepresented in research and in particular experimental group designs or clinicalresearch trials. Because it is often practice based, it may be easier to mitigate distrust of theresearcher. Because it focuses on the individual, as opposed to the group, single-subjectdesigns can more easily incorporate cultural factors and test for cultural variation (Arbin &Cormier, 2005).
ETHICAL ISSUES IN SINGLE-SUBJECT DESIGN
Like any form of research, single-subject designs require the informed consent of the par-ticipant. The structure of single-subject designs for research involves particularly uniqueconditions that must be discussed with potential participants. As we discussed in chapter 2,all aspects of the research, such as the purpose, measurement, confidentiality, and data col-lection, are a part of the information needed for informed consent. In particular, the needfor repeated baseline measurements and the possibility of premature withdrawal of treat-ment are particularly unique to single-subject design research.
Participants must understand that the onset of the intervention is likely to be delayeduntil either a baseline pattern emerges or some assigned time period elapses. Until this con-dition is met, a needed intervention may be withheld. Furthermore, the length of the base-line also depends on the type of design. In a multiple baseline design, the delay in theintervention may be substantial. The implications of this delay must be discussed as partof obtaining informed consent.
When a withdrawal or reversal design is used, there are additional considerations. Thestructure of such designs means that the intervention may be withdrawn just as theresearch subject is beginning to improve. The risks associated with prematurely endingtreatment may be hard to predict. If there is a carryover effect, the subject’s condition maynot worsen, but it is possible that the subject’s condition or status may indeed worsen. Giventhis possibility, the use of an A-B-A-B design as opposed to the A-B-A design is preferable forthe purpose of research.
Obtaining informed consent may not be limited to the use of single-subject design forresearch purposes. As we noted in chapter 2, the NASW Code of Ethics does not distinguishbetween the need for informed consent in research and the need for informed consent forpractice evaluation. Specifically:
5.02(e) Social workers engaged in evaluation or research should obtain voluntaryand written informed consent from participants, when appropriate, without anyimplied or actual deprivation or penalty for refusal to participate; without undueinducement to participate; and with due regard for participants’ well-being,privacy, and dignity. Informed consent should include information about thenature, extent, and duration of the participation requested and disclosure of therisks and benefits of participation in research.
Others suggest that informed consent may not be necessary. For example, Royse, Thyer,Padgett, and Logan (2001) suggest that written informed consent is not necessarily required
CHAPTER 7 Single-Subject Design 241
07-Engel-45816:01-Papa-45411.qxd 9/27/2008 7:25 PM Page 241
for practice evaluation because the intent is not to provide generalized knowledge or pub-lish the results.
Even if written informed consent is not required when using these tools for practice eval-uation and monitoring, social workers using these tools should be guided by practice ethics.According to the NASW Code of Ethics, social work practitioners should, as a part of theireveryday practice with clients,
provide services to clients only in the context of a professional relationship based,when appropriate, on valid informed consent. Social workers should use clear andunderstandable language to inform clients of the purpose of the services, risksrelated to the services, limits to services because of the requirements of a third-party payer, relevant costs, reasonable alternatives, clients’ right to refuse orwithdraw consent, and the time frame covered by the consent. (NASW, 1999,1.03[a])
Therefore, if such techniques are going to be used as part of the overall intervention, clientsshould be aware of the procedures.
CONCLUSION
Single-subject designs are useful for doing research, evaluating practice, and monitoringclient progress. Single-subject designs have been underutilized as a research tool by socialwork researchers. Yet researchers using these designs can make a unique contribution tosocial work practice knowledge because so much of practice is with individuals. Done sys-tematically, the success or failure of different interventions can be evaluated with distinctclients and under differing conditions. Furthermore, single-subject designs may be usefulfor understanding the process of change and how change occurs with particular clients.
Applying these techniques to your own practice can be of benefit to your clients. AsAaron Rosen (2003) warns, “uncertainly regarding the effectiveness of any intervention forattaining any outcome pervades all practice situations, regardless of the extent and qualityof empirical support” (p. 203). Therefore, if you monitor what you do, you will add to yourown clinical experience, which enhances your future work with clients.
Key Terms
THE PRACTICE OF RESEARCH IN SOCIAL WORK242
Baseline phase (A)
Carryover effect
Clinical replication
Concurrent multiple baseline design
Cycle
Direct replication
Duration
Frequency
Interval
Level
07-Engel-45816:01-Papa-45411.qxd 9/27/2008 7:25 PM Page 242
Magnitude
Nonconcurrent multiple baseline design
Practical significance
Rate
Stable line
Systematic replication
Treatment phase (B)
Trend
Variability
Visual analysis
CHAPTER 7 Single-Subject Design 243
Highlights
• Single-subject designs are tools for researchers and practitioners to evaluate theimpact of an intervention on a single system such as an individual, community, ororganization.
• Single-subject designs have three essential components: the taking of repeatedmeasurements, a baseline phase (A), and a treatment phase (B).
• Repeated measurement control for many of the potential threats to internalvalidity. The period between the last baseline measure and the first treatmentmeasure is susceptible to the effect of history.
• The baseline phase typically continues, if practical, until there is a predictablepattern. To establish a pattern requires at least three measurements. The patternmay include a stable line, an increasing or decreasing trend line, or a cycle of upsand downs dependent on time of measurement.
• Researchers often measure behaviors, status, or level of functioning. Thesemeasures are typically characterized by frequency (counts), duration (length oftime), interval (time between events), or magnitude (intensity).
• Reactivity to the process of measurement may impact the outcomes, and efforts tolimit reactivity are important.
• Data analysis typically involves visually inspecting graphs of the measurements. Aresearcher may look for changes in level (magnitude), rate or directional changesin the trend line, or reductions in variability. The most important criterion iswhether the treatment has made a practical (or clinical) difference in the subject’swell-being.
• Generalizability from single-subject designs requires direct replication, systematicreplication, and clinical replication.
Discussion Questions
1. Visual analysis is used to communicate the impact of an intervention in visualform. What are the three primary ways that the pattern of scores establishedduring a baseline or intervention stage may be viewed? When is each of thembest used? What information is conveyed and what information may be omittedby choosing each one of them over the others?
07-Engel-45816:01-Papa-45411.qxd 9/27/2008 7:25 PM Page 243
2. Single-subject designs lack the inclusion of additional subjects serving as controlsto demonstrate internal validity. How do the measurements during the baselinephase provide another form of control?
3. Social work research seeks to confirm an intervention’s effectiveness by observingscores when clients no longer receive the intervention. Yet the carryover effectmay necessitate using a withdrawal design—ending a treatment prematurely—todo this successfully. Debate the merits of the withdrawal design in social workresearch. What are the advantages and disadvantages? Do the benefits outweighthe risks or vice versa?
4. How can a researcher enhance the external validity of a single-subject design?
Practice Exercises
1. Stress is a common occurrence in many students’ lives. Measure the frequency,duration, interval, and magnitude of school-related stress in your life in a 1-weekperiod of time. Take care to provide a clear operational definition of stress, andconstruct a meaningful scale to rate magnitude. Did you notice any issues ofreactivity? Which of the measurement processes did you find most feasible?Finally, do you believe that your operational definition was sufficient to captureyour target problem and detect changes?
2. Search Social Work Abstracts for articles describing single-subject designs. Try toidentify the type of design used. Read over the article. How well did this designsatisfy the need for internal validity?
3. Patterns detected in the baseline phase of single-subject designs also emerge inthe larger population. Obtain a copy of a national newspaper and locate storiesdescribing contemporary issues that can be described as having the pattern of astable line, a trend, and a cycle. Is information provided about the number ofobservations made? If so, does this number seem sufficient to warrant theconclusion about what type of pattern it is?
Web Exercises
1. Visit the Northwest Regional Education Laboratory’s site at www.nwrel.org. To get to the right file, click on About and then click on School and DistrictImprovement. Choose School Improvement Program Research Series Materials,then Series V, and, finally, click on CloseUP#9 School Wide and ClassroomDiscipline. Select three of the techniques that educators use to minimizedisruption in educational settings and then suggest a single-subject design thatcould be used to evaluate the effectiveness of each technique. Bear in mind thenature of the misbehavior and the treatment. Which of the designs seems most
THE PRACTICE OF RESEARCH IN SOCIAL WORK244
07-Engel-45816:01-Papa-45411.qxd 9/27/2008 7:25 PM Page 244
appropriate? How would you go about conducting your research? Think aboutthings such as operationalizing the target behavior, determining how it will bemeasured (frequency, duration, magnitude, etc.), deciding on the length of thebaseline and treatment periods, and accounting for threats to internal validity.
2. Access the PsycINFO database through your university library’s Web site. Performa search using the words comparative single-subject research. Click on the link tothe full-text version of the article by Holcombe, Wolery, and Gast (1994). Reviewthe description of the designs used and then the discussion of the problems facedin each of these. Can you think of any other issues the authors may haveneglected? Which of these methods would you employ? Why?
To assist you in completing the Web exercises, please access the study site at http://www.sagepub.com/prsw where you will find the web exercisesreproduced and suggested links for online resources.
Developing a Research Proposal
If you are planning to use a single-subject design:
1. What specific design will you use? How long will the study last? How will the databe collected? How often?
2. Discuss the extent to which each source of internal validity is a problem in thestudy? Will you debrief with participants to assess history?
3. Discuss the extent to which reactivity is a problem. How will you minimize theeffects of reactivity?
4. How generalizable would you expect the study’s findings to be? What can be doneto improve generalizability?
5. Develop appropriate procedures for the protection of human subjects in yourstudy. Include a consent form.
A Question of Ethics
1. Use of single-subject methodology requires frequent measurement of symptomsor other outcomes. Practitioners should discuss with patients before treatmentbegins the plan to use deidentified data in reports to the research community.Patients who do not consent still receive treatment—and data may still berecorded on their symptoms in order to evaluate treatment effects. Should theprospect of recording and publishing deidentified data on single subjects becomea routine part of clinical practice? What would be the advantages anddisadvantages of such a routine?
CHAPTER 7 Single-Subject Design 245
07-Engel-45816:01-Papa-45411.qxd 9/27/2008 7:25 PM Page 245
2. The A-B-A design is a much more powerful single-subject design than the A-Bdesign because it reduces the likelihood that the researcher will conclude that animprovement is due to the treatment when it was simply due to a gradualendogenous recovery process. Yet the A-B-A design requires stopping thetreatment that may be having a beneficial effect. Under what conditions do youthink it is safe to use an A-B-A design? Why do some clinicians argue that an A-B-A-B design lessens the potential for ethical problems? Are there circumstanceswhen you would feel it is unethical to use an A-B-A-B design?
THE PRACTICE OF RESEARCH IN SOCIAL WORK246
07-Engel-45816:01-Papa-45411.qxd 9/27/2008 7:25 PM Page 246