Singh, C. and Peake, D.J. and Kokkalis, A. and Khodagolian ...
21
Singh, C. and Peake, D.J. and Kokkalis, A. and Khodagolian, V. and Coton, F.N. and Galbraith, R.A.McD. (2006) Control of rotorcraft retreating blade stall using air-jet vortex generators. Journal of Aircraft 43(4):pp. 1169-1176. http://eprints.gla.ac.uk/3384/ Glasgow ePrints Service http://eprints.gla.ac.uk
Transcript of Singh, C. and Peake, D.J. and Kokkalis, A. and Khodagolian ...

Singh, C. and Peake, D.J. and Kokkalis, A. and Khodagolian, V. and
Coton, F.N. and Galbraith, R.A.McD. (2006) Control of rotorcraft
retreating blade stall using air-jet vortex generators. Journal of Aircraft
43(4):pp. 1169-1176.
http://eprints.gla.ac.uk/3384/
Glasgow ePrints Service
http://eprints.gla.ac.uk

1
Control of Rotorcraft Retreating Blade Stall Using Air-Jet
Vortex Generators
Chrisminder Singh *
, David J. Peake†, Anastassios Kokkalis
‡, Vahik Khodagolian
§
Centre for Aeronautics, City University, London, EC1V 0HB, UK
Frank N. Coton¶ and Roderick A. M
cD. Galbraith
#
Department of Aerospace Engineering, University of Glasgow, Glasgow, G128QQ, UK
Abstract
A series of low-speed wind tunnel tests were carried out on an oscillating airfoil fitted with
two rows of air-jet vortex generators (AJVGs). The airfoil used had an RAE 9645 section
and the two spanwise arrays of AJVGs were located at x/c=0.12 and 0.62. The devices and
their distribution were chosen to assess their ability to modify/control dynamic stall; the goal
being to enhance the aerodynamic performance of helicopter rotors on the retreating blade
side of the disc. The model was pitched about the quarter chord with a reduced frequency
(k) of 0.1 in a sinusoidal motion defined by a=15o+10
osin t. The measured data indicate
that, for continuous blowing from the front row of AJVGs with a momentum blowing
coefficient (Cµ) greater than 0.008, modifications to the stalling process are encouraging. In
particular, the pitching moment behavior exhibits delayed stall and there is a marked
reduction in the normal force hysteresis.
* Research Assistant, Centre for Aeronautics
† (Formerly) Professor, Centre for Aeronautics, (Currently) Vice President of Research & Program Development,
National Institute of Aerospace, Hampton, VA. Associate Fellow AIAA ‡ Professor, Centre for Aeronautics, Senior Member AIAA
§ Research Assistant, Centre for Aeronautics
¶ Professor of Low Speed Aerodynamics, Department of Aerospace Engineering, Member AIAA
# Shoda Professor of Aerospace Systems, Department of Aerospace Engineering, Member AIAA

2
Nomenclature
b,c = airfoil span and chord respectively
CN = normal force coefficient
CM(0.25c) = quarter-chord pitching moment coefficient
CP = airfoil surface static pressure coefficient
Cµ = blowing momentum coefficient ˙ m U j( ) 12
U 2bc( )
k = reduced oscillation frequency = ( c/2U )
˙ m = AJVG mass flow rate
M = Mach number
R = rotor radius measured from hub to tip
Rec = Reynolds number based on airfoil chord and free stream velocity
U = free stream velocity
Uj = resultant jet velocity at AJVG exit
x = distance along chord from leading edge
= angle of attack
m = mean angle of attack
= angle of pitch of AJVG, relative to local airfoil surface tangent
= angle of skew of AJVG, relative to local free stream flow
= density of free stream flow
= rotational frequency
I. Introduction
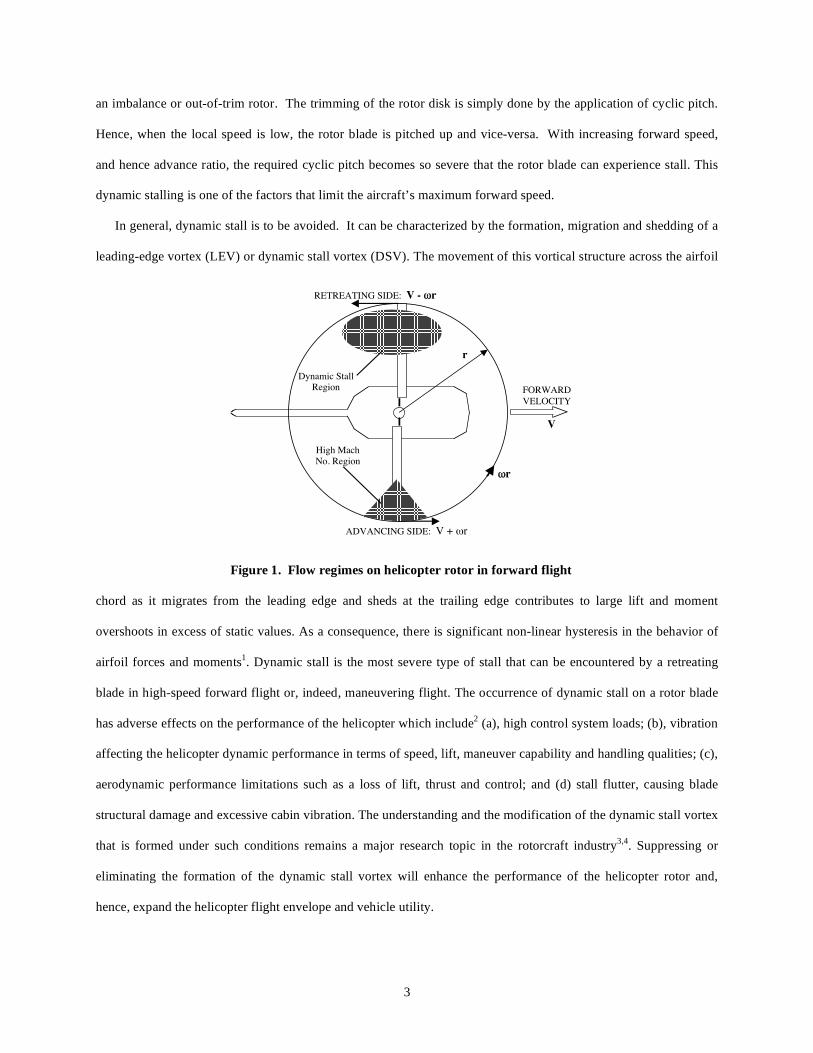
During the forward flight of a helicopter (as depicted in Fig. 1), the combination of the forward and the rotational
speeds results in large variations of local velocities over the rotor blades as they rotate. The effect, generally leads
to the categorization of the rotor disc into an advancing side, where the local velocities are increased, and a
retreating side where they are decreased. If nothing were done to the rotor, these variations in speed would result in
3
ADVANCING SIDE: V + r
RETREATING SIDE: V - r
FORWARDVELOCITY
V
r
High MachNo. Region
r
Dynamic StallRegion
Figure 1. Flow regimes on helicopter rotor in forward flight
an imbalance or out-of-trim rotor. The trimming of the rotor disk is simply done by the application of cyclic pitch.
Hence, when the local speed is low, the rotor blade is pitched up and vice-versa. With increasing forward speed,
and hence advance ratio, the required cyclic pitch becomes so severe that the rotor blade can experience stall. This
dynamic stalling is one of the factors that limit the aircraft’s maximum forward speed.
In general, dynamic stall is to be avoided. It can be characterized by the formation, migration and shedding of a
leading-edge vortex (LEV) or dynamic stall vortex (DSV). The movement of this vortical structure across the airfoil
chord as it migrates from the leading edge and sheds at the trailing edge contributes to large lift and moment
overshoots in excess of static values. As a consequence, there is significant non-linear hysteresis in the behavior of
airfoil forces and moments1. Dynamic stall is the most severe type of stall that can be encountered by a retreating
blade in high-speed forward flight or, indeed, maneuvering flight. The occurrence of dynamic stall on a rotor blade
has adverse effects on the performance of the helicopter which include2 (a), high control system loads; (b), vibration
affecting the helicopter dynamic performance in terms of speed, lift, maneuver capability and handling qualities; (c),
aerodynamic performance limitations such as a loss of lift, thrust and control; and (d) stall flutter, causing blade
structural damage and excessive cabin vibration. The understanding and the modification of the dynamic stall vortex
that is formed under such conditions remains a major research topic in the rotorcraft industry3,4
. Suppressing or
eliminating the formation of the dynamic stall vortex will enhance the performance of the helicopter rotor and,
hence, expand the helicopter flight envelope and vehicle utility.

4
Currently, improvements to control rotor blade dynamic stall rely on conventional shape design techniques such
as optimizing the blade twist distribution and plan form design. These allow the blade loading to be distributed
efficiently along the rotor radius. The use of mechanical devices3,5
(such as leading- or trailing-edge flaps) and
pneumatic6-8
(such as tangential wall blowing or suction) flow control devices have shown potential improvements
to rotor blade aerodynamic performance by controlling dynamic stall. Cheeseman and Seed9, however, suggested
that boundary-layer blowing provided the most attractive option because it exhibited the ability to suppress the
formation of the dynamic stall vortex without either the added weight and complexities of mechanical systems or the
complexity of the ducting involved with boundary-layer suction9. A disadvantage of the tangential wall blowing
methods, proposed by McCloud et al.6 and Weaver et al.
7, was that they required a relatively high amount of
blowing (Cµ > 0.02) to be effective.
A feasibility study at City University, with funding from Westland Helicopters Ltd., successfully demonstrated
the potential application of an active flow control device utilizing low energy systems to provide large
improvements in performance for helicopter airfoil sections. The concept involved the use of air-jet vortex
generators (AJVGs) to produce stream-wise vortices that enhanced the mixing between the retarded flow in the
viscous shear layer and the high momentum fluid in the freestream10,11
. As a result, the momentum deficit in the
boundary layer was reduced, and so too the likelihood of boundary-layer separation. Improvements in the
aerodynamic performance of a modified NACA 23012 airfoil, under quasi-steady flow conditions up to 25% CNmax
and 6o stall, have been demonstrated when employing low mass momentum fluxes to power the AJVG system (Cµ
0.01)12
. The need to ameliorate dynamic stall and the success of quasi-static stall control using continuous blowing
AJVGs led to the idea of testing these devices on the RAE 9645 airfoil under dynamic stall conditions13
. These tests
demonstrated that installing a spanwise array of AJVGs at 12% chord and operating them at Cµ = 0.01 successfully
delayed the formation of the dynamic stall vortex.
To date, very little has been done to assess the sensitivity of the effectiveness of stall control to the blowing
location. Only McCloud et al.6 have utilized more than one blowing location to study this effect and that was for
pure, high-momentum, tangential blowing. They found that blowing from near the leading edge provided a
successful means of controlling dynamic stall whereas blowing from the mid-chord did not. On the basis of this
study alone, however, it could not have been concluded that the same would be true for an AJVG installation.

5
Figure 2. University of Glasgow’s Dynamic Stall Rig
In this paper results are presented from a series of oscillatory tests in which AJVG arrays are positioned at two
locations on the upper surface of an RAE 9645 airfoil. This arrangement is used to explore the effectiveness of
single array blowing and simultaneous blowing from the two locations. The influence of blowing rate for these
configurations is also explored.
II. Experimental Arrangement
The experiments were conducted in the University of Glasgow’s Handley Page low-speed closed-return wind
tunnel. The test Reynolds’ and Mach numbers were 1.5x10⁶ and 0.13 respectively. The airfoil chord was 0.5m with
an aspect ratio of about 3. It was constructed using a fiberglass skin filled with epoxy foam and bonded to an
aluminum spar. The model was mounted vertically in the octagonal working section of width 2.13m and height
1.61m and was pivoted about the quarter-chord
position on two tubular steel shafts. These shafts
were connected to the main support via two
self-aligning bearings, with the weight being
taken by a single thrust bearing on the top
support beam. The dynamic and aerodynamic
loadings from the airfoil were reacted to the
wind tunnel framework by two transversely
mounted beams as shown in Fig. 2. The angular
movement of the model was obtained using a
linear hydraulic actuator and crank mechanism. The actuator was mounted horizontally below the wind tunnel
working section on the supporting structure, with the crank rigidly connected to the tubular part of the spar by a
welded sleeve and keyway. The actuator was a UNIDYNE 907/1 type with a normal dynamic thrust of 6.1kN
operated from a supply pressure of 7.0Mpa. A MOOG 76 series 450 servo valve was used via a UNIDYNE servo
controller unit to control the movement of the actuator. A suitable feedback signal for the controller was provided by
a precision linear angular displacement transducer geared to the main spar of the model

6
The model was instrumented with 30 dynamic pressure transducers, Sensor Technics SCS05GSMT, positioned
along the mid-span chord-line. Output signals from the transducers were taken to a specially designed signal-
controlling unit with its own control board. On instruction from the computer, the control board automatically
removed all offsets to below the A-D converter resolution and adjusted all gains as necessary. Prior to any sequence
of tests, a dummy run of the most severe test, in terms of pressure range, was performed so that the amplifier gains
could be automatically set to maximize the A-D resolution.
The data acquisition was carried out by a PC microcomputer interfaced with proprietary Bakker Electronics
BE256 modules that provided the necessary analogue to digital conversion. The software used for data acquisition
was TEAM 256. The measurement system has a capability of measuring up to 200 channels with each A-D channel
having a maximum sampling rate of 50kHz. Such a high sampling rate was required to capture the fine detail of the
dynamic stall process, especially at the relatively high oscillatory frequencies tested, i.e. 0.01 < k < 0.2.
The motion profile for sinusoidal pitching is defined by,
= 15o
+ 100sin t
where, in this case,
0.3 5.0 (2)
In all cases, tests were conducted over four continuous cycles and the data subsequently averaged.
A. Design of Air-Jet Vortex Generators (AJVGs)
The geometrical design and spacing of the AJVGs installed on the RAE 9645 were based on the
recommendations outlined by Pearcey14
, Henry & Pearcey11
, Akanni15
and optimized by Oliver16
. The model was
configured with two span-wise arrays of AJVGs in a co-rotating system, located at x/c = 0.12 and 0.62 as shown in
Fig. 3. The airfoil model had a total of 28 AJVGs, spaced at intervals of about 0.1c along the span at each of the two
chordwise positions. The AJVGs had a rectangular geometric shape with a jet slot aspect ratio of about 8 and the jet
exit pitched at 300 and skewed at 60
0 relative to the local surface tangent and the local free stream flow respectively

7
Figure 3. AJVG geometry configuration (a) pitch angle, = 300; and (b), yaw angle = 60
0
(see Fig. 3). Air was supplied to the AJVG arrays via a pressure regulated plenum chamber located within the airfoil
section. For the tests, the AJVGs were operated at low blowing momentum coefficients of between 0.0 Cµ 0.01.
B. Measurement Accuracy
Experimental measurement uncertainty was assessed to determine and reduce the magnitude of errors of the
results obtained. Table 1 outlines some of the important parameters of the recently concluded series of tests. It
should be noted that, although the normal force and pitching moment coefficient data presented here are cycle
averaged, cycle to cycle variations in these coefficients do occur as a consequence of the inconsistent phasing of the
8
Table 1. Experimental Uncertainty
Item Uncertainty Operating Range
Pressure coefficient, CP ±0.1 -12.0 to +1.0
Dynamic pressure ±18Pa 1000Pa
Blowing momentum coefficient, Cµ ±0.001 0.01
Angle of attack, ±0.10 25
0
Model chord ±0.002m 0.5m
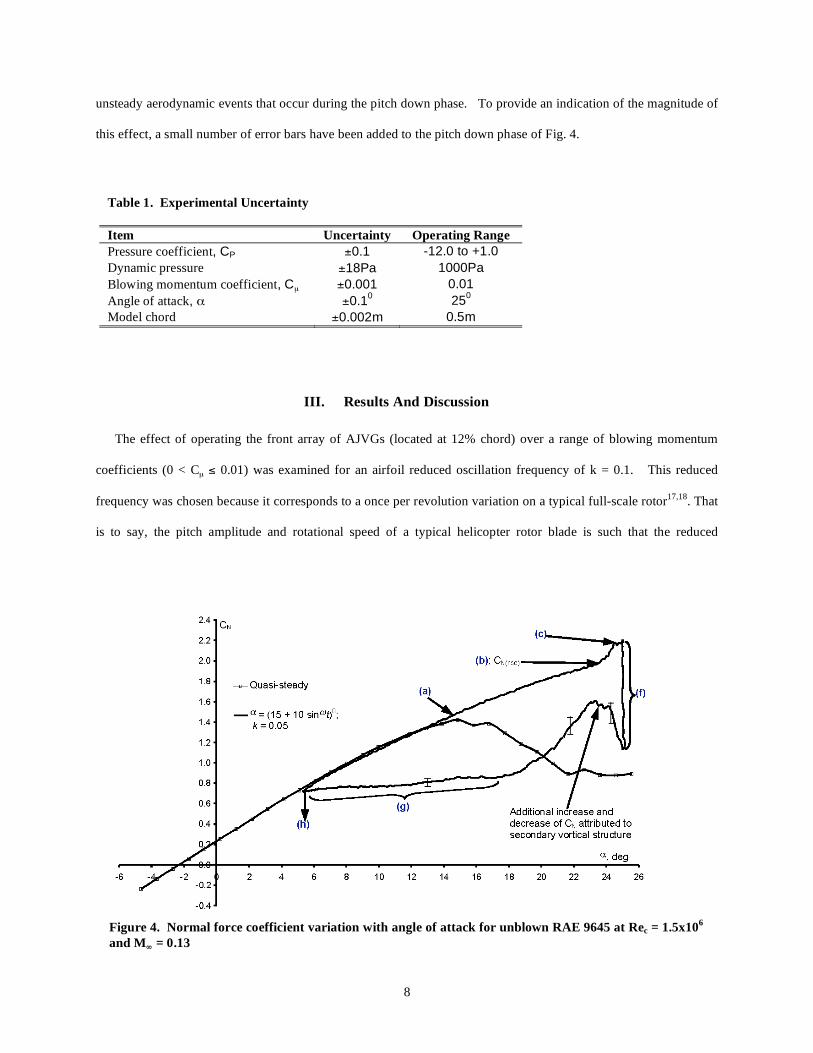
unsteady aerodynamic events that occur during the pitch down phase. To provide an indication of the magnitude of
this effect, a small number of error bars have been added to the pitch down phase of Fig. 4.
III. Results And Discussion
The effect of operating the front array of AJVGs (located at 12% chord) over a range of blowing momentum
coefficients (0 < Cµ 0.01) was examined for an airfoil reduced oscillation frequency of k = 0.1. This reduced
frequency was chosen because it corresponds to a once per revolution variation on a typical full-scale rotor17,18
. That
is to say, the pitch amplitude and rotational speed of a typical helicopter rotor blade is such that the reduced
Figure 4. Normal force coefficient variation with angle of attack for unblown RAE 9645 at Rec = 1.5x10
6
and M = 0.13
9
frequency at which the blade pitches is about 0.1.
The integrated aerodynamic loads measured on the unblown RAE 9645 airfoil are illustrated in Figs. 4 and 5.
Figure 4 shows that the airfoil significantly overshoots the quasi-steady stall angle [Fig. 4-(a)] and continues to
generate additional normal force as it does so. This phenomenon is called lift overshoot. Previous experiments by
Carr et al.19
showed that a pitching airfoil can tolerate large regions of reversed flow on its surface before
experiencing large-scale, boundary-layer separation. This tolerance allows the airfoil to continue to increase its
normal force well beyond the quasi-static stall angle.
In the present case, the normal force increases monotonically up to 23.50 after which the slope increases non-
linearly (CNrise) due to the formation of the dynamic stall vortex [Fig. 4-(b)]. The stall vortex grows as the airfoil
continues to pitch up, and then migrates towards the trailing edge at a speed of roughly 0.4U20,21
. When the stall
vortex reaches the airfoil mid-chord the normal force achieves a maximum after which the airfoil experiences lift
stall. Figure 4-(c) shows this occurs at approximately 24.50.
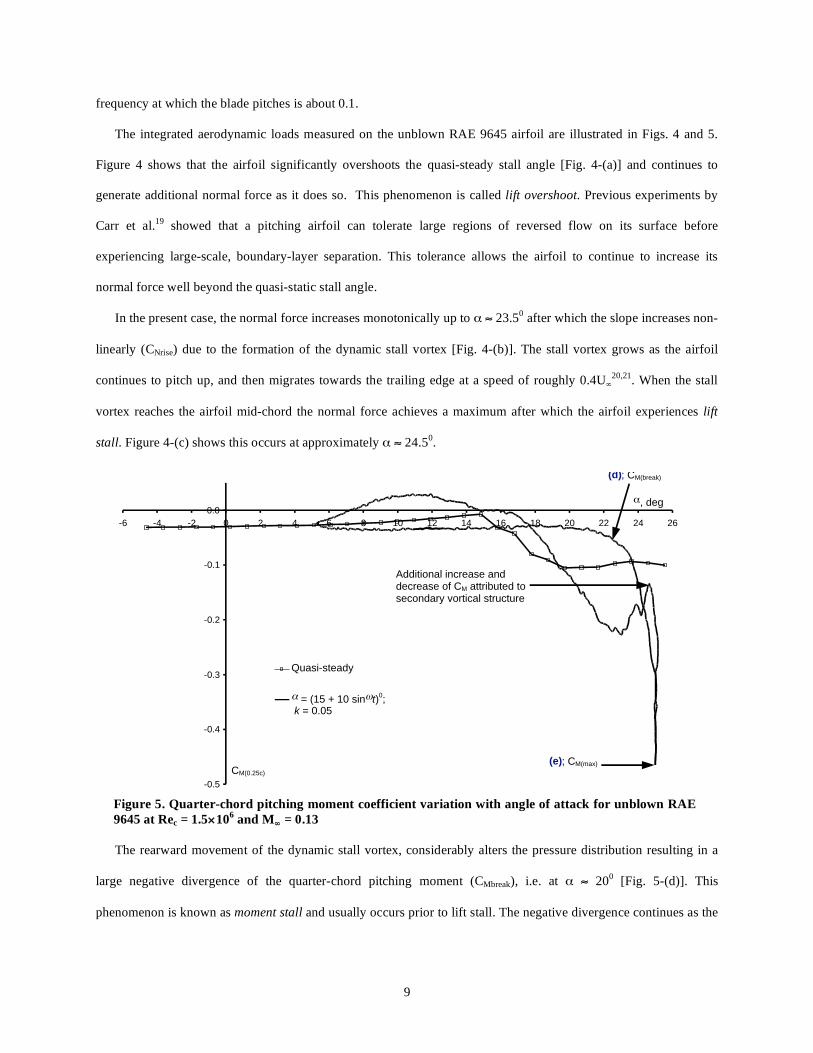
The rearward movement of the dynamic stall vortex, considerably alters the pressure distribution resulting in a
large negative divergence of the quarter-chord pitching moment (CMbreak), i.e. at 200 [Fig. 5-(d)]. This
phenomenon is known as moment stall and usually occurs prior to lift stall. The negative divergence continues as the
-0.5
-0.4
-0.3
-0.2
-0.1
0.0 -6 -4 -2 0 2 4 6 8 10 12 14 16 18 20 22 24 26
Quasi-steady
= (15 + 10 sin t)0;
k = 0.05
CM(0.25c)
, deg
(d); CM(break)
(e); CM(max)
Additional increase and
decrease of CM attributed to
secondary vortical structure
Figure 5. Quarter-chord pitching moment coefficient variation with angle of attack for unblown RAE
9645 at Rec = 1.5 106 and M = 0.13

10
vortex migrates rearwards. The pitching moment curve reaches a maximum negative value (CMmax) as the stall
vortex reaches the airfoil trailing edge, i.e. at 250 [Fig. 5-(e)].
The dynamically pitching airfoil encounters full stall when the vortex sheds from the trailing edge. The sudden
and severe break in the normal force curve [Fig. 4-(f)], which in this case occurs at 250, is due to the change in
the direction of pitch at the top of the oscillation cycle19,24
as well as to the shedding of the dynamic stall vortex from
the airfoil trailing edge. The additional or secondary increase in the normal force and break in the pitching moment
can be attributed to secondary vortex shedding20
.
On the down-stroke, boundary-layer reattachment is initiated at the leading edge, and moves towards the trailing
edge as shown in Fig. 4-(g)22,23
. The boundary-layer reattachment process is only completed towards the end of the
down-stroke motion, i.e. at approximately 50 [Fig. 4-(h)]. The significant hysteresis in the aerodynamic loads is
due to the fact that the boundary layer is attached for nearly all of the upstroke motion whereas it is separated for
most of the down-stroke. Boundary-layer separation persists for most of the down-stroke as the stalled wake fluid
convects across the airfoil chord19,23
.
Figures 6 and 7 show the effect of blowing from the front AJVG array on the aerodynamic loads of the airfoil
0
0.5
1
1.5
2
2.5
0 5 10 15 20 25 30
No Blowing
Cµ=0.005
Cµ=0.008
Cµ=0.01
Cn
Figure 6. Normal force coefficient variation with angle of attack for RAE 9645 at = (15 + 10 sin t)deg,
k = 0.1, Rec = 1.5 106 and M = 0.13 with front AJVG operating
11
oscillating at = (150 + 10
0 sin t) deg at a reduced frequency, k, of 0.1. Carr et al.
19 has shown that the initiation
and forward movement of trailing-edge separation on an unblown oscillating airfoil eventually leads to the
formation of a dynamic stall vortex. Therefore, the intention of blowing from the front array was to delay any such
forward movement of trailing-edge separation and so control or modify the dynamic stall process3,7
.
Figure 6 shows that steady blowing at Cµ = 0.005 and Cµ = 0.008 delays the inception of the normal force non-
linear increase (CNrise) by about 10, to 24.5
0. The normal force slope then increases non-linearly up to 25
0
after which the normal force decreases abruptly. The observed change in the gradient of the normal force curve is
attributed not only to the formation, migration and shedding of a dynamic stall vortex; but also to the change in the
direction of pitch at the top of the oscillation cycle19,24
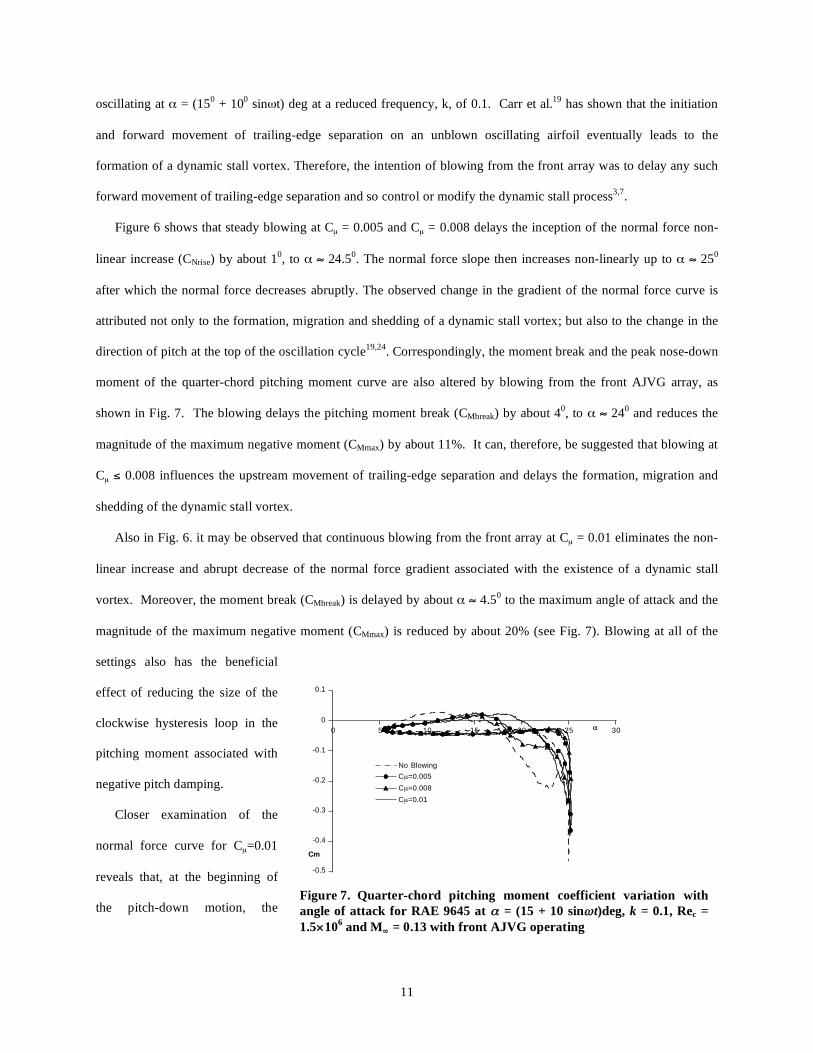
. Correspondingly, the moment break and the peak nose-down
moment of the quarter-chord pitching moment curve are also altered by blowing from the front AJVG array, as
shown in Fig. 7. The blowing delays the pitching moment break (CMbreak) by about 40, to 24
0 and reduces the
magnitude of the maximum negative moment (CMmax) by about 11%. It can, therefore, be suggested that blowing at
Cµ 0.008 influences the upstream movement of trailing-edge separation and delays the formation, migration and
shedding of the dynamic stall vortex.
Also in Fig. 6. it may be observed that continuous blowing from the front array at Cµ = 0.01 eliminates the non-
linear increase and abrupt decrease of the normal force gradient associated with the existence of a dynamic stall
vortex. Moreover, the moment break (CMbreak) is delayed by about 4.50 to the maximum angle of attack and the
magnitude of the maximum negative moment (CMmax) is reduced by about 20% (see Fig. 7). Blowing at all of the
settings also has the beneficial
effect of reducing the size of the
clockwise hysteresis loop in the
pitching moment associated with
negative pitch damping.
Closer examination of the
normal force curve for Cµ=0.01
reveals that, at the beginning of
the pitch-down motion, the
-0.5
-0.4
-0.3
-0.2
-0.1
0
0.1
0 5 10 15 20 25 30
No Blowing
Cµ=0.005
Cµ=0.008
Cµ=0.01
Cm
Figure 7. Quarter-chord pitching moment coefficient variation with
angle of attack for RAE 9645 at = (15 + 10 sin t)deg, k = 0.1, Rec =
1.5 106 and M = 0.13 with front AJVG operating
12
gradient of the normal force-curve increases and then abruptly decreases indicating the possible existence of a
dynamic stall vortex (see Fig. 6). With the AJVGs switched on, boundary-layer separation on the upper surface of
the pitching airfoil appears to be suppressed during the pitch-up motion. As the airfoil begins to pitch down,
however, the boundary layer detaches from the airfoil. It may be hypothesized that, at the beginning of the pitch-
down motion, a dynamic stall vortex is shed from the airfoil contributing to the increase and decrease observed in
the normal force gradient. The magnitude of the changes to the normal force suggests that this dynamic stall vortex
is weak.
From the results presented, increasing the magnitude of the steady blowing progressively reduces the magnitude
of hysteresis in the aerodynamic loads. Weaver et al.7 suggested that the prime cause of the hysteresis is the extent
of the separation present throughout the down-stroke portion of the oscillation cycle. This suggests that blowing
from the front AJVG array is effective in accelerating the process of boundary-layer re-establishment during the
downstroke.
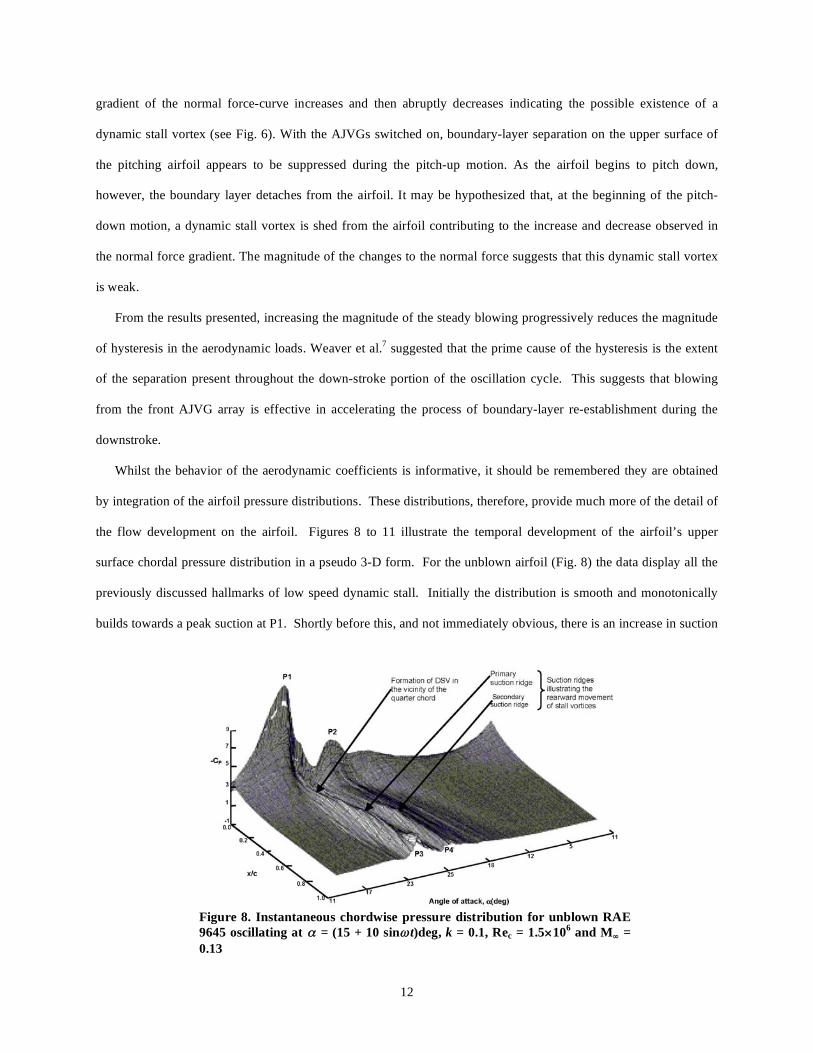
Whilst the behavior of the aerodynamic coefficients is informative, it should be remembered they are obtained
by integration of the airfoil pressure distributions. These distributions, therefore, provide much more of the detail of
the flow development on the airfoil. Figures 8 to 11 illustrate the temporal development of the airfoil’s upper
surface chordal pressure distribution in a pseudo 3-D form. For the unblown airfoil (Fig. 8) the data display all the
previously discussed hallmarks of low speed dynamic stall. Initially the distribution is smooth and monotonically
builds towards a peak suction at P1. Shortly before this, and not immediately obvious, there is an increase in suction
Figure 8. Instantaneous chordwise pressure distribution for unblown RAE
9645 oscillating at = (15 + 10 sin t)deg, k = 0.1, Rec = 1.5 106 and M =
0.13
13
at the trailing edge indicating the presence of some separation. Also around this time, near the 25% of chord
location, the first indications of a deviation in the local pressure distribution herald the onset of dynamic stall20
. This
feature, associated with the formation of the dynamic stall vortex, develops into a well-defined ridge as the vortex
grows and convects towards the trailing edge. As time advances, the leading edge suction peak collapses, and this
primary ridge becomes the dominant feature of the distribution. When the vortex crosses the trailing edge, there is
an obvious localized peak (P3) with an associated pressure wave that travels a short distance towards the leading
edge. This is a consequence of the formation of a vortical system of opposite circulation, known as the trailing-edge
vortex (TEV) and is a result of the mass influx from the high-pressure region, on the airfoil lower surface, to the
upper surface25,26
. As mentioned earlier, the peak nose-down moment (CMmax) observed in Fig. 5 is attained when the
dynamic stall vortex reaches the airfoil trailing edge. However, Feszty et al.27
suggested that the dynamic stall
vortex only indirectly influences CMmax by inducing the formation of the trailing-edge vortex close to the airfoil
surface. The shedding of this trailing-edge vortex coincides with the maximum negative moment, CMmax.
The remainder of Fig. 8 shows the presence of a secondary suction peak, P2, in the vicinity of the leading edge,
which is associated with the development of a secondary vortical structure. Likewise, the migration of the secondary
vortex from the airfoil leading edge downstream towards the trailing edge is also evident. This is simply evidence
of the airfoil behaving like a bluff body.
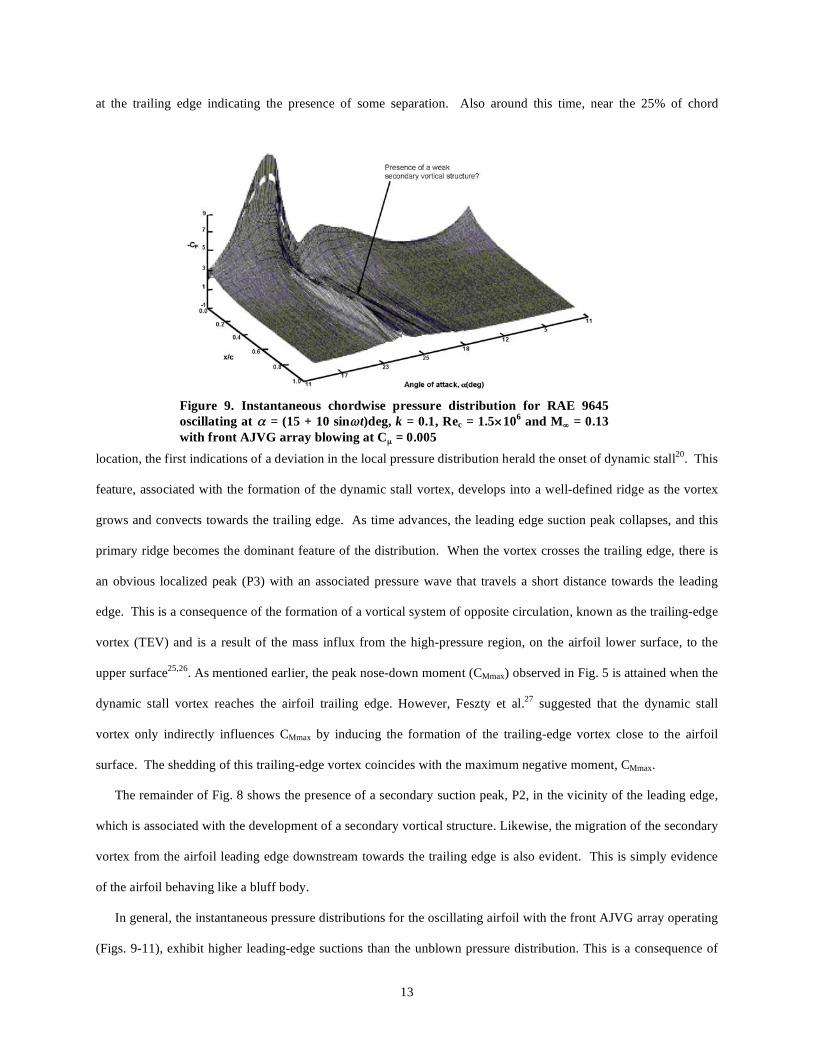
In general, the instantaneous pressure distributions for the oscillating airfoil with the front AJVG array operating
(Figs. 9-11), exhibit higher leading-edge suctions than the unblown pressure distribution. This is a consequence of
Figure 9. Instantaneous chordwise pressure distribution for RAE 9645
oscillating at = (15 + 10 sin t)deg, k = 0.1, Rec = 1.5 106 and M = 0.13
with front AJVG array blowing at Cµ = 0.005

14
the delay in the forward movement of trailing-edge separation during the upstroke. Closer examination of Figs. 9 to
11, shows the existence of a vortex induced suction ridge associated with the passage of the stall vortex over the
upper surface of the airfoil. This observation is consistent with the presence of vortex lift in the aerodynamic loads
as shown in Figs. 6 and 7. The reduction of the suction ridge height suggests that the strength of the dynamic stall
vortex is progressively reduced when the amount of steady AJVG blowing is increased from Cµ = 0.005 to Cµ =
0.01. It may, therefore, be postulated that the formation of the dynamic stall vortex has been modified beneficially in
all cases and almost eliminated when Cµ > 0.008.
As mentioned above, and shown in Fig. 3., two AJVG arrays were installed on the upper surface of the airfoil
Figure 10. Instantaneous chordwise pressure distribution for RAE 9645
oscillating at = (15 + 10 sin t)deg, k = 0.1, Rec = 1.5 106 and M = 0.13
with front AJVG array blowing at Cµ = 0.008
Figure 11. Instantaneous chordwise pressure distribution for RAE 9645
oscillating at = (15 + 10 sin t)deg, k = 0.1, Rec = 1.5 106 and M = 0.13
with front AJVG array blowing at Cµ = 0.01

15
model; one at x/c=0.12 and the other at x/c=0.62. Upon establishing that blowing at Cµ=0.01 from the x/c=0.12
location significantly modified the airfoil performance, subsequent tests were carried out to examine the effect of
blowing from the rearward array and from a combination of the two arrays. In all of these tests, the blowing
coefficient was held constant at Cµ=0.01. Figures 12 and 13 present the results of these tests and compare them with
the corresponding front array results and those of the unblown case.
In Fig. 12 it may be seen that with only the rear array operational, the normal force and pitching moment
responses are quite different to both the results obtained for the front array and unblown cases. The build up of
normal force on the upstroke closely follows the front blowing case suggesting that the rear array is effective at
suppressing trailing edge separation. The manner of stall is, however, significantly different. Close inspection
reveals the classical characteristics of CN rise due to dynamic stall vortex build up before the top of the cycle. This
occurs slightly later than the unblown case but is in stark contrast to the front array blowing case where the only
evidence of possible dynamic stall vortex formation occurs near the start of the downstroke. Similarly, although the
corresponding pitching moment break is delayed in comparison to the unblown case (Fig. 13), the magnitude of the
delay is considerably less than that achieved by blowing from the front array. More significantly, the magnitude of
the break is almost twice that of
the front array blowing case.
When the two AJVG arrays
are operated at the same time,
there is only a marginal
improvement over the rear
blowing case. Nevertheless, the
normal force and pitching
moment responses for this case
are interesting and provide
more insight into the way in
which the AJVGs alter the
flow. On the upstroke, the
combined blowing produces a normal force curve that closely follows the unblown case. It should be borne in mind
0
0.5
1
1.5
2
2.5
0 5 10 15 20 25 30
No Blowing
Cµ=0.01 (x/c=0.62)
Cµ=0.01 (x/c=0.12 & 0.62)
Cµ=0.01 (x/c=0.12)
Cn
Figure 12. Normal force coefficient variation with angle of attack for
RAE 9645 at = (15 + 10 sin t)deg, k = 0.1, Rec = 1.5 106 and M = 0.13
with Cµ = 0.01

16
that by operating the dual array configuration at the same overall blowing momentum coefficient as a single array,
the momentum efflux from each array is half that used for the single array blowing. The fact that the normal force
curve for the combined blowing case is similar to the unblown case suggests that the momentum efflux from the jets
is not strong enough to energize the boundary layer sufficiently at either of the two array locations to delay trailing
edge separation. This implies that the AJVG injection velocity is a critical parameter in determining the boundary
layer response.
As in the previous case, dynamic
stall onset is clearly visible in the
combined blowing case. Interestingly,
the incidence at which this occurs is
slightly higher than the rear blowing
case, suggesting that the front array is
partially effective in delaying stall
onset. In this respect, it is interesting to
compare this result with the front
blowing case of Cµ=0.005 (Fig. 14).
Figure 14a. Normal force coefficient comparison
of combined and front only blowing cases = (15
+ 10 sin t)deg, k = 0.1, Rec = 1.5 106 and M =
0.13
Figure 14b. Pitching moment coefficient
comparison of combined and front only blowing
cases = (15 + 10 sin t)deg, k = 0.1, Rec = 1.5 106
and M = 0.13
-0.5
-0.4
-0.3
-0.2
-0.1
0
0.1
5 10 15 20 25 30
No BlowingCµ=0.01 (x/c=0.62)
Cµ=0.01 (x/c=0.12 & 0.62)
Cµ=0.01 (x/c=0.12)
Cm
Figure 13. Quarter-chord pitching moment coefficient variation with
angle of attack for RAE 9645 at = (15 + 10 sin t)deg, k = 0.1, Rec =
1.5 106 and M = 0.13 with Cµ = 0.01
0
0.5
1
1.5
2
2.5
0 5 10 15 20 25 30
cµ = 0.005 (x/c=0.12)
cµ = 0.01 (x/c=0.12 & x/c=0.62)
Cn
-0.5
-0.4
-0.3
-0.2
-0.1
0
0.1
0 5 10 15 20 25 30
Cµ=0.005 (x/c=0.12)
Cµ=0.01 (x/c=0.12 & x/c=0.62)
Cm

17
There is remarkable similarity between the two cases during the pitch up phase implying that the front array is
the dominant flow control device there. The front array alone also produces a slight reduction in the negative pitch
damping, associated with changes to the pitching moment during the pitch down phase.
Overall, when compared to the unblown case, AJVGs improve the low speed dynamic stall characteristics of the
RAE9645 airfoil. The placement and strength of the active AJVGs is, however, important as has been amply
demonstrated in this study. Whilst these experiments have been concerned with pitching oscillations that represent
helicopter blade motions, the interpretation of the data has been complicated by the angular acceleration of the
airfoil. This is particularly the case at the top of the pitch cycle where much of the dynamic content of the response
occurs within a relatively small incidence range. The evolution of the stall and the re-establishment of fully attached
flow after stall can be better examined using linear ramp motions, ramp-up and ramp-down, that consider the two
effects independently28
. Data from such tests are currently under analysis.
IV. Conclusion
Tests conducted on a single-element airfoil oscillating in pitch according to the profile = (150 + 10
0 sin t), for
the reduced oscillation frequency of k = 0.1 and incorporating two spanwise arrays of AJVGs have shown that:
1) Blowing from the front AJVG array considerably enhanced the overall aerodynamic performance of the
oscillating RAE 9645 airfoil compared with blowing from either the rear AJVG array or from both the front
and rear AJVG arrays simultaneously (with the same total mass flux).
2) Blowing from the front AJVG array at Cµ = 0.01 apparently weakens the dynamic stall vortex to the extent
that its effect on the normal force and pitching moment responses is minimal.
The present work is restricted to low-speed dynamic stall. Above a threshold of Mach 0.3, the effect of
compressibility is pronounced and accelerates the initiation of the dynamic stall vortex and changes the mechanism
of dynamic stall onset from that observed in low-speed experiments29,30
. Moreover, on most modern helicopters the
retreating blade works at a Mach number of about 0.431
. Although the effectiveness of AJVGs in compressible flow
and, in particular, for controlling shock induced separation has been demonstrated14
, the blowing requirements may
increase under these conditions. The optimum jet location on the blade may also change, particularly if shock
18
induced separation occurs upstream of the current jet location. The sensitivity of the AJVG effectiveness to real
rotor effects such as flow skew angle, radial flow and time varying Mach number may also be an issue. In addition,
if used continuously around the azimuth, the influence of the AJVGs on the advancing side of the rotor also needs to
be investigated.
Nevertheless, the potential application of low-momentum blowing AJVGs to assuage dynamic stall and enhance
airfoil performance characteristics has been demonstrated in the current work. If this can be replicated on the high-
lift producing radial blade locations on a helicopter rotor it could have a significant impact on future rotor
performance.
Acknowledgments
The work was carried out with funding from the Engineering & Physical Science Research Council, (Grant Ref
GR/M85432/01), Westland Helicopters and DSTL (formerly DERA). The authors acknowledge with gratitude the
help and support of their sponsors and, in particular, the substantial contributions of Mr Robert Gilmour, Mr
Christopher Barber and Mr Michael Smith to this work.
References
1Johnson, W., Helicopter Theory, Princeton University Press, 1980.
2Bousman, W. G., “A Qualitative Examination of Dynamic Stall from Flight Test Data”, AHS 53rd Annual Forum
Proceedings, 1997, pp. 368-387.
3Yu, Y. H., Lee, S., McAllister, K. W., Tung, C., and Wang, C. M., “Dynamic Stall Control for Advanced Rotorcraft
Application”, AIAA Journal, Vol. 33, No. 2, 1995, pp. 289–295.
4Teves, D., Nisel, G., Blaas, A., and Jacklin, S., “The Role of Active Control in Future Rotorcraft”, 21st European Rotorcraft
Forum, Paper III-10, 1995.
19
5Chan, W. and Brocklehurst, A., “Performance enhancement evaluation of an actuated trailing edge flap”, The Aeronautical
Journal, Vol. 105, No. 1049, July 2001, pp. 391-399.
6McCloud III, J.L., Hall, L.P., and Brady, J.A., “Full-Scale Wind-Tunnel Tests of Blowing Boundary-Layer Control Applied
to a Helicopter Rotor”, NASA Technical Note D-335, 1960.
7Weaver, D., McAllister, K. W., and Tso, J., “Suppression of Dynamic Stall by Steady and Pulsed Upper-Surface Blowing”,
NASA Technical Paper 3600, 1996.
8Alferai, M., and Acharya, M., “Controlled leading-edge suction for the management of unsteady separation over pitching
aerofoils”, AIAA paper 95-2188, 26th AIAA Fluid Dynamics Conference, 1995.
9Cheeseman, I. C. and Seed, A.R., “The Application of Circulation Control by Blowing to Helicopter Rotors”, Journal of The
Royal Aeronautical Society, Vol. 71, No. 679, July 1967, pp. 451-467.
10. Johnston, J. P., and Nishi, M., “ Vortex Generator Jets – Means for Flow Separation Control”, AIAA Journal, Vol. 28, No.
6, 1990, pp. 989-994.
11Henry, F. S., and Pearcey, H. H., “Numerical Model of Boundary-Layer Control Using Air-Jet Generated Vortices”, AIAA
Journal, Vol. 32, No. 12, 1994, pp. 2415-2424.
12Lewington, N. P., Peake, D. J., Henry, F. S., Kokkalis, A., and Perry, J., “The Control of Flow on Helicopter Rotor Blades”,
Proc. of 26th European Rotorcraft Forum, The Hague, Netherlands. September 2000.
13Singh, C., Peake, D. J., Kokkalis, A., Coton, F., and Galbraith, R., “Control of flow on helicopter rotor blades under quasi-
steady and unsteady flow conditions using smart air-jet vortex generators”, Proc of 29th European Rotorcraft Forum, Germany,
16-18 September 2003.
14Pearcey, H. H., Shock induced separation and its prevention by design and boundary layer control, Pergamon Press, pp.
1166-1134, 1961.
15Akanni, S. D., and Henry, F. S., “Numerical calculations of air-jet vortex generators in turbulent boundary layers”, CEAS
European Forum on ‘High Lift & Separation Control’, Paper 16, 1995.
16Oliver, A. G., “Air jet vortex generators for wind turbines”, PhD Thesis, City University (London), Centre for Aeronautics,
1997.
17Wilby, P. G., “The aerodynamic characteristics of some new RAE blade sections, and their potential influence on rotor
performance”, Vertica, Vol. 4, 1980, pp. 121-133.
18Wilby, P. G., “An experimental investigation of the influence of a range of aerofoil design features on dynamic stall onset”,
10th European Rotorcraft Forum, Paper No 2, 1984.

20
19Carr, L. W., McAllister, K. W., and McCroskey, W. J., “Analysis of the development of dynamic stall based on oscillating
airfoil experiments”, NASA Technical Note D-8382, 1977.
20McCroskey, W. J., “The phenomenon of dynamic stall”, NASA Technical Memorandum 81264, 1981.
21Green, R. B., Galbraith, R. A. McD., and Niven, A. J., “Measurements of the Dynamic Stall Vortex Convection Speed”,
The Aeronautical Journal, Vol. 96, No. 958, 1992, pp. 319-325.
22Ahmed, S., and Chandrasekhara, M. S., “Reattachment Studies of an Oscillating Aerofoil Dynamic Stall Flowfield”, AIAA
Journal, Vol. 32, No. 5, 1994, pp. 1006-1012.
23Green, R. B., and Galbraith, R. A. McD., “Dynamic recovery to fully attached aerofoil flow from deep stall”, AIAA
Journal, Vol. 33, No. 8, 1995, pp. 1433-1440.
24McAllister, K. W., and Carr, L. W., “Water Tunnel Visualisations of Dynamic Stall”, Journal of Fluids Engineering, Vol.
101, September 1979, pp. 376-380.
25Robinson, M. C., Helin, H. E., and Luttges, M. W., “Control of Wake Structure Behind an Oscillating Aerofoil”, AIAA
Paper 86-2282.
26Shih, C., Lourenco, L., Van Dommelen, L., and Krothapalli, A., “Unsteady Flow Past an Aerofoil Pitching at a Constant
Rate”, AIAA Journal, Vol 30, No 5, 1992, pp 1153-1161.
27Feszty, D., Gillies, E.A., and Vezza, M., “Alleviation of Rotor Blade Dynamic Stall via Trailing Edge Flap Flow Control”,
AIAA Paper 2003-0020, 41st Aerospace Sciences Meeting and Exhibit, Jan 2003.
28Coton, F. N., and Galbraith, R. A. McD., “An experimental study of dynamic stall on a finite wing”, The Aeronautical
Journal, Vol. 103, No. 1015, May 1999, pp. 229-236.
29Chandrasekhara, M. S., and Carr, L. W., “ Flow Visualisation Studies of the Mach Number Effects on Dynamic Stall of an
Oscillating Aerofoil”, Journal of Aircraft, Vol. 27, No. 6, 1990, pp. 516-522.
30. Chandrasekhara, M. S., and Carr, L. W., “Compressibility Effects on Dynamic Stall of Oscillating Aerofoils”, AGARD
CP-552, Paper 3, 1995.
31St. Hilaire, A. O., Carta, F. O., Fink, M. R., and Jepson, W. D., “The Influence of Sweep on the Aerodynamic
Loading of an Oscillating NACA 0012 Aerofoil”, Vol 1 – Technical Report, NASA CR 3092, 1979.