SINGAPORE PRESS HOLDINGS LIMITED Reg. No. 198402868E ...
21
1 SINGAPORE PRESS HOLDINGS LIMITED Reg. No. 198402868E (Incorporated in Singapore) ANNOUNCEMENT AUDITED RESULTS FOR THE YEAR ENDED AUGUST 31, 2012 1(a) An income statement (for the group) together with a comparative statement for the corresponding period of the immediately preceding financial year (i) Results for the Year ended August 31, 2012 Group 2012 2011 Change S$’000 S$’000 % Operating revenue Newspaper and Magazine 1,002,762 1,013,285 (1.0) Property 191,421 167,884 14.0 Others 78,730 69,803 12.8 1,272,913 1,250,972 1.8 Other operating income 19,823 18,852 5.2 1,292,736 1,269,824 1.8 Materials, production and distribution costs (221,104) (218,868) 1.0 Staff costs (360,160) (348,461) 3.4 Premises costs (61,792) (54,830) 12.7 Depreciation (78,204) (76,785) 1.8 Other operating expenses (136,782) (122,031) 12.1 Finance costs (24,452) (39,811) (38.6) Profit before investment income and share of net loss of associates and jointly-controlled entities # 410,242 409,038 0.3 Net income from investments 32,590 50,351 (35.3) Share of net loss of associates and jointly-controlled entities (1,172) (2,707) (56.7) Profit before taxation 441,660 456,682 (3.3) Taxation (72,302) (72,931) (0.9) Profit after taxation 369,358 383,751 (3.8) Attributable to: Shareholders of the Company 365,542 388,575 (5.9) Non-controlling interests 3,816 (4,824) NM 369,358 383,751 (3.8) # This represents the recurring earnings of the media and property businesses. NM: Not meaningful
Transcript of SINGAPORE PRESS HOLDINGS LIMITED Reg. No. 198402868E ...

1
SINGAPORE PRESS HOLDINGS LIMITED Reg. No. 198402868E
(Incorporated in Singapore)
ANNOUNCEMENT AUDITED RESULTS FOR THE YEAR ENDED AUGUST 31, 2012
1(a) An income statement (for the group) together with a comparative statement for the corresponding period of the immediately preceding financial year
(i) Results for the Year ended August 31, 2012 Group 2012 2011 Change
S$’000 S$’000 %
Operating revenue Newspaper and Magazine 1,002,762 1,013,285 (1.0)
Property 191,421 167,884 14.0
Others 78,730 69,803 12.8 1,272,913 1,250,972 1.8 Other operating income 19,823 18,852 5.2
1,292,736 1,269,824 1.8
Materials, production and distribution costs
(221,104)
(218,868)
1.0
Staff costs (360,160) (348,461) 3.4 Premises costs (61,792) (54,830) 12.7
Depreciation (78,204) (76,785) 1.8
Other operating expenses (136,782) (122,031) 12.1
Finance costs (24,452) (39,811) (38.6) Profit before investment income and
share of net loss of associates and jointly-controlled entities # 410,242 409,038 0.3
Net income from investments 32,590 50,351 (35.3)
Share of net loss of associates and jointly-controlled entities
(1,172)
(2,707)
(56.7)
Profit before taxation 441,660 456,682 (3.3)
Taxation (72,302) (72,931) (0.9)
Profit after taxation 369,358 383,751 (3.8)
Attributable to:
Shareholders of the Company 365,542 388,575 (5.9)
Non-controlling interests 3,816 (4,824) NM 369,358 383,751 (3.8)
# This represents the recurring earnings of the media and property businesses. NM: Not meaningful

2
1(a)(ii) Notes: Profit after taxation is arrived at after accounting for: Group 2012 2011 Change S$’000 S$’000
%
Allowance for stock obsolescence (655) (237) 176.4
Share-based compensation expense (6,261) (7,724) (18.9)
Allowance for impairment of trade receivables (534) (1,586) (66.3)
Bad debts recovery 320 342 (6.4)
Amortisation of intangible assets (7,678) (5,712) 34.4
Impairment of intangible assets (481) - NM
Impairment of goodwill - (1,134) NM
Net reversal of impairment of property, plant and equipment
765
96
696.9
Net (loss)/profit on disposal of property, plant and equipment
(273)
199
NM
Investment property renovations and fittings written-off
(82) - NM
Allowance for impairment of an associate (45) (342) (86.8)
Net gain on dilution/disposal of associates - 167 NM
Interest income 7,406 10,575 (30.0)
Net fair value (loss)/gain on
- Internally-managed assets at fair value through profit or loss
(839)
203
NM
- Derivative financial instruments (4,606) 324 NM
Impairment of internally-managed investments - (4,714) NM
Realised gain on derivative financial instruments
240
14,056
(98.3)
Net foreign exchange loss (1,541) (7,297) (78.9)
Net over-provision of prior years’ taxation 2,121 4,497 (52.8)

3
1(a)(iii) Statement of Comprehensive Income Group 2012 2011 Change S$’000 S$’000 %
Profit after taxation 369,358 383,751 (3.8)
Other comprehensive income/(loss), net of tax
Cash flow hedges - net fair value changes (3,002) (6,284) (52.2) - transferred to income statement 2,213 12,551 (82.4)
Net fair value changes on available-for-sale financial assets
- net fair value changes 29,598 38,395 (22.9) - transferred to income statement on disposal (5,665) (2,893) 95.8
Currency translation difference - arising from consolidation of financial statements
of foreign subsidiaries, associates and jointly-controlled entities
1,304
(3,419)
NM
24,448 38,350 (36.3)
Total comprehensive income 393,806 422,101 (6.7)
Attributable to:
Shareholders of the Company 389,921 427,243 (8.7)
Non-controlling interests 3,885 (5,142) NM
393,806 422,101 (6.7)
1(a)(iv) Comparatives Information
During the current year, the Group made some changes to the classification of certain expenses in the income statement to reflect more appropriately the nature of these expenses. Comparative amounts in the income statement were reclassified for consistency, as set out below. Group
As Restated
As Previously Disclosed
2011 2011
S$’000 S$’000
Materials, production and distribution costs* (218,868) - Materials, consumables and broadcasting costs** - (164,449) Staff costs (348,461) (348,461) Premises costs^ (54,830) - Depreciation (76,785) (76,785) Other operating expenses (122,031) (231,280) Finance costs (39,811) (39,811)
(860,786) (860,786)
Since the amounts are reclassifications within operating activities in the income statement, this reclassification did not have any effect on the balance sheets and statement of cash flows.
* Materials, production and distribution costs comprise raw materials and overheads incurred mainly in the printing and distribution of newspaper and magazine products.
** Expenses previously disclosed as materials, consumables and broadcasting costs are now shown as part of materials, production and distribution costs.
^ Premises costs comprise running costs associated with the Group's investment properties and office premises, including maintenance, utilities and property taxes.
4
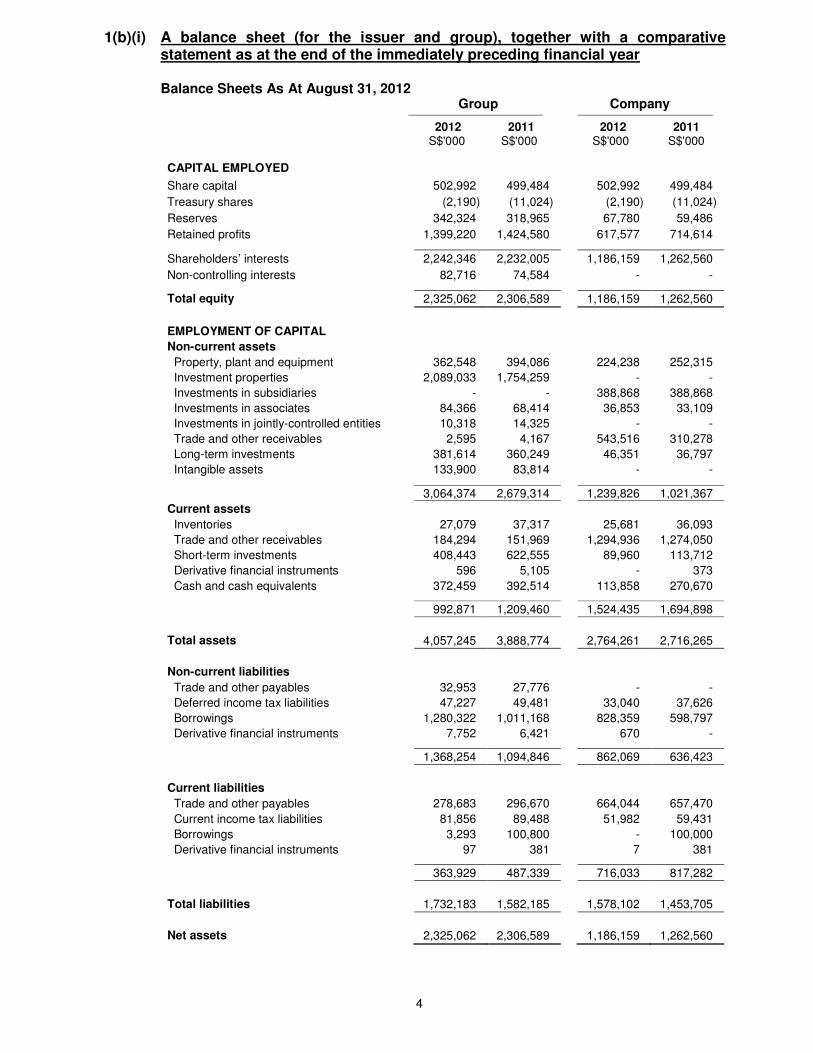
1(b)(i) A balance sheet (for the issuer and group), together with a comparative statement as at the end of the immediately preceding financial year
Balance Sheets As At August 31, 2012 Group Company
2012 2011 2012 2011 S$'000 S$'000 S$'000 S$'000
CAPITAL EMPLOYED
Share capital 502,992 499,484 502,992 499,484
Treasury shares (2,190) (11,024) (2,190) (11,024)
Reserves 342,324 318,965 67,780 59,486
Retained profits 1,399,220 1,424,580 617,577 714,614
Shareholders’ interests 2,242,346 2,232,005 1,186,159 1,262,560
Non-controlling interests 82,716 74,584 - -
Total equity 2,325,062 2,306,589 1,186,159 1,262,560
EMPLOYMENT OF CAPITAL
Non-current assets
Property, plant and equipment 362,548 394,086 224,238 252,315
Investment properties 2,089,033 1,754,259 - -
Investments in subsidiaries - - 388,868 388,868
Investments in associates 84,366 68,414 36,853 33,109
Investments in jointly-controlled entities 10,318 14,325 - -
Trade and other receivables 2,595 4,167 543,516 310,278
Long-term investments 381,614 360,249 46,351 36,797
Intangible assets 133,900 83,814 - -
3,064,374 2,679,314 1,239,826 1,021,367
Current assets
Inventories 27,079 37,317 25,681 36,093
Trade and other receivables 184,294 151,969 1,294,936 1,274,050
Short-term investments 408,443 622,555 89,960 113,712
Derivative financial instruments 596 5,105 - 373
Cash and cash equivalents 372,459 392,514 113,858 270,670
992,871 1,209,460 1,524,435 1,694,898
Total assets 4,057,245 3,888,774 2,764,261 2,716,265
Non-current liabilities
Trade and other payables 32,953 27,776 - -
Deferred income tax liabilities 47,227 49,481 33,040 37,626
Borrowings 1,280,322 1,011,168 828,359 598,797
Derivative financial instruments 7,752 6,421 670 -
1,368,254 1,094,846 862,069 636,423
Current liabilities
Trade and other payables 278,683 296,670 664,044 657,470
Current income tax liabilities 81,856 89,488 51,982 59,431
Borrowings 3,293 100,800 - 100,000
Derivative financial instruments 97 381 7 381
363,929 487,339 716,033 817,282
Total liabilities 1,732,183 1,582,185 1,578,102 1,453,705
Net assets 2,325,062 2,306,589 1,186,159 1,262,560

5
1(b)(ii) Aggregate amount of group’s borrowings and debt securities Group Borrowings Amount repayable in one year
As at August 31, 2012 As at August 31, 2011 Secured S$’000
Unsecured S$’000
Secured S$’000
Unsecured S$’000
- 3,293 - 100,800 Amount repayable after one year
As at August 31, 2012 As at August 31, 2011 Secured S$’000
Unsecured S$’000
Secured S$’000
Unsecured S$’000
301,582 978,740 298,834 712,334 Details of collateral
The secured bank loan facilities as at August 31, 2012 comprised the term loan facilities of S$300.0 million (August 31, 2011: S$300.0 million) and S$138.0 million (August 31, 2011: Nil) undertaken by the subsidiaries, Orchard 290 Ltd (“Orchard 290”) and The Seletar Mall Pte Ltd (“Seletar Mall”) respectively. As at the balance sheet date, the amounts drawn down were S$300.0 million for Orchard 290 and S$2.5 million for Seletar Mall.
The term loan taken up by Orchard 290 is secured by way of a legal mortgage on Orchard 290’s investment property, a debenture over the assets of Orchard 290 and an assignment of the insurance on the investment property.
The term loan taken up by Seletar Mall is secured by way of a first legal mortgage on Seletar Mall’s investment property, an assignment of insurance in relation to the investment property and a deed of subordination in respect of the loans from the ultimate holding company and the shareholders of Seletar Mall. The balance of S$301.6 million as at August 31, 2012 represented the borrowings stated at amortised cost.
6
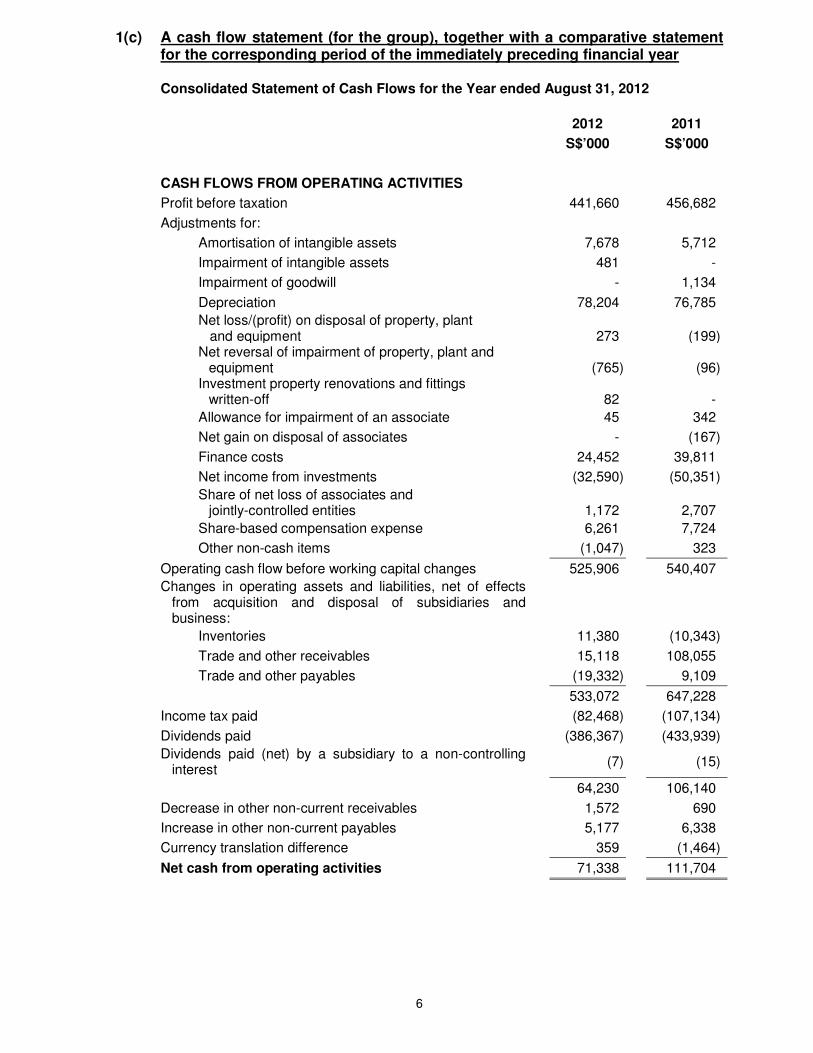
1(c) A cash flow statement (for the group), together with a comparative statement for the corresponding period of the immediately preceding financial year
Consolidated Statement of Cash Flows for the Year ended August 31, 2012
2012 2011
S$’000 S$’000
CASH FLOWS FROM OPERATING ACTIVITIES
Profit before taxation 441,660 456,682
Adjustments for:
Amortisation of intangible assets 7,678 5,712
Impairment of intangible assets 481 -
Impairment of goodwill - 1,134
Depreciation 78,204 76,785
Net loss/(profit) on disposal of property, plant and equipment
273
(199)
Net reversal of impairment of property, plant and
equipment
(765)
(96)
Investment property renovations and fittings written-off
82
-
Allowance for impairment of an associate 45 342
Net gain on disposal of associates - (167)
Finance costs 24,452 39,811
Net income from investments (32,590) (50,351)
Share of net loss of associates and
jointly-controlled entities
1,172
2,707
Share-based compensation expense 6,261 7,724
Other non-cash items (1,047) 323
Operating cash flow before working capital changes 525,906 540,407
Changes in operating assets and liabilities, net of effects from acquisition and disposal of subsidiaries and business:
Inventories 11,380 (10,343)
Trade and other receivables 15,118 108,055
Trade and other payables (19,332) 9,109
533,072 647,228
Income tax paid (82,468) (107,134)
Dividends paid (386,367) (433,939)
Dividends paid (net) by a subsidiary to a non-controlling interest
(7) (15)
64,230 106,140
Decrease in other non-current receivables 1,572 690
Increase in other non-current payables 5,177 6,338
Currency translation difference 359 (1,464)
Net cash from operating activities 71,338 111,704

7
Consolidated Statement of Cash Flows for the Year ended August 31, 2012 (cont’d)
2012 2011
S$’000 S$’000
CASH FLOWS FROM INVESTING ACTIVITIES
Purchase of property, plant and equipment (27,504) (27,448)
Purchase of licence (200) -
Proceeds from disposal of property, plant and equipment 706 524
Additions to investment properties (350,267) (40,083)
Acquisition of a subsidiary (net of cash acquired) (61,245) -
Acquisition of additional interest in a subsidiary (3,855) -
Acquisition of business by a subsidiary (net of cash acquired)
-
(43,065) Net cash outflow from disposal of a subsidiary - (633)
Acquisition of an associate - (500)
Consideration paid on interest in an associate (800) -
Additional consideration paid on interest in an associate (8,750) (6,250)
Dividends received from associates 6,519 2,804
Proceeds from disposal of associates - 240
Additional consideration paid on interests in jointly-controlled entities
(11,270) (14,500)
Increase in amounts owing by associates/jointly-controlled entities
(642)
(812) (Decrease)/Increase in amounts owing to jointly-controlled entities
(3,086)
7,936 Purchase of long-term investments (19,833) (7,842)
Proceeds from disposal/redemption of long-term investments
22,075
233 Purchase of short-term investments (243,970) (512,572)
Proceeds from disposal of short-term investments 427,482 771,164
Dividends received 24,934 28,466
Interest received 7,299 10,413
Other investment income (2,437) 8,058
Net cash (used in)/from investing activities (244,844) 176,133
CASH FLOWS FROM FINANCING ACTIVITIES
Proceeds from bank loans (net of transaction costs) 234,265 299,634
Repayment of bank loans (100,000) (620,800)
Repayment of loan from a non-controlling interest (988) (412)
Interest paid (24,905) (39,183)
Proceeds from issuance of shares by the Company 3,334 4,443
Proceeds from issuance of shares to non-controlling interests
4,845
-
Loan from a non-controlling interest 36,900 -
Net cash from/(used in) financing activities 153,451 (356,318)
Net decrease in cash and cash equivalents (20,055) (68,481)
Cash and cash equivalents at beginning of financial year 392,514 460,995
Cash and cash equivalents at end of financial year 372,459 392,514

8
1(d)(i) A statement (for the issuer and group) showing either (i) all changes in equity or (ii) changes in equity other than those arising from
capitalisation issues and distributions to shareholders, together with a comparative statement for the corresponding period of the immediately preceding financial year
Statements of Changes in Total Equity for the Year ended August 31, 2012
(a) Group
Attributable to Shareholders of the Company
Share
Capital
Treasury Shares
Capital
Reserve
Share-based Compensation
Reserve
Hedging Reserve
Fair Value
Reserve
Currency Translation
Reserve
Retained Profits
Total
Non-controlling Interests
Total
Equity S$’000 S$’000 S$’000 S$’000 S$’000 S$’000 S$’000 S$’000 S$’000 S$’000 S$’000
Balance as at September 1, 2011
499,484
(11,024)
2,005
25,429
(5,645)
300,778
(3,602)
1,424,580
2,232,005
74,584
2,306,589
Total comprehensive income/(loss) for the year
-
-
-
-
(789)
23,933
1,235
365,542
389,921
3,885
393,806
Share-based compensation - - - 6,290 - - - - 6,290 - 6,290
Issue of shares 3,508 - - (174) - - - - 3,334 - 3,334
Treasury shares re-issued - 8,834 - (6,322) - - - (2,085) 427 - 427
Lapse of share options - - - (814) - - - 814 - - -
Dividends - - - - - - - (386,367) (386,367) (7) (386,374)
Acquisition of additional interest in a subsidiary
-
-
-
-
-
-
-
(3,264)
(3,264)
(591)
(3,855)
Capital contribution by non-controlling interests
- - - - - - - - - 4,845 4,845
Balance as at August 31, 2012
502,992
(2,190)
2,005
24,409
(6,434)
324,711
(2,367)
1,399,220
2,242,346
82,716
2,325,062

9
Statements of Changes in Total Equity for the Year ended August 31, 2012 (cont’d) (a) Group (cont’d)
Attributable to Shareholders of the Company
Share
Capital
Treasury Shares
Capital
Reserve
Share-based Compensation
Reserve
Hedging Reserve
Fair Value
Reserve
Currency Translation
Reserve
Retained Profits
Total
Non-controlling Interests
Total
Equity S$’000 S$’000 S$’000 S$’000 S$’000 S$’000 S$’000 S$’000 S$’000 S$’000 S$’000
Balance as at September 1, 2010
494,738
(19,921)
2,005
26,817
(11,912)
265,276
(501)
1,469,780
2,226,282
79,744
2,306,026
Total comprehensive income/(loss) for the year
-
-
-
-
6,267
35,502
(3,101)
388,575
427,243
(5,142)
422,101
Share-based compensation - - - 7,748 - - - - 7,748 - 7,748
Issue of shares 4,746 - - (303) - - - - 4,443 - 4,443
Treasury shares re-issued - 8,897 - (8,272) - - - (400) 225 - 225
Lapse of share options - - - (561) - - - 561 - - -
Dividends - - - - - - - (433,939) (433,939) (15) (433,954)
Disposal of interest in a subsidiary
-
-
-
-
-
-
-
3
3
(3)
-
Balance as at August 31, 2011
499,484
(11,024)
2,005
25,429
(5,645)
300,778
(3,602)
1,424,580
2,232,005
74,584
2,306,589

10
Statements of Changes in Total Equity for the Year ended August 31, 2012 (cont’d)
(b) Company
Share Capital
Treasury Shares
Share-based Compensation
Reserve
Hedging Reserve
Fair Value
Reserve
Retained Profits
Total
Equity S$’000 S$’000 S$’000 S$’000 S$’000 S$’000 S$’000
Balance as at September 1, 2011
499,484 (11,024) 25,429 (316) 34,373 714,614 1,262,560
Total comprehensive income/(loss) for the year - - - (240) 9,554 290,601 299,915
Share-based compensation - - 6,290 - - - 6,290
Issue of shares 3,508 - (174) - - - 3,334
Treasury shares re-issued - 8,834 (6,322) - - (2,085) 427
Lapse of share options - - (814) - - 814 -
Dividends - - - - - (386,367) (386,367)
Balance as at August 31, 2012 502,992 (2,190) 24,409 (556) 43,927 617,577 1,186,159
Balance as at September 1, 2010
494,738 (19,921) 26,817 (1,952) 29,216 722,000 1,250,898
Total comprehensive income for the year - - - 1,636 5,157 426,392 433,185
Share-based compensation - - 7,748 - - - 7,748
Issue of shares 4,746 - (303) - - - 4,443
Treasury shares re-issued - 8,897 (8,272) - - (400) 225
Lapse of share options - - (561) - - 561 -
Dividends - - - - - (433,939) (433,939)
Balance as at August 31, 2011 499,484 (11,024) 25,429 (316) 34,373 714,614 1,262,560
11
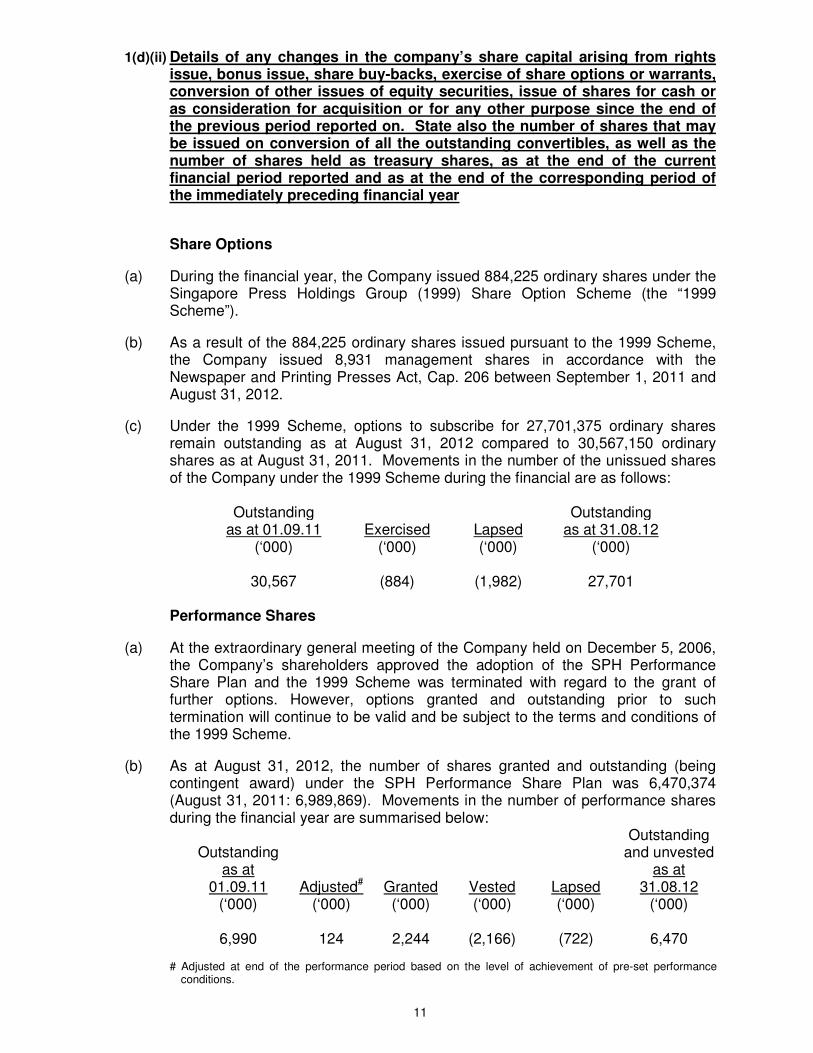
1(d)(ii) Details of any changes in the company’s share capital arising from rights issue, bonus issue, share buy-backs, exercise of share options or warrants, conversion of other issues of equity securities, issue of shares for cash or as consideration for acquisition or for any other purpose since the end of the previous period reported on. State also the number of shares that may be issued on conversion of all the outstanding convertibles, as well as the number of shares held as treasury shares, as at the end of the current financial period reported and as at the end of the corresponding period of the immediately preceding financial year
Share Options
(a) During the financial year, the Company issued 884,225 ordinary shares under the Singapore Press Holdings Group (1999) Share Option Scheme (the “1999 Scheme”).
(b) As a result of the 884,225 ordinary shares issued pursuant to the 1999 Scheme, the Company issued 8,931 management shares in accordance with the Newspaper and Printing Presses Act, Cap. 206 between September 1, 2011 and August 31, 2012.
(c) Under the 1999 Scheme, options to subscribe for 27,701,375 ordinary shares remain outstanding as at August 31, 2012 compared to 30,567,150 ordinary shares as at August 31, 2011. Movements in the number of the unissued shares of the Company under the 1999 Scheme during the financial are as follows:
Outstanding
as at 01.09.11 Exercised Lapsed Outstanding
as at 31.08.12 (‘000) (‘000) (‘000) (‘000)
30,567 (884) (1,982) 27,701
Performance Shares
(a) At the extraordinary general meeting of the Company held on December 5, 2006, the Company’s shareholders approved the adoption of the SPH Performance Share Plan and the 1999 Scheme was terminated with regard to the grant of further options. However, options granted and outstanding prior to such termination will continue to be valid and be subject to the terms and conditions of the 1999 Scheme.
(b) As at August 31, 2012, the number of shares granted and outstanding (being contingent award) under the SPH Performance Share Plan was 6,470,374 (August 31, 2011: 6,989,869). Movements in the number of performance shares during the financial year are summarised below:
Outstanding as at
01.09.11
Adjusted#
Granted
Vested Lapsed
Outstanding and unvested
as at 31.08.12
(‘000) (‘000) (‘000) (‘000) (‘000) (‘000)
6,990 124 2,244 (2,166) (722) 6,470 # Adjusted at end of the performance period based on the level of achievement of pre-set performance
conditions.
12
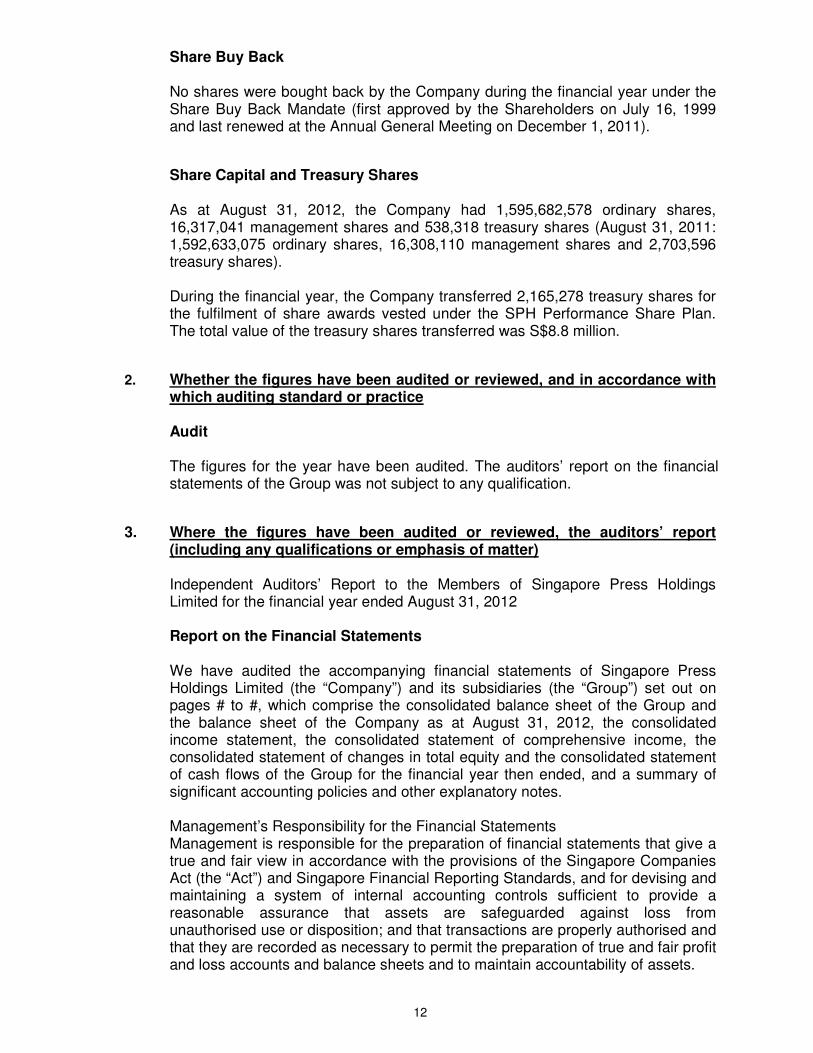
Share Buy Back No shares were bought back by the Company during the financial year under the
Share Buy Back Mandate (first approved by the Shareholders on July 16, 1999 and last renewed at the Annual General Meeting on December 1, 2011).
Share Capital and Treasury Shares
As at August 31, 2012, the Company had 1,595,682,578 ordinary shares, 16,317,041 management shares and 538,318 treasury shares (August 31, 2011: 1,592,633,075 ordinary shares, 16,308,110 management shares and 2,703,596 treasury shares). During the financial year, the Company transferred 2,165,278 treasury shares for the fulfilment of share awards vested under the SPH Performance Share Plan. The total value of the treasury shares transferred was S$8.8 million.
2. Whether the figures have been audited or reviewed, and in accordance with
which auditing standard or practice
Audit The figures for the year have been audited. The auditors’ report on the financial statements of the Group was not subject to any qualification.
3. Where the figures have been audited or reviewed, the auditors’ report
(including any qualifications or emphasis of matter)
Independent Auditors’ Report to the Members of Singapore Press Holdings Limited for the financial year ended August 31, 2012
Report on the Financial Statements
We have audited the accompanying financial statements of Singapore Press Holdings Limited (the “Company”) and its subsidiaries (the “Group”) set out on pages # to #, which comprise the consolidated balance sheet of the Group and the balance sheet of the Company as at August 31, 2012, the consolidated income statement, the consolidated statement of comprehensive income, the consolidated statement of changes in total equity and the consolidated statement of cash flows of the Group for the financial year then ended, and a summary of significant accounting policies and other explanatory notes.
Management’s Responsibility for the Financial Statements Management is responsible for the preparation of financial statements that give a true and fair view in accordance with the provisions of the Singapore Companies Act (the “Act”) and Singapore Financial Reporting Standards, and for devising and maintaining a system of internal accounting controls sufficient to provide a reasonable assurance that assets are safeguarded against loss from unauthorised use or disposition; and that transactions are properly authorised and that they are recorded as necessary to permit the preparation of true and fair profit and loss accounts and balance sheets and to maintain accountability of assets.

13
Auditors’ Responsibility Our responsibility is to express an opinion on these financial statements based on our audit. We conducted our audit in accordance with Singapore Standards on Auditing. Those Standards require that we comply with ethical requirements and plan and perform the audit to obtain reasonable assurance about whether the financial statements are free from material misstatement. An audit involves performing procedures to obtain audit evidence about the amounts and disclosures in the financial statements. The procedures selected depend on the auditor’s judgement, including the assessment of the risks of material misstatement of the financial statements, whether due to fraud or error. In making those risk assessments, the auditor considers internal control relevant to the entity’s preparation of financial statements that give a true and fair view in order to design audit procedures that are appropriate in the circumstances, but not for the purpose of expressing an opinion on the effectiveness of the entity’s internal control. An audit also includes evaluating the appropriateness of accounting policies used and the reasonableness of accounting estimates made by management, as well as evaluating the overall presentation of the financial statements. We believe that the audit evidence we have obtained is sufficient and appropriate to provide a basis for our audit opinion. Opinion In our opinion, the consolidated financial statements of the Group and the balance sheet of the Company are properly drawn up in accordance with the provisions of the Act and Singapore Financial Reporting Standards so as to give a true and fair view of the state of affairs of the Group and of the Company as at August 31, 2012, and of the results, changes in equity and cash flows of the Group for the financial year ended on that date. Report on Other Legal and Regulatory Requirements In our opinion, the accounting and other records required by the Act to be kept by the Company and by those subsidiaries incorporated in Singapore of which we are the auditors, have been properly kept in accordance with the provisions of the Act. ...........................……......….... PricewaterhouseCoopers LLP Public Accountants and Certified Public Accountants Singapore, October 12, 2012
# The page numbers are as stated in the Independent Auditors’ Report dated October 12, 2012 in the Singapore Press Holdings Annual Report 2012.
14
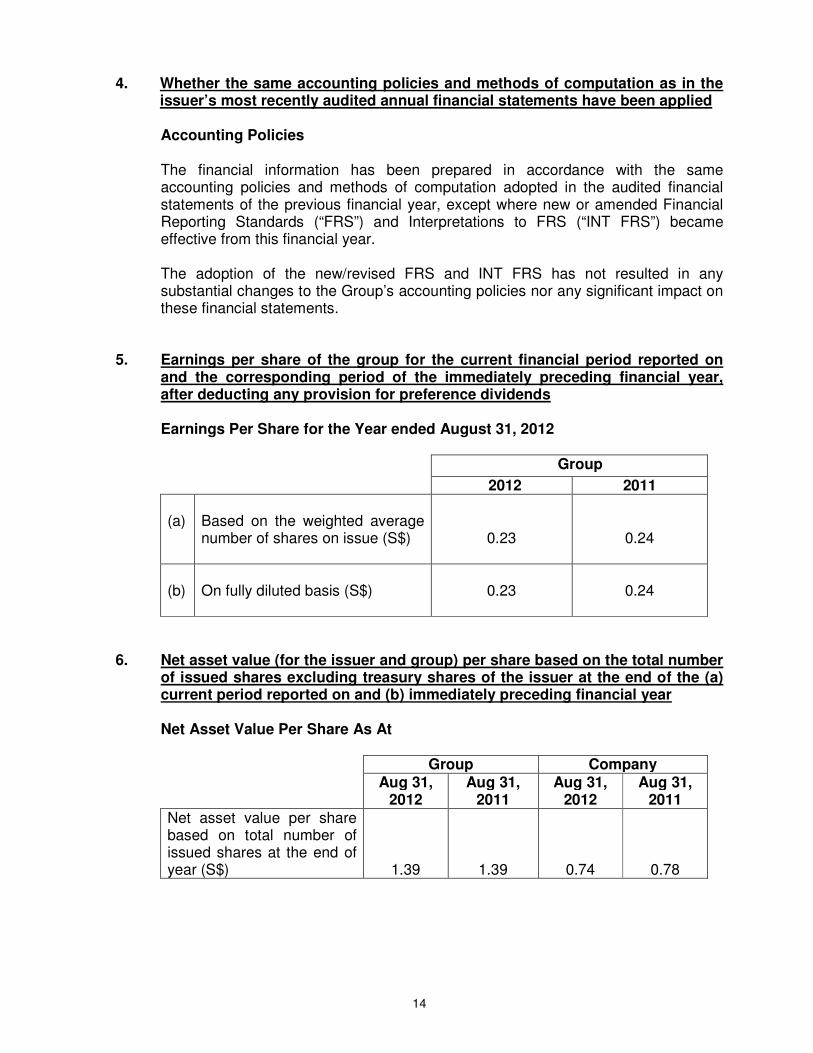
4. Whether the same accounting policies and methods of computation as in the
issuer’s most recently audited annual financial statements have been applied
Accounting Policies The financial information has been prepared in accordance with the same accounting policies and methods of computation adopted in the audited financial statements of the previous financial year, except where new or amended Financial Reporting Standards (“FRS”) and Interpretations to FRS (“INT FRS”) became effective from this financial year. The adoption of the new/revised FRS and INT FRS has not resulted in any substantial changes to the Group’s accounting policies nor any significant impact on these financial statements.
5. Earnings per share of the group for the current financial period reported on and the corresponding period of the immediately preceding financial year, after deducting any provision for preference dividends
Earnings Per Share for the Year ended August 31, 2012
Group
2012 2011 (a)
Based on the weighted average number of shares on issue (S$)
0.23
0.24
(b)
On fully diluted basis (S$)
0.23
0.24
6. Net asset value (for the issuer and group) per share based on the total number
of issued shares excluding treasury shares of the issuer at the end of the (a) current period reported on and (b) immediately preceding financial year
Net Asset Value Per Share As At
Group Company Aug 31,
2012 Aug 31,
2011 Aug 31,
2012 Aug 31,
2011 Net asset value per share based on total number of issued shares at the end of year (S$)
1.39
1.39
0.74
0.78
15
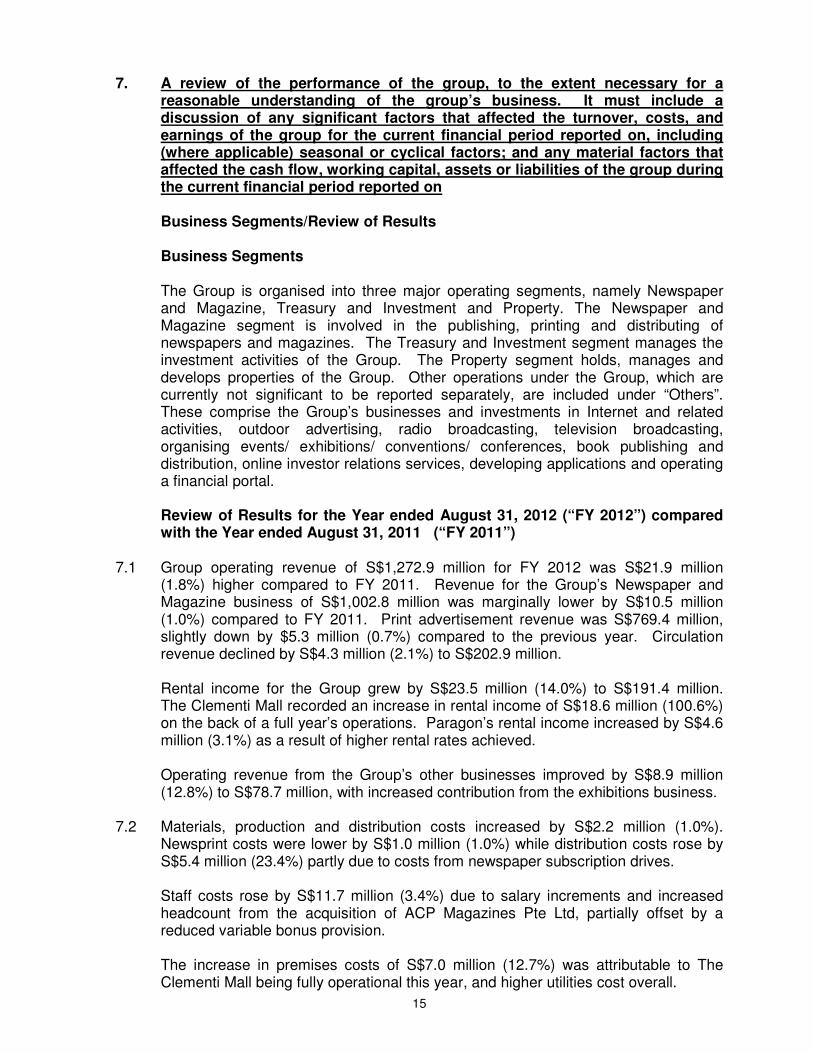
7. A review of the performance of the group, to the extent necessary for a
reasonable understanding of the group’s business. It must include a discussion of any significant factors that affected the turnover, costs, and earnings of the group for the current financial period reported on, including (where applicable) seasonal or cyclical factors; and any material factors that affected the cash flow, working capital, assets or liabilities of the group during the current financial period reported on
Business Segments/Review of Results
Business Segments The Group is organised into three major operating segments, namely Newspaper
and Magazine, Treasury and Investment and Property. The Newspaper and Magazine segment is involved in the publishing, printing and distributing of newspapers and magazines. The Treasury and Investment segment manages the investment activities of the Group. The Property segment holds, manages and develops properties of the Group. Other operations under the Group, which are currently not significant to be reported separately, are included under “Others”. These comprise the Group’s businesses and investments in Internet and related activities, outdoor advertising, radio broadcasting, television broadcasting, organising events/ exhibitions/ conventions/ conferences, book publishing and distribution, online investor relations services, developing applications and operating a financial portal.
Review of Results for the Year ended August 31, 2012 (“FY 2012”) compared
with the Year ended August 31, 2011 (“FY 2011”) 7.1 Group operating revenue of S$1,272.9 million for FY 2012 was S$21.9 million
(1.8%) higher compared to FY 2011. Revenue for the Group’s Newspaper and Magazine business of S$1,002.8 million was marginally lower by S$10.5 million (1.0%) compared to FY 2011. Print advertisement revenue was S$769.4 million, slightly down by $5.3 million (0.7%) compared to the previous year. Circulation revenue declined by S$4.3 million (2.1%) to S$202.9 million.
Rental income for the Group grew by S$23.5 million (14.0%) to S$191.4 million. The Clementi Mall recorded an increase in rental income of S$18.6 million (100.6%) on the back of a full year’s operations. Paragon’s rental income increased by S$4.6 million (3.1%) as a result of higher rental rates achieved.
Operating revenue from the Group’s other businesses improved by S$8.9 million (12.8%) to S$78.7 million, with increased contribution from the exhibitions business.
7.2 Materials, production and distribution costs increased by S$2.2 million (1.0%).
Newsprint costs were lower by S$1.0 million (1.0%) while distribution costs rose by S$5.4 million (23.4%) partly due to costs from newspaper subscription drives. Staff costs rose by S$11.7 million (3.4%) due to salary increments and increased headcount from the acquisition of ACP Magazines Pte Ltd, partially offset by a reduced variable bonus provision. The increase in premises costs of S$7.0 million (12.7%) was attributable to The Clementi Mall being fully operational this year, and higher utilities cost overall.

16
Other operating expenses rose by S$14.8 million (12.1%) due to step-up in overheads in tandem with increased business activities and inflationary pressures. Finance costs fell by S$15.4 million (38.6%) due to reduced average level of borrowings coupled with lower interest rates.
7.3 Consequently, the Group’s recurring earnings of S$410.2 million for FY 2012 was S$1.2 million (0.3%) higher compared to FY 2011.
7.4 Investment income fell by S$17.8 million (35.3%) to S$32.6 million due to mark-to-
market losses arising from volatility in foreign exchange rates, and lower dividend and interest income.
7.5 The Group’s share of results of associates and jointly-controlled entities included
results from its stakes in MediaCorp Press and MediaCorp TV Holdings, OpenNet, and its other media investments.
7.6 Taxation charge of S$72.3 million was arrived at after accounting for tax on the
taxable income at the corporate tax rate of 17%. This included an amount of S$2.1 million for over-provision of taxation in respect of prior years.
7.7 Overall, net profit attributable to shareholders was S$365.5 million, lower by S$23.0
million (5.9%) compared to FY 2011. 8. Where a forecast, or a prospect statement, has been previously disclosed to
shareholders, any variance between it and the actual results
No forecast was made previously.
9. A commentary at the date of announcement of the significant trends and competitive conditions of the industry in which the group operates and any known factors or events that may affect the group in the next reporting period and the next 12 months
9.1 Against the backdrop of a challenging global economic environment, the near-term
economic growth in Singapore is expected to remain modest. The Group’s print advertisement revenue will continue to move in tandem with the performance of the Singapore domestic economy.
9.2 Newsprint charge-out rate is expected to remain marginally unchanged with
newsprint prices holding steady taking into account demand and supply considerations.
9.3 The Group’s retail properties, Paragon and The Clementi Mall, are fully leased and continue to turn in a steady performance. The development of Seletar Mall is in progress and is expected to be completed at the end of 2014.
9.4 Amidst the ensuing economic uncertainties, the Group’s investment portfolio allocation remains conservative and returns are expected to be commensurate with a lower risk-return profile.
17
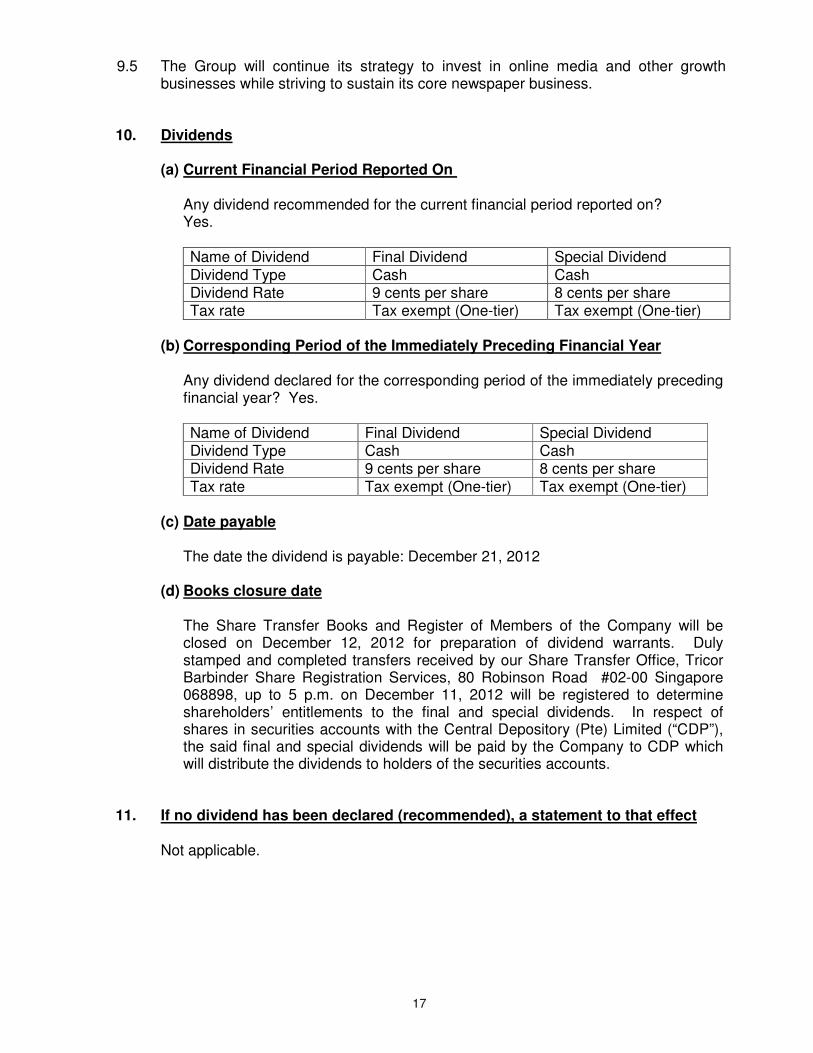
9.5 The Group will continue its strategy to invest in online media and other growth businesses while striving to sustain its core newspaper business.
10. Dividends
(a) Current Financial Period Reported On
Any dividend recommended for the current financial period reported on? Yes.
Name of Dividend Final Dividend Special Dividend Dividend Type Cash Cash Dividend Rate 9 cents per share 8 cents per share Tax rate Tax exempt (One-tier) Tax exempt (One-tier)
(b) Corresponding Period of the Immediately Preceding Financial Year
Any dividend declared for the corresponding period of the immediately preceding financial year? Yes.
Name of Dividend Final Dividend Special Dividend Dividend Type Cash Cash Dividend Rate 9 cents per share 8 cents per share Tax rate Tax exempt (One-tier) Tax exempt (One-tier)
(c) Date payable
The date the dividend is payable: December 21, 2012 (d) Books closure date
The Share Transfer Books and Register of Members of the Company will be closed on December 12, 2012 for preparation of dividend warrants. Duly stamped and completed transfers received by our Share Transfer Office, Tricor Barbinder Share Registration Services, 80 Robinson Road #02-00 Singapore 068898, up to 5 p.m. on December 11, 2012 will be registered to determine shareholders’ entitlements to the final and special dividends. In respect of shares in securities accounts with the Central Depository (Pte) Limited (“CDP”), the said final and special dividends will be paid by the Company to CDP which will distribute the dividends to holders of the securities accounts.
11. If no dividend has been declared (recommended), a statement to that effect
Not applicable.

18
12. Segmental revenue and results for business or geographical segments (of the group) in the form presented in the issuer’s most recently audited annual financial statements, with comparative information for the immediately preceding year
Group Segmental Information 2012 Newspaper Treasury and and Magazine Investment Property Others Eliminations Consolidated S$’000 S$’000 S$’000 S$’000 S$’000 S$’000
Operating revenue External sales 1,002,762 - 191,421 78,730 - 1,272,913 Inter-segmental sales 5,126 - 1,984 1,983 (9,093) - ___________ _________ __________ _________ ________ _____________
Total operating revenue 1,007,888 - 193,405 80,713 (9,093) 1,272,913 ___________ _________ __________ _________ ________ _____________
Result
Segment result 330,552 31,587 123,704 (18,945) - 466,898 Finance costs (42) (469) (23,931) (10) - (24,452) Interest income 107 - 197 82 - 386 Share of profits/(losses) of associates and jointly- controlled entities 4,506 - - (5,678) - (1,172) ___________ _________ __________ _________ ________ _____________
Profit/(loss) before taxation 335,123 31,118 99,970 (24,551) - 441,660 Taxation (72,302) _____________
Profit after taxation 369,358 Non-controlling interests (3,816)
_____________
Profit attributable to shareholders 365,542
_____________
Other information ___________ ___________ ____________ _________ ________ _____________
Segment assets 657,523 1,001,544 2,267,888 130,290 - 4,057,245 ___________ ____________ ____________ _________ ________ _____________
Segment assets includes: Investments in associates/ jointly-controlled entities 36,611 - - 58,073 - 94,684 Additions to:
- property, plant and equipment 21,540 - 873 5,091 - 27,504 - investment properties - - 353,436 - - 353,436 - intangible assets 56,950 - - 200 - 57,150
___________ ___________ ____________ _________ ________ _____________
Segment liabilities 202,091 284 1,369,207 31,518 - 1,603,100 ___________ ____________ ____________ _________ ________
Current income tax liabilities 81,856 Deferred income tax liabilities 47,227
_____________
Consolidated total liabilities 1,732,183 _____________
Depreciation 44,175 - 29,964 4,065 - 78,204 Amortisation of intangible assets 2,482 - - 5,196 - 7,678 Impairment of property, plant and equipment 5 - - 79 - 84 Reversal of impairment of property, plant and equipment (849) - - - - (849) Allowance for impairment of intangibles assets - - - 481 - 481

19
Group Segmental Information (cont’d) 2011
Newspaper Treasury and and Magazine Investment Property Others Eliminations Consolidated S$’000 S$’000 S$’000 S$’000 S$’000 S$’000 Operating revenue External sales 1,013,285 - 167,884 69,803 - 1,250,972 Inter-segmental sales 4,336 - 1,875 1,507 (7,718) - ___________ _________ __________ _________ ________ _____________
Total operating revenue 1,017,621 - 169,759 71,310 (7,718) 1,250,972 ___________ _________ __________ _________ ________ _____________
Result Segment result 361,603 49,477 107,264 (19,595) - 498,749 Finance costs - (7,863) (31,938) (10) - (39,811) Interest income 106 - 240 105 - 451 Share of profits/(losses) of associates and jointly- controlled entities 3,894 - - (6,601) - (2,707) ___________ _________ __________ _________ ________ _____________
Profit/(loss) before taxation 365,603 41,614 75,566 (26,101) - 456,682 Taxation (72,931) _____________
Profit after taxation 383,751 Non-controlling interests 4,824
_____________
Profit attributable to shareholders 388,575
_____________
Other information ___________ ___________ ____________ _________ ________ _____________
Segment assets 642,415 1,275,198 1,841,897 129,264 - 3,888,774 ___________ ____________ ____________ _________ ________ _____________
Segment assets includes: Investments in associates/ jointly-controlled entities 38,714 - - 44,025 - 82,739 Additions to:
- property, plant and equipment 25,811 - 496 1,141 - 27,448 - investment properties - - 40,083 - - 40,083 - intangible assets - - - 43,570 - 43,570
___________ ___________ ____________ _________ ________ _____________
Segment liabilities 208,786 100,060 1,098,329 36,041 - 1,443,216 ___________ ____________ ____________ _________ ________
Current income tax liabilities 89,488 Deferred income tax liabilities 49,481
_____________
Consolidated total liabilities 1,582,185 _____________
Depreciation 54,260 - 16,323 6,202 - 76,785 Amortisation of intangible assets 1,019 - - 4,693 - 5,712 Impairment of property, plant and equipment - - - 1,513 - 1,513 Reversal of impairment of property, plant and equipment (1,609) - - - - (1,609) Impairment of goodwill 1,134 - - - - 1,134 Impairment of investments - 4,714 - - - 4,714

20
Notes: (a) Geographical segments: The principal geographical area in which the Group operates
is Singapore. The Group’s overseas operations comprise mainly publishing and distributing magazines, holding overseas investments, providing marketing and editorial services and providing online search, directories and classified services.
Operating revenue Non-current assets Total assets
2012 2011 2012 2011 2012 2011
S$’000 S$’000 S$’000 S$’000 S$’000 S$’000
Singapore 1,232,503 1,213,780 3,015,032 2,644,444 3,986,321 3,836,152
Other countries 40,410 37,192 49,342 34,870 70,924 52,622
1,272,913 1,250,972 3,064,374 2,679,314 4,057,245 3,888,774
13. In the review of performance, the factors leading to any material changes in
contributions to turnover and earnings by the business or geographical segments
Refer to paragraph 7.
14. Breakdown of Sales
Group 2012 2011 Change S$’000 S$’000 % (a) Operating revenue reported for first half year 630,857 606,537 4.0 (b) Profit after tax before deducting non-controlling
interests reported for the first half year
181,411
173,562
4.5 (c) Operating revenue reported for second half year 642,056 644,435 (0.4) (d) Profit after tax before deducting non-controlling
interests reported for the second half year
187,947
210,189
(10.6)
15. A breakdown of the total annual dividend (in dollar value) for the issuer’s latest
full year and its previous full year as follows:-
Total Net Annual Dividend 2012 2011
S$’000 S$’000
Ordinary 386,787 386,174
Preference - -
Total 386,787 386,174
The amount of S$386,787,000 (Last year: S$386,174,000) included S$3,916,000 (Last year: S$3,914,000) for management shares.
* This may be increased depending on the number of issued shares existing as at the books closure date on December 12, 2012.
21
16. If the group has obtained a general mandate from shareholders for Interested Person Transactions, the aggregate value of such transactions as required under Rule 920(1)(a)(ii). If no IPT mandate has been obtained, a statement to that effect. The Company has not obtained a general mandate from shareholders for Interested Person Transactions. There were no interested person transactions for the year under review.
17. Disclosure of person occupying a managerial position in the issuer or any of its principal subsidiaries who is a relative of a director or chief executive office or substantial shareholder of the issuer pursuant to Rule 704(13). If there are no such persons, the issuer must make an appropriate negative statement.
The Company confirms that there is no person occupying a managerial position in the Company who is related to a director, chief executive officer or substantial shareholder of the Company.
BY ORDER OF THE BOARD Ginney Lim May Ling Khor Siew Kim Company Secretaries Singapore, October 12, 2012