Singapore Industry Industry Focus Singapore Rigbuilders Singapore Industry Industry Focus Singapore...
34
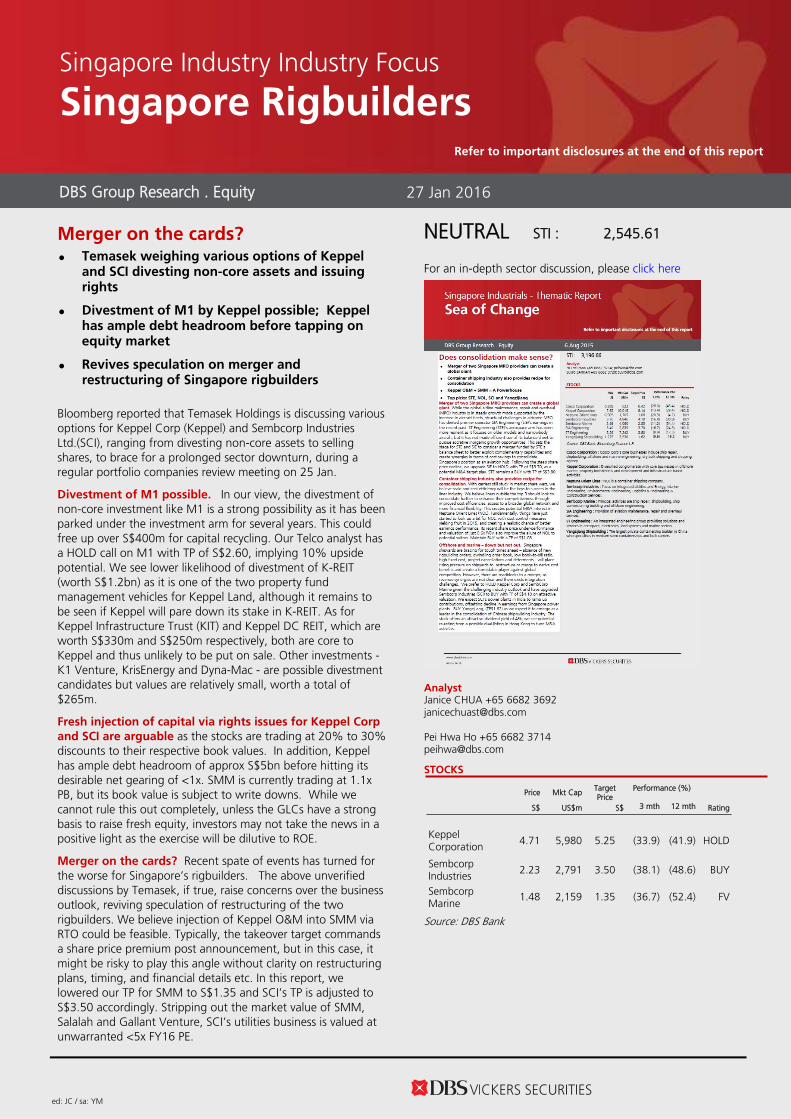
ed: JC / sa: YM NEUTRAL STI : 2,545.61 For an in-depth sector discussion, please click here Analyst Janice CHUA +65 6682 3692 [email protected] Pei Hwa Ho +65 6682 3714 [email protected] STOCKS Source: DBS Bank DBS Group Research . Equity 27 Jan 2016 Singapore Industry Industry Focus Singapore Rigbuilders Refer to important disclosures at the end of this report Merger on the cards? Temasek weighing various options of Keppel and SCI divesting non-core assets and issuing rights Divestment of M1 by Keppel possible; Keppel has ample debt headroom before tapping on equity market Revives speculation on merger and restructuring of Singapore rigbuilders Bloomberg reported that Temasek Holdings is discussing various options for Keppel Corp (Keppel) and Sembcorp Industries Ltd.(SCI), ranging from divesting non-core assets to selling shares, to brace for a prolonged sector downturn, during a regular portfolio companies review meeting on 25 Jan. Divestment of M1 possible. In our view, the divestment of non-core investment like M1 is a strong possibility as it has been parked under the investment arm for several years. This could free up over S$400m for capital recycling. Our Telco analyst has a HOLD call on M1 with TP of S$2.60, implying 10% upside potential. We see lower likelihood of divestment of K-REIT (worth S$1.2bn) as it is one of the two property fund management vehicles for Keppel Land, although it remains to be seen if Keppel will pare down its stake in K-REIT. As for Keppel Infrastructure Trust (KIT) and Keppel DC REIT, which are worth S$330m and S$250m respectively, both are core to Keppel and thus unlikely to be put on sale. Other investments - K1 Venture, KrisEnergy and Dyna-Mac - are possible divestment candidates but values are relatively small, worth a total of $265m. Fresh injection of capital via rights issues for Keppel Corp and SCI are arguable as the stocks are trading at 20% to 30% discounts to their respective book values. In addition, Keppel has ample debt headroom of approx S$5bn before hitting its desirable net gearing of <1x. SMM is currently trading at 1.1x PB, but its book value is subject to write downs. While we cannot rule this out completely, unless the GLCs have a strong basis to raise fresh equity, investors may not take the news in a positive light as the exercise will be dilutive to ROE. Merger on the cards? Recent spate of events has turned for the worse for Singapore’s rigbuilders. The above unverified discussions by Temasek, if true, raise concerns over the business outlook, reviving speculation of restructuring of the two rigbuilders. We believe injection of Keppel O&M into SMM via RTO could be feasible. Typically, the takeover target commands a share price premium post announcement, but in this case, it might be risky to play this angle without clarity on restructuring plans, timing, and financial details etc. In this report, we lowered our TP for SMM to S$1.35 and SCI’s TP is adjusted to S$3.50 accordingly. Stripping out the market value of SMM, Salalah and Gallant Venture, SCI’s utilities business is valued at unwarranted <5x FY16 PE. Price Mkt Cap Target Price Performance (%) S$ US$m S$ 3 mth 12 mth Rating Keppel Corporation 4.71 5,980 5.25 (33.9) (41.9) HOLD Sembcorp Industries 2.23 2,791 3.50 (38.1) (48.6) BUY Sembcorp Marine 1.48 2,159 1.35 (36.7) (52.4) FV
Transcript of Singapore Industry Industry Focus Singapore Rigbuilders Singapore Industry Industry Focus Singapore...
ed: JC / sa: YM
NEUTRAL STI : 2,545.61
For an in-depth sector discussion, please click here
Analyst Janice CHUA +65 6682 3692 [email protected]
Pei Hwa Ho +65 6682 3714 [email protected]
STOCKS
Source: DBS Bank
DBS Group Research . Equity 27 Jan 2016
Singapore Industry Industry Focus
Singapore Rigbuilders Refer to important disclosures at the end of this report
Merger on the cards? Temasek weighing various options of Keppel
and SCI divesting non-core assets and issuing rights
Divestment of M1 by Keppel possible; Keppel has ample debt headroom before tapping on equity market
Revives speculation on merger and restructuring of Singapore rigbuilders
Bloomberg reported that Temasek Holdings is discussing various options for Keppel Corp (Keppel) and Sembcorp Industries Ltd.(SCI), ranging from divesting non-core assets to selling shares, to brace for a prolonged sector downturn, during a regular portfolio companies review meeting on 25 Jan.
Divestment of M1 possible. In our view, the divestment of non-core investment like M1 is a strong possibility as it has been parked under the investment arm for several years. This could free up over S$400m for capital recycling. Our Telco analyst has a HOLD call on M1 with TP of S$2.60, implying 10% upside potential. We see lower likelihood of divestment of K-REIT (worth S$1.2bn) as it is one of the two property fund management vehicles for Keppel Land, although it remains to be seen if Keppel will pare down its stake in K-REIT. As for Keppel Infrastructure Trust (KIT) and Keppel DC REIT, which are worth S$330m and S$250m respectively, both are core to Keppel and thus unlikely to be put on sale. Other investments - K1 Venture, KrisEnergy and Dyna-Mac - are possible divestment candidates but values are relatively small, worth a total of $265m.
Fresh injection of capital via rights issues for Keppel Corp
and SCI are arguable as the stocks are trading at 20% to 30% discounts to their respective book values. In addition, Keppel has ample debt headroom of approx S$5bn before hitting its desirable net gearing of <1x. SMM is currently trading at 1.1x PB, but its book value is subject to write downs. While we cannot rule this out completely, unless the GLCs have a strong basis to raise fresh equity, investors may not take the news in a positive light as the exercise will be dilutive to ROE.
Merger on the cards? Recent spate of events has turned for the worse for Singapore’s rigbuilders. The above unverified discussions by Temasek, if true, raise concerns over the business outlook, reviving speculation of restructuring of the two rigbuilders. We believe injection of Keppel O&M into SMM via RTO could be feasible. Typically, the takeover target commands a share price premium post announcement, but in this case, it might be risky to play this angle without clarity on restructuring plans, timing, and financial details etc. In this report, we lowered our TP for SMM to S$1.35 and SCI’s TP is adjusted to S$3.50 accordingly. Stripping out the market value of SMM, Salalah and Gallant Venture, SCI’s utilities business is valued at unwarranted <5x FY16 PE.
Price Mkt Cap Target Price
Performance (%)
S$ US$m S$ 3 mth 12 mth Rating
Keppel Corporation 4.71 5,980 5.25 (33.9) (41.9) HOLD
Sembcorp Industries 2.23 2,791 3.50 (38.1) (48.6) BUY
Sembcorp Marine
1.48 2,159 1.35 (36.7) (52.4) FV

Industry Industry Focus
Singapore Rigbuilders
Page 2
Temasek could be stepping in to prepare for longer winter Bloomberg reported that Temasek Holdings is discussing options for its 21%-owned Keppel and 49.5%-owned SCI, ranging from divesting their non-core assets to selling shares, to brace for a prolonged sector downturn. Divestment possibilities revolve around Keppel selling its 19.1% stake in wireless operator M1 Ltd. and paring its 44.6% interest in office landlord Keppel REIT. Temasek is said to be also weighing the possibility of Keppel and SCI selling stock through rights offerings. The topic was brought up during a regular Temasek meeting to review its portfolio companies on 25 Jan, and to focus on how Temasek can preserve the value of its investments amid a downturn in the oil-rig sector, which will be shared with the two companies’ boards. Divestment of M1 by Keppel possible. In our view, the divestment of Keppel’s non-core investment like M1 is a strong possibility as it has been parked under the investment arm for several years. Divestment of M1 could free up over S$400m for capital recycling. Our Telco analyst has a HOLD call on M1
with TP of S$2.60 implying 10% upside potential.
We see lower likelihood of divestment in K-REIT (worth S$1.2bn) as it is one of the two property fund management vehicles for Keppel Land. As for the other significant key holdings - KIT and Keppel DC REIT - which are worth S$330m and S$250m respectively, both are core to Keppel or are its growth engines, thus unlikely to be put on sale. Other investments, such as K1 Venture, KrisEnergy and Dyna-Mac are possible but the market value is insignificant and stock prices for KrisEnergy and Dyna-Mac have also plunged amid the oil crisis.
Keppel’s main holdings
Market cap (S$ m)
Keppel's stake
Keppel's share (S$ m)
Keppel REIT 2,703 45% 1,206 M1 2,223 19% 422 KIT 1,813 18% 330 Keppel DC REIT 852 30% 256 K1Venture 386 36% 139 KrisEnergy 230 40% 92 Dyna-Mac 137 25% 34
Source: Bloomberg Finance L.P., Companies SCI’s other businesses are immaterial. Total asset value for SCI’s other businesses (which are not classified under the three key pillars namely Utilities, Marine and Urban Development) - Singapore Mint (100%), Sembcorp Design and Construction (100%) and Shenzhen Chiwan Sembawang Engineering Co (32%) are probably only <S$100m, does not quite move the needle. In addition, the former two are handling largely government related projects. Fresh injection of capital via rights issues for Keppel Corp
and SCI are arguable as they are trading at 20% to 30% discounts to their respective book values. In addition, Keppel and SCI have ample debt headroom of approx S$5bn/ S$3bn before hitting their desirable net gearing of <1x. SMM is currently trading at 1.1x PB, but its book value is subject to write downs. While we cannot rule this out completely, unless the GLC has a strong basis to raise fresh equity, investors may not take the news in a positive light as the exercise will be dilutive to ROE. Ample debt headroom
Net gearing Est. debt headroom
Keppel 0.53x S$ 5.0bn SCI 0.55x S$ 2.9bn
Source: Companies, DBS Bank

Industry Industry Focus
Singapore Rigbuilders
Page 3
Recent spate of events has turned for the worse for
Singapore’s rigbuilders. The slump in oil prices to <US$30/bbl over the past month and possible bankruptcy of Sete Brasil have heightened the risks for Keppel and SMM. The unverified ‘Temasek’ discussion during a review meeting has raised the level of speculation of a potential restructuring between the three listed entities. There are a few possibilities: a) SCI privatizes SMM and merge it with Keppel. Less likely scenario as it involves fresh capital of S$1.4bn (assume 20% share price premium) for SCI to privatise SMM, given the possibility of a prolonged downcycle. b) Keppel injects O&M division into SMM via a reverse takeover. Keppel and SCI will jointly own SMM, which remains listed. Positives – Keppel’s shipyards in Tuas, Singapore is old while SMM has built a new world class shipyard in Tuas, having invested >S$1bn into the Singapore yard. This will lead to shrinkage in capacity once older yards at Keppel and SMM (Sembawang) are retired. The downturn in industry saw major retrenchments – Keppel laid off 25% of its direct and subcontract workers last year. A merger could lead to cost savings and combining the strengths of both Keppel Corp and SembMarine to consolidate its leadership position in the global playing field. Keppel O&M’s book value stood at S$1.4bn as of end 2015, down from S$1.8bn in 2014 partly due to S$230m provision for Sete Brasil projects in 4Q15. Stripping out the estimated market value for Property, Infrastructure and its holdings in listed entities, market is valuing Keppel O&M at 0.5x PB, a far cry from the 3-4x before this oil rout. Keppel O&M has empirically been valued at a premium over SMM due to its much higher ROE and market leadership. In our valuation, we have ascribed 2x PB for Keppel O&M, implying a valuation of S$2.6bn. This translates to 4x FY15 O&M PATMI, which has plunged almost 50% y-o-y.
Implied value of Keppel O&M
S$ m Basis Market capitalisation of Keppel 8,562 Market price @ 26 Jan Market value for listed holdings 1,098 Market price @ 26 Jan Est. market value for property 6,911 25% discount to NAV Est. market value for infrastructure
768 30% discount to NAV
Congolomerate discount 10% Implied market value for Keppel O&M
662
Implied valuation for Keppel O&M
0.48 PB valuation (x)
Source: Company, DBS Bank
SMM’s book value was around S$3.0bn as of end Sept-2015. Applying the AFC low of 0.9x, this translates to S$2.7bn or S$1.29 per share. This implies >10x FY15 PE. Given the expected provisions ahead, we expect downside to its book value. In our thematic report – Sea of Change dated 6, Aug 2015 (pg 28 to 35) - we had highlighted the need for a merger between the two yards, and examined the merits of a merger. Recommendation Maintain HOLD on Keppel. We maintain our HOLD call on Keppel with recently revised TP of S$5.25 post its FY15 results. Lowering TP for SMM. Given the worsening situation in Brazil, we are reducing our SMM valuation multiple to 0.9x FY16 PB (from 1.2x previously), in line with AFC low. TP for SMM is thus lowered to S$1.35. Maintain FULLY VALUED. SCI is too cheap to ignore. Target price for SCI is adjusted to S$3.50 following the change in SMM’s TP. Maintain BUY for SCI. Stripping out market value for SMM and holdings in Salalah and Galant Venture, utilities business is valued at an unwarranted <5x FY16 PE or approx S$2bn, given the stable nature of the business. We believe market has probably over-penalized SCI on speculation of a possible SMM privatization. Now it seems a more likely scenario could be the merger of Keppel O&M and SMM. Implied value of SCI’s Utilities
S$m SCI's market capitalisation 3,986 SCI's share of market capitalisation for: SMM 1,710 Salalah 323 Gallant Venture 66 Congolomerate discount 10% Implied value for Utilities 2,096 Implied FY16 PE for Utilities (x)
4.8
Source: Company, DBS Bank Our Telco analyst, Sachin Mittal has a HOLD call on M1 with
TP at S$2.60. This implies 10% upside from current level.

Industry Industry Focus
Singapore Rigbuilders
Page 4
RNAV valuation for Keppel
Source: Company, DBS Bank RNAV valuation for SCI
Source: Company, DBS Bank
V alue (S$ m)
Basis
Sembcorp Marine 1,710 Fair value for Sembcorp MarineGallant Ventures 66 Share priceSalalah 323 40% stake
2,100Less: book value of listed companies (2,035)Surplus f rom listed companies 65Utilities (Surplus) 961 Based on 11x FY16 PE, less book valueUrban Development (245) Based on 11x FY16 PE, less book value
Net Surplus 781Book value as of end FY14 6,268RNAV 7,049RNA V per share (S$) 3.92 F air v alue (S$) 3.50 10% conglomerate discount
V alue (S$ m) Met rics
Market v alue of listed ent it ies 1,161 Less: book value 757 Surplus f rom listed associates (1) 405
Surplus - Property (2) (1,212) 0.85x P/Bv, less book valueSurplus - Offshore/Marine (3) 1,357 2x P/BV, less book valueSurplus - Infrastructure (4) (287) 10x FY16 net profit, less book valueNet Surplus (L isted and unlisted ent it ies) (1+2+3+4 )
262
Add: Book value (less minorities) as of end FY15 10,381 RNA V 10,643
RNAV per share (S$) 5.83
F air v alue for KEP (S$) 5.25 10% conglomerate discount

Industry Industry Focus
Singapore Rigbuilders
Page 5
Appendix

Industry Industry Focus
Singapore Rigbuilders
Page 6
Appendix I - Keppel Corporation’s Group Structure
Source: Company
Appendix II – Sembcorp Industries’ Group Structure Source: Company
Appendix II – Sembcorp Industries’ Group Structure Source: Company, DBS Bank
Sembcorp Industries
Sembcorp Utilities Sembcorp Marine Sembcorp Development Other Businesses
Sembcorp Design and Construction
Shenzhen Chiwan Sembawang
Engineering Co
Singapore Precision Industries/ Singapore
Mint
100% 61.1% 100%
100%
32%
100%

Industry Industry Focus
Singapore Rigbuilders
Page 7
Company Guide

ASIAN INSIGHTS VICKERS SECURITIES ed: TH / sa: YM
HOLD Last Traded Price: S$4.71 (STI : 2,545.61) Price Target : S$5.25 (11% upside) Potential Catalyst: Sharp oil price recovery Where we differ: In line Analyst Janice CHUA +65 6682 3692 [email protected] Pei Hwa Ho +65 6682 3714 [email protected]
Price Relative
Forecasts and Valuation FY Dec (S$m) 2014A 2015A 2016F 2017F Revenue 13,283 10,296 8,576 8,846 EBITDA 3,155 2,280 1,953 1,999 Pre-tax Profit 2,889 1,997 1,551 1,569 Net Profit 1,885 1,525 1,204 1,217 Net Pft (Pre Ex.) 1,444 1,476 1,204 1,217 Net Pft Gth (Pre-ex) (%) 2.3 2.2 (18.5) 1.1 EPS (S cts) 104 83.9 66.2 67.0 EPS Pre Ex. (S cts) 79.4 81.2 66.2 67.0 EPS Gth Pre Ex (%) 2 2 (18) 1 Diluted EPS (S cts) 103 83.6 66.0 66.7 Net DPS (S cts) 47.9 33.9 26.5 26.8 BV Per Share (S cts) 571 610 643 683 PE (X) 4.5 5.6 7.1 7.0 PE Pre Ex. (X) 5.9 5.8 7.1 7.0 P/Cash Flow (X) 393.0 128.6 13.5 8.7 EV/EBITDA (X) 4.5 6.8 8.1 7.9 Net Div Yield (%) 10.2 7.2 5.6 5.7 P/Book Value (X) 0.8 0.8 0.7 0.7 Net Debt/Equity (X) 0.1 0.5 0.5 0.5 ROAE (%) 18.8 14.2 10.6 10.1 Earnings Rev (%): - - Consensus EPS (S cts): 69.2 67.2 Other Broker Recs: B: 5 S: 4 H: 12
Source of all data: Company, DBS Bank, Bloomberg Finance L.P
Bracing for a prolonged winter Reiterate HOLD with lower TP of S$5.25. While value has emerged after the violent sell-off in response to the Sete Brasil news, we prefer to monitor the development in Brazil and oil market before revisiting Keppel. Dividend yield remains decent at 5.5% despite reduction in payout ratio from 50% to a more sustainable 40%, still within their guidance of 40-50%. Our TP is lowered to S$5.25, largely attributable to lower valuation for O&M segment.
Offshore & Marine business weighing the group down. The uncertainty in Brazil is worrisome. The key shareholder of Sete Brasil has voted against the filing of bankruptcy protection and scheduled to meet again in mid-Feb to decide the fate of the company. O&M outlook is also plagued by the depressed oil prices. Rigbuilding is entering a prolonged cyclical downturn and competition is intensified. Keppel secured S$1.8bn non-rig new orders last year, a far cry from their usual S$4-6bn wins. As a result, orderbook dwindled to S$9bn, from S$12.5bn a year ago, implying declining top line and earnings ahead.
Property business is a mixed bag; infrastructure should bottom out. Keppel sold over 4,570 homes in FY15, with 72% from China alone, marking an improvement over the total of 2,400 sold in FY14. Management is optimistic of stronger home sales in 2016. For infrastructure, with the handover of both phases of the Greater Manchester EPC project and the Doha North sewage treatment project having incurred its final provision of just under S$200m in FY15, Keppel Infrastructure should see its profitability improve thereafter.
Valuation:
Our TP of S$5.25 is based on sum-of-parts : (1) O&M segment is valued at 2x P/BV, (2) infrastructure is valued at 10x PE on FY16 earnings, (3) Property segment is valued at 0.85x P/BV, and (4) market values/estimated fair values are used for listed subsidiaries.
Key Risks to Our View:
O&M segment could fare worse than expected. We forecast revenues from Keppel O&M falling to the ~S$5.4bn and S$5.8bn levels in FY15 and FY16 respectively, from S$7-8bn p.a. during FY12-14. The collapse of Sete Brasil and continued depletion of the orderbook, coupled with deferments, could pose downside risks to our forecast.
At A Glance Issued Capital (m shrs) 1,811 Mkt. Cap (S$m/US$m) 8,530 / 5,980 Major Shareholders Temasek Holdings Pte Ltd (%) 21.0 Blackrock (%) 6.0 Aberdeen (%) 5.8 Free Float (%) 67.2 3m Avg. Daily Val (US$m) 25.2 ICB Industry : Oil & Gas / Oil Equipment; Services & Dist
DBS Group Research . Equity 27 Jan 2016
Singapore Company Guide
Keppel Corporation Version 2 | Bloomberg: KEP SP | Reuters: KPLM.SI Refer to important disclosures at the end of this report
44
64
84
104
124
144
164
184
204
4.2
5.2
6.2
7.2
8.2
9.2
10.2
11.2
12.2
Jan-12 Jan-13 Jan-14 Jan-15 Jan-16
Relative IndexS$
Keppel Corporation (LHS) Relative STI INDEX (RHS)

ASIAN INSIGHTS VICKERS SECURITIES Page 9
Company Guide
Keppel Corporation
CRITICAL DATA POINTS TO WATCH
Earnings Drivers:
Orderbook the key driver of Keppel O&M’s earnings; FLNG provides potential upside. Keppel O&M secured S$1.8bn in order wins in FY15, dismal-looking compared to its 2010 and 2011 full-year peak of S$10.0bn. Meanwhile, a declining net orderbook means revenue recognition should be stretched over a longer period, impacting earnings. Weak order wins have resulted in Keppel being assailed on three fronts: i) an oversupply of rigs, particularly jackups, as we enter the peak of the rig delivery cycle; ii) low oil prices; and iii) competition from Chinese yards. Scrapping of old rigs (>30 years old), estimated to constitute ~15% of the current fleet, could help push the market back into balance. An oil price rebound would also improve rig utilisations, hence spurring capex spend and order wins. In terms of growth potential, Keppel’s first-mover advantage in the FLNG conversion market could provide earnings upside; customer Golar has already awarded a 3rd FLNG project. Residential home sales in China and Vietnam are the main drivers of Keppel Land’s revenue and earnings. In China, further relaxation of cooling measures, urbanisation and low mortgage rates resulting from central bank easing, seem to be encouraging residential property sales. Vietnam is another emerging market for Keppel, accounting for 20% of its home sales in FY15. Singapore unit sales should be dampened by weak buyer sentiment due to the continuing effects of government tightening measures, a flood of completions in 2015-2017 and slowing government land sales (GLS) – factors which signal falling ASPs. Infrastructure division earnings buoyed by handover of problematic assets. The bad apple situation with Keppel Infrastructure’s EPC projects has improved with the handover of all the two Greater Manchester EfW Plants and the Doha North in 2015. Thus, lower EPC provisions going forward should give a boost to earnings in the short term. Value-unlocking divestments can provide earnings upside. Divestments can free up cash to be invested in more profitable areas or to pay down debt. In Keppel’s case, it may also reduce the conglomerate discount on its stock. M1 is a possible candidate for sale; its fundamentals are uninspiring and our telecom analyst has a HOLD call on this stock as of this report’s writing. We estimate Keppel Corp’s stake in M1 to be ~S$440m. Injection of Infrastructure assets such as the Woodlands Wafer Fab Park into KIT, to whom Keppel Infrastructure acts as sponsor, could be another alternative.
O&M order wins (S$ m)
Offshore & Marine Revenues (S$m)
Property Revenues (S$m)
Infrastructure Revenues (S$m)
Source: Company, DBS Bank
6,754
4,974
1,773
3,000 3,000
0
900
1,800
2,700
3,600
4,500
5,400
6,300
2013A 2014A 2015A 2016F 2017F
7,126
8,556
6,241
5,4195,846
0
1,000
2,000
3,000
4,000
5,000
6,000
7,000
8,000
9,000
2013A 2014A 2015A 2016F 2017F
1,768 1,729
1,926
1,7341,597
0
500
1,000
1,500
2,000
2,500
2013A 2014A 2015A 2016F 2017F
3,459
2,933
2,058
1,351 1,332
0
500
1,000
1,500
2,000
2,500
3,000
3,500
4,000
2013A 2014A 2015A 2016F 2017F

ASIAN INSIGHTS VICKERS SECURITIES Page 10
Company Guide
Keppel Corporation
Balance Sheet:
Following the privatisation of Keppel Land in 1Q15, Keppel Corp’s net gearing has increased to 0.42x as of 2Q15 and 0.53% as of end-2015 versus 0.11x at year-end FY14. However, the increase in gearing stems from a lower shareholder’s equity and cash balance due to a largely cash funding of the privatisation.
Share Price Drivers:
Recovery in oil prices would support the share price. Keppel O&M would benefit if oil prices recover to at least above the $60/bbl level, we think, which would trigger more offshore oil & gas capex spend. Announcement of new order wins. Strong order win announcements could push up the share price, as investors reward greater visibility on revenues and earnings.
Key Risks:
Competition from foreign yards. Keener competition from Chinese yards, which are usually aggressive in their pricing and lax with payment terms, as well as Korean peers, may affect order wins and profitability, especially if Keppel starts to offer concessions to protect market share. Further deferments possible if oil prices remain subdued. Since the oil price started declining in mid-2014, we have seen oil majors and asset owners slash capex spending substantially, which has hit the yards hard. Meanwhile, deliveries of newbuilds and conversions already under construction are being delayed – a situation which could worsen if oil prices remain low.
Company Background
Keppel is a diversified conglomerate with its core businesses in offshore marine (O&M), property investments and development, and infrastructure-based activities in Singapore and the region. O&M is the largest segment that typically contributes about two-thirds of group revenue. It possesses strong market leadership positions in rigbuilding, particularly for jackups and semi-submersibles, FPSO conversion, FLNG conversion, repair and construction of high-end specialised vessels. SOTP
Leverage & Asset Turnover (x)
Capital Expenditure
ROE (%)
Forward PE Band (x)
PB Band (x)
Source: Company, DBS Bank
0.3
0.3
0.3
0.4
0.4
0.4
0.4
0.4
0.5
0.5
0.5
0.00
0.10
0.20
0.30
0.40
0.50
0.60
0.70
2013A 2014A 2015A 2016F 2017F
Gross Debt to Equity (LHS) Asset Turnover (RHS)
0.0
200.0
400.0
600.0
800.0
1,000.0
1,200.0
2013A 2014A 2015A 2016F 2017F
Capital Expenditure (-)
S$m
0.0%
2.0%
4.0%
6.0%
8.0%
10.0%
12.0%
14.0%
16.0%
18.0%
2013A 2014A 2015A 2016F 2017F
Avg: 12.3x
+1sd: 13.9x
+2sd: 15.4x
‐1sd: 10.7x
‐2sd: 9.1x
6.3
8.3
10.3
12.3
14.3
16.3
Jan-12 Jan-13 Jan-14 Jan-15 Jan-16
(x)
Avg: 1.87x
+1sd: 2.27x
+2sd: 2.67x
‐1sd: 1.47x
‐2sd: 1.07x
0.6
1.1
1.6
2.1
2.6
Jan-12 Jan-13 Jan-14 Jan-15 Jan-16
(x)
Value (S$ m) Metrics
Market value of listed entities 1,161 Less: book value 757 Surplus from listed associates (1) 405 Surplus - Property (2) (1,212) Surplus from Keppel Land, Keppel
Harbour site, using ASP of S$1,500psf
Surplus - Offshore/Marine (3) 1,357 2x P/BV, less book value Surplus - Infrastructure (4) (287) 10x FY16 net profit, less book value
Net Surplus (Listed and unlisted entities) (1+2+3+4 )
262
Add: Book value (less minorities) as of end FY13 10,381 RNAV 10,643 RNAV per share (S$) 5.83 Fair value for KEP (S$) 5.25 10% conglomerate discount
Source: DBS Bank

ASIAN INSIGHTS VICKERS SECURITIES Page 11
Company Guide
Keppel Corporation
Key Assumptions
FY Dec 2013A 2014A 2015A 2016F 2017F O&M order wins (S$ m) 6,754 4,974 1,773 3,000 3,000
Segmental Breakdown
FY Dec 2013A 2014A 2015A 2016F 2017F Revenues (S$m) Offshore and Marine 7,126 8,556 6,241 5,419 5,846 Property 1,768 1,729 1,926 1,734 1,597 Infrastructure 3,459 2,933 2,058 1,351 1,332 Investments 27.2 64.0 71.1 71.9 70.7 Others N/A N/A N/A N/A N/A Total 12,380 13,283 10,296 8,576 8,846 EBIT (S$m)
Offshore and Marine 1,059 1,224 597 704 726 Property 981 667 636 385 365 Infrastructure 69.2 466 221 256 293 Investments 17.5 18.2 45.6 18.0 17.7 Others 7.26 (1.6) 14.1 0.0 0.0 Total 2,134 2,373 1,514 1,363 1,401 EBIT Margins (%)
Offshore and Marine 14.9 14.3 9.6 13.0 12.4 Property 55.5 38.6 33.0 22.2 22.8 Infrastructure 2.0 15.9 10.7 19.0 22.0 Investments 64.3 28.4 64.2 25.0 25.0 Others N/A N/A N/A N/A N/A Total 17.2 17.9 14.7 15.9 15.8
Income Statement (S$m)
FY Dec 2013A 2014A 2015A 2016F 2017F Revenue 12,380 13,283 10,296 8,576 8,846 Cost of Goods Sold (8,604) (9,245) (7,023) (5,480) (5,658) Gross Profit 3,777 4,038 3,273 3,096 3,188 Other Opng (Exp)/Inc (1,642) (1,665) (1,760) (1,732) (1,787) Operating Profit 2,134 2,373 1,514 1,363 1,401 Other Non Opg (Exp)/Inc 14.0 11.9 15.0 8.58 8.85 Associates & JV Inc 626 504 504 350 350 Net Interest (Exp)/Inc 19.5 (0.9) (35.5) (171) (191) Exceptional Gain/(Loss) 0.0 0.0 0.0 0.0 0.0 Pre-tax Profit 2,794 2,889 1,997 1,551 1,569 Tax (397) (462) (404) (264) (267) Minority Interest (551) (541) (68.3) (83.7) (84.6) Preference Dividend 0.0 0.0 0.0 0.0 0.0 Net Profit 1,846 1,885 1,525 1,204 1,217 Net Profit before Except. 1,412 1,444 1,476 1,204 1,217 EBITDA 3,017 3,155 2,280 1,953 1,999 Growth Revenue Gth (%) (11.3) 7.3 (22.5) (16.7) 3.2 EBITDA Gth (%) (12.3) 4.6 (27.7) (14.3) 2.3 Opg Profit Gth (%) (18.6) 11.2 (36.2) (9.9) 2.8 Net Profit Gth (Pre-ex) (%) (26.2) 2.3 2.2 (18.5) 1.1 Margins & Ratio Gross Margins (%) 30.5 30.4 31.8 36.1 36.0 Opg Profit Margin (%) 17.2 17.9 14.7 15.9 15.8 Net Profit Margin (%) 14.9 14.2 14.8 14.0 13.8 ROAE (%) 19.5 18.8 14.2 10.6 10.1 ROA (%) 6.2 6.1 5.0 4.2 4.3 ROCE (%) 8.6 9.1 5.6 5.4 5.3 Div Payout Ratio (%) 39.2 46.2 40.4 40.0 40.0 Net Interest Cover (x) NM 2,579.8 42.6 8.0 7.3
Source: Company, DBS Bank

ASIAN INSIGHTS VICKERS SECURITIES Page 12
Company Guide
Keppel Corporation
Quarterly / Interim Income Statement (S$m)
FY Dec 4Q2014 1Q2015 2Q2015 3Q2015 4Q2015 Revenue 3,925 2,814 2,563 2,440 2,480 Cost of Goods Sold (2,803) (1,803) (1,920) (1,535) (1,765) Gross Profit 1,122 1,011 643 904 714 Other Oper. (Exp)/Inc (196) (613) (229) (534) (384) Operating Profit 926 398 414 370 331 Other Non Opg (Exp)/Inc 3.77 1.22 4.75 7.01 1.98 Associates & JV Inc 255 61.2 90.2 101 251 Net Interest (Exp)/Inc (23.8) (5.2) (11.3) (9.6) (9.4) Exceptional Gain/(Loss) 0.0 0.0 0.0 0.0 0.0 Pre-tax Profit 1,161 455 498 469 575 Tax (136) (81.3) (88.0) (97.0) (138) Minority Interest (299) (13.9) (13.1) (9.5) (31.8) Net Profit 726 360 397 363 405 Net profit bef Except. 382 357 160 363 596 EBITDA 1,254 526 574 534 646 Growth Revenue Gth (%) 23.3 (28.3) (8.9) (4.8) 1.6 EBITDA Gth (%) 78.9 (58.0) 9.0 (6.9) 20.9 Opg Profit Gth (%) 63.8 (57.0) 4.0 (10.6) (10.7) Net Profit Gth (Pre-ex) (%) 11.6 (6.3) (55.2) 126.6 64.2 Margins Gross Margins (%) 28.6 35.9 25.1 37.1 28.8 Opg Profit Margins (%) 23.6 14.2 16.2 15.2 13.3 Net Profit Margins (%) 18.5 12.8 15.5 14.9 16.3
Balance Sheet (S$m)
FY Dec 2013A 2014A 2015A 2016F 2017F Net Fixed Assets 3,798 2,673 2,846 2,964 3,075 Invts in Associates & JVs 5,482 4,988 5,522 5,820 6,116 Other LT Assets 2,818 2,706 3,988 3,988 3,988 Cash & ST Invts 6,010 6,107 2,118 1,838 2,042 Inventory 8,995 10,681 10,651 10,089 10,408 Debtors 1,916 2,510 3,299 2,859 2,949 Other Current Assets 1,037 1,889 509 509 509 Total Assets 30,056 31,555 28,932 28,067 29,086 ST Debt 517 1,796 1,657 1,657 1,657 Creditor 5,409 5,581 5,752 4,764 4,915 Other Current Liab 3,416 3,597 2,498 1,949 1,998 LT Debt 6,583 5,587 6,602 6,602 6,602 Other LT Liabilities 442 266 498 498 498 Shareholder’s Equity 9,701 10,381 11,096 11,683 12,419 Minority Interests 3,988 4,347 830 914 999 Total Cap. & Liab. 30,056 31,555 28,932 28,067 29,086 Non-Cash Wkg. Capital 3,123 5,902 6,209 6,743 6,953 Net Cash/(Debt) (1,090) (1,275) (6,141) (6,420) (6,217) Debtors Turn (avg days) 55.4 60.8 103.0 131.0 119.8 Creditors Turn (avg days) 237.4 223.4 305.2 365.6 325.9 Inventory Turn (avg days) 363.5 399.9 574.5 721.1 690.2 Asset Turnover (x) 0.4 0.4 0.3 0.3 0.3 Current Ratio (x) 1.9 1.9 1.7 1.8 1.9 Quick Ratio (x) 0.8 0.8 0.5 0.6 0.6 Net Debt/Equity (X) 0.1 0.1 0.5 0.5 0.5 Net Debt/Equity ex MI (X) 0.1 0.1 0.6 0.5 0.5 Capex to Debt (%) 12.7 (5.1) 13.8 4.2 4.2 Z-Score (X) 1.9 2.0 1.8 1.8 1.9
Source: Company, DBS Bank

ASIAN INSIGHTS VICKERS SECURITIES Page 13
Company Guide
Keppel Corporation
Cash Flow Statement (S$m)
FY Dec 2013A 2014A 2015A 2016F 2017F Pre-Tax Profit 2,794 2,889 1,997 1,551 1,569 Dep. & Amort. 242 265 247 232 239 Tax Paid (585) (328) (302) (353) (264) Assoc. & JV Inc/(loss) (626) (504) (504) (350) (350) Chg in Wkg.Cap. (492) (340) (198) (445) (213) Other Operating CF (709) (1,960) (1,174) 0.0 0.0 Net Operating CF 625 21.8 66.6 635 981 Capital Exp.(net) (903) 379 (1,142) (350) (350) Other Invts.(net) 0.0 0.0 0.0 0.0 0.0 Invts in Assoc. & JV (473) 231 (341) (149) (148) Div from Assoc & JV 267 410 351 201 202 Other Investing CF 431 (144) 1,259 0.0 0.0 Net Investing CF (678) 877 126 (298) (296) Div Paid (843) (1,029) (956) (617) (481) Chg in Gross Debt 2,130 272 924 0.0 0.0 Capital Issues 39.8 34.3 8.89 0.0 0.0 Other Financing CF 201 (46.5) (3,279) 0.0 0.0 Net Financing CF 1,528 (769) (3,302) (617) (481) Currency Adjustments 34.6 42.2 28.1 0.0 0.0 Chg in Cash 1,509 171 (3,082) (280) 203 Opg CFPS (S cts) 61.8 19.9 14.5 59.4 65.7 Free CFPS (S cts) (15.4) 22.0 (59.1) 15.7 34.7
Source: Company, DBS Bank
Target Price & Ratings History
Source: DBS Bank
S.No. DateClosing
PriceTarget Price
Rat ing
1: 18 May 15 8.85 9.32 BUY
2: 22 Jun 15 8.41 9.32 BUY
3: 10 Aug 15 7.52 8.14 HOLD
4: 31 Aug 15 6.84 7.50 HOLD
5: 18 Sep 15 7.15 7.50 HOLD
6: 23 Oct 15 7.25 7.40 HOLD
7: 26 Oct 15 7.20 7.40 HOLD
8: 16 Nov 15 6.80 7.40 HOLD
9: 11 Jan 16 5.54 7.40 HOLD
10: 18 Jan 16 4.85 7.40 HOLD
11: 22 Jan 16 5.02 7.40 HOLD12: 25 Jan 16 4.81 5.25 HOLD
Note : Share price and Target price are adjusted for corporate actions.
12
3 4
5
6
78
910
11
12
4.47
5.47
6.47
7.47
8.47
9.47
Jan-15 May-15 Sep-15 Jan-16
S$

ASIAN INSIGHTS VICKERS SECURITIES sa: YM
BUY Last Traded Price: S$2.23 (STI : 2,545.61) Price Target : S$3.50 (57% upside) (Prev S$3.80) Potential Catalyst: Ramp up of India power plant, improvement of marine business Where we differ: In line Analyst Janice CHUA +65 6682 3692 [email protected] Pei Hwa Ho +65 6682 3714 [email protected]
Price Relative
Forecasts and Valuation FY Dec (S$m) 2014A 2015F 2016F 2017F Revenue 10,895 8,885 9,572 9,989 EBITDA 1,612 1,312 1,383 1,454 Pre-tax Profit 1,246 1,311 960 1,009 Net Profit 801 937 630 670 Net Pft (Pre Ex.) 801 533 630 670 Net Pft Gth (Pre-ex) (%) (2.4) (33.5) 18.3 6.3 EPS (S cts) 44.9 52.5 35.3 37.5 EPS Pre Ex. (S cts) 44.9 29.8 35.3 37.5 EPS Gth Pre Ex (%) (2) (34) 18 6 Diluted EPS (S cts) 44.5 52.1 35.0 37.2 Net DPS (S cts) 16.0 16.1 12.1 12.1 BV Per Share (S cts) 315 351 370 396 PE (X) 5.0 4.2 6.3 5.9 PE Pre Ex. (X) 5.0 7.5 6.3 5.9 P/Cash Flow (X) nm 1.8 4.1 2.8 EV/EBITDA (X) 5.4 6.0 5.9 5.5 Net Div Yield (%) 7.2 7.2 5.4 5.4 P/Book Value (X) 0.7 0.6 0.6 0.6 Net Debt/Equity (X) 0.4 0.3 0.3 0.2 ROAE (%) 14.8 15.8 9.8 9.8 Earnings Rev (%): 0 0 0 Consensus EPS (S cts): 32.1 33.6 36.1 Other Broker Recs: B: 9 S: 3 H: 6
Source of all data: Company, DBS Bank, Bloomberg Finance L.P
Too cheap to ignore Fear over SMM privatization overdone. SCI’s share price corrected 24% YTD following market chatters over its 60.6%-owned Sembcorp Marine (SMM)’s customer, Sete Brasil’s possible backruptcy protection and SCI privatizing SMM. In our opinion, the more likely scenario of rigbuilders restructuring would be the injection of Keppel O&M into SMM. Stripping out market value of SMM, Salalah and Gallant Venture, utilities business is valued at an unjustifiably low valuation of <5x FY16 PE vs historical mean of 11x. Our SOTP-based TP is adjusted down slightly to S$3.50, reflecting the downgrade in SMM’s TP. This translates to 1.0x P/Bv, which is 10% below GFC trough, implying 57% upside potential. We believe this is a fair multiple in view of the 10% ROE and 5% dividend yield.
DPS uplift from divestment gains. We expect SCI to maintain similar payout of 16 Scts in FY15 (including 4 Scts interim dividend) despite the decline in recurring PATMI. The successful divestments of SembSita and Bournemouth Water, are expected to contribute 6.5 Scts to DPS, assuming a 30% payout ratio. Thereafter, DPS should normalize to 12 Scts per annum, representing a decent 4% dividend yield.
Growing utilities business in emerging markets. The first India power plant, of which its first unit has been operational since April and the second unit in mid-Sept, had incurred total startup losses of S$21m in the past two quarters. The plant is likely to break even this year and contribute to SCI’s bottom line from 2016 onwards with better economies of scale after the second unit's ramp-up. This would mitigate earnings decline from Singapore power plants while other overseas utility businesses are expected to be stable this year. Besides, SCI has made its foray into other emerging markets – Bangladesh and Myanmar, underpinning the longer-term growth prospects of its utilities segment.
Valuation: Given its diverse earnings stream and various listed assets, we derive our fair value on SCI based on the sum of its different parts, which include market valuations of its stakes in listed companies Sembcorp Marine (SGX-listed, 60.6% stake), Gallant Venture (SGX-listed, 11.96% stake) and Salalah (Muscat stock exchange, 40% stake) and earnings from utilities and urban development. For its holding company position, we have applied a 10% conglomerate discount to the reappraised net asset value (RNAV). Our TP is lowered slightly to S$3.50 (from S$3.80 previously) as we imputed the downgrade in SMM’s TP from S$1.85 to S$1.35.
Key Risks to Our View: Key risks to earnings are further deferments / cancellations of marine projects, deterioration of Singapore power’s spark spread, and execution hiccups in India power plants. At A Glance Issued Capital (m shrs) 1,785 Mkt. Cap (S$m/US$m) 3,981 / 2,791 Major Shareholders Temasek Holdings Pte Ltd (%) 49.5 Mondrian Investment Partners (%) 5.0 Free Float (%) 45.5 3m Avg. Daily Val (US$m) 10.4 ICB Industry : Oil & Gas / Oil Equipment; Services & Dist
DBS Group Research . Equity 27 Jan 2016
Singapore Company Guide
Sembcorp Industries Version | Bloomberg: SCI SP | Reuters: SCIL.SI Refer to important disclosures at the end of this report
27
47
67
87
107
127
147
167
187
207
1.2
1.7
2.2
2.7
3.2
3.7
4.2
4.7
5.2
5.7
Jan-12 Jan-13 Jan-14 Jan-15 Jan-16
Relative IndexS$
Sembcorp Marine (LHS) Relative STI INDEX (RHS)

ASIAN INSIGHTS VICKERS SECURITIES Page 15
Company Guide
Sembcorp Industries
CRITICAL DATA POINTS TO WATCH
Earnings Drivers:
Utilities projects pipeline should progressively add to earnings. New facilities will add to SCI’s power generation and water treatment capacities, which should increase earnings assuming the operations are profitable. A total of 2,588MW of power generation capacity (excluding the 660MW TPCIL Unit 1 plant in India, already online), 140tph of steam capacity and 1.6million m3/day of water treatment capacity is expected to be added from now until 2017. This roughly translates to a 31%, 3% and 17% increase in power, steam and water treatment capacities respectively. Narrowing spark spreads in Singapore have hit power generation earnings. </b>Growth in supply of electricity outpacing the growth in consumption led to Uniform Singapore Energy Price (USEP) falling by 22.1% y-o-y in 2013 and by further 20.8% in 2014, shrinking the generator’s spark spread – a barometer of profits on electricity sales. However, the impact will not be significant, as Singapore power generation only makes up 6-7% of SCI’s net income. Nonetheless, an increase in USEP prices going forward will help earnings. Greater contribution from non-Singapore power generation facilities would also alleviate the pressure on profitability. Marine business (SMM) earnings are orderbook-driven. Sembcorp Marine’s (SMM) orderbook has declined to S$10.9bn as of end-2Q15, in tandem with the downturn in the offshore oil & gas industry. Order wins of S$1.4bn in 1H15 were weak but respectable amid the current environment; 2013 and 2014 saw full-year order wins of S$4.2bn. The current orderbook stretches until 2019, but there is risk of order deferments – which would spread revenues and earnings thinner – given that drilling units account for 76% of its value. It has primarily been the low oil prices that saw oil majors and asset owners defer capex spend. Hence, a rebound in oil prices would likely trigger more order wins for SMM, which would be positive for earnings. Urban Development business provides growth opportunities. Urban Development accounts for c.5% of SCI’s bottomline. Thus, a strong performance of this segment will not move the needle too much for now, but represents an avenue for growth. SCI has about 3,500ha of saleable land remaining across China, Indonesia and Vietnam, which it can develop. However, headwinds in the form of delays in China land sales have proven to be a stumbling block recently; better sales momentum, which we are seeing a glimmer of, would give some earnings uplift.
Marine contract wins
Source: Company, DBS Bank
4,193 4,192
2,8002,500 2,500
0
500
1,000
1,500
2,000
2,500
3,000
3,500
4,000
2013A 2014A 2015F 2016F 2017F
63%31%
4%
7% -4%
SCI Group Net Profit for 9M15 - Total S$488m
Utilities
Marine
Urban Development
Other Businesses
Corporate
32%
11%
21%12%
8%
3%
-11%
24%
Utilities 9M15 Net Profit by Geography - Total S$306m
Singapore
Rest of ASEAN, Australia & IndiaChina
Middle East & Africa
UK
The Americas
Corporate
Significant Item
35%
27%
38%
Utilities in Singapore 9M15 Net Profits - Total S$99.4m
Energy
Water
On-site Logistics & Solid Waste Management

ASIAN INSIGHTS VICKERS SECURITIES Page 16
Company Guide
Sembcorp Industries
Balance Sheet:
SCI’s gearing continues to rise, with net gearing at 0.5x as of 2Q15 – a stark contrast to a net cash position in 2013; increasing leverage at SMM has been the main reason for the increase in debt levels. The slight uptick in 2Q15 was a result of SCI acquiring a 60% stake in Green Infra, which was partly funded with debt. Overall though, gearing remains at palatable levels.
Share Price Drivers:
Oil price rebound would drive the share price higher. Investors would have greater confidence in the Marine business, as the operating environment improves. While drilling rig orders might lag oil price recovery, we could expect orders for production related facilities to flow through. Order wins in the Marine segment and land sales from Urban Development would bode well for SCI’s share price. While the oil price rebound would be an early indicator, securing contract wins is a more tangible indicator. More momentum in land sales would signal more hope for growth, and be positive to share price. Widening spark spreads at Singapore power plants. Signs of a positive and widening spark spread in Singapore would alleviate a key concern of investors and provide support to the share price.
Key Risks:
Increasing competition in the Singapore power market. Total power generation supply in Singapore rose 9.3% y-o-y in 2014, marking the biggest y-o-y jump since the electricity market started. 2015 heralds a similar growth in supply, depressing prices further and hurting SCI’s bottom line. Execution of Indian power plants. The availability of coal supply and power purchase agreements (PPA) for SCI’s power plants in India have been of a concern. The first unit is up and running on a 500-MW purchase agreement and operating on both domestic and imported coal. Execution risk remains for the second unit, which was completed in Sept but has yet to win a PPA. Though, we believe it is in good position to secure a PPA soon.
Company Background
Sembcorp Industries (SCI) is a trusted provider of essential energy and water solutions to both industrial and municipal customers. It has facilities with 5,900 megawatts of gross power capacity and over eight million cubic metres of water per day in operation and under development. It is also a world leader in marine and offshore engineering (via Sembcorp Marine) as well as an established brand name in urban development (comprising industrial parks as well as business, commercial and residential space) in Vietnam, China and Indonesia.
Leverage & Asset Turnover (x)
Capital Expenditure
ROE (%)
Forward PE Band (x)
PB Band (x)
Source: Company, DBS Bank
0.5
0.6
0.6
0.7
0.7
0.8
0.8
0.9
0.9
0.00
0.10
0.20
0.30
0.40
0.50
0.60
0.70
2013A 2014A 2015F 2016F 2017F
Gross Debt to Equity (LHS) Asset Turnover (RHS)
0.0
200.0
400.0
600.0
800.0
1,000.0
1,200.0
1,400.0
2013A 2014A 2015F 2016F 2017F
Capital Expenditure (-)
S$m
0.0%
2.0%
4.0%
6.0%
8.0%
10.0%
12.0%
14.0%
16.0%
2013A 2014A 2015F 2016F 2017F
Avg: 12.2x
+1sd: 13.9x
+2sd: 15.5x
‐1sd: 10.6x
‐2sd: 9x
5.5
7.5
9.5
11.5
13.5
15.5
Jan-12 Jan-13 Jan-14 Jan-15 Jan-16
(x)
Avg: 1.72x
+1sd: 2.13x
+2sd: 2.54x
‐1sd: 1.3x
‐2sd: 0.89x
0.5
1.0
1.5
2.0
2.5
Jan-12 Jan-13 Jan-14 Jan-15 Jan-16
(x)

ASIAN INSIGHTS VICKERS SECURITIES Page 17
Company Guide
Sembcorp Industries
Key Assumptions
FY Dec 2013A 2014A 2015F 2016F 2017F Marine contract wins 4,193 4,192 3,150 2,500 3,000
Segmental Breakdown
FY Dec 2013A 2014A 2015F 2016F 2017F Revenues (S$m) Utilities 5,138 4,850 4,460 4,819 4,923 Marine 5,526 5,831 4,252 4,611 4,949 Industrial Parks 12.5 6.54 6.58 8.61 10.3 Other Businesses and Corporate 122 208 166 133 106 Total 10,798 10,895 8,885 9,572 9,989 Net Profit before EI (S$m)
Utilities 450 408 351 395 422 Marine 337 340 140 234 260 Industrial Parks 50.2 44.3 44.8 45.2 45.7 Other Businesses and Corporate (16.6) 8.78 0.88 1.05 1.26 Total 820 801 537 675 729 Net Profit before EI Margins (%)
Utilities 8.8 8.4 7.9 8.2 8.6 Marine 6.1 5.8 3.3 5.1 5.3 Industrial Parks 401.4 678.1 680.2 525.4 442.2 Other Businesses and Corporate (13.6) 4.2 0.5 0.8 1.2 Total 7.6 7.4 6.0 7.1 7.3
Income Statement (S$m)
FY Dec 2013A 2014A 2015F 2016F 2017F Revenue 10,798 10,895 8,885 9,572 9,989 Cost of Goods Sold (9,510) (9,480) (7,799) (8,346) (8,699) Gross Profit 1,287 1,415 1,086 1,226 1,290 Other Opng (Exp)/Inc (339) (352) (293) (325) (340) Operating Profit 948 1,062 793 901 951 Other Non Opg (Exp)/Inc 212 76.7 38.8 38.8 38.8 Associates & JV Inc 155 158 150 95.7 97.6 Net Interest (Exp)/Inc (101) (50.7) (75.3) (76.6) (79.9) Exceptional Gain/(Loss) 0.0 0.0 405 0.0 0.0 Pre-tax Profit 1,214 1,246 1,311 960 1,009 Tax (117) (162) (260) (177) (185) Minority Interest (277) (283) (114) (152) (152) Preference Dividend 0.0 0.0 0.0 0.0 0.0 Net Profit 820 801 937 630 670 Net Profit before Except. 820 801 533 630 670 EBITDA 1,619 1,612 1,312 1,383 1,454 Growth Revenue Gth (%) 6.0 0.9 (18.4) 7.7 4.4 EBITDA Gth (%) 4.6 (0.4) (18.6) 5.4 5.1 Opg Profit Gth (%) (10.5) 12.0 (25.4) 13.6 5.6 Net Profit Gth (Pre-ex) (%) 8.9 (2.4) (33.5) 18.3 6.3 Margins & Ratio Gross Margins (%) 11.9 13.0 12.2 12.8 12.9 Opg Profit Margin (%) 8.8 9.7 8.9 9.4 9.5 Net Profit Margin (%) 7.6 7.4 10.5 6.6 6.7 ROAE (%) 16.9 14.8 15.8 9.8 9.8 ROA (%) 6.2 5.2 5.4 3.6 3.7 ROCE (%) 9.5 8.3 4.8 5.3 5.4 Div Payout Ratio (%) 37.0 35.7 30.7 34.4 32.3 Net Interest Cover (x) 9.4 21.0 10.5 11.8 11.9
Source: Company, DBS Bank

ASIAN INSIGHTS VICKERS SECURITIES Page 18
Company Guide
Sembcorp Industries
Quarterly / Interim Income Statement (S$m)
FY Dec 3Q2014 4Q2014 1Q2015 2Q2015 3Q2015 Revenue 3,069 2,664 2,338 2,388 2,399 Cost of Goods Sold (2,725) (2,241) (2,050) (2,035) (2,110) Gross Profit 345 424 289 353 290 Other Oper. (Exp)/Inc (47.4) (63.3) (74.9) (102) (104) Operating Profit 297 360 214 251 186 Other Non Opg (Exp)/Inc 0.0 0.0 0.0 0.0 0.0 Associates & JV Inc 25.3 35.4 40.0 58.5 21.2 Net Interest (Exp)/Inc (7.6) (37.0) (25.5) (50.1) (57.0) Exceptional Gain/(Loss) 0.0 0.0 0.0 54.5 0.0 Pre-tax Profit 315 359 228 314 150 Tax (52.4) (25.6) (40.5) (41.1) (10.9) Minority Interest (65.8) (92.1) (45.5) (49.6) (17.0) Net Profit 197 241 142 224 122 Net profit bef Except. 197 241 142 169 122 EBITDA 322 396 254 310 207 Growth Revenue Gth (%) 21.1 (13.2) (12.2) 2.1 0.5 EBITDA Gth (%) 8.2 22.7 (35.9) 22.4 (33.3) Opg Profit Gth (%) 17.0 21.2 (40.7) 17.6 (26.0) Net Profit Gth (Pre-ex) (%) 9.8 22.6 (41.0) 18.9 (27.7) Margins Gross Margins (%) 11.2 15.9 12.3 14.8 12.1 Opg Profit Margins (%) 9.7 13.5 9.1 10.5 7.8 Net Profit Margins (%) 6.4 9.0 6.1 9.4 5.1
Balance Sheet (S$m)
FY Dec 2013A 2014A 2015F 2016F 2017F Net Fixed Assets 5,127 7,725 8,395 9,048 9,683 Invts in Associates & JVs 1,852 2,074 2,155 2,180 2,208 Other LT Assets 1,086 1,246 1,246 1,246 1,246 Cash & ST Invts 2,257 1,663 2,636 2,394 2,694 Inventory 2,241 3,205 1,777 1,914 1,665 Debtors 1,140 1,200 979 1,055 1,101 Other Current Assets 52.8 63.8 63.8 63.8 63.8 Total Assets 13,754 17,176 17,248 17,897 18,655 ST Debt 414 1,086 1,086 1,086 1,086 Creditor 2,692 2,745 2,239 2,412 2,517 Other Current Liab 1,796 1,526 1,339 1,320 1,368 LT Debt 1,485 3,649 3,649 3,649 3,649 Other LT Liabilities 837 938 938 938 938 Shareholder’s Equity 5,230 5,616 6,268 6,610 7,063 Minority Interests 1,300 1,616 1,730 1,882 2,034 Total Cap. & Liab. 13,754 17,176 17,248 17,897 18,655 Non-Cash Wkg. Capital (1,054) 198 (758) (699) (1,056) Net Cash/(Debt) 358 (3,071) (2,099) (2,341) (2,041) Debtors Turn (avg days) 39.1 39.2 44.8 38.8 39.4 Creditors Turn (avg days) 109.5 108.3 121.8 106.1 107.9 Inventory Turn (avg days) 81.8 108.4 121.7 84.2 78.4 Asset Turnover (x) 0.8 0.7 0.5 0.5 0.5 Current Ratio (x) 1.2 1.1 1.2 1.1 1.1 Quick Ratio (x) 0.7 0.5 0.8 0.7 0.8 Net Debt/Equity (X) CASH 0.4 0.3 0.3 0.2 Net Debt/Equity ex MI (X) CASH 0.5 0.3 0.4 0.3 Capex to Debt (%) 61.3 27.4 21.1 21.1 21.1 Z-Score (X) 2.1 1.6 1.5 1.5 1.5
Source: Company, DBS Bank

ASIAN INSIGHTS VICKERS SECURITIES Page 19
Company Guide
Sembcorp Industries
Cash Flow Statement (S$m)
FY Dec 2013A 2014A 2015F 2016F 2017F Pre-Tax Profit 1,214 1,246 1,311 959 1,007 Dep. & Amort. 303 315 331 347 365 Tax Paid (125) (119) (258) (260) (177) Assoc. & JV Inc/(loss) (155) (158) (150) (95.7) (97.6) Chg in Wkg.Cap. 141 (1,414) 953 24.9 348 Other Operating CF 92.0 72.9 0.0 0.0 0.0 Net Operating CF 1,470 (57.4) 2,187 975 1,447 Capital Exp.(net) (1,164) (1,298) (1,000) (1,000) (1,000) Other Invts.(net) 16.1 4.30 0.0 0.0 0.0 Invts in Assoc. & JV (284) (280) 0.0 0.0 0.0 Div from Assoc & JV 94.7 122 70.0 70.0 70.0 Other Investing CF (21.0) 10.9 0.0 0.0 0.0 Net Investing CF (1,358) (1,441) (930) (930) (930) Div Paid (413) (539) (286) (288) (216) Chg in Gross Debt 393 393 0.0 0.0 0.0 Capital Issues 0.0 0.0 0.0 0.0 0.0 Other Financing CF 81.9 1,049 0.0 0.0 0.0 Net Financing CF 61.8 903 (286) (288) (216) Currency Adjustments 22.1 1.78 0.0 0.0 0.0 Chg in Cash 196 (594) 971 (243) 300 Opg CFPS (S cts) 73.9 76.1 69.1 53.2 61.5 Free CFPS (S cts) 17.0 (76.0) 66.5 (1.4) 25.0
Source: Company, DBS Bank
Target Price & Ratings History
Source: DBS Bank
S.No. DateClosing
PriceTarget Price
Rat ing
1: 18 Feb 15 4.24 4.80 BUY
2: 08 May 15 4.37 4.30 HOLD
3: 10 Aug 15 3.72 4.10 BUY
4: 31 Aug 15 3.42 4.00 BUY
5: 18 Sep 15 3.50 4.00 BUY
6: 23 Sep 15 3.53 4.00 BUY
7: 30 Oct 15 3.58 4.20 BUY
8: 09 Dec 15 3.04 3.80 BUY
9: 22 Jan 16 2.34 3.80 BUY
Note : Share price and Target price are adjusted for corporate actions.
1
2
34
5
6
78
92.08
2.58
3.08
3.58
4.08
4.58
5.08
Jan-15 May-15 Sep-15 Jan-16
S$

ASIAN INSIGHTS VICKERS SECURITIES sa: YM
FULLY VALUED Last Traded Price: S$1.48 (STI : 2,545.61) Price Target : S$1.35 (8% downside) (Prev S$1.85) Potential Catalyst: O&G recovery, disposal of terminated rig at profit Where we differ: In line Analyst Pei Hwa Ho +65 6682 3714 [email protected] Janice CHUA +65 6682 3692 [email protected]
Price Relative
Forecasts and Valuation FY Dec (S$m) 2014A 2015F 2016F 2017F Revenue 5,833 4,252 4,611 4,949 EBITDA 829 458 718 805 Pre-tax Profit 707 287 485 545 Net Profit 560 231 386 429 Net Pft (Pre Ex.) 560 231 386 429 Net Pft Gth (Pre-ex) (%) 4.1 (58.7) 67.1 11.0 EPS (S cts) 26.8 11.1 18.5 20.5 EPS Pre Ex. (S cts) 26.8 11.1 18.5 20.5 EPS Gth Pre Ex (%) 4 (59) 67 11 Diluted EPS (S cts) 27.0 11.1 18.6 20.6 Net DPS (S cts) 13.0 5.53 8.32 9.24 BV Per Share (S cts) 142 140 153 165 PE (X) 5.5 13.3 8.0 7.2 PE Pre Ex. (X) 5.5 13.3 8.0 7.2 P/Cash Flow (X) nm nm 5.7 19.5 EV/EBITDA (X) 4.7 11.6 7.4 6.9 Net Div Yield (%) 8.8 3.8 5.6 6.3 P/Book Value (X) 1.0 1.1 1.0 0.9 Net Debt/Equity (X) 0.2 0.7 0.6 0.6 ROAE (%) 19.9 7.8 12.6 12.9 Earnings Rev (%): 0 0 0 Consensus EPS (S cts): 12.0 15.1 14.9 Other Broker Recs: B: 2 S: 15 H: 4
Source of all data: Company, DBS Bank, Bloomberg Finance L.P
Rough sea ahead Reiterate FULLY VALUED on SMM with lower TP of S$1.35 based on a lower 0.9x P/BV (from 1.2x P/BV) in view of the deteriorating situation in Brazil and potential impairment / provision ahead. The new TP implies 10% potential downside. Stock prices have been driven up by speculation of potential privatization by SCI lately, which is unjustifiable in our opinion. We believe the more likely scenario could be the injection of Keppel O&M into SMM. While dividend yield seems attractive over 5%, there is downside risk given the rising pressure to conserve cash. We will revisit our assumptions after FY15 results reporting on 15 Feb. Rough sea ahead. We expect more deferments and cancellations to come. SMM has seen a number of deferments from customers – Sete Brasil, Transocean, Oro Negro, Perisai, and the first cancellation by Marco Polo (MPM). The dispute with MPM will be a near-term drag and it appears challenging to dispose of the 95% completed terminated rig at good prices in the current environment. Meanwhile, the Brazilian saga remains an overhang with Sete Brasil’s financing issue still unresolved. Slow order momentum. New contract wins of S$3.2bn in 2015 is commendable in the current climate, driven by the two sizeable contracts to build a fixed platform and the world’s largest semi-submersible crane vessel. Nevertheless, current orderbook of S$11.6bn as at end-Sep15 is set to decline in anticipation of sluggish order flow. We believe rig orders are unlikely to make a comeback anytime soon given the supply glut amidst oil crisis. Valuation: Our target price of S$1.35 is based on 0.9x SMM’s FY16 P/BV, in anticipation of writedown ahead. This is also in line with AFC trough valuation. Key Risks to Our View:
Key downside risks are sustained low oil prices which affect rig count and newbuilding activities, execution risks at protected markets especially Brazil and further deferments / cancellations. Upside risk could come from privatisation or M&A activities. At A Glance Issued Capital (m shrs) 2,088 Mkt. Cap (S$m/US$m) 3,081 / 2,159 Major Shareholders Sembcorp Industries Ltd (%) 61.0 Franklin Resources (%) 5.0 Free Float (%) 38.8 3m Avg. Daily Val (US$m) 4.2 ICB Industry : Oil & Gas / Oil Equipment; Services & Dist
DBS Group Research . Equity 27 Jan 2016
Singapore Company Guide
Sembcorp Marine Version | Bloomberg: SMM SP | Reuters: SCMN.SI Refer to important disclosures at the end of this report
27
47
67
87
107
127
147
167
187
207
1.2
1.7
2.2
2.7
3.2
3.7
4.2
4.7
5.2
5.7
Jan-12 Jan-13 Jan-14 Jan-15 Jan-16
Relative IndexS$
Sembcorp Marine (LHS) Relative STI INDEX (RHS)

ASIAN INSIGHTS VICKERS SECURITIES Page 21
Company Guide
Sembcorp Marine
CRITICAL DATA POINTS TO WATCH
Earnings Drivers:
Declining orderbook. Order wins and orderbook trend are often the key leading indicators of rigbuilders’ share price and earnings. Based on existing capacity, SMM requires S$4-5bn worth of order replenishment every year. We expect new orders to be 60% of those levels in the coming two years amidst sector headwinds, a harbinger of declining orderbook and earnings ahead. SMM’s orderbook stood at S$11.6bn as of Sept-2015, of which approx. 45% comes from the drillship projects with Sete Brasil. While this translates into a book-to-bill ratio of over 2.5x based on existing delivery schedule, it is vulnerable to deferments and cancellations. Asset deflation underway. Post GFC, newbuild prices for drilling rigs tumbled 20-30% from 2008-2010. The 5-15% price gain over the past few years could all be given back, if not worse. In this downturn, China plays a bigger role in global rig market, garnering one-third of global orderbook. Over 90% of these contracts are built on speculation without back-to-back charters and on 5:95 balloon payment terms, making it vulnerable to cancellations. We expect fire sales to suppress rig prices as shipyards would be desperate to recoup their construction costs if ship owners walk away. Rig utilisation and dayrates remain under pressure. Low oil price adds fuel to fire, aggravating the already challenging rigbuilding market that is suffering from a massive order backlog and keen competition. New rig supply is projected to be 5-7% a year while rig demand is expected to contract by 3-5% y-o-y in 2015, before returning to positive territory in 2016. As a result, day rates and utilisation have fallen around 20-30% from June 2014 levels. It may get worse before it gets better. We believe a gradual recovery in rig market towards end-2016 will set the stage for rising newbuild demand thereafter. Pace of rigbuilding recovery is dependent on oil price rebound, retirement of old fleets and cancellations at Chinese yards. An oil price rebound above US$70/bbl will stimulate E&P activities and thus rig demand, while rig attribution and cancellations will soothe the supply pressure and eventually bring the sector back to equilibrium.
New order wins (S$ m)
Sales Trend
Asset Trend
Profitability Trend
Margin Trends (%)
Source: Company, DBS Bank
4,193 4,192
3,150
2,500
3,000
0
500
1,000
1,500
2,000
2,500
3,000
3,500
4,000
2013A 2014A 2015F 2016F 2017F
-20.0%
-10.0%
0.0%
10.0%
20.0%
30.0%
0
1,000
2,000
3,000
4,000
5,000
2013A 2014A 2015F 2016F 2017F
S$ m
Total Revenue Revenue Growth (%) (YoY)
1,000
2,000
3,000
4,000
5,000
6,000
7,000
8,000
9,000
2013A 2014A 2015F 2016F 2017F
S$ m
Net Fixed Assets (Tangible) Total Current Assets
231
281
331
381
431
481
531
581
631
681
2013A 2014A 2015F 2016F 2017F
S$ m
Operating EBIT Pre tax Profit Net Profit
0%
2%
4%
6%
8%
10%
12%
14%
16%
18%
20%
2013A 2014A 2015F 2016F 2017F
EBITDA Margin % EBIT Margin % Net Income Margin %

ASIAN INSIGHTS VICKERS SECURITIES Page 22
Company Guide
Sembcorp Marine
Balance Sheet:
Net gearing has crept up from 0.3x in 1Q to 0.6x as of end-Sept. The rising trend should eventually reverse with the completion of the Brazilian and New yard by 2016, reducing capex to a more normalised level of S$100m+.
Share Price Drivers:
Recovery in oil prices. Rising oil prices could lift sentiment on rigbuilders, though it might lag behind the asset owners. We believe SMM would benefit if oil prices recover to at least above the $60/bbl level, which would trigger more offshore oil & gas capex spend. Order win momentum. Shipyards are orderbook driven. Strong order flow could push up the share price, as investors reward greater visibility on revenues and earnings. Restructuring of Sete Brasil. The successful restructuring of Brazil will allow Sete Brasil to obtain financing for its rigbuilding programme. This will eliminate an overhang on the rigbuilders.
Key Risks:
Sustained low oil price. Brent crude oil price below US$60/bbl would defer investments into deepwater projects, and higher cost oilfield projects. This could dampen newbuild demand for drilling rigs especially floaters. Execution risks in a protected market. Cost pressures, lack of skilled labour, potential project delays faced in emerging markets like Brazil are lingering concerns. Rig supply glut and competition. Slower order flow is expected as the market takes time to absorb about 190 rigs scheduled for delivery in the next two years, representing >20% of existing fleet. Competition is intensified with the low order backlog of Korean yards and emergence of Chinese shipyards in the offshore space.
Company Background
Sembcorp Marine (SMM) is a pure play in the offshore & marine sector. Its principal activities are rig building and offshore engineering, ship conversion, ship repair and shipbuilding of specialised vessels.
Leverage & Asset Turnover (x)
Capital Expenditure
ROE (%)
Forward PE Band (x)
PB Band (x)
Source: Company, DBS Bank
0.5
0.6
0.6
0.7
0.7
0.8
0.8
0.9
0.9
0.00
0.20
0.40
0.60
0.80
1.00
2013A 2014A 2015F 2016F 2017F
Gross Debt to Equity (LHS) Asset Turnover (RHS)
0.0
100.0
200.0
300.0
400.0
500.0
600.0
700.0
800.0
900.0
2013A 2014A 2015F 2016F 2017F
Capital Expenditure (-)
S$m
0.0%
5.0%
10.0%
15.0%
20.0%
2013A 2014A 2015F 2016F 2017F
Avg: 19.2x
+1sd: 22.7x
+2sd: 26.3x
‐1sd: 15.7x
‐2sd: 12.2x
9.0
14.0
19.0
24.0
29.0
Dec-11 Dec-12 Dec-13 Dec-14 Dec-15
(x)
Avg: 3.17x
+1sd: 4.04x
+2sd: 4.9x
‐1sd: 2.31x
‐2sd: 1.45x1.1
1.6
2.1
2.6
3.1
3.6
4.1
4.6
5.1
Dec-11 Dec-12 Dec-13 Dec-14 Dec-15
(x)
ASIAN INSIGHTS VICKERS SECURITIES Page 23
Company Guide
Sembcorp Marine
Key Assumptions
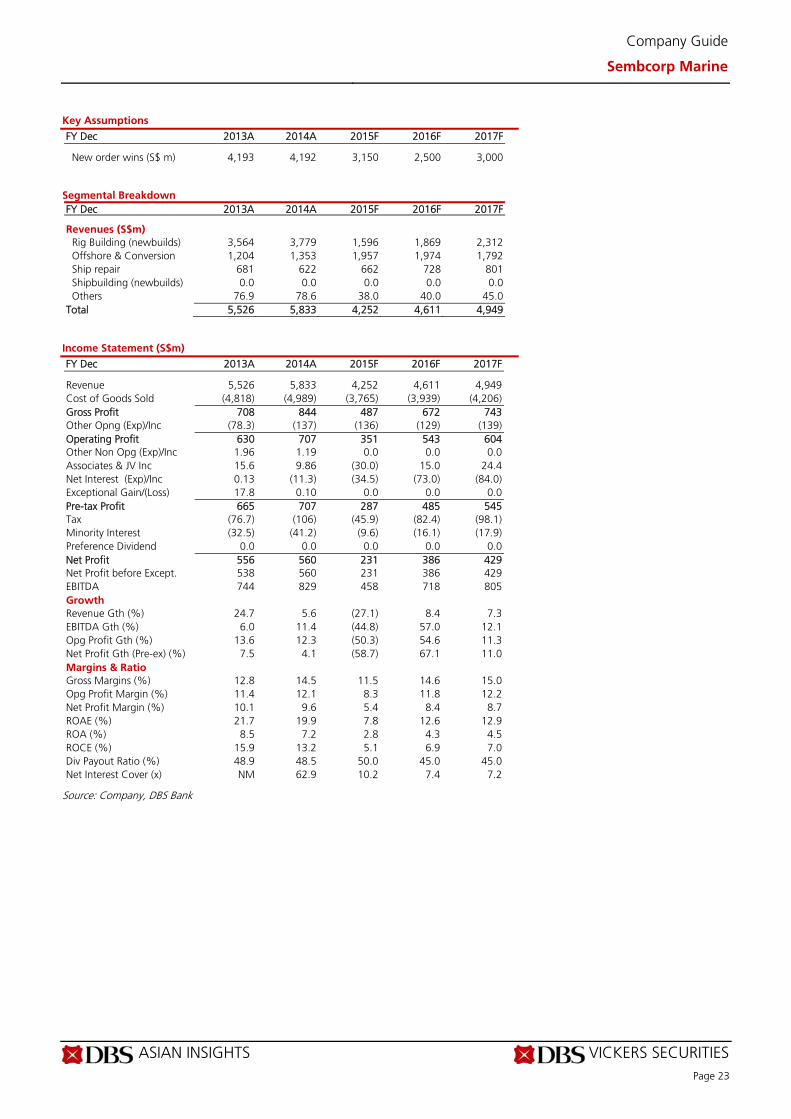
FY Dec 2013A 2014A 2015F 2016F 2017F New order wins (S$ m) 4,193 4,192 3,150 2,500 3,000
Segmental Breakdown
FY Dec 2013A 2014A 2015F 2016F 2017F Revenues (S$m) Rig Building (newbuilds) 3,564 3,779 1,596 1,869 2,312 Offshore & Conversion 1,204 1,353 1,957 1,974 1,792 Ship repair 681 622 662 728 801 Shipbuilding (newbuilds) 0.0 0.0 0.0 0.0 0.0 Others 76.9 78.6 38.0 40.0 45.0 Total 5,526 5,833 4,252 4,611 4,949
Income Statement (S$m)
FY Dec 2013A 2014A 2015F 2016F 2017F Revenue 5,526 5,833 4,252 4,611 4,949 Cost of Goods Sold (4,818) (4,989) (3,765) (3,939) (4,206) Gross Profit 708 844 487 672 743 Other Opng (Exp)/Inc (78.3) (137) (136) (129) (139) Operating Profit 630 707 351 543 604 Other Non Opg (Exp)/Inc 1.96 1.19 0.0 0.0 0.0 Associates & JV Inc 15.6 9.86 (30.0) 15.0 24.4 Net Interest (Exp)/Inc 0.13 (11.3) (34.5) (73.0) (84.0) Exceptional Gain/(Loss) 17.8 0.10 0.0 0.0 0.0 Pre-tax Profit 665 707 287 485 545 Tax (76.7) (106) (45.9) (82.4) (98.1) Minority Interest (32.5) (41.2) (9.6) (16.1) (17.9) Preference Dividend 0.0 0.0 0.0 0.0 0.0 Net Profit 556 560 231 386 429 Net Profit before Except. 538 560 231 386 429 EBITDA 744 829 458 718 805 Growth Revenue Gth (%) 24.7 5.6 (27.1) 8.4 7.3 EBITDA Gth (%) 6.0 11.4 (44.8) 57.0 12.1 Opg Profit Gth (%) 13.6 12.3 (50.3) 54.6 11.3 Net Profit Gth (Pre-ex) (%) 7.5 4.1 (58.7) 67.1 11.0 Margins & Ratio Gross Margins (%) 12.8 14.5 11.5 14.6 15.0 Opg Profit Margin (%) 11.4 12.1 8.3 11.8 12.2 Net Profit Margin (%) 10.1 9.6 5.4 8.4 8.7 ROAE (%) 21.7 19.9 7.8 12.6 12.9 ROA (%) 8.5 7.2 2.8 4.3 4.5 ROCE (%) 15.9 13.2 5.1 6.9 7.0 Div Payout Ratio (%) 48.9 48.5 50.0 45.0 45.0 Net Interest Cover (x) NM 62.9 10.2 7.4 7.2
Source: Company, DBS Bank
ASIAN INSIGHTS VICKERS SECURITIES Page 24
Company Guide
Sembcorp Marine
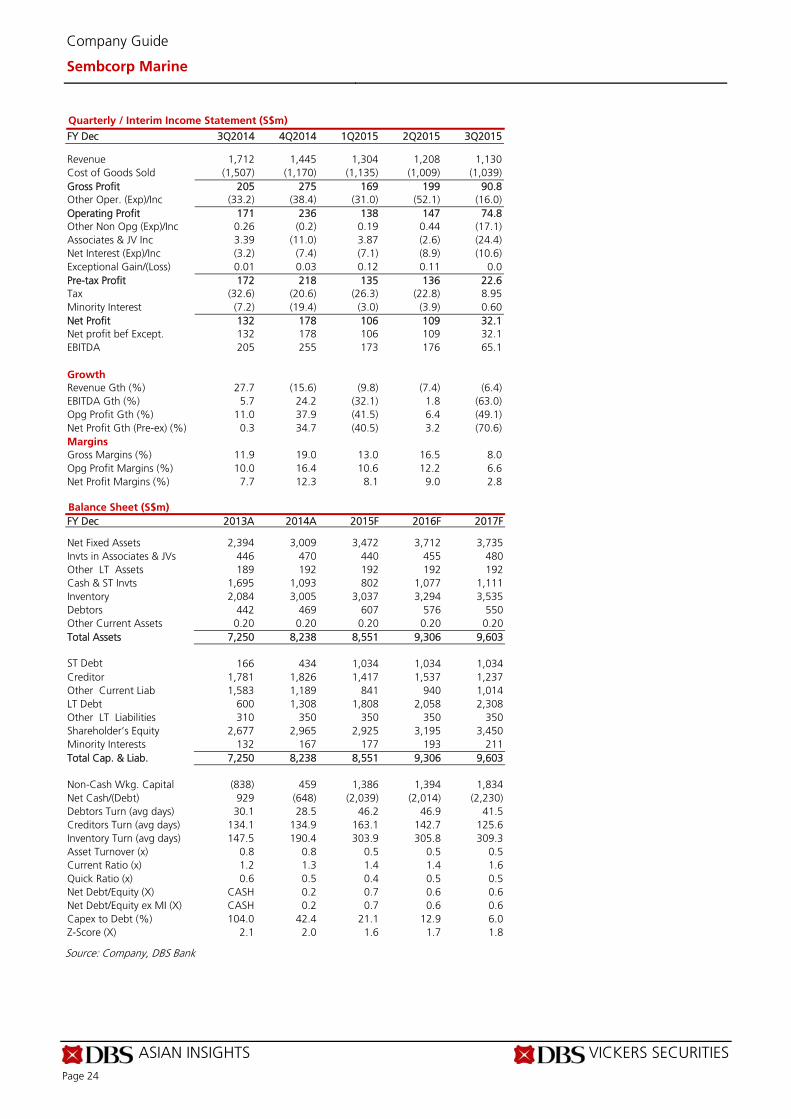
Quarterly / Interim Income Statement (S$m)
FY Dec 3Q2014 4Q2014 1Q2015 2Q2015 3Q2015 Revenue 1,712 1,445 1,304 1,208 1,130 Cost of Goods Sold (1,507) (1,170) (1,135) (1,009) (1,039) Gross Profit 205 275 169 199 90.8 Other Oper. (Exp)/Inc (33.2) (38.4) (31.0) (52.1) (16.0) Operating Profit 171 236 138 147 74.8 Other Non Opg (Exp)/Inc 0.26 (0.2) 0.19 0.44 (17.1) Associates & JV Inc 3.39 (11.0) 3.87 (2.6) (24.4) Net Interest (Exp)/Inc (3.2) (7.4) (7.1) (8.9) (10.6) Exceptional Gain/(Loss) 0.01 0.03 0.12 0.11 0.0 Pre-tax Profit 172 218 135 136 22.6 Tax (32.6) (20.6) (26.3) (22.8) 8.95 Minority Interest (7.2) (19.4) (3.0) (3.9) 0.60 Net Profit 132 178 106 109 32.1 Net profit bef Except. 132 178 106 109 32.1 EBITDA 205 255 173 176 65.1 Growth Revenue Gth (%) 27.7 (15.6) (9.8) (7.4) (6.4) EBITDA Gth (%) 5.7 24.2 (32.1) 1.8 (63.0) Opg Profit Gth (%) 11.0 37.9 (41.5) 6.4 (49.1) Net Profit Gth (Pre-ex) (%) 0.3 34.7 (40.5) 3.2 (70.6) Margins Gross Margins (%) 11.9 19.0 13.0 16.5 8.0 Opg Profit Margins (%) 10.0 16.4 10.6 12.2 6.6 Net Profit Margins (%) 7.7 12.3 8.1 9.0 2.8
Balance Sheet (S$m)
FY Dec 2013A 2014A 2015F 2016F 2017F Net Fixed Assets 2,394 3,009 3,472 3,712 3,735 Invts in Associates & JVs 446 470 440 455 480 Other LT Assets 189 192 192 192 192 Cash & ST Invts 1,695 1,093 802 1,077 1,111 Inventory 2,084 3,005 3,037 3,294 3,535 Debtors 442 469 607 576 550 Other Current Assets 0.20 0.20 0.20 0.20 0.20 Total Assets 7,250 8,238 8,551 9,306 9,603 ST Debt 166 434 1,034 1,034 1,034 Creditor 1,781 1,826 1,417 1,537 1,237 Other Current Liab 1,583 1,189 841 940 1,014 LT Debt 600 1,308 1,808 2,058 2,308 Other LT Liabilities 310 350 350 350 350 Shareholder’s Equity 2,677 2,965 2,925 3,195 3,450 Minority Interests 132 167 177 193 211 Total Cap. & Liab. 7,250 8,238 8,551 9,306 9,603 Non-Cash Wkg. Capital (838) 459 1,386 1,394 1,834 Net Cash/(Debt) 929 (648) (2,039) (2,014) (2,230) Debtors Turn (avg days) 30.1 28.5 46.2 46.9 41.5 Creditors Turn (avg days) 134.1 134.9 163.1 142.7 125.6 Inventory Turn (avg days) 147.5 190.4 303.9 305.8 309.3 Asset Turnover (x) 0.8 0.8 0.5 0.5 0.5 Current Ratio (x) 1.2 1.3 1.4 1.4 1.6 Quick Ratio (x) 0.6 0.5 0.4 0.5 0.5 Net Debt/Equity (X) CASH 0.2 0.7 0.6 0.6 Net Debt/Equity ex MI (X) CASH 0.2 0.7 0.6 0.6 Capex to Debt (%) 104.0 42.4 21.1 12.9 6.0 Z-Score (X) 2.1 2.0 1.6 1.7 1.8
Source: Company, DBS Bank
ASIAN INSIGHTS VICKERS SECURITIES Page 25
Company Guide
Sembcorp Marine
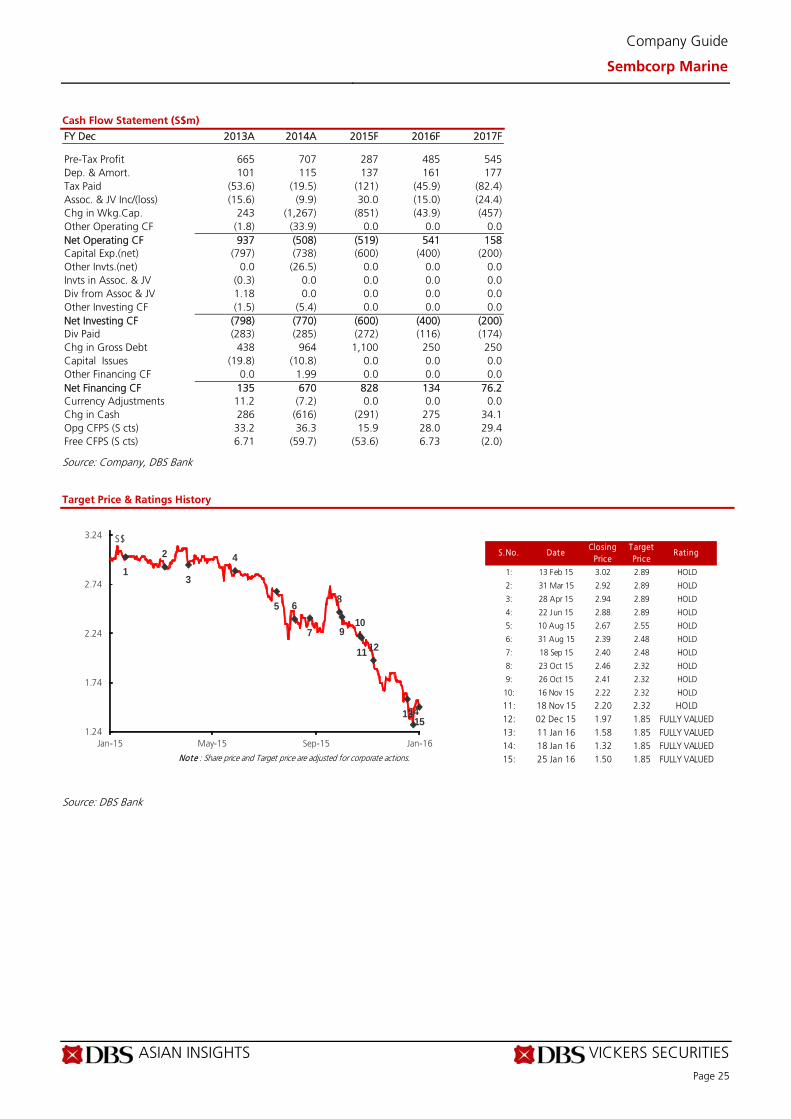
Cash Flow Statement (S$m)
FY Dec 2013A 2014A 2015F 2016F 2017F Pre-Tax Profit 665 707 287 485 545 Dep. & Amort. 101 115 137 161 177 Tax Paid (53.6) (19.5) (121) (45.9) (82.4) Assoc. & JV Inc/(loss) (15.6) (9.9) 30.0 (15.0) (24.4) Chg in Wkg.Cap. 243 (1,267) (851) (43.9) (457) Other Operating CF (1.8) (33.9) 0.0 0.0 0.0 Net Operating CF 937 (508) (519) 541 158 Capital Exp.(net) (797) (738) (600) (400) (200) Other Invts.(net) 0.0 (26.5) 0.0 0.0 0.0 Invts in Assoc. & JV (0.3) 0.0 0.0 0.0 0.0 Div from Assoc & JV 1.18 0.0 0.0 0.0 0.0 Other Investing CF (1.5) (5.4) 0.0 0.0 0.0 Net Investing CF (798) (770) (600) (400) (200) Div Paid (283) (285) (272) (116) (174) Chg in Gross Debt 438 964 1,100 250 250 Capital Issues (19.8) (10.8) 0.0 0.0 0.0 Other Financing CF 0.0 1.99 0.0 0.0 0.0 Net Financing CF 135 670 828 134 76.2 Currency Adjustments 11.2 (7.2) 0.0 0.0 0.0 Chg in Cash 286 (616) (291) 275 34.1 Opg CFPS (S cts) 33.2 36.3 15.9 28.0 29.4 Free CFPS (S cts) 6.71 (59.7) (53.6) 6.73 (2.0)
Source: Company, DBS Bank
Target Price & Ratings History
Source: DBS Bank
S.No. DateClosing
PriceTarget Price
Rat ing
1: 13 Feb 15 3.02 2.89 HOLD
2: 31 Mar 15 2.92 2.89 HOLD
3: 28 Apr 15 2.94 2.89 HOLD
4: 22 Jun 15 2.88 2.89 HOLD
5: 10 Aug 15 2.67 2.55 HOLD
6: 31 Aug 15 2.39 2.48 HOLD
7: 18 Sep 15 2.40 2.48 HOLD
8: 23 Oct 15 2.46 2.32 HOLD
9: 26 Oct 15 2.41 2.32 HOLD
10: 16 Nov 15 2.22 2.32 HOLD
11: 18 Nov 15 2.20 2.32 HOLD12: 02 Dec 15 1.97 1.85 FULLY VALUED13: 11 Jan 16 1.58 1.85 FULLY VALUED14: 18 Jan 16 1.32 1.85 FULLY VALUED
Note : Share price and Target price are adjusted for corporate actions. 15: 25 Jan 16 1.50 1.85 FULLY VALUED
1
2
3
4
5 6
7
8
910
11 12
131415
1.24
1.74
2.24
2.74
3.24
Jan-15 May-15 Sep-15 Jan-16
S$

ASIAN INSIGHTS VICKERS SECURITIES ed: TH / sa: YM
HOLD (Upgrade from FULLY VALUED) Last Traded Price: S$2.61 STI : 2,593.00 Price Target:S$2.60 (0% downside) Potential Catalyst: Clarity on new entrant Where we differ: FY15/16F earnings are 4%/8% below consensus and dividend payout ratio of 90% versus 100% by consensus Analyst Sachin Mittal+65 6682 3699 [email protected]
Price Relative
Forecasts and Valuation FY Dec (S$ m) 2015A 2016F 2017F 2018F Revenue 1,157 1,101 1,090 1,073 EBITDA 342 342 342 329 Pre-tax Profit 218 214 210 195 Net Profit 179 177 173 161 Net Pft (Pre Ex.) 179 177 173 161 EPS (S cts) 19.1 18.9 18.5 17.2 EPS Pre Ex. (S cts) 19.1 18.9 18.5 17.2 EPS Gth (%) 0 (1) (2) (7) EPS Gth Pre Ex (%) 0 (1) (2) (7) Diluted EPS (S cts) 19.1 18.9 18.5 17.2 Net DPS (S cts) 15.3 15.1 14.8 13.8 BV Per Share (S cts) 44.2 47.8 51.3 53.6 PE (X) 13.7 13.8 14.1 15.2 PE Pre Ex. (X) 13.7 13.8 14.1 15.2 P/Cash Flow (X) 10.2 6.4 8.2 8.6 EV/EBITDA (X) 8.1 7.8 7.9 8.2 Net Div Yield (%) 5.9 5.8 5.7 5.3 P/Book Value (X) 5.9 5.5 5.1 4.9 Net Debt/Equity (X) 0.8 0.5 0.6 0.5 ROAE (%) 44.2 41.1 37.4 32.8 Earnings Rev (%): (1) (1) - Consensus EPS (S cts): 19.7 19.6 18.9 Other Broker Recs: B: 9 S: 7 H: 7
Source of all data: Company, DBS Bank, Bloomberg Finance L.P
Negatives are priced in but uncertainty lingers The stock has declined 35% from its peak in April 2015. The stock has declined in anticipation of the potential entry of a 4th mobile player. The winner could be announced by the end of 1Q16 while actual operations may start from 2Q17 onwards. M1 is cheap at 13.6x FY16F PE versus 16x for StarHub as it has (i) a more price-sensitive user base; (ii) lesser number of subscribers on bundled offerings; and (iii) larger exposure to the mobile sector as a percentage of revenue. Conversely, if there is no 4th telco entry, M1 could benefit the most. Lower dividends than last year. 4Q15 net profit of S$43.6m (-2.1% y-o-y) was in line. However, final DPS of 8.3 Scts (-30% y-o-y) was below expectations. FY15 dividend payout ratio stands at 80% versus 100% in FY14 as M1 wants to reserve cash for upcoming spectrum auction. Besides, we want to highlight that fixed service revenue grew 29% y-o-y in 4Q15 and made up 12% of the total service revenue. Our bear-case TP is S$2.20 while bull-case TP is S$3.40. Our base-case TP of S$2.60 assumes 10% adverse impact on M1’s revenue due to the 4th player in 2022, with EBIT margins falling to 16% versus 20% currently. Under our bear-case scenario, we assume a 12% adverse impact on revenue in 2022 with EBIT margins dropping to 15%. Our bear-case TP is S$2.20. Under our bull-case scenario, we assume that there is no 4th telco entry and no adverse impact on M1’s revenue in 2022 although EBIT margins may slip to 19%. Our bull-case TP is S$3.40. Valuation:
No changes to our DCF (WACC 6.8%, terminal growth 0%) based TP of S$2.60. Upgrade to HOLD. Key Risks to Our View: Non-entry of a 4th mobile player could lead to a relief rally. MyRepublic has completed a funding round to raise S$23m in Sep-15 which is not adequate for network rollout of US$250m-300m . At A Glance Issued Capital (m shrs) 937 Mkt. Cap (S$m/US$m) 2,445 / 1,699 Major Shareholders Axiata Group (%) 28.3 Keppel T&T Ltd (%) 19.1 Singapore Press Holdings (%) 13.3 Free Float (%) 39.3 3m Avg. Daily Val (US$m) 2.0 ICB Industry :Telecommunications / Mobile Telecommunications
DBS Group Research . Equity 19 Jan 2016
SingaporeCompany Guide
M1 Edition 1 |Bloomberg: M1 SP| Reuters: MONE.SI Refer to important disclosures at the end of this report
83
103
123
143
163
183
203
2.2
2.7
3.2
3.7
4.2
Jan-12 Jan-13 Jan-14 Jan-15 Jan-16
Relative IndexS$
M1 (LHS) Relative STI INDEX (RHS)

ASIAN INSIGHTS VICKERS SECURITIES Page 27
Company Guide
M1
4Q15 Result Summary
Higher customer acquisition cost and ARPU impacted profitability. 4Q15 net profit of S$43.6m (-2.1% y-o-y) was in line. Mobile ARPU was diluted due to more customers adopting SIM-only plans but EBITDA margins rose due to the lack of handset subsidies. Quite importantly, fixed service revenue grew 29% y-o-y in 4Q15 and made up 12% of the total service revenue. Lower dividends than last year. Final DPS of 8.3 Scts (-30% y-o-y) was below expectations. FY15 dividend payout ratio stood at 80% versus 100% in FY14 as M1 wants to reserve cash for upcoming spectrum auction especially the 900 MHz spectrum. CRITICAL DATA POINTS TO WATCH
Earnings Drivers:
New SIM-only mobile plans are ARPU dilutive but not earnings dilutive. M1’s new SIM-only plans, introduced in late July whereby it charges only S$37 per month for 5GB data, 400 mins and 1,000 SMSes. If these plans are popular, they could boost the stagnating data usage levels. The lower price points of the new plans may negatively affect postpaid ARPU accompanied by reduction in handset subsidy cost. This could also be an indication of the industry’s direction with the entry of the new player. Roaming revenue may take time to stabilise. Roaming revenue accounts for about 10% of M1’s mobile revenue but is falling with lesser roaming calls. M1 has introduced data passport plans whereby customers can use their local data bundles when overseas by paying a monthly subscription fee of S$10 (S$50 in Europe). We anticipate the roaming revenue to decline further at a slower rate though. Growth from fixed broadband could offer some respite. M1 is seeing healthy growth in the sector at the expense of both the incumbents. We believe the company could see decent growth till its fixed broadband market share reaches 20%+. In addition, broadband pricing is seeing some stabilisation. However, broadband accounted for only 12% of the group's revenue in 4Q15 and the EBITDA margins are also lower than the mobile business. As such, the impact on M1’s bottom line is likely to be quite limited.
Post paid ARPU
Net Handset Subsidy
Postpaid subscribers (K)
Source: Company, DBS Bank
55.6 54.9 54.3 53 51.9
0.0
7.0
14.0
21.1
28.1
35.1
42.1
49.2
56.2
2014A 2015A 2016F 2017F 2018F
-85.0
-103.8
-72.3
-65.1
-114.20
-104.09
-93.98
-83.87
-73.77
2014A 2015A 2016F 2017F 2018F
1,149 1,161 1,173 1,173 1,149
0
200
400
600
800
1,000
2014A 2015A 2016F 2017F 2018F

ASIAN INSIGHTS VICKERS SECURITIES Page 28
Company Guide
M1
Balance Sheet:
Stable balance sheet. M1’s balance sheet has remained strong with the relatively consistent capital expenditure and dividend payments. We believe cash generation of M1 will remain strong which should support M1’s future spectrum auction bids and network expansions. Share Price Drivers:
M1 could benefit if there is no new mobile entrant. MyRepublic, interested in bidding for the 4th telco licence, has completed a funding round to raise S$23m in Sep-15 which is clearly not adequate. MyRepublic estimates that it requires US$250-300m capex for the network rollout. Also network capex for the 4th telco could exceed US$500m versus US$250m-300m if HetNet trials are not successful. The ability to secure vendor financing and potential success of HetNet trials will encourage MyRepublic’s business case to bid for the 4th telco spectrum. HetNet trials on the way. HetNet technologies allow consumers to connect to different networks such as Wi-Fi, 4G and 3G networks seamlessly. HetNet technology may allow telcos to invest 30-40% of capex required using traditional technology for similar coverage. SingTel, StarHub, M1 and MyRepublic are involved in HetNet trials in Jurong Lake district. However, failure of HetNet trials could spoil the business case for the new entrant. Key Risks:
Unsuccessful HetNet trails or inability to raise adequate funding. Without HetNet, capex requirements could increase significantly. Another risk will be the 4th entrant’s inability to raise adequate funding for network rollout.
Company Background
M1 is the smallest of the three telecom operators in Singapore. M1 provides mobile services and has also started to provide fixed broadband services by riding on National Broadband Network.
Leverage & Asset Turnover (x)
Capital Expenditure
ROE (%)
Forward PE Band (x)
PB Band (x)
Source: Company, DBS Bank
0.8
0.9
0.9
1.0
1.0
1.1
1.1
0.00
0.10
0.20
0.30
0.40
0.50
0.60
0.70
0.80
0.90
2014A 2015A 2016F 2017F 2018F
Gross Debt to Equity (LHS) Asset Turnover (RHS)
0.0
20.0
40.0
60.0
80.0
100.0
120.0
140.0
160.0
180.0
200.0
2014A 2015A 2016F 2017F 2018F
Capital Expenditure (-)
S$m
0.0%
5.0%
10.0%
15.0%
20.0%
25.0%
30.0%
35.0%
40.0%
2014A 2015A 2016F 2017F 2018F
Avg: 17x
+1sd: 18.7x
+2sd: 20.3x
‐1sd: 15.3x
‐2sd: 13.6x
12.0
14.0
16.0
18.0
20.0
22.0
Jan-12 Jan-13 Jan-14 Jan-15 Jan-16
(x)
Avg: 7.69x
+1sd: 8.43x
+2sd: 9.16x
‐1sd: 6.96x
‐2sd: 6.22x
5.1
6.1
7.1
8.1
9.1
10.1
Jan-12 Jan-13 Jan-14 Jan-15 Jan-16
(x)

ASIAN INSIGHTS VICKERS SECURITIES Page 29
Company Guide
M1
Key Assumptions
FY Dec 2014A 2015A 2016F 2017F 2018F Post paid ARPU 55.6 54.9 54.3 53.0 51.9 Net Handset Subsidy (85.0) (103.8) (72.3) (65.1) (62.5) Postpaid subscribers (K) 1,149.0 1,161.0 1,172.6 1,172.6 1,149.2
Segmental Breakdown
FY Dec 2014A 2015A 2016F 2017F 2018F Revenues (S$ m) Post Paid Cellular 591 591 626 619 605 Pre Paid Cellular 80 77 92 94 96 IDD Revenue 89 69 67 66 65 Fixed network services 71 86 90 95 99 Others 245 335 226 217 208 Total 1,076 1,157 1,101 1,090 1,073
Income Statement (S$ m)
FY Dec 2014A 2015A 2016F 2017F 2018F Revenue 1,076 1,157 1,101 1,090 1,073 Cost of Goods Sold (743) (822) (766) (754) (750) Gross Profit 334 336 336 336 323 Other Opng (Exp)/Inc (113) (112) (116) (119) (120) Operating Profit 221 223 220 217 203 Other Non Opg (Exp)/Inc 0 0 0 0 0 Associates & JV Inc 0 0 0 0 0 Net Interest (Exp)/Inc (4) (5) (5) (7) (8) Exceptional Gain/(Loss) 0 0 0 0 0 Pre-tax Profit 217 218 214 210 195 Tax (41) (40) (37) (37) (34) Minority Interest 0 0 0 0 0 Preference Dividend 0 0 0 0 0 Net Profit 176 179 177 173 161 Net Profit before Except. 176 179 177 173 161 EBITDA 336 342 342 342 329 Growth Revenue Gth (%) 6.8 7.5 (4.8) (1.0) (1.6) EBITDA Gth (%) 7.4 1.8 0.1 0.1 (3.8) Opg Profit Gth (%) 12.1 1.0 (1.7) (1.2) (6.4) Net Profit Gth (Pre-ex) (%) 9.8 1.5 (1.0) (2.0) (7.2) Margins & Ratio Gross Margins (%) 31.0 29.0 30.5 30.8 30.1 Opg Profit Margin (%) 20.5 19.3 19.9 19.9 18.9 Net Profit Margin (%) 16.3 15.4 16.0 15.9 15.0 ROAE (%) 44.5 44.2 41.1 37.4 32.8 ROA (%) 17.5 16.9 15.6 14.3 12.8 ROCE (%) 23.0 21.7 20.2 18.8 16.7 Div Payout Ratio (%) 100.0 80.0 80.0 80.0 80.0 Net Interest Cover (x) 55.3 45.6 41.4 31.8 25.1
Source: Company, DBS Bank
We expect ARPU to stagnate
Postpaid revenue affected by stagnating usage levels
Net profit to decline on ARPU concerns

ASIAN INSIGHTS VICKERS SECURITIES Page 30
Company Guide
M1
Quarterly / Interim Income Statement (S$ m)
FY Dec 4Q2014 1Q2015 2Q2015 3Q2015 4Q2015 Revenue 346 295 277 278 308 Cost of Goods Sold (261) (212) (194) (192) (223) Gross Profit 86 82 83 85 85 Other Oper. (Exp)/Inc (30) (26) (28) (29) (29) Operating Profit 56 56 55 56 56 Other Non Opg (Exp)/Inc 0 0 0 0 0 Associates & JV Inc 0 0 0 0 0 Net Interest (Exp)/Inc (1) (1) (1) (1) (1) Exceptional Gain/(Loss) 0 0 0 0 0 Pre-tax Profit 55 55 54 55 55 Tax (11) (10) (10) (10) (11) Minority Interest 0 0 0 0 0 Net Profit 45 46 44 45 44 Net profit bef Except. 45 46 44 45 44 EBITDA 86 83 84 87 88 Growth Revenue Gth (%) 38.4 (14.9) (6.1) 0.3 10.9 EBITDA Gth (%) 2.2 (3.6) 0.4 3.7 1.7 Opg Profit Gth (%) 0.9 0.4 (2.3) 2.0 (0.4) Net Profit Gth (Pre-ex) (%) 0.0 2.7 (3.1) 1.4 (2.9) Margins Gross Margins (%) 24.8 28.0 29.9 30.7 27.6 Opg Profit Margins (%) 16.2 19.1 19.9 20.2 18.2 Net Profit Margins (%) 12.8 15.5 16.0 16.2 14.2
Balance Sheet (S$ m)
FY Dec 2014A 2015A 2016F 2017F 2018F Net Fixed Assets 686 714 735 752 766 Invts in Associates & JVs 0 0 0 64 64 Other LT Assets 116 112 100 88 76 Cash & ST Invts 23 10 115 126 143 Inventory 30 52 32 31 31 Debtors 150 166 158 157 154 Other Current Assets 23 33 33 33 33 Total Assets 1,028 1,086 1,173 1,252 1,268 ST Debt 52 354 354 354 354 Creditor 157 146 198 196 193 Other Current Liab 65 63 63 62 60 LT Debt 250 0 0 50 50 Other LT Liabilities 109 111 111 111 111 Shareholder’s Equity 395 413 447 479 501 Minority Interests 0 0 0 0 0 Total Cap. &Liab. 1,028 1,086 1,173 1,252 1,268 Non-Cash Wkg. Capital (19) 43 (38) (37) (34) Net Cash/(Debt) (279) (344) (239) (277) (260) Debtors Turn (avg days) 49.9 49.8 53.7 52.7 52.9 Creditors Turn (avg days) 98.3 78.6 97.4 114.3 113.7 Inventory Turn (avg days) 17.3 21.2 23.6 18.4 18.3 Asset Turnover (x) 1.1 1.1 1.0 0.9 0.9 Current Ratio (x) 0.8 0.5 0.5 0.6 0.6 Quick Ratio (x) 0.6 0.3 0.4 0.5 0.5 Net Debt/Equity (X) 0.7 0.8 0.5 0.6 0.5 Net Debt/Equity ex MI (X) 0.7 0.8 0.5 0.6 0.5 Capex to Debt (%) 59.1 40.1 37.4 32.4 31.9 Z-Score (X) 4.3 4.2 4.2 3.9 3.9
Source: Company, DBS Bank
Mobile revenue has been stagnant
Higher handset sales affecting margins
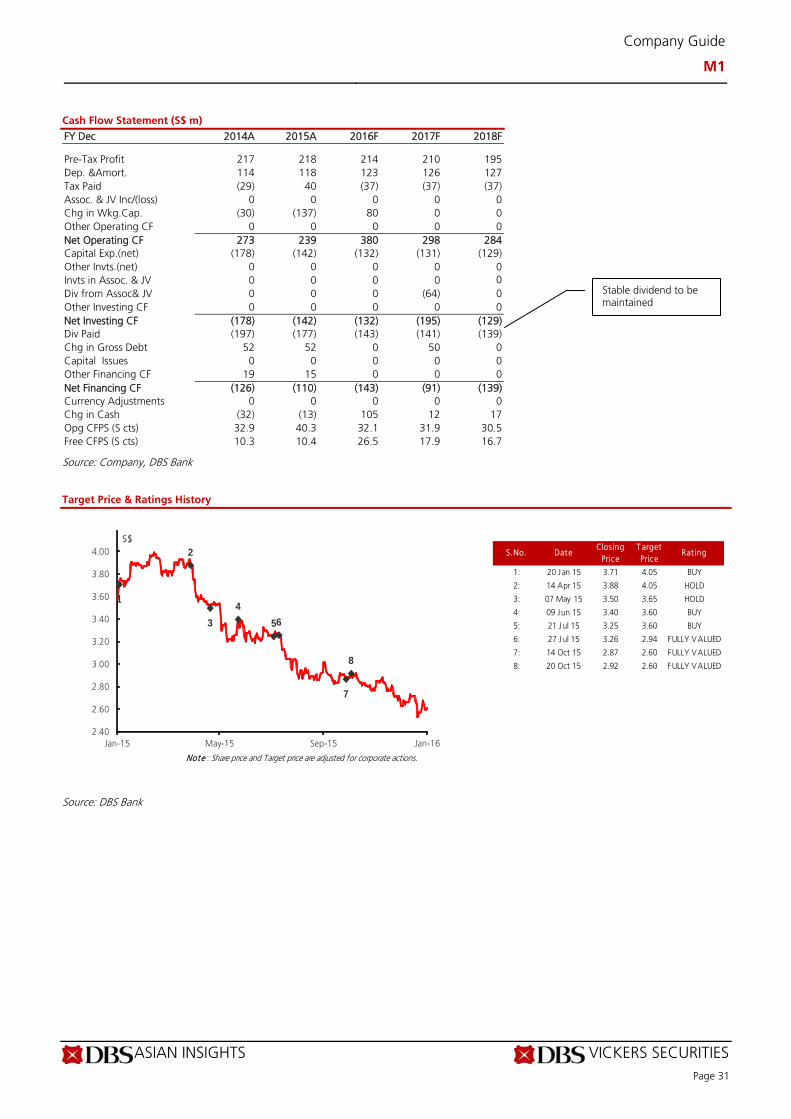
ASIAN INSIGHTS VICKERS SECURITIES Page 31
Company Guide
M1
Cash Flow Statement (S$ m)
FY Dec 2014A 2015A 2016F 2017F 2018F Pre-Tax Profit 217 218 214 210 195 Dep. &Amort. 114 118 123 126 127 Tax Paid (29) 40 (37) (37) (37) Assoc. & JV Inc/(loss) 0 0 0 0 0 Chg in Wkg.Cap. (30) (137) 80 0 0 Other Operating CF 0 0 0 0 0 Net Operating CF 273 239 380 298 284 Capital Exp.(net) (178) (142) (132) (131) (129) Other Invts.(net) 0 0 0 0 0 Invts in Assoc. & JV 0 0 0 0 0 Div from Assoc& JV 0 0 0 (64) 0 Other Investing CF 0 0 0 0 0 Net Investing CF (178) (142) (132) (195) (129) Div Paid (197) (177) (143) (141) (139) Chg in Gross Debt 52 52 0 50 0 Capital Issues 0 0 0 0 0 Other Financing CF 19 15 0 0 0 Net Financing CF (126) (110) (143) (91) (139) Currency Adjustments 0 0 0 0 0 Chg in Cash (32) (13) 105 12 17 Opg CFPS (S cts) 32.9 40.3 32.1 31.9 30.5 Free CFPS (S cts) 10.3 10.4 26.5 17.9 16.7
Source: Company, DBS Bank
Target Price & Ratings History
Source: DBS Bank
S.No. DateClosing
PriceT arget Price
Rat ing
1: 20 Jan 15 3.71 4.05 BUY
2: 14 Apr 15 3.88 4.05 HOLD
3: 07 May 15 3.50 3.65 HOLD
4: 09 Jun 15 3.40 3.60 BUY
5: 21 Jul 15 3.25 3.60 BUY
6: 27 Jul 15 3.26 2.94 FULLY VALUED
7: 14 Oct 15 2.87 2.60 FULLY VALUED
8: 20 Oct 15 2.92 2.60 FULLY VALUED
Note : Share price and Target price are adjusted for corporate actions.
1
2
3
4
56
7
8
2.40
2.60
2.80
3.00
3.20
3.40
3.60
3.80
4.00
Jan-15 May-15 Sep-15 Jan-16
S$
Stable dividend to be maintained

ASIAN INSIGHTS VICKERS SECURITIES Page 32
Industry Focus
Singapore Rigbuilders
DBS Bank recommendations are based an Absolute Total Return* Rating system, defined as follows:
STRONG BUY (>20% total return over the next 3 months, with identifiable share price catalysts within this time frame)
BUY (>15% total return over the next 12 months for small caps, >10% for large caps)
HOLD (-10% to +15% total return over the next 12 months for small caps, -10% to +10% for large caps)
FULLY VALUED (negative total return i.e. > -10% over the next 12 months)
SELL (negative total return of > -20% over the next 3 months, with identifiable catalysts within this time frame)
Share price appreciation + dividends
GENERAL DISCLOSURE/DISCLAIMER
This report is prepared by DBS Bank Ltd. This report is solely intended for the clients of DBS Bank Ltd and DBS Vickers Securities (Singapore) Pte
Ltd, its respective connected and associated corporations and affiliates (collectively, the “DBS Vickers Group”) only and no part of this document
may be (i) copied, photocopied or duplicated in any form or by any means or (ii) redistributed without the prior written consent of DBS Bank Ltd..
The research set out in this report is based on information obtained from sources believed to be reliable, but we (which collectively refers to DBS
Bank Ltd., its respective connected and associated corporations, affiliates and their respective directors, officers, employees and agents (collectively,
the “DBS Group”)) do not make any representation or warranty as to its accuracy, completeness or correctness. Opinions expressed are subject to
change without notice. This document is prepared for general circulation. Any recommendation contained in this document does not have regard
to the specific investment objectives, financial situation and the particular needs of any specific addressee. This document is for the information of
addressees only and is not to be taken in substitution for the exercise of judgement by addressees, who should obtain separate independent legal
or financial advice. The DBS Group accepts no liability whatsoever for any direct, indirect and/or consequential loss (including any claims for loss of
profit) arising from any use of and/or reliance upon this document and/or further communication given in relation to this document. This
document is not to be construed as an offer or a solicitation of an offer to buy or sell any securities. The DBS Group, along with its affiliates and/or
persons associated with any of them may from time to time have interests in the securities mentioned in this document. The DBS Group may have
positions in, and may effect transactions in securities mentioned herein and may also perform or seek to perform broking, investment banking and
other banking services for these companies.
Any valuations, opinions, estimates, forecasts, ratings or risk assessments herein constitutes a judgment as of the date of this report, and there can
be no assurance that future results or events will be consistent with any such valuations, opinions, estimates, forecasts, ratings or risk assessments.
The information in this document is subject to change without notice, its accuracy is not guaranteed, it may be incomplete or condensed and it
may not contain all material information concerning the company (or companies) referred to in this report.
The valuations, opinions, estimates, forecasts, ratings or risk assessments described in this report were based upon a number of estimates and
assumptions and are inherently subject to significant uncertainties and contingencies. It can be expected that one or more of the estimates on
which the valuations, opinions, estimates, forecasts, ratings or risk assessments were based will not materialize or will vary significantly from actual
results. Therefore, the inclusion of the valuations, opinions, estimates, forecasts, ratings or risk assessments described herein IS NOT TO BE RELIED
UPON as a representation and/or warranty by the DBS Group (and/or any persons associated with the aforesaid entities), that:
(a) such valuations, opinions, estimates, forecasts, ratings or risk assessments or their underlying assumptions will be achieved, and
(b) there is any assurance that future results or events will be consistent with any such valuations, opinions, estimates, forecasts, ratings or risk
assessments stated therein.
Any assumptions made in this report that refers to commodities, are for the purposes of making forecasts for the company (or companies)
mentioned herein. They are not to be construed as recommendations to trade in the physical commodity or in the futures contract relating to the
commodity referred to in this report.
DBS Vickers Securities (USA) Inc ("DBSVUSA")"), a U.S.-registered broker-dealer, does not have its own investment banking or research
department, has not participated in any public offering of securities as a manager or co-manager or in any other investment banking transaction
in the past twelve months and does not engage in market-making.
ANALYST CERTIFICATION
The research analyst(s) primarily responsible for the content of this research report, in part or in whole, certifies that the views about the
companies and their securities expressed in this report accurately reflect his/her personal views. The analyst(s) also certifies that no part of his/her
compensation was, is, or will be, directly, or indirectly, related to specific recommendations or views expressed in this report. As of 27 Jan 2016,
the analyst(s) and his/her spouse and/or relatives who are financially dependent on the analyst(s), do not hold interests in the securities
recommended in this report (“interest” includes direct or indirect ownership of securities).

ASIAN INSIGHTS VICKERS SECURITIES Page 33
Company Guide
Singapore Rigbuilders
COMPANY-SPECIFIC / REGULATORY DISCLOSURES
1. DBS Bank Ltd, DBS Vickers Securities (Singapore) Pte Ltd (''DBSVS''), their subsidiaries and/or other affiliates have a proprietary positions in
Keppel Corporation, Sembcorp Industries,Sembcorp Marine, M1, SingTel, StarHub, Keppel REIT. Keppel Infrastructure Trust, Keppel DC REIT
recommended in this report as of 31 Dec 2015
2. DBS Bank Ltd does not market make in equity securities of the issuer(s) or company(ies) mentioned in this Research Report.
3. DBS Bank Ltd., DBSVS, DBSVUSA, their subsidiaries and/or other affiliates beneficially own a total of 1% of any class of common equity
securities of Keppel DC REIT as of 31 Dec 2015.
4. Compensation for investment banking services:
DBS Bank Ltd., DBSVS, their subsidiaries and/or other affiliates of DBSVUSA have received compensation, within the past 12 months for
investment banking services from Keppel Corporation, Keppel REIT, Keppel Infrastructure Trust, Keppel DC REIT as of 31 Dec 2015.
DBS Bank Ltd., DBSVS, their subsidiaries and/or other affiliates of DBSVUSA have managed or co-managed a public offering of securities for
Keppel REIT, Keppel Infrastructure Trust, Keppel DC REIT in the past 12 months, as of 31 Dec 2015.
DBSVUSA does not have its own investment banking or research department, nor has it participated in any public offering of securities as a
manager or co-manager or in any other investment banking transaction in the past twelve months. Any US persons wishing to obtain further
information, including any clarification on disclosures in this disclaimer, or to effect a transaction in any security discussed in this document
should contact DBSVUSA exclusively.
5. Directorship/trustee interests:
Danny Teoh Leong Kay, a member of DBS Group Holdings Board of Directors, is a Director of Keppel Corporation as of 28 Feb 2015.
Peter Seah Lim Huat, Chairman of DBS Group Holdings, is a Director of Starhub as of 28 Feb 2015.
Nihal Vijaya Devadas Kaviratne CBE, a member of DBS Group Holdings Board of Directors, is a Director of Starhub as of 28 Feb 2015.
RESTRICTIONS ON DISTRIBUTION
General This report is not directed to, or intended for distribution to or use by, any person or entity who is a citizen or resident of or located in any locality, state, country or other jurisdiction where such distribution, publication, availability or use would be contrary to law or regulation.
Australia This report is being distributed in Australia by DBS Bank Ltd. (“DBS”) or DBS Vickers Securities (Singapore) Pte Ltd (“DBSVS”), both of which are exempted from the requirement to hold an Australian Financial Services Licence under the Corporation Act 2001 (“CA”) in respect of financial services provided to the recipients. Both DBS and DBSVS are regulated by the Monetary Authority of Singapore under the laws of Singapore, which differ from Australian laws. Distribution of this report is intended only for “wholesale investors” within the meaning of the CA.
Hong Kong This report is being distributed in Hong Kong by DBS Vickers (Hong Kong) Limited which is licensed and regulated by the Hong Kong Securities and Futures Commission.
Indonesia This report is being distributed in Indonesia by PT DBS Vickers Securities Indonesia.
Malaysia This report is distributed in Malaysia by AllianceDBS Research Sdn Bhd ("ADBSR"). Recipients of this report, received from ADBSR are to contact the undersigned at 603-2604 3333 in respect of any matters arising from or in connection with this report. In addition to the General Disclosure/Disclaimer found at the preceding page, recipients of this report are advised that ADBSR (the preparer of this report), its holding company Alliance Investment Bank Berhad, their respective connected and associated corporations, affiliates, their directors, officers, employees, agents and parties related or associated with any of them may have positions in, and may effect transactions in the securities mentioned herein and may also perform or seek to perform broking, investment banking/corporate advisory and other services for the subject companies. They may also have received compensation and/or seek to obtain compensation for broking, investment banking/corporate advisory and other services from the subject companies.
Wong Ming Tek, Executive Director, ADBSR

ASIAN INSIGHTS VICKERS SECURITIES Page 34
Industry Focus
Singapore Rigbuilders
Singapore This report is distributed in Singapore by DBS Bank Ltd (Company Regn. No. 196800306E) or DBSVS (Company Regn No. 198600294G), both of which are Exempt Financial Advisers as defined in the Financial Advisers Act and regulated by the Monetary Authority of Singapore. DBS Bank Ltd and/or DBSVS, may distribute reports produced by its respective foreign entities, affiliates or other foreign research houses pursuant to an arrangement under Regulation 32C of the Financial Advisers Regulations. Where the report is distributed in Singapore to a person who is not an Accredited Investor, Expert Investor or an Institutional Investor, DBS Bank Ltd accepts legal responsibility for the contents of the report to such persons only to the extent required by law. Singapore recipients should contact DBS Bank Ltd at 6327 2288 for matters arising from, or in connection with the report.
Thailand This report is being distributed in Thailand by DBS Vickers Securities (Thailand) Co Ltd. Research reports distributed are only intended for institutional clients only and no other person may act upon it.
United Kingdom This report is being distributed in the UK by DBS Vickers Securities (UK) Ltd, who is an authorised person in the meaning of the Financial Services and Markets Act and is regulated by The Financial Conduct Authority. Research distributed in the UK is intended only for institutional clients.
Dubai
This research report is being distributed in The Dubai International Financial Centre (“DIFC”) by DBS Bank Ltd., (DIFC Branch) having its office at PO Box 506538, 3rd Floor, Building 3, East Wing, Gate Precinct, Dubai International Financial Centre (DIFC), Dubai, United Arab Emirates. DBS Bank Ltd., (DIFC Branch) is regulated by The Dubai Financial Services Authority. This research report is intended only for professional clients (as defined in the DFSA rulebook) and no other person may act upon it.
United States This report was prepared by DBS Bank Ltd.. DBSVUSA did not participate in its preparation. The research analyst(s) named on this report are not registered as research analysts with FINRA and are not associated persons of DBSVUSA. The research analyst(s) are not subject to FINRA Rule 2241 restrictions on analyst compensation, communications with a subject company, public appearances and trading securities held by a research analyst. This report is being distributed in the United States by DBSVUSA, which accepts responsibility for its contents. This report may only be distributed to Major U.S. Institutional Investors (as defined in SEC Rule 15a-6) and to such other institutional investors and qualified persons as DBSVUSA may authorize. Any U.S. person receiving this report who wishes to effect transactions in any securities referred to herein should contact DBSVUSA directly and not its affiliate.
Other jurisdictions In any other jurisdictions, except if otherwise restricted by laws or regulations, this report is intended only for qualified, professional, institutional or sophisticated investors as defined in the laws and regulations of such jurisdictions.
DBS Bank Ltd.
12 Marina Boulevard, Marina Bay Financial Centre Tower 3 Singapore 018982 Tel. 65-6878 8888
Company Regn. No. 196800306E