Singapore Industry Focus Singapore Hospitality Singapore Hospitality Refer to important disclosures...
17
www.dbsvickers.com ed: JS/ sa: YM Prospects of rebound dimming Expected drop in Indonesia arrivals in 1H15 is significant and not to be ignored 2015 industry RevPAR to fall 5% on weaker than expected arrivals and 6% jump in hotel supply Downgrade CDREIT to HOLD - Focus on geographically diversified REITs such as ART Expected softness in Indonesian arrivals in 1H15 not to be ignored. Indonesian tourists, Singapore’s largest source market (c.20% share) fell 7% y-o-y in 2H14 and we expect further weakness in 1H15. We believe this will taper expected rebound in visitor arrivals to Singapore. In our view, a key reason for this weakness is the 25% y-o-y cut in 1H 15 seat capacities by LCCs flying from Indonesia to Singapore. This is based on our analysis of LLC seat capacity over the last three years which shows growth in Indonesian arrivals when LCCs increase capacity and conversely declines when capacity is cut. However, contrary to expectations there is limited correlation between changes in SGD-IDR exchange rate and Indonesian arrivals. New hotel supply to pressurise hotel performance; we estimate a 5% drop in 2015 RevPAR. To account for lower LLC seat capacity, we now expect a 2% y-o-y decline in Indonesian arrivals in 2015 versus 5% growth previously. This is partially offset by an expected recovery in Chinese visitors (+12.5%) which should translate to 3% growth in overall visitors to 15.5m, in line with the top end of the Singapore government’s recent 15.1m- 15.5m target. Given lower projected arrivals, our earlier hope of recovery in the hospitality market is fading. With new hotel supply (+6% y-o-y), our revised industry RevPAR is expected to fall 5% y-o-y to S$209, compared to our earlier projection of a 3% improvement. Focus on geographically diversified REITs. With a weaker than expected outlook and after incorporating our latest FX forecasts, we have reduced our FY15-17F DPU estimates for the hospitality S-REITs under our coverage by 2-8%. Likewise, this has led us to trim respective TP’s by 1-5% and downgrade our BUY recommendation for CDREIT to HOLD. Given our cautious stance on the Singapore hospitality market, we advocate investors focus on geographical diversified REITs, with ART (BUY, TP S$1.34) as our top sector pick. We also like ART for its decent growth outlook which is underpinned by its recent AEI and acquisitions. STI : 3,419.02 Analyst Mervin SONG CFA +65 6682 3715 Derek TAN +65 6682 3716 [email protected] [email protected] STOCKS Source: Bloomberg Finance L.P., DBS Bank Further cuts low cost carriers’ seat capacity points to further falls in Indonesian tourist arrivals Source: CAPA, OAG, STB, DBS Bank DBS Group Research . Equity 26 Mar 2015 Singapore Industry Focus Singapore Hospitality Refer to important disclosures at the end of this report Price Mkt Cap Target Price Performance (%) S$ US$m S$ 3 mth 12 mth Rating Ascendas Hospitality Trust 0.69 562 0.68 2.2 (4.2) HOLD Ascott Residence Trust 1.25 1,401 1.34 (1.2) 5.5 BUY CDL Hospitality Trusts 1.76 1,262 1.77 0.3 9.0 HOLD Far East Hospitality Trust 0.81 1,054 0.76 (1.2) (1.8) HOLD Frasers Hospitality Trust 0.90 781 0.93 1.1 N.A BUY OUE Hospitality Trust 0.94 911 0.98 3.9 11.9 BUY -40% -30% -20% -10% 0% 10% 20% 30% 40% 50% 60% 4Q12 1Q13 2Q13 3Q13 4Q13 1Q14 2Q14 3Q14 4Q14 1Q15 2Q15 3Q15 Total ID-SG LCC ID-SG Indonesia total arrivals FX movement y-o-y growth Negative drag from weaker IDR offset by growth in LCC seat capacity whcih stimulated Indonesian tourist arrivals Fall in Indonesian tourist arrivals despite reduced drag from FX due to cut in LCC seat capacity Continued reduction in LCC seat capacity over the 1H15 should translate to a decline in Indonesian arrivals. However, this may moderated in 2H15 due to flat y-o-y growth in seat capacity in first half of 3Q15
Transcript of Singapore Industry Focus Singapore Hospitality Singapore Hospitality Refer to important disclosures...

www.dbsvickers.com
ed: JS/ sa: YM
Prospects of rebound dimming
Expected drop in Indonesia arrivals in 1H15 issignificant and not to be ignored
2015 industry RevPAR to fall 5% on weaker thanexpected arrivals and 6% jump in hotel supply
Downgrade CDREIT to HOLD - Focus ongeographically diversified REITs such as ART
Expected softness in Indonesian arrivals in 1H15 not to be ignored. Indonesian tourists, Singapore’s largest source market (c.20% share) fell 7% y-o-y in 2H14 and we expect further weakness in 1H15. We believe this will taper expected rebound in visitor arrivals to Singapore. In our view, a key reason for this weakness is the 25% y-o-y cut in 1H 15 seat capacities by LCCs flying from Indonesia to Singapore. This is based on our analysis of LLC seat capacity over the last three years which shows growth in Indonesian arrivals when LCCs increase capacity and conversely declines when capacity is cut. However, contrary to expectations there is limited correlation between changes in SGD-IDR exchange rate and Indonesian arrivals.
New hotel supply to pressurise hotel performance; we estimate a 5% drop in 2015 RevPAR. To account for lower LLC seat capacity, we now expect a 2% y-o-y decline in Indonesian arrivals in 2015 versus 5% growth previously. This is partially offset by an expected recovery in Chinese visitors (+12.5%) which should translate to 3% growth in overall visitors to 15.5m, in line with the top end of the Singapore government’s recent 15.1m-15.5m target. Given lower projected arrivals, our earlier hope of recovery in the hospitality market is fading. With new hotel supply (+6% y-o-y), our revised industry RevPAR is expected to fall 5% y-o-y to S$209, compared to our earlier projection of a 3% improvement.
Focus on geographically diversified REITs. With a weaker than expected outlook and after incorporating our latest FX forecasts, we have reduced our FY15-17F DPU estimates for the hospitality S-REITs under our coverage by 2-8%. Likewise, this has led us to trim respective TP’s by 1-5% and downgrade our BUY recommendation for CDREIT to HOLD. Given our cautious stance on the Singapore hospitality market, we advocate investors focus on geographical diversified REITs, with ART (BUY, TP S$1.34) as our top sector pick. We also like ART for its decent growth outlook which is underpinned by its recent AEI and acquisitions.
STI : 3,419.02
Analyst Mervin SONG CFA +65 6682 3715 Derek TAN +65 6682 3716 [email protected] [email protected]
STOCKS
Source: Bloomberg Finance L.P., DBS Bank
Further cuts low cost carriers’ seat capacity points to further
falls in Indonesian tourist arrivals
Source: CAPA, OAG, STB, DBS Bank
DBS Group Research . Equity 26 Mar 2015
Singapore Industry Focus
Singapore HospitalityRefer to important disclosures at the end of this report
Price Mkt Cap Target Price Performance (%)
S$ US$m S$ 3 mth 12 mth Rating
Ascendas Hospitality Trust
0.69 562 0.68 2.2 (4.2) HOLD
Ascott Residence Trust
1.25 1,401 1.34 (1.2) 5.5 BUY
CDL Hospitality Trusts
1.76 1,262 1.77 0.3 9.0 HOLD
Far East Hospitality Trust
0.81 1,054 0.76 (1.2) (1.8) HOLD
Frasers Hospitality Trust
0.90 781 0.93 1.1 N.A BUY
OUE Hospitality Trust
0.94 911 0.98 3.9 11.9 BUY
-40%
-30%
-20%
-10%
0%
10%
20%
30%
40%
50%
60%
4Q12 1Q13 2Q13 3Q13 4Q13 1Q14 2Q14 3Q14 4Q14 1Q15 2Q15 3Q15
Total ID-SG LCC ID-SG Indonesia total arrivals FX movement
y-o-y growthNegative drag from weaker IDR offset by growth in LCC seat capacity whcih stimulated Indonesian tourist arrivals
Fall in Indonesian tourist arrivals despite reduced drag from FX due to cut in LCC seat capacity
Continued reduction in LCC seat capacity over the 1H15should translate to a decline in Indonesian arrivals. However,this may moderated in 2H15 due to flat y-o-y growth in seat capacity in first half of 3Q15

Industry Focus
Singapore Hospitality
Page 2
Analysts Mervin SONG CFA +65 6682 3715 [email protected] Derek TAN +65 6682 3716 [email protected]
Table of Contents Weakness in Indonesian visitors not to be ignored 3 Seat capacity by low cost airlines stronger predictor of arrivals 4 Base case - Expect 3% increase in 2015 tourist arrivals to 15.5m 5 DPU reversions on weaker industry outlook and FX rates 6 REIT Peer Comp 7 Stock Profiles 8 Ascott Residence Trust 9
CDL Hospitality Trusts 12

Industry Focus
Singapore Hospitality
Page 3
Weakness in Indonesian visitors not to be ignored
Overall tourist arrivals into Singapore fell 3.1% to 15.1m in 2014, largely on the back of a 24% decline in Chinese tourist arrivals. This was attributed to the widely discussed impact of tour groups avoiding South East Asia due to the political situation in Thailand and MH370 incident as well as restrictions on low cost “shopping” tours. However, we note that the fall in visitors to Singapore was also caused by a 2% decline in Indonesian visitors, which is the largest visitor source market for Singapore (estimated at c.20% of total visitor arrivals to Singapore). Looking ahead, we expect to see further weakness in arrivals from Indonesia mainly due to capacity cuts from the Low Cost Carriers (“LCCs”) which is made worse by weak IDR:SGD exchange rate.
FX provides weak explanation for decline in Indonesian arrivals
The reason for the fall in Indonesian arrivals in 2H14 has largely been cited as being caused by a weakening of the IDR versus SGD. However, based on historical correlations (since 1999) of -0.28 and R squared of 0.08, while there is some relationship between currency movements and tourist arrivals, the predictive power is not strong. Based on our analysis, FX movements do have a short term impact on arrivals only if there is more than 10% change in SGD/IDR rate and in selective cases. We saw a decline in Indonesian arrivals in 3Q14 which corresponded to significant weakening of the IDR. Nevertheless, from 3Q13-2Q14 while the IDR did weaken y-o-y, visitor arrivals from Indonesia actually increased.
Indonesia the largest market for tourists into Singapore in 2014
Source: STB, DBS Bank Decline in Indonesian arrivals primarily via air in 2H14
Source: STB, DBS Bank
Majority of Indonesian tourists arrive by plane
Source: STB, DBS Bank Weak correlation between SGDIDR and Indonesian arrivals
Source: Bloomberg Finance L.P., STB, DBS Bank
Indonesia20%
China11%
Ma laysia8%
India6%Australia
7%Philippines5%
Thailand3%
HK 3%
Vietnam3%
Japan6%
Others13%
Europe11%
US3%
-20%
-10%
0%
10%
20%
30%
40%
50%
60%
4Q12 1Q13 2Q13 3Q13 4Q13 1Q14 2Q14 3Q14 4Q14Indonesia total arrivals Indonesia by airIndonesia by sea Indonesia by land
y-o-y growthDecline in total Indonesian tourist arrivals mainly driven by fall in arrivals by air which constitutes c.60% of total arrivals. There was a decline in arrivals by land, but this only represents c.10% of total arrivals.
63% 64% 62% 59% 61% 61% 62% 61% 62% 61% 60% 57%
28% 28% 29% 31% 28% 28% 26% 28% 28% 28% 29% 33%
9% 8% 9% 10% 11% 11% 12% 11% 11% 11% 11% 10%
0%10%20%30%40%50%60%70%80%90%
100%
By Air By Sea By Land
-50%
0%
50%
100%
150%
1Q99
1Q00
1Q01
1Q02
1Q03
1Q04
1Q05
1Q06
1Q07
1Q08
1Q09
1Q10
1Q11
1Q12
1Q13
1Q14
Change in SGDIDR FX rate Change in Indonesian arrivals
y-o-y change Correlation between changes in SGDIDR FX rate and Indonesian tourists arrivals = -0.28
R2 between changes in SGDIDR FX rate and Indonesian tourists arrivals = 0.08
Industry Focus
Singapore Hospitality
Page 4
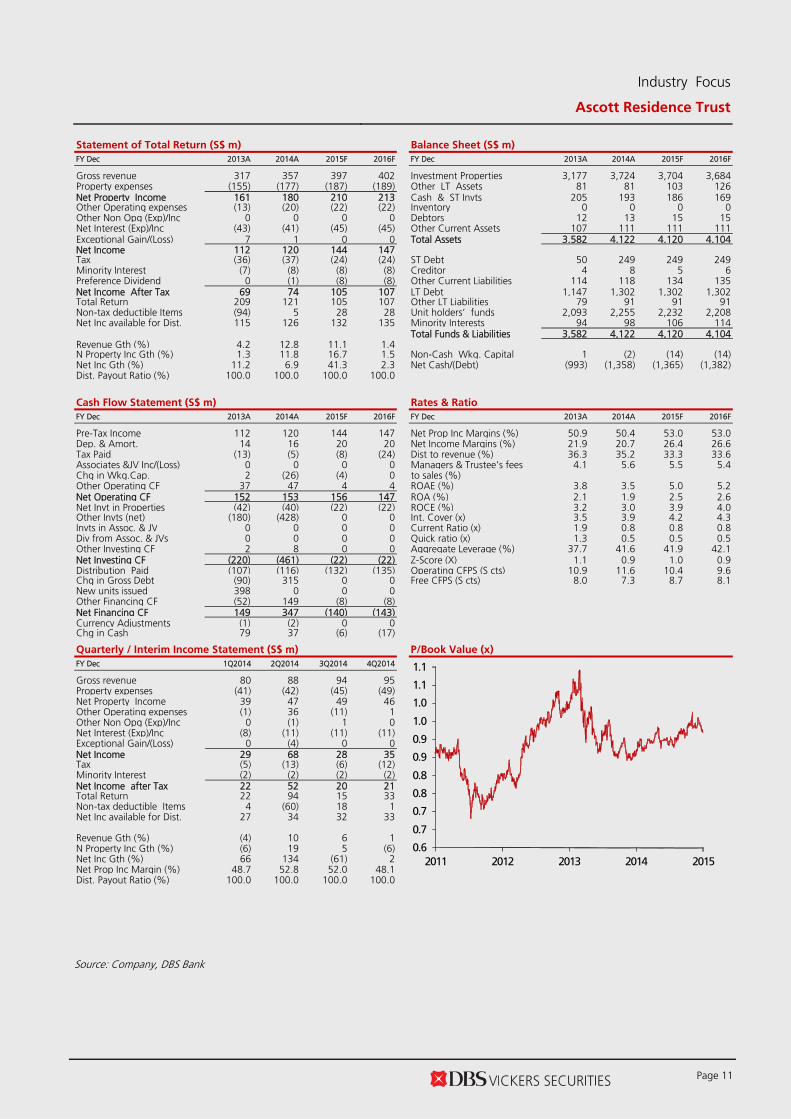
Seat capacity by low cost airlines stronger predictor of arrivals
A stronger predictor of Indonesian arrivals we believe is the growth in seat capacity by LCCs into Singapore, rather than FX movements. As seen in the table below, we have had a negative drag from FX for the last few years but tourist arrivals from Indonesia displayed robust y-o-y growth. This correlates with significant growth in seat capacity from Indonesia to Singapore, largely from low cost carriers such as Air Asia and Tiger Airways according to data from the Centre for Aviation (CAPA). We believe “cheaper” seats available have simulated the market, encouraging Indonesians to visit Singapore. From 4Q12-2Q14, Indonesian arrivals grew 1-13% y-o-y on the back of 8-47% increase in seat capacity by LCCs. Conversely, when seat capacity was reduced by 17-22% y-o-y in 3Q-4Q14, Indonesian visitors fell 6-9%.
Cut in seat capacity in 1H15 not a positive sign
Going forward, based on CAPA data, seat capacity in 1Q15 and 2Q15 from Indonesia to Singapore is projected to decline 16% and 8% y-o-y, respectively. More importantly, LCCs’ seat capacity is expected to suffer cuts of 30% and 18% over the respective quarters. We believe this would translate to decline in Indonesian and overall tourist arrivals at least in the 1H15. This weak trend can be seen in the latest January 2015 STB statistics, where Indonesian arrivals fell 17% y-o-y on the back of a 24% decline in Indonesian arrivals by air. This in combination with the still weak Chinese visitors (-25% y-o-y), saw overall number of tourists drop 7% y-o-y.
Growth in Indonesian arrivals correlates more with LCCs’ seat capacity than changes in SGD/IDR FX rate
Source: Bloomberg Finance L.P., CAPA, OAG, STB, DBS Bank LCCs’ had cut capacity in 2014 with stable capacity by non LCCs
Source: Bloomberg Finance L.P., CAPA, OAG, STB, DBS Bank
Decline in Indonesian, Chinese and overall tourists in Jan’15
Source: STB, DBS Bank AirAsia Indonesia focused on growth in 2013 but was increasingly focused on profitability from 1Q14 onwards, which led to higher average airfares
Quarter Average Fare (IDR)
y-o-y growth
Operating profit (IDR bn)
1Q13 564,725 -1.3% (42.0)
2Q13 576,507 3.1% (87.7)
3Q13 647,649 -2.5% 113.6
4Q13 572,613 -11.1% (369.1)
1Q14 522,326 -7.5% (390.4)
2Q14 611,446 6.1% (271.8)
3Q14 765,005 18.1% 76.1
4Q14 723,499 26.4% 24.0
Source: AirAsia, DBS Bank
20,000
40,000
60,000
80,000
100,000
120,000
140,000
Sep-11 Mar-12 Sep-12 Mar-13 Sep-13 Mar-14 Sep-14 Mar-15Total ID-SG LCC ID-SG Non LCC ID-SG
Total number of seats per week
Growth in seat capacity on the back of expanded air service rights between Indonesia and Singapore
Cut in capacity on weaker profitabilityof LLC's. Full service carriers such as Singapore Airlines maintain seat capacity
-60%-50%-40%-30%-20%-10%
0%10%20%
Indonesia China Total Arrivals
y-o-y growth
-40%
-30%
-20%
-10%
0%
10%
20%
30%
40%
50%
60%
4Q12 1Q13 2Q13 3Q13 4Q13 1Q14 2Q14 3Q14 4Q14 1Q15 2Q15 3Q15
Total ID-SG LCC ID-SG Indonesia total arrivals FX movement
y-o-y growthNegative drag from weaker IDR offset by growth in LCC seat capacity whcih stimulated Indonesian tourist arrivals
Fall in Indonesian tourist arrivals despite reduced drag from FX due to cut in LCC seat capacity
Continued reduction in LCC seat capacity over the 1H15should translate to a decline in Indonesian arrivals. However,this may moderated in 2H15 due to flat y-o-y growth in seat capacity in first half of 3Q15

Industry Focus
Singapore Hospitality
Page 5
Singapore government revises 2015 visitor outlook Second Trade Minister S. Iswaran in his recent parliamentary address revised the outlook for tourist arrivals in 2015. Compared to STB’s previous target of 17m visitors, the Singapore government now expects between 15.1-15.5m visitors, a 0-3% change from 15.1m visitors last year. The key reasons for the change in forecast are weaker than expected performance in 2014 (-3.1% y-o-y) and a more challenging environment given heightened competition from other tourism markets. Base case - Expect 3% increase in 2015 tourist arrivals to 15.5m
In light of our analysis of the key driver of Indonesian tourist arrivals and 12% decline in seat capacity into Singapore from Indonesia (based on CAPA data) in 1H15, we have cut our tourist arrival estimates from Indonesia from 5% growth to 2% y-o-y decline. However, we have maintained our 12.5% y-o-y increase from China tourists, as we project a recovery albeit off a low base. This bounce is half that of previous recoveries, as we expect increased competition from other markets such as Japan which benefits from a weaker JPY.
Furthermore, we expect average length of stay to remain stable at 3.7 days in 2015 based on our bottom up estimates of the top ten source markets. All in, we expect a 3% y-o-y increase in visitor arrivals and visitor days to 15.5m and 57.5m in 2015 respectively. This compares to our previous estimate of 16m visitors (+4.6% y-o-y) and 59m visitor days (+4.9% y-o-y). Cutting our RevPAR estimates on higher room supply
Combined with 5.7% increase in hotel rooms, which is weighted towards 1H15, we estimate a 5% decline in RevPAR to S$208. This is driven by a 200bps decline in occupancy to 83.4% and a 3% drop in ADR to S$250. In January 2015, overall industry RevPAR was up 1.4% y-o-y to S$207. This was driven by higher occupancies (+190bps y-o-y) as it appears hotels primarily in the mid-tier and economy categories have been lowering average room rates (-1% y-o-y to S$250) to stimulate demand.
Minimal drag from strengthening SGD versus IDR over 2015
Source: STB, DBS Bank Projecting 3% y-o-y growth in tourist arrivals in 2015: 12.5% growth in China offsetting 2% decline from Indonesia
Source: STB, DBS Bank
5.7% uplift in net hotel rooms in 2015
* Net rooms: 1Q15 – 711, 2Q15 – 1,803, 3Q15 – 30, 4Q15 – 714 Source: CDREIT, STB, DBS Bank Expect 5% dip in RevPAR to S$208 based on our DBS estimates
Source: STB, DBS Bank
55,018 3,258
3,729 1,785
45,000
50,000
55,000
60,000
65,000
70,000
2014 2015F 2016F 2017F
Rooms
Hotel rooms Expected net additions
-2% -4%
20%
13%10% 7%
-3%
3% 5% 4%
-30%
-20%
-10%
0%
10%
20%
30%
40%
2008 2009 2010 2011 2012 2013 2014 2015F 2016F 2017F
China
Indonesia
Total Visitors
y-o-y growth
0.0%
5.0%
10.0%
15.0%
20.0%
7,500
8,000
8,500
9,000
9,500
10,000
1Q13
2Q13
3Q13
4Q13
1Q14
2Q14
3Q14
4Q14
1Q15
F
2Q15
F
3Q15
F
4Q15
F
y-o-y change SGDIDR
83.0%
83.5%
84.0%
84.5%
85.0%
85.5%
86.0%
86.5%
0
50
100
150
200
250
300
2013 2014 2015F 2016F 2017F
ADR (S$) RevPAR (S$) Occupancy

Industry Focus
Singapore Hospitality
Page 6
Further declines in RevPAR if visitor arrivals do not come through as expected Based on a stable average length of stay of 3.7 days and 3,258 net rooms to be added in 2015 (5.7% y-o-y growth), we project 12% y-o-y decline in RevPAR to S$194 if there is no recovery and Singapore registers 15.1m visitors in 2015, the bottom end of the government’s target.
DPU reversions on weaker industry outlook and FX rates
On the back of a weaker hospitality outlook for Singapore this year and incorporating our new FX forecasts, we have reduced our DPU estimates for the hospitality REITs by 2-8%. The changes are detailed in the table below. Downgrade CDREIT to HOLD On the back of lower projected earnings, we have likewise trimmed our TP’s by 1-5%. We have also downgraded CDREIT to HOLD (from Buy) on valuation grounds and their exposure to the Singapore market.
Focus on geographically diversified REITs – Top pick ART Given the more challenging conditions in Singapore, we recommend investors focus on hospitality REITs with geographically diversified portfolios, with ART (BUY, TP S$1.34) as our top pick. We also like ART for its decent growth outlook which is underpinned by AEI and acquisitions made over the last 12 months. We also remain positive on OUEHT (BUY, TP S$0.97) on the back of an attractive 7.3% yield. In addition, while we acknowledge OUEHT’s hotels may be impacted by a weaker operating environment, it is partially insulated given Mandarin Orchard’s prime position and more up market Indonesian clientele. Moreover, OUEHT should be benefit from the recent Crown Plaza Changi acquisition.
DBS FX forecasts
Avg - Yr end Dec 2015F 2016F 2017F USDSGD 1.39 1.42 1.43 SGDJPY 87.74 87.69 87.69 SGDCNY 4.54 4.52 4.52 SGDHKD 5.59 5.48 5.48 SGDMYR 2.66 2.64 2.64 AUDSGD 1.02 0.99 1.00 EURSGD 1.47 1.43 1.43
Source: DBS Bank Changes in DPU estimates
Previous DPU New DPU Change
FY15
/16F
FY16
/17F
FY15
/16F
FY16
/17F
FY15
/16F
FY16
/17F
ASCHT 6.0 6.0 5.9 5.8 -2% -2%
ART 8.8 8.9 8.6 8.8 -2% -2%
CDREIT 11.7 12.0 11.2 11.3 -5% -6%
FEHT 5.3 5.3 5.0 4.9 -6% -8%
FHT 6.2 6.2 6.1 6.1 -2% -3%
OUEHT 7.1 7.3 6.8 6.9 -4% -5%
Source: DBS Bank
Revised TP/Recommendations
Recommendation Target Price
New Previous New Previous
ASCHT 0.68 0.70 Hold Hold
ART 1.34 1.37 Buy Buy
CDREIT 1.77 1.86 Hold Buy
FEHT 0.76 0.80 Hold Hold
FHT 0.93 0.94 Buy Buy
OUEHT 0.98 1.02 Buy Buy
Source: DBS Bank

Industry Focus
Singapore Hospitality
Page 7
REIT peer comp
REIT Price Rec Target Price
Total Return
Mkt Cap Yield
DPU CAGR P/Bk (x) P/Bk (x) P/Bk (x)
(S$) (S$) (%) S$'m FY14/15F FY15/16F FY16/17F FY14-
16 FY14/15F FY15/16F FY16/17F Office CCT 1.75 Hold 1.81 9% 5,157 4.8% 5.2% 5.8% 9.5% 1.00 1.00 1.01 FCOT 1.45 Buy 1.53 13% 987 5.8% 7.0% 7.1% 10.1% 0.90 0.91 0.92 KREIT 1.19 Hold 1.29 14% 3,781 6.1% 5.6% 5.7% -2.9% 0.76 0.84 0.85 OUECT 0.80 NR 0.85 13% 698 6.8% 6.8% 7.0% 0.5% 0.81 0.83 0.85
5.5% 5.6% 6.0% 4.6% Retail CRCT 1.61 Hold 1.64 9% 1,333 6.1% 6.8% 7.4% 9.8% 0.99 1.01 1.04 CMT 2.17 Hold 2.19 6% 7,515 5.0% 5.2% 5.4% 3.8% 1.20 1.19 1.19 CRT 0.94 Buy 1.00 15% 483 8.8% 8.5% 8.3% -2.4% 1.10 1.16 1.18 FCT 2.02 Buy 2.05 7% 1,851 5.5% 5.7% 5.8% 2.3% 1.02 1.09 1.09 SPH REIT 1.04 Hold 1.03 4% 2,623 5.7% 5.2% 5.3% -4.0% 1.11 1.12 1.13
5.4% 5.6% 5.7% 2.5% Commercial MCT 1.60 Buy 1.63 7% 3,379 5.0% 5.3% 5.6% 5.8% 1.38 1.38 1.39 MAGIC 1.05 Buy 1.12 14% 2,843 6.2% 6.7% 6.8% 4.2% 0.94 0.95 0.96 SGREIT 0.83 Buy 0.88 13% 1,776 6.1% 6.2% 6.6% 3.8% 0.87 0.87 0.87 Suntec 1.88 Hold 1.84 3% 4,712 5.0% 5.3% 5.7% 6.9% 0.87 0.91 0.93
5.4% 5.7% 6.0% 5.6% Industrial a-itrust 0.92 Buy 0.96 11% 843 5.2% 6.0% 6.1% 7.9% 1.49 1.50 1.50 A-REIT 2.54 Buy 2.62 9% 6,110 5.8% 5.9% 6.0% 1.8% 1.26 1.27 1.27 Cache 1.16 Buy 1.29 19% 907 7.4% 7.4% 7.6% 1.6% 1.18 1.20 1.21 CREIT 0.71 Hold 0.73 11% 901 7.1% 7.1% 7.2% 0.5% 1.03 1.04 1.04 MINT 1.56 Buy 1.66 14% 2,717 6.6% 6.8% 6.8% 1.9% 1.30 1.30 1.31 MLT 1.23 Hold 1.27 10% 3,043 6.1% 6.2% 6.4% 2.3% 1.27 1.27 1.27 SBREIT 0.81 Buy 0.92 21% 661 7.6% 7.9% 8.1% 3.1% 1.01 1.01 1.01
6.2% 6.4% 6.5% 2.2% Hospitality ASCHT 0.69 Hold 0.68 7% 768 7.8% 8.5% 8.5% 4.5% 0.99 0.99 0.99 ART 1.25 Buy 1.34 15% 1,914 6.6% 6.9% 7.0% 3.4% 0.91 0.92 0.93 CDREIT 1.76 Hold 1.77 7% 1,724 6.3% 6.4% 6.4% 1.3% 1.07 1.07 1.08 FEHT 0.81 Hold 0.76 0% 1,440 6.3% 6.1% 6.1% -2.1% 0.84 0.84 0.84 FHT 0.90 Buy 0.93 10% 1,067 6.6% 6.8% 6.8% 1.4% 1.09 1.10 1.11 OUEHT 0.94 Buy 0.98 11% 1,245 7.2% 7.3% 7.4% 1.5% 1.04 1.05 1.06
6.7% 6.9% 6.9% 1.5% Healthcare P-Life 2.40 Buy 2.66 16% 1,452 4.8% 5.0% 5.1% 2.9% 1.40 1.40 1.40 RHT 1.09 Hold 1.06 5% 862 7.5% 7.0% 7.9% 2.0% 1.24 1.27 1.31
5.8% 5.8% 6.1% 2.6% Others IREIT 0.78 Buy 0.90 23% 328 8.6% 8.1% 7.8% -5.0% 1.09 1.10 1.11 KDCREIT 1.00 Buy 1.05 11% 883 5.4% 6.4% 6.7% 11.3% 1.12 1.12 1.12
Sector Average 64,004 6.1% 6.3% 6.5% 3.2% 1.11 1.11 1.12 Source: Bloomberg Finance L.P., DBS Bank

Industry Focus
Singapore Hospitality
Page 8
STOCK PROFILES

Page 9
www.dbsvickers.com ed: TH / sa: YM
BUY S$1.25 STI : 3,419.02 Price Target : 12-Month S$ 1.34 (Prev S$ 1.37) Potential Catalyst: Acquisitions DBSV vs Consensus: In line Analyst Mervin SONG CFA +65 6682 3715 [email protected] Derek TAN +65 6682 3716 [email protected]
Price Relative
7 9
9 9
1 1 9
1 3 9
1 5 9
1 7 9
1 9 9
2 1 9
0 . 8
0 . 9
1 . 0
1 . 1
1 . 2
1 . 3
1 . 4
1 . 5
1 . 6
1 . 7
M a r -1 1 M a r - 1 2 M a r - 1 3 M a r - 1 4 M a r - 1 5
R e l a t i v e I n d e xS $
A s c o t t R e s id e n c e Tr u s t ( L H S ) R e la t iv e S T I IN D E X ( R H S ) Forecasts and Valuation FY Dec (S$ m) 2013A 2014A 2015F 2016F
Gross Revenue 317 357 397 402 Net Property Inc 161 180 210 213 Total Return 209 121 105 107 Distribution Inc 115 126 132 135 EPU (S cts) 5.1 4.8 6.8 7.0 EPU Gth (%) (8) (5) 41 2 DPU (S cts) 8.4 8.2 8.6 8.8 DPU Gth (%) (4) (2) 5 2 NAV per shr (S cts) 137.5 137.2 135.5 133.4 PE (X) 24.5 25.8 18.3 17.9 Distribution Yield (%) 6.7 6.6 6.9 7.0P/NAV (x) 0.9 0.9 0.9 0.9Aggregate Leverage (%) 37.7 41.6 41.9 42.1 ROAE (%) 3.8 3.5 5.0 5.2 Distn. Inc Chng (%): (1.7) (2.0) Consensus DPU (S cts): 8.7 8.8 Other Broker Recs: B: 7 S: 1 H: 4 ICB Industry : Real Estate ICB Sector: Real Estate Investment Trust Principal Business: Pan-Asian service residence real estate investment trust
Source of all data: Company, DBS Bank, Bloomberg Finance L.P.
At A Glance Issued Capital (m shrs) 1,538 Mkt. Cap (S$m/US$m) 1,914 / 1,401 Major Shareholders Capitaland (%) 45.9 Free Float (%) 54.1 Avg. Daily Vol.(‘000) 1,224
Industry Focus
Ascott Residence Trust Bloomberg: ART SP | Reuters: ASRT.SI Refer to important disclosures at the end of this repor
DBS Group Research . Equity 26 Mar 2015
Upside from acquisitions 2015 a year of gestation with selective growth
opportunities from the sponsor
Income volatility limited as overseas income (EUR/JPY/GBP) are substantially hedged
Maintain BUY with TP of S$1.34
Acquisition-driven growth. After an active year in 2014, acquiring nine properties with an aggregate property value of S$559.1m, we see 2015 as a year of gestation and growth as the REIT continues to churn stable returns from an expanded portfolio. We forecast a 3.4% CAGR growth in DPU over FY15-16. Upside from acquisitions not factored in yet. Sponsor the Ascott Group is one of the largest operators and owners of serviced residence globally. Backed by a global operational footprint, this enables the REIT to tap on its operational expertise and wide clientele reach. In addition, the Sponsor offers a visible pipeline of properties that Ascott REIT could acquire opportunistically in the medium term. Hedging foreign income; potential refinancing savings. The manager has proactively taken income hedges for its exposures in EUR, GBP and JPY, which collectively contribute to c.50% of its revenues, limiting near-term impact from currency volatility. With only a S$150m loan due to expire in 2015, Ascott REIT remains in a strong financial position. In addition, as the manager intends to take on more foreign currency loans as natural hedges against its overseas exposures (mainly in EUR/JPY), the manager expects to see savings during refinancing, given declining rates there. Maintain BUY, TP of S$1.34. Our TP and earnings are tweaked slightly to account for revised RevPAR estimates. We continue to like Ascott REIT’s diversity and potential for earnings surprise through acquisitions. Stock remains attractive at 0.9x P/Bk with a yield of c. 6.9-7.0%.
Industry Focus
Ascott Residence Trust
Page 10
INVESTMENT THESIS
Profile Rationale
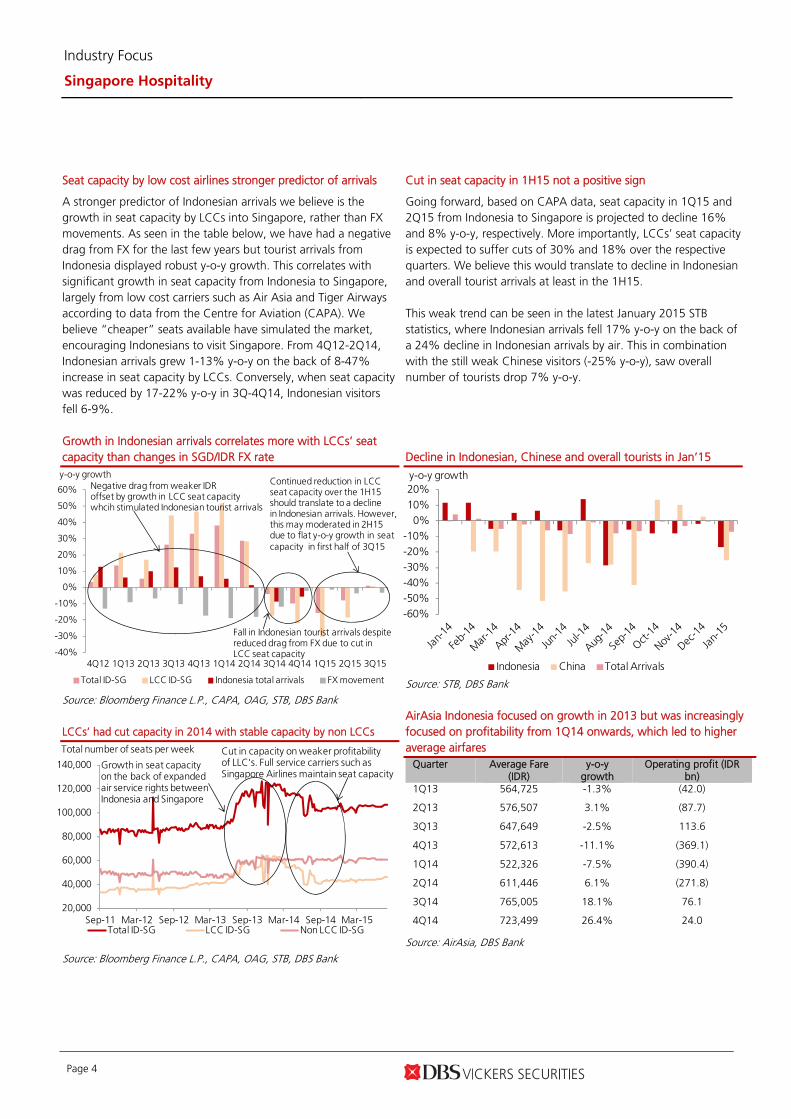
Ascott REIT's Investment portfolio primarily comprises real estate used mainly as serviced residences or rental housing properties (including investments in real estate-related assets and/or other related value-enhancing assets or instruments).
Diversified assets across Asia Pacific and Europe Portfolio of serviced residences and rental housing located
across 25 cities in 12 countries in the Asia Pacific and Europe. The diversity enables ART to see minimal impact from differences in seasonality in travel periods.
Asset enhancements to drive earnings growth Completions of the refurbishments and asset enhancement
initiatives at various properties in Jakarta, Philippines and Europe would result in higher room rates, a key earnings growth driver.
Strong sponsor support Sponsor is Ascott Group, one of the largest operators and
owners of serviced residences globally, which enables the REIT to tap on its expertise in operations and industry best practices. Sponsor is currently operating and constructing a number of serviced residences globally, which offers ART a visible acquisition pipeline in the medium term.
Valuation Risks
Owing to a slight reduction in our earnings forecasts, we have lowered our DCF-based TP to S$1.34 from S$1.37. Maintain BUY, given its attractive yield of c.7.0%.
Interest rate risks Any increase in interest rates will result in higher interest
payments and reduce the income available for distribution, which will result in lower distribution per unit (DPU) for unitholders.
Currency risk As ART earns rental income in various currencies, a
depreciation of any foreign currency against the SGD could negatively impact DPU.
Earnings risk We have assumed S$350m worth of acquisitions @ 6.0%
yield in 2014. Any delay or the failure by the company to achieve this forecast will likely cause downside to potential earnings.
Source: DBS Bank
Industry Focus
Ascott Residence Trust
Page 11
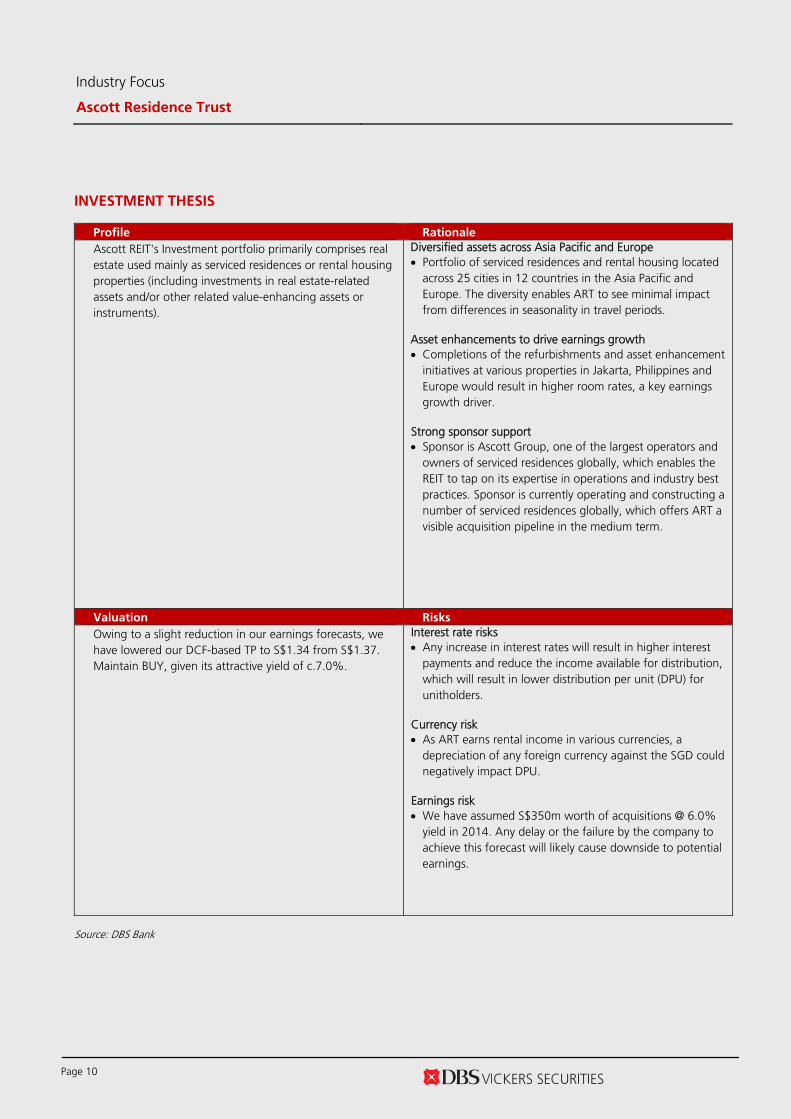
Statement of Total Return (S$ m) Balance Sheet (S$ m)
FY Dec 2013A 2014A 2015F 2016F FY Dec 2013A 2014A 2015F 2016F
Gross revenue 317 357 397 402 Investment Properties 3,177 3,724 3,704 3,684 Property expenses (155) (177) (187) (189) Other LT Assets 81 81 103 126 Net Property Income 161 180 210 213 Cash & ST Invts 205 193 186 169 Other Operating expenses (13) (20) (22) (22) Inventory 0 0 0 0 Other Non Opg (Exp)/Inc 0 0 0 0 Debtors 12 13 15 15 Net Interest (Exp)/Inc (43) (41) (45) (45) Other Current Assets 107 111 111 111 Exceptional Gain/(Loss) 7 1 0 0 Total Assets 3,582 4,122 4,120 4,104 Net Income 112 120 144 147 Tax (36) (37) (24) (24) ST Debt 50 249 249 249 Minority Interest (7) (8) (8) (8) Creditor 4 8 5 6 Preference Dividend 0 (1) (8) (8) Other Current Liabilities 114 118 134 135 Net Income After Tax 69 74 105 107 LT Debt 1,147 1,302 1,302 1,302 Total Return 209 121 105 107 Other LT Liabilities 79 91 91 91 Non-tax deductible Items (94) 5 28 28 Unit holders’ funds 2,093 2,255 2,232 2,208 Net Inc available for Dist. 115 126 132 135 Minority Interests 94 98 106 114 Total Funds & Liabilities 3,582 4,122 4,120 4,104 Revenue Gth (%) 4.2 12.8 11.1 1.4 N Property Inc Gth (%) 1.3 11.8 16.7 1.5 Non-Cash Wkg. Capital 1 (2) (14) (14) Net Inc Gth (%) 11.2 6.9 41.3 2.3 Net Cash/(Debt) (993) (1,358) (1,365) (1,382) Dist. Payout Ratio (%) 100.0 100.0 100.0 100.0 Cash Flow Statement (S$ m) Rates & Ratio
FY Dec 2013A 2014A 2015F 2016F FY Dec 2013A 2014A 2015F 2016F
Pre-Tax Income 112 120 144 147 Net Prop Inc Margins (%) 50.9 50.4 53.0 53.0 Dep. & Amort. 14 16 20 20 Net Income Margins (%) 21.9 20.7 26.4 26.6 Tax Paid (13) (5) (8) (24) Dist to revenue (%) 36.3 35.2 33.3 33.6 Associates &JV Inc/(Loss) 0 0 0 0 Managers & Trustee’s fees 4.1 5.6 5.5 5.4 Chg in Wkg.Cap. 2 (26) (4) 0 to sales (%) Other Operating CF 37 47 4 4 ROAE (%) 3.8 3.5 5.0 5.2 Net Operating CF 152 153 156 147 ROA (%) 2.1 1.9 2.5 2.6 Net Invt in Properties (42) (40) (22) (22) ROCE (%) 3.2 3.0 3.9 4.0 Other Invts (net) (180) (428) 0 0 Int. Cover (x) 3.5 3.9 4.2 4.3 Invts in Assoc. & JV 0 0 0 0 Current Ratio (x) 1.9 0.8 0.8 0.8 Div from Assoc. & JVs 0 0 0 0 Quick ratio (x) 1.3 0.5 0.5 0.5 Other Investing CF 2 8 0 0 Aggregate Leverage (%) 37.7 41.6 41.9 42.1 Net Investing CF (220) (461) (22) (22) Z-Score (X) 1.1 0.9 1.0 0.9 Distribution Paid (107) (116) (132) (135) Operating CFPS (S cts) 10.9 11.6 10.4 9.6 Chg in Gross Debt (90) 315 0 0 Free CFPS (S cts) 8.0 7.3 8.7 8.1 New units issued 398 0 0 0 Other Financing CF (52) 149 (8) (8) Net Financing CF 149 347 (140) (143) Currency Adjustments (1) (2) 0 0 Chg in Cash 79 37 (6) (17) Quarterly / Interim Income Statement (S$ m) P/Book Value (x)
FY Dec 1Q2014 2Q2014 3Q2014 4Q2014
0.6
0.7
0.7
0.8
0.8
0.9
0.9
1.0
1.0
1.1
1.1
2011 2012 2013 2014 2015
Gross revenue 80 88 94 95 Property expenses (41) (42) (45) (49) Net Property Income 39 47 49 46 Other Operating expenses (1) 36 (11) 1 Other Non Opg (Exp)/Inc 0 (1) 1 0 Net Interest (Exp)/Inc (8) (11) (11) (11) Exceptional Gain/(Loss) 0 (4) 0 0 Net Income 29 68 28 35 Tax (5) (13) (6) (12) Minority Interest (2) (2) (2) (2) Net Income after Tax 22 52 20 21 Total Return 22 94 15 33 Non-tax deductible Items 4 (60) 18 1 Net Inc available for Dist. 27 34 32 33 Revenue Gth (%) (4) 10 6 1 N Property Inc Gth (%) (6) 19 5 (6) Net Inc Gth (%) 66 134 (61) 2 Net Prop Inc Margin (%) 48.7 52.8 52.0 48.1 Dist. Payout Ratio (%) 100.0 100.0 100.0 100.0 Source: Company, DBS Bank
Page 12
www.dbsvickers.com ed: TH / sa: YM
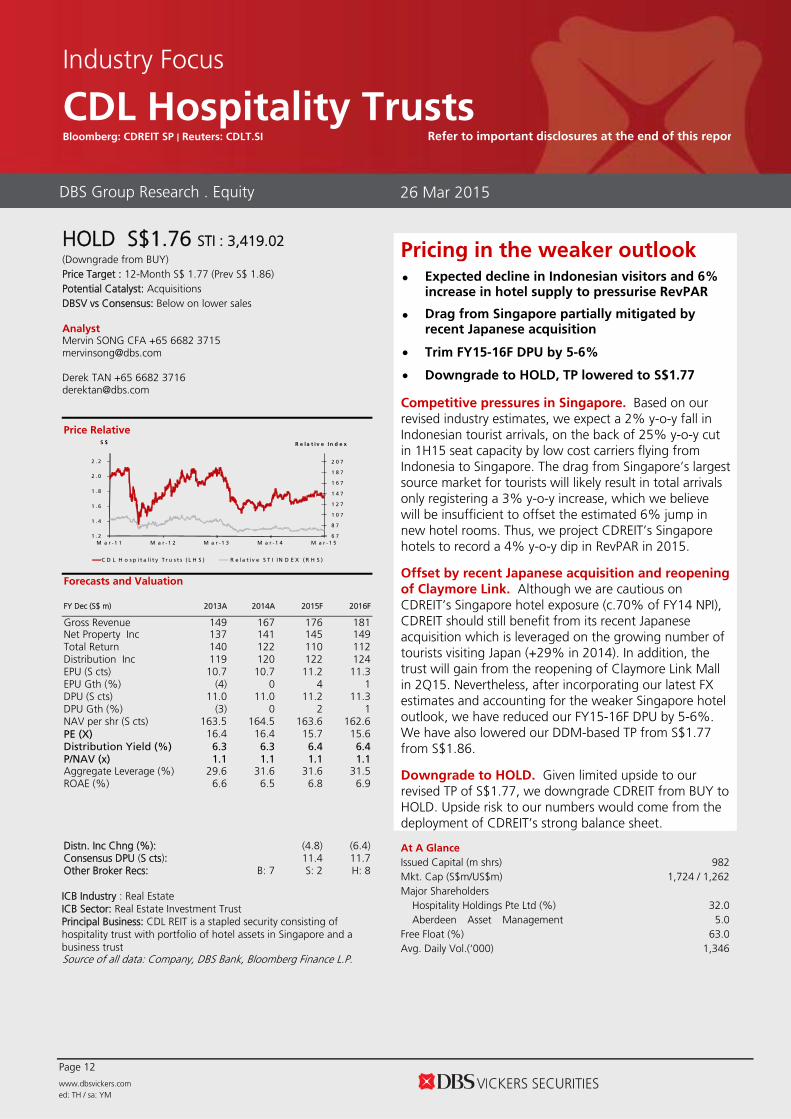
HOLD S$1.76 STI : 3,419.02 (Downgrade from BUY) Price Target : 12-Month S$ 1.77 (Prev S$ 1.86) Potential Catalyst: Acquisitions DBSV vs Consensus: Below on lower sales Analyst Mervin SONG CFA +65 6682 3715 [email protected] Derek TAN +65 6682 3716 [email protected]
Price Relative
6 7
8 7
1 0 7
1 2 7
1 4 7
1 6 7
1 8 7
2 0 7
1 . 2
1 . 4
1 . 6
1 . 8
2 . 0
2 . 2
M a r -1 1 M a r - 1 2 M a r - 1 3 M a r - 1 4 M a r - 1 5
R e l a t i v e I n d e xS $
C D L H o s p i t a l i t y T r u s t s ( L H S ) R e la t iv e S T I IN D E X ( R H S ) Forecasts and Valuation FY Dec (S$ m) 2013A 2014A 2015F 2016F
Gross Revenue 149 167 176 181 Net Property Inc 137 141 145 149 Total Return 140 122 110 112 Distribution Inc 119 120 122 124 EPU (S cts) 10.7 10.7 11.2 11.3 EPU Gth (%) (4) 0 4 1 DPU (S cts) 11.0 11.0 11.2 11.3 DPU Gth (%) (3) 0 2 1 NAV per shr (S cts) 163.5 164.5 163.6 162.6 PE (X) 16.4 16.4 15.7 15.6 Distribution Yield (%) 6.3 6.3 6.4 6.4P/NAV (x) 1.1 1.1 1.1 1.1Aggregate Leverage (%) 29.6 31.6 31.6 31.5 ROAE (%) 6.6 6.5 6.8 6.9 Distn. Inc Chng (%): (4.8) (6.4) Consensus DPU (S cts): 11.4 11.7 Other Broker Recs: B: 7 S: 2 H: 8 ICB Industry : Real Estate ICB Sector: Real Estate Investment Trust Principal Business: CDL REIT is a stapled security consisting of hospitality trust with portfolio of hotel assets in Singapore and a business trust Source of all data: Company, DBS Bank, Bloomberg Finance L.P.
At A Glance Issued Capital (m shrs) 982 Mkt. Cap (S$m/US$m) 1,724 / 1,262 Major Shareholders Hospitality Holdings Pte Ltd (%) 32.0 Aberdeen Asset Management
5.0
Free Float (%) 63.0 Avg. Daily Vol.(‘000) 1,346
Industry Focus
CDL Hospitality Trusts Bloomberg: CDREIT SP | Reuters: CDLT.SI Refer to important disclosures at the end of this repor
DBS Group Research . Equity 26 Mar 2015
Pricing in the weaker outlook Expected decline in Indonesian visitors and 6%
increase in hotel supply to pressurise RevPAR
Drag from Singapore partially mitigated by recent Japanese acquisition
Trim FY15-16F DPU by 5-6%
Downgrade to HOLD, TP lowered to S$1.77 Competitive pressures in Singapore. Based on our revised industry estimates, we expect a 2% y-o-y fall in Indonesian tourist arrivals, on the back of 25% y-o-y cut in 1H15 seat capacity by low cost carriers flying from Indonesia to Singapore. The drag from Singapore’s largest source market for tourists will likely result in total arrivals only registering a 3% y-o-y increase, which we believe will be insufficient to offset the estimated 6% jump in new hotel rooms. Thus, we project CDREIT’s Singapore hotels to record a 4% y-o-y dip in RevPAR in 2015. Offset by recent Japanese acquisition and reopening of Claymore Link. Although we are cautious on CDREIT’s Singapore hotel exposure (c.70% of FY14 NPI), CDREIT should still benefit from its recent Japanese acquisition which is leveraged on the growing number of tourists visiting Japan (+29% in 2014). In addition, the trust will gain from the reopening of Claymore Link Mall in 2Q15. Nevertheless, after incorporating our latest FX estimates and accounting for the weaker Singapore hotel outlook, we have reduced our FY15-16F DPU by 5-6%. We have also lowered our DDM-based TP from S$1.77 from S$1.86. Downgrade to HOLD. Given limited upside to our revised TP of S$1.77, we downgrade CDREIT from BUY to HOLD. Upside risk to our numbers would come from the deployment of CDREIT’s strong balance sheet.

Industry Focus
CDL Hospitality Trusts
Page 13
INVESTMENT THESIS
Profile Rationale
CDL Hospitality Trusts is a stapled group comprising H-REIT and HBT. H-REIT is a real estate investment trust that invests in a portfolio of income-producing hospitality related properties and HBT is a business trust.
One of the leading hotel owners in Singapore CDREIT is one of the largest hotel owners in Singapore
with a market share of 6%, catering to a diverse group of corporate and leisure travellers. Its hotel portfolio is mainly in the mid-tier and upscale segments, largely located near the Central Business District and Orchard Road areas.
Headwinds from expected decline in Indonesian tourist arrivals and 6% in new hotel room supply We expect CDREIT’s core Singapore properties (c.70% of
FY14 NPI) to face headwinds from a more competitive market this year. We believe a projected 3% increase in tourist arrivals this year (which could have been higher if not for a 2% decline Indonesian arrivals) will be insufficient to offset the 6% increase in new hotel rooms.
Strong sponsor support CDREIT’s sponsor is London-listed Millennium &
Copthorne PLC (M&C), which enables CDREIT to tap on its business and supplier networks to generate operational efficiencies.
Valuation Risks
Our target price of S$1.77 is based on the dividend discount model. With limited upside to our revised TP, we downgrade CDREIT from BUY to HOLD.
Interest rate risk Any increase in interest rates will result in higher interest
payments, which could result in lower distribution per unit (DPU) for unitholders.
Currency risk As CDREIT earns rental income from various currencies, a
depreciation of any foreign currency against the SGD could negatively impact distribution income, which is distributed in SGD.
Source: DBS Bank
Industry Focus
CDL Hospitality Trusts
Page 14
Statement of Total Return (S$ m) Balance Sheet (S$ m)
FY Dec 2013A 2014A 2015F 2016F FY Dec 2013A 2014A 2015F 2016F
Gross revenue 149 167 176 181 Investment Properties 2,162 2,206 2,209 2,212 Property expenses (11) (26) (31) (32) Other LT Assets 77 146 146 146 Net Property Income 137 141 145 149 Cash & ST Invts 69 76 77 78 Other Operating expenses (14) (18) (15) (15) Inventory 0 0 0 0 Other Non Opg (Exp)/Inc 0 0 0 0 Debtors 15 20 21 22 Net Interest (Exp)/Inc (17) (16) (17) (19) Other Current Assets 0 1 1 1 Exceptional Gain/(Loss) 0 0 0 0 Total Assets 2,323 2,450 2,455 2,459 Net Income 106 106 113 115 Tax (3) (1) (3) (3) ST Debt 146 317 317 317 Minority Interest 0 0 0 0 Creditor 22 40 42 43 Preference Dividend 0 0 0 0 Other Current Liabilities 0 1 4 7 Net Income After Tax 104 105 110 112 LT Debt 542 458 458 458 Total Return 140 122 110 112 Other LT Liabilities 17 19 19 19 Non-tax deductible Items (1) 11 12 12 Unit holders’ funds 1,595 1,616 1,616 1,616 Net Inc available for Dist. 119 120 122 124 Minority Interests 0 0 0 0 Total Funds & Liabilities 2,323 2,450 2,455 2,459 Revenue Gth (%) (0.5) 12.1 5.3 3.1 N Property Inc Gth (%) (1.4) 2.3 3.2 2.5 Non-Cash Wkg. Capital (7) (19) (23) (26) Net Inc Gth (%) (3.2) 1.0 5.1 1.4 Net Cash/(Debt) (620) (698) (698) (697) Dist. Payout Ratio (%) 90.0 90.0 90.0 90.0 Cash Flow Statement (S$ m) Rates & Ratio
FY Dec 2013A 2014A 2015F 2016F FY Dec 2013A 2014A 2015F 2016F
Pre-Tax Income 106 106 113 115 Net Prop Inc Margins (%) 92.3 84.2 82.5 82.1 Dep. & Amort. 0 0 0 0 Net Income Margins (%) 69.7 62.8 62.7 61.7 Tax Paid 0 0 0 0 Dist to revenue (%) 79.7 71.6 69.7 68.5 Associates &JV Inc/(Loss) 0 0 0 0 Managers & Trustee’s fees 9.6 10.7 8.5 8.4 Chg in Wkg.Cap. (2) 4 1 1 to sales (%) Other Operating CF 27 30 0 0 ROAE (%) 6.6 6.5 6.8 6.9 Net Operating CF 131 139 114 115 ROA (%) 4.7 4.4 4.5 4.5 Net Invt in Properties (181) (93) (3) (3) ROCE (%) 5.4 5.1 5.3 5.4 Other Invts (net) 0 0 0 0 Int. Cover (x) 7.4 7.5 7.6 7.1 Invts in Assoc. & JV 0 0 0 0 Current Ratio (x) 0.5 0.3 0.3 0.3 Div from Assoc. & JVs 0 0 0 0 Quick ratio (x) 0.5 0.3 0.3 0.3 Other Investing CF 0 0 0 0 Aggregate Leverage (%) 29.6 31.6 31.6 31.5 Net Investing CF (181) (93) (3) (3) Z-Score (X) 1.9 1.6 1.6 1.6 Distribution Paid (107) (106) (110) (112) Operating CFPS (S cts) 13.7 13.9 11.5 11.6 Chg in Gross Debt 167 83 0 0 Free CFPS (S cts) (5.2) 4.7 11.3 11.3 New units issued 0 0 0 0 Other Financing CF (16) (17) 0 0 Net Financing CF 43 (39) (110) (112) Currency Adjustments 0 0 0 0 Chg in Cash (7) 8 1 0 Quarterly / Interim Income Statement (S$ m) P/Book Value (x)
FY Dec 1Q2014 2Q2014 3Q2014 4Q2014
0.8
0.9
1.0
1.1
1.2
1.3
1.4
2011 2012 2013 2014 2015
Gross revenue 44 38 37 45 Property expenses (7) (7) (3) (6) Net Property Income 37 31 34 39 Other Operating expenses (4) (4) (4) (5) Other Non Opg (Exp)/Inc 0 0 0 0 Net Interest (Exp)/Inc (4) (4) (5) (3) Exceptional Gain/(Loss) 0 0 0 0 Net Income 29 23 25 31 Tax 0 (1) 0 0 Minority Interest 0 0 0 0 Net Income after Tax 28 22 25 30 Total Return 0 0 0 0 Non-tax deductible Items 2 5 4 (17) Net Inc available for Dist. 30 27 28 31 Revenue Gth (%) 11 (13) (3) 23 N Property Inc Gth (%) 1 (15) 8 14 Net Inc Gth (%) 7 (22) 12 23 Net Prop Inc Margin (%) 83.9 82.8 92.2 85.7 Dist. Payout Ratio (%) 90.0 90.0 90.0 90.0 Source: Company, DBS Bank

Industry Focus
Singapore Hospitality
Page 15
DBS Bank recommendations are based an Absolute Total Return* Rating system, defined as follows:
STRONG BUY (>20% total return over the next 3 months, with identifiable share price catalysts within this time frame)
BUY (>15% total return over the next 12 months for small caps, >10% for large caps)
HOLD (-10% to +15% total return over the next 12 months for small caps, -10% to +10% for large caps)
FULLY VALUED (negative total return i.e. > -10% over the next 12 months)
SELL (negative total return of > -20% over the next 3 months, with identifiable catalysts within this time frame)
Share price appreciation + dividends
GENERAL DISCLOSURE/DISCLAIMER This report is prepared by DBS Bank Ltd. This report is solely intended for the clients of DBS Bank Ltd and DBS Vickers Securities (Singapore) Pte Ltd, its respective connected and associated corporations and affiliates (collectively, the “DBS Vickers Group”) only and no part of this document may be (i) copied, photocopied or duplicated in any form or by any means or (ii) redistributed without the prior written consent of DBS Bank Ltd.
The research set out in this report is based on information obtained from sources believed to be reliable, but we (which collectively refers to DBS Bank Ltd., its respective connected and associated corporations, affiliates and their respective directors, officers, employees and agents (collectively, the “DBS Group”)) do not make any representation or warranty as to its accuracy, completeness or correctness. Opinions expressed are subject to change without notice. This document is prepared for general circulation. Any recommendation contained in this document does not have regard to the specific investment objectives, financial situation and the particular needs of any specific addressee. This document is for the information of addressees only and is not to be taken in substitution for the exercise of judgement by addressees, who should obtain separate independent legal or financial advice. The DBS Group accepts no liability whatsoever for any direct, indirect and/or consequential loss (including any claims for loss of profit) arising from any use of and/or reliance upon this document and/or further communication given in relation to this document. This document is not to be construed as an offer or a solicitation of an offer to buy or sell any securities. The DBS Group, along with its affiliates and/or persons associated with any of them may from time to time have interests in the securities mentioned in this document. The DBS Group may have positions in, and may effect transactions in securities mentioned herein and may also perform or seek to perform broking, investment banking and other banking services for these companies.
Any valuations, opinions, estimates, forecasts, ratings or risk assessments herein constitutes a judgment as of the date of this report, and there can be no assurance that future results or events will be consistent with any such valuations, opinions, estimates, forecasts, ratings or risk assessments. The information in this document is subject to change without notice, its accuracy is not guaranteed, it may be incomplete or condensed and it may not contain all material information concerning the company (or companies) referred to in this report.
The valuations, opinions, estimates, forecasts, ratings or risk assessments described in this report were based upon a number of estimates and assumptions and are inherently subject to significant uncertainties and contingencies. It can be expected that one or more of the estimates on which the valuations, opinions, estimates, forecasts, ratings or risk assessments were based will not materialize or will vary significantly from actual results. Therefore, the inclusion of the valuations, opinions, estimates, forecasts, ratings or risk assessments described herein IS NOT TO BE RELIED UPON as a representation and/or warranty by the DBS Group (and/or any persons associated with the aforesaid entities), that:
(a) such valuations, opinions, estimates, forecasts, ratings or risk assessments or their underlying assumptions will be achieved, and (b) there is any assurance that future results or events will be consistent with any such valuations, opinions, estimates, forecasts, ratings or risk
assessments stated therein.
Any assumptions made in this report that refers to commodities, are for the purposes of making forecasts for the company (or companies) mentioned herein. They are not to be construed as recommendations to trade in the physical commodity or in the futures contract relating to the commodity referred to in this report.
DBS Vickers Securities (USA) Inc ("DBSVUSA")"), a U.S.-registered broker-dealer, does not have its own investment banking or research department, nor has it participated in any investment banking transaction as a manager or co-manager in the past twelve months.
ANALYST CERTIFICATION The research analyst primarily responsible for the content of this research report, in part or in whole, certifies that the views about the companies and their securities expressed in this report accurately reflect his/her personal views. The analyst also certifies that no part of his/her compensation was, is, or will be, directly, or indirectly, related to specific recommendations or views expressed in this report. As of the date the report is published,the analyst and his/her spouse and/or relatives who are financially dependent on the analyst, do not hold interests in the securities recommended in this report (“interest” includes direct or indirect ownership of securities).
COMPANY-SPECIFIC / REGULATORY DISCLOSURES 1. DBS Bank Ltd., DBS Vickers Securities (Singapore) Pte Ltd (“DBSVS”), their subsidiaries and/or other affiliates do not have a
proprietary position in the securities recommended in this report as of 31 Jan 2015, except CapitaCommercial Trust, Keppel REIT CapitaRetail China Trust, Capitamall Trust, Croesus Retail Trust, SPH REIT, Mapletree Commercial Trust, Mapletree Greater China Commercial Trust, Starhill Global REIT, Suntec REIT, Ascendas India Trust, Ascendas REIT, Cache Logistics Trust, Cambridge Industrial Trust,Mapletree Industrial Trust, Mapletree Logistics Trust, Soilbuild Business Space Reit, Ascendas Hospitality Trust Ascott Residence Trust, CDL Hospitality Trusts, Far East Hospitality Trust, Frasers Hospitality Trust, OUE Hospitality Trust Parkway Life Real Estate Investment Trust, Religare Health Trust, Keppel DC REIT
2. DBS Bank Ltd., DBSVS, DBSVUSA, their subsidiaries and/or other affiliates beneficially own a total of 1% of any class of commonequity securities of Keppel REIT, Croesus Retail Trust, Mapletree Greater China Commercial Trust, Starhill Global REIT, Soilbuild
Industry Focus
Singapore Hospitality
Page 16
Business Space Reit, Ascendas Hospitality Trust, Ascott Residence Trust, Far East Hospitality Trust, Frasers Hospitality Trust, Keppel DC REIT and 5% interest of Croesus Retail Trust, Ascendas Hospitality Trust as of 31 Jan 2015.
3. Compensation for investment banking services:DBS Bank Ltd., DBSVS, DBSVUSA, their subsidiaries and/or other affiliates have received compensation, within the past 12months, and within the next 3 months may receive or intends to seek compensation for investment banking services from theKeppel REIT, Croesus Retail Trust, Frasers Centrepoint Trust, Suntec REIT, Soilbuild Business Space Reit, Frasers Hospitality TrustIREIT Global, Keppel DC REIT.
DBSVUSA does not have its own investment banking or research department, nor has it participated in any investment bankingtransaction as a manager or co-manager in the past twelve months. Any US persons wishing to obtain further information,including any clarification on disclosures in this disclaimer, or to effect a transaction in any security discussed in this documentshould contact DBSVUSA exclusively.
RESTRICTIONS ON DISTRIBUTION General This report is not directed to, or intended for distribution to or use by, any person or entity who is a citizen or resident of or
located in any locality, state, country or other jurisdiction where such distribution, publication, availability or use would be contrary to law or regulation.
Australia This report is being distributed in Australia by DBS Bank Ltd. (“DBS”) or DBS Vickers Securities (Singapore) Pte Ltd (“DBSVS”), both of which are exempted from the requirement to hold an Australian Financial Services Licence under the Corporation Act 2001 (“CA”) in respect of financial services provided to the recipients. Both DBS and DBSVS are regulated by the Monetary Authority of Singapore under the laws of Singapore, which differ from Australian laws. Distribution of this report is intended only for “wholesale investors” within the meaning of the CA.
Hong Kong This report is being distributed in Hong Kong by DBS Vickers (Hong Kong) Limited which is licensed and regulated by the Hong Kong Securities and Futures Commission.
Indonesia This report is being distributed in Indonesia by PT DBS Vickers Securities Indonesia.
Malaysia This report is distributed in Malaysia by AllianceDBS Research Sdn Bhd ("ADBSR") (formerly known as HwangDBS Vickers Research Sdn Bhd). Recipients of this report, received from ADBSR are to contact the undersigned at 603-2604 3333 in respect of any matters arising from or in connection with this report. In addition to the General Disclosure/Disclaimer found at the preceding page, recipients of this report are advised that ADBSR (the preparer of this report), its holding company Alliance Investment Bank Berhad, their respective connected and associated corporations, affiliates, their directors, officers, employees, agents and parties related or associated with any of them may have positions in, and may effect transactions in the securities mentioned herein and may also perform or seek to perform broking, investment banking/corporate advisory and other services for the subject companies. They may also have received compensation and/or seek to obtain compensation for broking, investment banking/corporate advisory and other services from the subject companies.
Wong Ming Tek, Executive Director, ADBSR
Singapore This report is distributed in Singapore by DBS Bank Ltd (Company Regn. No. 196800306E) or DBSVS (Company Regn No. 198600294G), both of which are Exempt Financial Advisers as defined in the Financial Advisers Act and regulated by the Monetary Authority of Singapore. DBS Bank Ltd and/or DBSVS, may distribute reports produced by its respective foreign entities, affiliates or other foreign research houses pursuant to an arrangement under Regulation 32C of the Financial Advisers Regulations. Where the report is distributed in Singapore to a person who is not an Accredited Investor, Expert Investor or an Institutional Investor, DBS Bank Ltd accepts legal responsibility for the contents of the report to such persons only to the extent required by law. Singapore recipients should contact DBS Bank Ltd at 6327 2288 for matters arising from, or in connection with the report.
Thailand This report is being distributed in Thailand by DBS Vickers Securities (Thailand) Co Ltd. Research reports distributed are only intended for institutional clients only and no other person may act upon it.
United Kingdom
This report is being distributed in the UK by DBS Vickers Securities (UK) Ltd, who is an authorised person in the meaning of the Financial Services and Markets Act and is regulated by The Financial Conduct Authority. Research distributed in the UK is intended only for institutional clients.
Dubai This research report is being distributed in The Dubai International Financial Centre (“DIFC”) by DBS Bank Ltd., (DIFC Branch) having its office at PO Box 506538, 3rd Floor, Building 3, East Wing, Gate Precinct, Dubai International Financial Centre (DIFC), Dubai, United Arab Emirates. DBS Bank Ltd., (DIFC Branch) is regulated by The Dubai Financial Services Authority. This research report is intended only for professional clients (as defined in the DFSA rulebook) and no other person may act upon it.
United States
Neither this report nor any copy hereof may be taken or distributed into the United States or to any U.S. person except in compliance with any applicable U.S. laws and regulations. It is being distributed in the United States by DBSVUSA, which accepts responsibility for its contents. Any U.S. person receiving this report who wishes to effect transactions in any securities referred to herein should contact DBSVUSA directly and not its affiliate.
Industry Focus
Singapore Hospitality
Page 17
Other jurisdictions
In any other jurisdictions, except if otherwise restricted by laws or regulations, this report is intended only for qualified, professional, institutional or sophisticated investors as defined in the laws and regulations of such jurisdictions.
DBS Bank Ltd.
12 Marina Boulevard, Marina Bay Financial Centre Tower 3
Singapore 018982 Tel. 65-6878 8888
Company Regn. No. 196800306E