Singapore A Small Island City State - OECD.org · 16-Sep-2010 3 Expectations on Higher Education...
10
16-Sep-2010 1 Professor Seeram Ramakrishna, FREng Vice President (Research Strategy) National University of Singapore [email protected] Roundtable on Higher Education in Regional and City Development 15-16 Sept 2010, OECD Conference Centre, Paris OECD Roundtable on Higher Education in Regional and City Development 16 September 2010 Singapore & National University of Singapore Higher Education in Nation’s Progress in a Globalised World A Small Island City State Land Area 707 sq km or 273 sq mi Population ~ 5 million Ranked 2 nd Most Innovative Country – by BCG Global Leader in International Trade & Investment – by Globalisation Index Best place to work, live & play in Asia- by an International Survey GDP (2009) S$265.1 Bi (USD 182.7 Bi) Per capita GDP USD 36 631 (2009) Highly Developed & Urbanised with no Natural Resources Singapore
Transcript of Singapore A Small Island City State - OECD.org · 16-Sep-2010 3 Expectations on Higher Education...

16-Sep-2010
1
Professor Seeram Ramakrishna, FREng
Vice President (Research Strategy)
National University of Singapore
Roundtable on Higher Education in Regional and City Development 15-16 Sept 2010, OECD Conference Centre, Paris
OECD Roundtable on Higher Education in Regional and City Development 16 September 2010
Singapore & National University of Singapore Higher Education in Nation’s Progress in a Globalised World
A Small Island City State
2
Land Area 707 sq km or 273 sq mi
Population ~ 5 million
Ranked 2nd Most Innovative Country – by BCG Global Leader in International Trade & Investment – by Globalisation Index Best place to work, live & play in Asia- by an International Survey
GDP (2009) S$265.1 Bi (USD 182.7 Bi)
Per capita GDP USD 36 631 (2009)
Highly Developed & Urbanised with no Natural Resources
Singapore
16-Sep-2010
2
Singapore
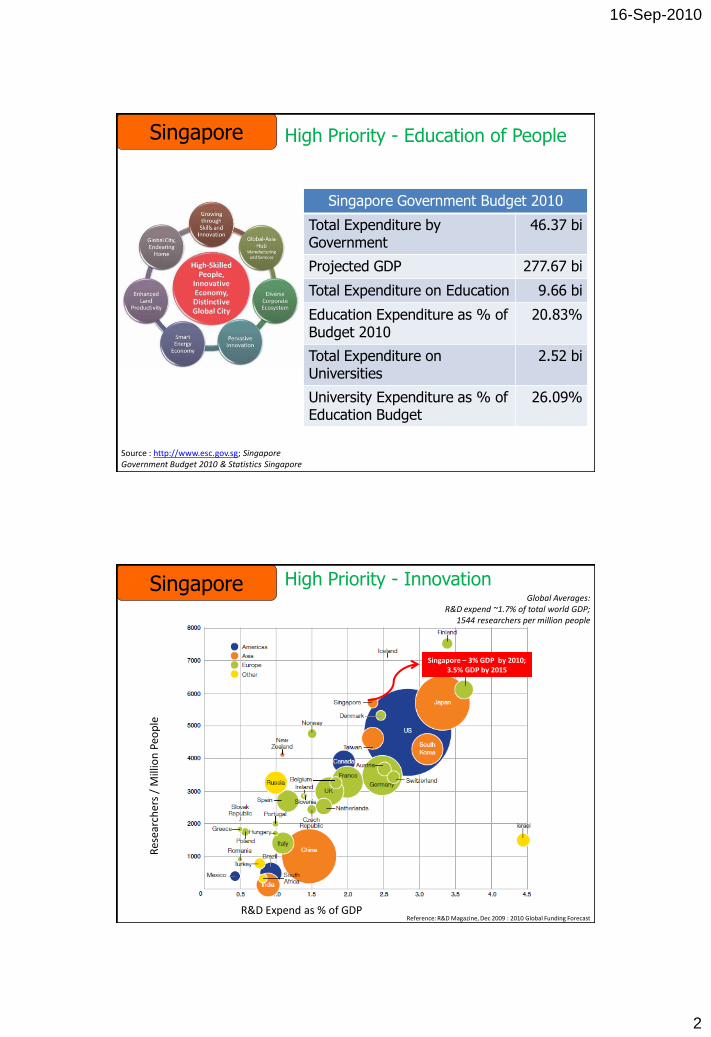
Source : http://www.esc.gov.sg; Singapore Government Budget 2010 & Statistics Singapore
Singapore Government Budget 2010
Total Expenditure by Government
46.37 bi
Projected GDP 277.67 bi
Total Expenditure on Education 9.66 bi
Education Expenditure as % of Budget 2010
20.83%
Total Expenditure on Universities
2.52 bi
University Expenditure as % of Education Budget
26.09%
High Priority - Education of People
Reference: R&D Magazine, Dec 2009 : 2010 Global Funding Forecast
Global Averages: R&D expend ~1.7% of total world GDP;
1544 researchers per million people
R&D Expend as % of GDP
Res
earc
her
s /
Mill
ion
Peo
ple
Singapore – 3% GDP by 2010; 3.5% GDP by 2015
High Priority - Innovation Singapore

16-Sep-2010
3
Expectations on Higher Education Institutions
• Differentiated learning • Internationalisation • Global learning
Human Capital Development
• World class research infrastructure
• Powerhouse for new knowledge
• Knowledge transfer and entrepreneurship
Capacity Building in Research Excellence
• Attraction of top talent (Local and International)
• Test bedding innovative ideas for global challenges
Magnet for Investments &
Economic Growth
• Talents (Local and International)
• Academic-Private-Government Partnerships
Global Partnerships
• Academic leadership
• Academic innovations
Global Reputation
National University of Singapore (NUS) in Nation’s Progress in a Globalized World

16-Sep-2010
4
Internationalisation- Global University
NUS excels by providing differentiated
learning environment:
An international campus with
~ 50% faculty members,
~ 30% of undergraduates,
~ 75% of graduates, and
~ 75% of researchers
from over 100 nations
Global Learning
Take NUS students to the world
50% undergraduates go overseas; 20% for > 6 months
> 60 joint- & double-degree programmes with top universities around the world
180 partner universities for student exchange
6 NUS Overseas Colleges across the US, Europe, China and India

16-Sep-2010
5
Nurturing leaders for Singapore and beyond
Presidents & Prime Ministers
Leaders in international agencies
Key government figures
Captains of industry
Entrepreneurs
Community leaders
NUS 51% NTU
31%
A*STAR 15%
Others 3%
New Knowledge Generation
Share of Publications in Journals
Source : Accessed Thomson Reuters -Web of Science data on 1 Sep 2010; Journal Publications with Impact Factor
Period from Year 2000 to 31 Aug 2010
Ranking of Share of Publications by Higher Education
1 National University of Singapore (NUS)
2 Nanyang Technological University (NTU)
3 Agency for Science, Technology and Research (A*STAR)
4 Others

16-Sep-2010
6
Source: NUS Enterprise
R&D expenditures (USDmi) & innovation outputs per 100 academic staff - NUS vs global universities, 2005
Reference: Wong, P.K., Ho, Y.P.& Singh A., Towards a “Global Knowledge Enterprise”: The Entrepreneurial University model of NUS
MIT Stanford UPenn USC Georgia
Tech
Oxford Cambridge Imperial NUS
R&D
expenditure
67.8 45.96 13.95 9.5 46.66 12.93 83.45 12.56 3.78
Spin- offs 1.2 0.6 0.2 0.2 1 0.1 0.1 0.2 0.1
Licenses 5.6 6.2 1.7 1.4 4.1 1.5 1.5 0.8 0.7
Patents 8 5.6 0.8 0.8 4.8 1 1 Na 1.3
Innovation
disclosures
30.8 28.5 7.7 2.7 33.4 3.8 3.8 6.1 3.7
Resources (energy, water, food, & materials)
Qu
alit
y o
f Li
vin
g
Pro
du
ctiv
ity
Desired future trend
Trend thus far
Researchers’ Radar
Notes: Global Spend on R&D > 1.2 trillion dollars (~ 1.7% of GDP) Global Number of Researchers > 10 million (~1500 researchers per million people)

16-Sep-2010
7
S$150 million investment by GE and NUS (2008) 2,700 sq metres of new R&D laboratory on NUS Campus
NUS – GE Singapore Water Technology Centre World – Class Collaborative Centre with Industry for advancing water technologies
14
Energy Security
Lower the carbon footprint & Environment Singapore

16-Sep-2010
8
15
Zero Energy Building project is a collaborative R&D effort among BCA, NUS, SERIS and partners from the private sector Singapore Government target to get
80% of all buildings on Green Mark
certification by 2030
Photovoltaic systems Light pipes Solar panels Source: Building & Construction Authority (BCA)
Singapore Green Building R&D
THE World University Ranking 2007 2008 2009
National University of Singapore Ranking 33 30 30
Ranking by Discipline
Engineering and IT 10 11 14
Life Sciences and Biomedicine 12 17 20
Social Sciences 20 18 20
Arts and Humanities 21 30 23
Natural Sciences 25 31 27
International Standing

16-Sep-2010
9
Rank World
Rank
Institution Papers Citations Citations per
paper
1 19 Japan Science & Technology Agency 1,351 14,941 11.06
2 26 National University of Singapore 2,277 23,008 10.10
3 28 City University of Hong Kong 1,269 11,973 9.43
4 33 U of Science and Technology of China 1,598 13,016 8.15
5 34 Seoul National University 2,438 19,778 8.11
6 35 Nat Inst for Materials Science, Japan 3,722 27,607 7.42
7 36 Kyoto University 2,630 19,269 7.33
8 38 Nat Inst of Advanced Industrial Science and Technology, Japan 4,345 31,324 7.21
9 39 Korea Adv Inst of Science and Tech 2,062 14,636 7.10
10 40 Kyushu University 1,666 11,717 7.03
11 42 National Tsing Hua University, Taiwan 1,591 10,890 6.84
12 43 Tokyo Institute of Technology 2,685 18,217 6.78
13 44 Tohoku University 5,603 37,888 6.76
14 45 University of Tokyo 3,071 20,742 6.75
15 47 Osaka University 3,668 23,985 6.54
16 48 Nanyang Tech University, Singapore 2,416 15,339 6.35
17 49 Yonsei University, South Korea 1,638 10,127 6.18
18 50 Jilin University, China 1,754 10,613 6.05
19 51 Chinese Academy of Sciences 13,039 72,690 5.57
20 52 Tsing Hua University, China 4,352 23,496 5.40
21 53 Nat. Cheng Kung University, Taiwan 2,092 10,583 5.06
22 54 Zhejiang University, China 2,398 10,818 4.51
23 56 Shanghai Jiao Tong University 3,044 10,580 3.48
Data provided by Thomson Reuters from its Essential Science Indicators, 1 January 1999-30 April 2009
Top Asia-Pacific Institutions in Material Science