Sinfonia Technology Co., Ltd. · Sinfonia Technology Co., Ltd. ... Sinfonia with a Buy rating given...
15
This analyst report is prepared for the sole purpose of providing information and is not intended as an inducement or invitation for investment. Any investment activity should be based on your own discretion and responsibility. Please refer to the Disclosure on the last page before using this report. 1 Sinfonia Technology Co., Ltd. November 21, 2016 ◆ Electronics manufacturer with cutting-edge motion-control technologies Sinfonia Technology (Sinfonia) is an electronic company whose main products are Electronic Components for Aircraft, Factory Automation (FA) Equipment, and Semiconductor Transportation Equipment, to name a few. Especially, the company is superior in its high precision motion-control technologies. ◆ The company’s revenues and income will increase for five consecutive FYs Capital Partners Security (CPS) estimates that, thanks to the semiconductor related equipment’s sales growth, the company’s robust results will continue into FY2016 (ending March 2017) as follows: revenue 85,400 million yen (+6.6%, YoY), and operating income 5,600 million yen (+27.0%, YoY). As for the next FY (ending March 2018), CPS anticipates that, due to an expected growth of electronic components for aircrafts, the company will achieve revenues and income of 89,100 million yen (+4.3%, YoY) and 6,720 million yen (+20.0%, YoY), respectably, recording an increase of these figures for five years in a row. ◆ Motion-control technologies are key devises which support aircrafts of the Japan Self-Defense Forces (SDF) and rockets. The company retains advanced technologies enabling a precise and effective control of actuators and motors. These technologies are highly valued in several industries and adopted by aircrafts of the SDF, rockets, and semiconductor production equipment (SPE) where a precise control of devices is indispensable. ◆ Target Price and Investment Rating We expect the company will continue to grow steadily with no crucial issue on their financial conditions. Considering that the estimated average PER of all stocks listed on the Tokyo Stock Exchange’s (TSE) First Section is about 15x, we believe it is appropriate to set Sinfonia’s PER at 15x as well. Taking both such PER and this financial year’s estimated EPS of 24.9 yen into consideration, we derive the target price of 370 yen. We initiate Sinfonia with a Buy rating given that the upside to the target price is about 69%. Investment Rating Buy Target Price (Yen) 370 Stock Price 219 (Closing price on November 18) TSE code 6507 Market Capitalization 32,653 (Million Yen) Outstanding Shares 148,689 (Thousand shares) PBR (curr) 1.1 Dividend Yield (E)(%) 2.3 Capital Partners Securities Research Department Naoki Tsuchiya [email protected]
Transcript of Sinfonia Technology Co., Ltd. · Sinfonia Technology Co., Ltd. ... Sinfonia with a Buy rating given...

This analyst report is prepared for the sole purpose of providing information and is not intended as an inducement or invitation for investment. Any investment activity should be based on your own discretion and responsibility. Please refer to the Disclosure on the last page before using this report.
1
Sinfonia Technology Co., Ltd. November 21, 2016
◆ Electronics manufacturer with cutting-edge motion-control
technologies
Sinfonia Technology (Sinfonia) is an electronic company whose
main products are Electronic Components for Aircraft, Factory
Automation (FA) Equipment, and Semiconductor Transportation
Equipment, to name a few. Especially, the company is superior in
its high precision motion-control technologies.
◆ The company’s revenues and income will increase for five
consecutive FYs
Capital Partners Security (CPS) estimates that, thanks to the
semiconductor related equipment’s sales growth, the company’s
robust results will continue into FY2016 (ending March 2017) as
follows: revenue 85,400 million yen (+6.6%, YoY), and operating
income 5,600 million yen (+27.0%, YoY). As for the next FY (ending
March 2018), CPS anticipates that, due to an expected growth of
electronic components for aircrafts, the company will achieve
revenues and income of 89,100 million yen (+4.3%, YoY) and 6,720
million yen (+20.0%, YoY), respectably, recording an increase of
these figures for five years in a row.
◆ Motion-control technologies are key devises which support
aircrafts of the Japan Self-Defense Forces (SDF) and rockets.
The company retains advanced technologies enabling a precise
and effective control of actuators and motors. These technologies
are highly valued in several industries and adopted by aircrafts of
the SDF, rockets, and semiconductor production equipment (SPE)
where a precise control of devices is indispensable.
◆ Target Price and Investment Rating
We expect the company will continue to grow steadily with no
crucial issue on their financial conditions. Considering that the
estimated average PER of all stocks listed on the Tokyo Stock
Exchange’s (TSE) First Section is about 15x, we believe it is
appropriate to set Sinfonia’s PER at 15x as well. Taking both such
PER and this financial year’s estimated EPS of 24.9 yen into
consideration, we derive the target price of 370 yen. We initiate
Sinfonia with a Buy rating given that the upside to the target price is
about 69%.
Investment Rating Buy
Target Price (Yen) 370
Stock Price 219
(Closing price on
November 18)
TSE code 6507
Market Capitalization 32,653
(Million Yen)
Outstanding Shares 148,689
(Thousand shares)
PBR (curr) 1.1
Dividend Yield (E)(%) 2.3
Capital Partners Securities
Research Department
Naoki Tsuchiya

This analyst report is prepared for the sole purpose of providing information and is not intended as an inducement or invitation for investment. Any investment activity should be based on your own discretion and responsibility. Please refer to the Disclosure on the last page before using this report.
2
【Consolidated Financial Results】 (millions of Yen)
FY Ended March 31 Revenue Operating
Income
Ordinary
Income
Net
Income EPS(Yen) PER(x)
2015 75,796 2,757 2,554 1,820 12.2 18.0
2016 80,080 4,409 4,231 2,850 19.2 11.4
2017E 85,400 5,600 5,460 3,700 24.9 8.8
2018E 89,100 6,720 6,610 4,550 30.6 7.2
2017 Company forecast 85,000 5,500 5,000 3,400 22.9 9.6
Source: Securities report, Estimates by CPS, Company forecast

This analyst report is prepared for the sole purpose of providing information and is not intended as an inducement or invitation for investment. Any investment activity should be based on your own discretion and responsibility. Please refer to the Disclosure on the last page before using this report.
3
Ⅰ. Performance Overview
Expecting the company’s revenues and income will increase for five FYs
in a row Sinfonia is an electronic company whose main products are Electronic Components for Aircraft, Factory Automation (FA) Equipment, Semiconductor Transportation Equipment, and Water and Sanitation Management System. Especially, the company is superior in high precision actuators, motors and their motion-control technologies. These technologies are highly valued in several industries and adopted by aircrafts of the SDF, rockets, and semiconductor production equipment (SPE) where a precise control of devices is indispensable. As for this FY (ending March 2017), given the brisk sales of Semiconductor Transportation Equipment, the company will achieve a robust increase in both revenues and income as follows: revenue 85,400 million yen (+6.6%, YoY), operating
income 5,600 million yen (+27.0%, YoY), and net income 3,700million yen(+29.8%,
YoY). Since CPS expects a sales growth of Electronic Components for Aircraft and
Water and Sanitation Management System in the coming year, the company’s next FY (ending March 2018) results will be as follows: revenue 89,100 million yen (+4.3%, YoY), operating income 6,720 million yen (+20.0%, YoY), and net income 4,550 million
yen (+23.0%, YoY). This marks an increase of revenues and profits for five FYs in a
row.
【Trend of Revenue and Operating Income】
0
2,000
4,000
6,000
8,000
10,000
0
20,000
40,000
60,000
80,000
100,000Revenue(LHS)
Operating Income(RHS)
millions of Yen millions of Yen
Source: Securities report, Estimates by CPS

This analyst report is prepared for the sole purpose of providing information and is not intended as an inducement or invitation for investment. Any investment activity should be based on your own discretion and responsibility. Please refer to the Disclosure on the last page before using this report.
4
Ⅱ. Motion Equipment business
(Compositon ratio 39.2% in FY2016 Projected Revenue)
Growing electrical components for aircrafts of the Self-Defense Forces (SDF) The motion equipment business mainly consists of aerospace-related equipment and motion control equipment (FA equipment). Aerospace-related equipment includes products for civilian aircrafts and rockets, while many are electrical components for aircrafts used by the SDF. Sinfonia supplies electrical equipment such as actuators and generators for the SDF’s fighters and surveillance aircrafts. They are presumably used as critical components for firearms and engines. The motion control device is composed of high-precision direct drive motors and electromagnetic clutches, etc. which are used in factory production lines. Further, the company is superior in such products as motors and controllers for construction machines.
The orders received for this business during 1H of the current FY (ending in Sept. 2016)
were 20,319 million yen (up 37.7% YoY), and the order backlog recorded 23,593 million yen (up 37.7% YoY). In addition to an order related to the new type of antisubmarine surveillance aircrafts (model name: P-1), an increasing demand for maintenance of existing SDF aircrafts would have contributed to a healthy intake of orders. In accordance with a recent sharp increase of scrambles, an operational distance of SDF aircrafts has increased, which seems to have resulted in a growing demand for maintenance.
For FY ending in Mar. 2017, CPS estimates that, thanks to increased aerospace-related equipment, this business will show a recovery with revenue and operating income of 33,500 million yen (up 7.6% year YoY) and 780 million yen (up 20.6% YoY), respectively. For the next FY ending in Mar. 2018, we anticipate that, due to expected expansion of motion control equipment business and a growing market of aerospace-related equipment, the business will show a continued growth with revenue and operating income of 36,200 million yen (up 8.1% YoY) and 1,270 million yen (up 62.8% YoY), respectively.
【Breakdown of Revenue from Motion Equipment business by Product Category(FY ended Mar. 2016)】
Aerospace-
related
equipment,
38%
Motion Control
equipment,
46%
Others, 16%
Source: Sinfonia’s financial report

This analyst report is prepared for the sole purpose of providing information and is not intended as an inducement or invitation for investment. Any investment activity should be based on your own discretion and responsibility. Please refer to the Disclosure on the last page before using this report.
5
【Motion Equipment business: Trend of Revenue and Operating Income】
【Motion Equipment business: Trend of Order backlog】
0
400
800
1,200
1,600
0
10,000
20,000
30,000
40,000
Revenue(LHS)
Operating Income(RHS)
millions of Yen millions of Yen
0
5,000
10,000
15,000
20,000
25,000
Sep.2013 Mar. 2014 Sep.2014 Mar.2015 Sep.2015 Mar.2016 Sep.2016
millions of Yen
Source: Securities report, Estimates by CPS
Source: Securities report

This analyst report is prepared for the sole purpose of providing information and is not intended as an inducement or invitation for investment. Any investment activity should be based on your own discretion and responsibility. Please refer to the Disclosure on the last page before using this report.
6
【Trend of scramble of SDF aircrafts】
【Antisubmarine surveillance aircraft P-1】
0
200
400
600
800
1,000Times
Source: Ministry of Defense website
Source: Ministry of Defense Chief of Staff release

This analyst report is prepared for the sole purpose of providing information and is not intended as an inducement or invitation for investment. Any investment activity should be based on your own discretion and responsibility. Please refer to the Disclosure on the last page before using this report.
7
Ⅲ. Power Electronics Equipment business
(Compositon ratio 43.9% in FY 2016 Projected Revenue)
In addition to Semiconductor Transportation Equipment, Water Supply and Sewerage
Management System expected to grow.
Power Electronics Equipment business mainly consists of Semiconductor Transportation Equipment, Social Infrastructure System, and Automobile Test Equipment. Sinfonia’s semiconductor transportation device is a device connected to an etcher and a CVD, etc., and plays a role to deliver a silicon wafer sealed in a delivery box to etchers and CVDs without being exposed to the air. Technology utilizing a special gas is highly valued, which enables silicon wafers to be precisely positioned while preventing oxidation of silicon wafers. Sinfonia is the top manufacturer in this field of equipment. Social infrastructure system mainly handles Water supply and Sewerage management systems. It provides comprehensive services including Water Supply and Sewerage Control system, Surveillance monitor, Plant Controller, and Receiving & Transforming equipment.
The orders received amounted to 18,711 million yen (up 27.7% YoY), and the order backlog was 20,048 million yen (up 27.2% YoY) for 1H of the current FY (ended in Sept. 2016). Orders received for Semiconductor Transportation equipment have continued to be impressive. Orders for Water Supply and Sewerage management systems have also increased, both of which have contributed to the favorable results. Most of water supply facilities in Japan were developed in the 1970s, and as a result, the demand for renewal of these facilities seems to have increased after 40 years of usage.
For the current FY (ending March 2017), we expect the business results of 37,500 million yen (up 10.7% YoY) in revenue and 3,900 million yen (up 50.6% YoY) in operating income, mainly due to the steady growth of highly profitable semiconductor transportation equipment. For the next FY (ending March 2018), we expect 38,600 million yen (up 2.9% YoY) in revenue and 4,300 million yen (up 10.3% YoY) in operating income, given an additional business of Water Supply and Sewerage management system.
【Breakdown of Revenue from Power Electronics Equipment business by Product Category
(FY ended Mar. 2016)】
Semiconductor
Transportation
Device, 28%
Social
Infrastructure
System, 20%
Automobile Test
Equipment,
13%
Industrial
Infrastructure
System, 13%
Others, 26%
Source: Sinfonia’s financial report

This analyst report is prepared for the sole purpose of providing information and is not intended as an inducement or invitation for investment. Any investment activity should be based on your own discretion and responsibility. Please refer to the Disclosure on the last page before using this report.
8
【Trend of Revenue and Operating Income from Power Electronics Equipment business】
【Trend of Order backlog from Power Electronics Equipment business】
Source: Securities report
0
1,000
2,000
3,000
4,000
5,000
6,000
0
10,000
20,000
30,000
40,000Revenue (LHS)
Operating Income (RHS)
millions of Yen millions of yen
0
5,000
10,000
15,000
20,000
25,000
Sep.2013 Mar.2013 Sep.2014 Mar.2015 Sep. 2015 Mar.2016 Sep.2016
millions of Yen
Source: Securities report, Estimates by CPS

This analyst report is prepared for the sole purpose of providing information and is not intended as an inducement or invitation for investment. Any investment activity should be based on your own discretion and responsibility. Please refer to the Disclosure on the last page before using this report.
9
【Sinfonia‘s Semiconductor transportation devices】
【World Trend of Orders received of Semiconductor equipment devices】
0
2,000
4,000
6,000
8,000
10,000
12,000
1Q2013 3Q2013 1Q2014 3Q2014 1Q2015 3Q2015 1Q2016
Million US$
Source: Sinfonia Technology Co., Ltd. website
Source: SEMI

This analyst report is prepared for the sole purpose of providing information and is not intended as an inducement or invitation for investment. Any investment activity should be based on your own discretion and responsibility. Please refer to the Disclosure on the last page before using this report.
10
【Trend of Investment amount in Domestic Water Supply】
【Ratio of Water utility facilities after legal durable life】
0
5,000
10,000
15,000
20,000100 millions of Yen
0%
5%
10%
15%
2006 2007 2008 2009 2010 2011 2012 2013 2014
Source: Ministry of Health, Labor and Welfare “Outline of Water Supply business Policy”
Source: Ministry of Health, Labor and Welfare “Outline of Water Supply business Policy”

This analyst report is prepared for the sole purpose of providing information and is not intended as an inducement or invitation for investment. Any investment activity should be based on your own discretion and responsibility. Please refer to the Disclosure on the last page before using this report.
11
Ⅳ. Target Price and Investment Rating As a result of its efforts to improve operations besides favorable external environment, it is expected that Sinfonia will expand its business on a continuous basis. Based on the company’s expected healthy financials, we have made a judgement that this stock could be valued at the same level as the market average. Considering the average value of projected PER for companies listed on the TSE First Section is approximately 15x (based on the Bloomberg data), we believe that 15x would be justified as Sinfonia’s expected PER for the current FY. With an expected EPS of 24.9 yen, we derive our target price of 370 yen. Given the upside to the target price is approximately 69%, we initiate Sinfonia with a “BUY” rating.
【Revenue and Operating Income by Segment】
(millions of Yen)
FY ended in March 2014 2015 2016 2017 (E) 2018 (E)
(Revenue)
Motion Equipment 32,486 33,835 31,121 33,500 36,200
Power Electronics Equipment 26,501 28,110 33,880 37,500 38,600
Support & Engineering 22,348 21,370 22,779 22,300 22,600
Adjustment -7,020 -7,519 -7,700 -7,900 -8,300
Total 74,315 75,796 80,080 85,400 89,100
(Over previous FY)
Motion Equipment 6.7% 4.2% -8.0% 7.6% 8.1%
Power Electronics Equipment 3.8% 6.1% 20.5% 10.7% 2.9%
Support & Engineering 19.4% -4.4% 6.6% -2.1% 1.3%
Adjustment 35.3% 7.1% 2.4% 2.6% 5.1%
Total 6.9% 2.0% 5.7% 6.6% 4.3%
(Operating Income)
Motion Equipment 1,185 830 647 780 1,270
Power Electronics Equipment 290 968 2,589 3,900 4,300
Support & Engineering 926 968 1,208 1,010 1,250
Adjustment 13 -9 -35 -90 -100
Total 2,414 2,757 4,409 5,600 6,720
(Operating Margin)
Motion Equipment 3.6% 2.5% 2.1% 2.3% 3.5%
Power Electronics Equipment 1.1% 3.4% 7.6% 10.4% 11.1%
Support & Engineering 4.1% 4.5% 5.3% 4.5% 5.5%
Adjustment -0.2% 0.1% 0.5% 1.1% 1.2%
Operating Margin 3.2% 3.6% 5.5% 6.6% 7.5%
Source: Securities report, Estimates by CPS

This analyst report is prepared for the sole purpose of providing information and is not intended as an inducement or invitation for investment. Any investment activity should be based on your own discretion and responsibility. Please refer to the Disclosure on the last page before using this report.
12
【Consolidated Statement of Income】
(millions of Yen)
FY ended in March 2014 2015 2016 2017(E) 2018(E)
Revenue 74,315 75,796 80,080 85,400 89,100
Growth, YoY 6.9% 2.0% 5.7% 6.6% 4.3%
COGS 58,316 59,464 62,575 66,120 68,310
Gross Profit 15,999 16,332 17,505 19,280 20,790
Gross Profit Margin 21.5% 21.5% 21.9% 22.6% 23.3%
SGA 13,585 13,575 13,096 13,680 14,070
Operating Income 2,414 2,757 4,409 5,600 6,720
Operating Margin 3.2% 3.6% 5.5% 6.6% 7.5%
Non-Operating Revenue 215 291 324 330 320
Non-Operating Expense 536 494 502 470 430
Current Profit 2,093 2,554 4,231 5,460 6,610
Extraordinary Profit 0 309 0 0 0
Extraordinary Loss 0 62 239 80 0
Pretax Income 2,093 2,801 3,992 5,380 6,610
Corporate tax, etc. 711 981 1,142 1,680 2,060
Net Income 1,382 1,820 2,850 3,700 4,550
EPS(Yen) 9.3 12.2 19.2 24.9 30.6
BPS(Yen) 172.0 201.8 201.8 221.9 247.2
Number of Outstanding Shares 148,726 148,708 148,696 148,690 148,690
(thousands)
Source: Securities report, Estimates by CPS
This analyst report is prepared for the sole purpose of providing information and is not intended as an inducement or invitation for investment. Any investment activity should be based on your own discretion and responsibility. Please refer to the Disclosure on the last page before using this report.
13
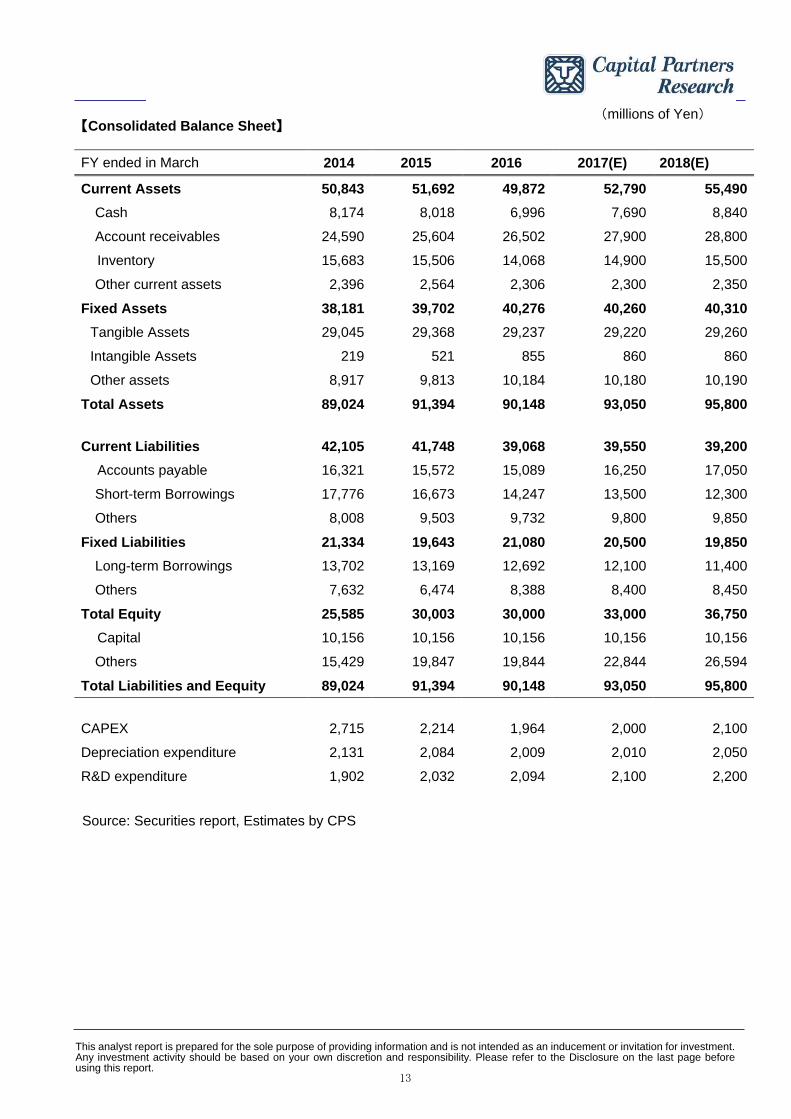
【Consolidated Balance Sheet】 (millions of Yen)
FY ended in March 2014 2015 2016 2017(E) 2018(E)
Current Assets 50,843 51,692 49,872 52,790 55,490
Cash 8,174 8,018 6,996 7,690 8,840
Account receivables 24,590 25,604 26,502 27,900 28,800
Inventory 15,683 15,506 14,068 14,900 15,500
Other current assets 2,396 2,564 2,306 2,300 2,350
Fixed Assets 38,181 39,702 40,276 40,260 40,310
Tangible Assets 29,045 29,368 29,237 29,220 29,260
Intangible Assets 219 521 855 860 860
Other assets 8,917 9,813 10,184 10,180 10,190
Total Assets 89,024 91,394 90,148 93,050 95,800
Current Liabilities 42,105 41,748 39,068 39,550 39,200
Accounts payable 16,321 15,572 15,089 16,250 17,050
Short-term Borrowings 17,776 16,673 14,247 13,500 12,300
Others 8,008 9,503 9,732 9,800 9,850
Fixed Liabilities 21,334 19,643 21,080 20,500 19,850
Long-term Borrowings 13,702 13,169 12,692 12,100 11,400
Others 7,632 6,474 8,388 8,400 8,450
Total Equity 25,585 30,003 30,000 33,000 36,750
Capital 10,156 10,156 10,156 10,156 10,156
Others 15,429 19,847 19,844 22,844 26,594
Total Liabilities and Eequity 89,024 91,394 90,148 93,050 95,800
CAPEX 2,715 2,214 1,964 2,000 2,100
Depreciation expenditure 2,131 2,084 2,009 2,010 2,050
R&D expenditure 1,902 2,032 2,094 2,100 2,200
Source: Securities report, Estimates by CPS

This analyst report is prepared for the sole purpose of providing information and is not intended as an inducement or invitation for investment. Any investment activity should be based on your own discretion and responsibility. Please refer to the Disclosure on the last page before using this report.
14
Disclosure
Explanation of Valuation Grade
BUY: Target price is expected to be greater than 20% the current stock price
NEUTRAL: Difference between target price and current stock price is ±20%
SELL: Target price is expected to be less than 20% of the current stock price
Definition and Risks in Achieving the Target Price
The target price is a stock price level that the analyst is expecting to reach over the next six
months based on the business operations and financial forecasts of the company. There
are also risks for achieving the target price such as changes in the business environment
and its competitive state, changes in domestic and foreign economic conditions and
financial market, stock market volatility and exchange rate fluctuations, changes in
regulatory requirements, occurrence of accidents and large-scale disasters. In addition to
these factors, unforeseeable events might also make it difficult to achieve the target price.
Other Considerations
This analyst report is written based on data Capital Partners Securities believes reliable, but
we do not guarantee accuracy or completeness of its contents. The contents of this report
are made based on data and information available at the time of reporting and are subject
to change without notice. Capital Partners disclaims any and all liability for any
consequence caused by using this report. Please use this report based on your own
judgment and at your own risk.

This analyst report is prepared for the sole purpose of providing information and is not intended as an inducement or invitation for investment. Any investment activity should be based on your own discretion and responsibility. Please refer to the Disclosure on the last page before using this report.
15
Trade Name: Capital Partners Securities Co., Ltd.
Member of Japan Securities Dealers Association and registered
as Financial Instruments Business Operator with the Kanto Local
Finance Bureau (Registration No. 62)
http://www.capital.co.jp/
◆Head Office
8th
Floor Shikoku Building, 1-13-7 Uchikanda, Chiyoda Ku, Tokyo, 101-0047
Tel. No.: +81-3-3518-9300 (General Line)
◆Osaka Branch
Umeda Pacific Building, 2-5-10 Sonezaki, Kita-ku, Osaka 530-0057
Tel. No.: +81-6-6232-8370 (General Line)
◆Nagoya Branch
Hirokoji Center Place, 2-19-19 Nishiki, Naka-ku, Nagoya, Aichi 460-0003
Tel. No.: +81-52-220-3690 (General Line)
◆Fukuoka Branch
KDC Fukuoka Building, 5-5-13 Nakasu, Hakata-ku, Fukuoka 810-0801
Tel. No.: +81-92-272-0873 (General Line)