SQUEAC COMMUNITY ASSESSMENT Bratislava, September 2014 Lenka BLANÁROVÁ.

Page 1 of 50
SQUEAC
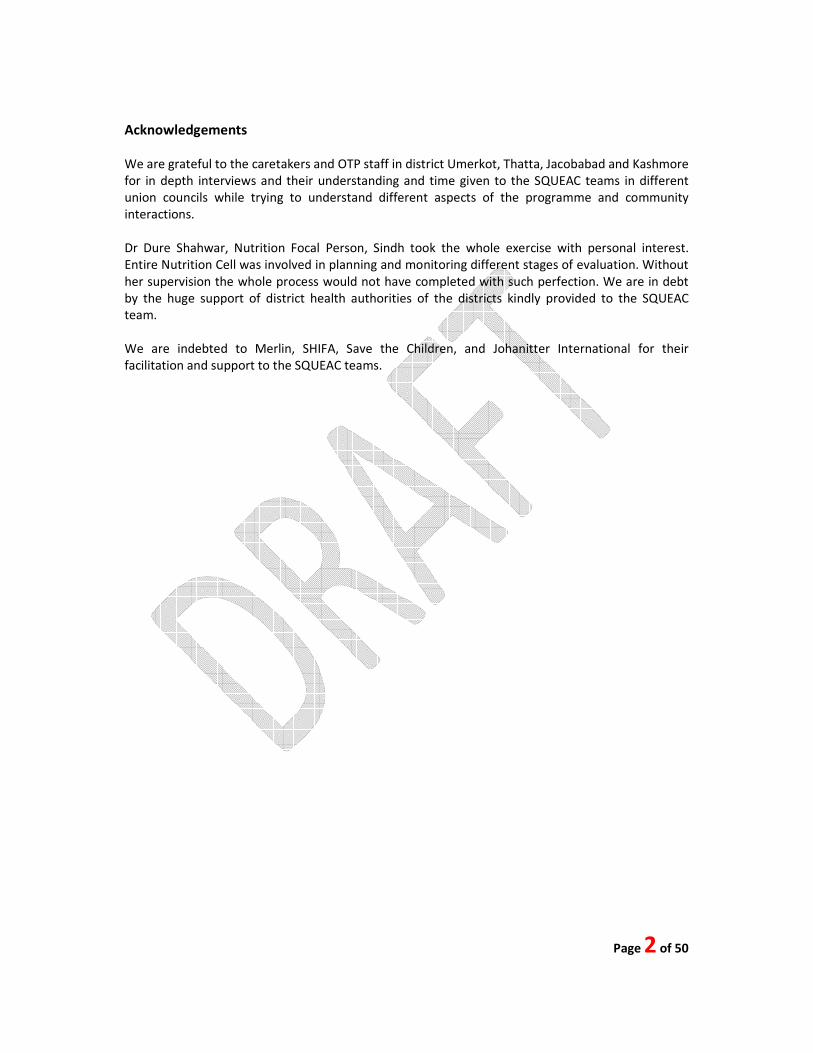
UMERKOT
THATTA
JACOBABAD
KASHMORE
Province Sind, Pakistan
April – May 2013
Page 2 of 50
Acknowledgements
We are grateful to the caretakers and OTP staff in district Umerkot, Thatta, Jacobabad and Kashmore
for in depth interviews and their understanding and time given to the SQUEAC teams in different
union councils while trying to understand different aspects of the programme and community
interactions.
Dr Dure Shahwar, Nutrition Focal Person, Sindh took the whole exercise with personal interest.
Entire Nutrition Cell was involved in planning and monitoring different stages of evaluation. Without
her supervision the whole process would not have completed with such perfection. We are in debt
by the huge support of district health authorities of the districts kindly provided to the SQUEAC
team.
We are indebted to Merlin, SHIFA, Save the Children, and Johanitter International for their
facilitation and support to the SQUEAC teams.
Page 3 of 50
Acronyms
CBV Community Based Volunteers
CI Confidence Interval
CMAM Community Management of Acute Malnutrition
CM Community Mobilizers
DNA Did Not Attend
ECHO Commission's European Community Humanitarian Office
HEB High Energy Biscuits
LHWs Lady Health Workers
MAM Moderate Acute Malnutrition
MUAC Middle Upper Arm Circumference
OTP Outpatient Therapeutic Programme
RUTF Ready to Use Therapeutic Food
SAM Severe Acute Malnutrition
SC Stabilization Centre
SQUEAC Semi Quantitative Evaluation of Access and Coverage
TBA Traditional Birth Attendants
UC Union Council
UNICEF United Nations Children’s Fund
WHO World Health Organization
PPHI People’s Primary Healthcare Initiative
Page 4 of 50
CONTENTS
Executive Summary ................................................................................................................................................ 5
1. INTRODUCTION .................................................................................................................................................. 4
1.1. Context and Background ............................................................................................................................ 4
1.2. Nutrition response ..................................................................................................................................... 5
2. METHODOLOGY .................................................................................................................................................. 6
2.1. Evaluation for Access and Coverage .......................................................................................................... 6
2.2. Objectives of SQUEAC ................................................................................................................................ 6
2.3. Timelines and schedule for the evaluation ............................................................................................... 7
2.4. Tools used for investigation ....................................................................................................................... 8
3. RESULTS .............................................................................................................................................................. 9
3.1. In Depth Interviews with Carers in Umerkhot and Thatta Districts ......................................................... 9
3.2. Community In Depth Group Discussion: Umerkhot and Thatta ............................................................. 11
3.3. Observation: Umerkhot and Thatta ........................................................................................................ 11
3.4. Interviews with Program staff: Umerkhot and thatta ............................................................................ 12
3.5. In Depth Interviews with Carers and staff, and community interview: Jacobabad and Kashmore ...... 14
3.6. Quantitative Information from Program Data: Umerkhot and Thatta .................................................. 15
3.7. Quantitative Information: Jacobabad and Kashmore ............................................................................. 17
3.8. Barrier and Boosters: Umerkhot and Thatta ........................................................................................... 20
3.9. Barriers and Boosters: Jacobabad and Kashmore .................................................................................. 25
3.10. Wide area survey: Umerkhot and Thatta .............................................................................................. 29
3.11. Wide area survey: Jacobabad and Kashmore....................................................................................... 31
4. Recommendations ........................................................................................................................................... 34
Annexes ................................................................................................................................................................ 35
Page 5 of 50
EXECUTIVE SUMMARY
Nutrition intervention response in terms of Community Management of Acute Malnutrition (CMAM)
was launched after the huge floods of 2010 and continued expanding to delivering services
throughout affected districts of Sindh province in 2011, 2012 and 2013. Coverage surveys were
implemented in disricts of Thatta, Umerkot, Kashmore and Jacobabad in province Sindh and this
report contains the survey results.
Coverage surveys using Semi Quantitative Evaluation of Access and Coverage (SQUEAC)
methodology was conducted by the Nutrition Cell, Department of Health of Sindh with support from
UNICEF during the period of March and April 2013. A multi-pronged approach was used to gather
quantitative and qualitative information in the program areas. Coverage was estimated using a
Bayesian Beta-Binomial Conjugate Analysis performed using the SQUEAC Coverage Estimate
Calculator (BayesSQUEAC.app). The evaluation was designed to take maximum benefit of the
understanding of community systems operating towards referral and treatment seeking behavior
and all the other factors which may prove boosters for the programme. It was also expected to
identify and consequently reduce any barriers operating in the community towards better
mobilization, sensitization and ultimately community participation in the programme leading to
better coverage of screening of children (6-59 months) and pregnant and lactating women in the
programme union councils.
Umerkot District
SQUEAC was implemented after the second month of CMAM implementation by SHIFA foundation
in 24 Union Councils; this was taken as an opportunity to understand the barriers and boosters from
the start. SQUEAC was conducted in five Union Councils of the district. Coverage was estimated to
be 37.1% (CI 27.5% - 46.7%). The coverage is much below the minimal level of coverage referenced
in SPHERE standards for rural areas of 50 percent, this was expected because the project established
just two months before the assessment.
Thatta District
Merlin has been implementing CMAM since 2010 in the district. SQUEAC was conducted in 7 Union
Councils of district Thatta. Coverage was estimated to be 48.8% (CI 36.7% - 59.3%). The coverage is
slightly below the minimal level of coverage referenced in SPHERE standards. Given the lifetime of
the project in the district, coverage would have been better than what has been documented here.
Jacobabad District
CMAM program has been implemented in Jacobabad for almost 2 years and half since October 2010
by Save the Children. The coverage survey was conducted in 6 Union Councils of Jacobabad district.
Coverage was estimated to be 56.8% (95% CI: 45.0 – 68.6%). The coverage was higher than the
SHERE minimum standards. The program coverage showed improvement compared to the March
2012 coverage survey result of 39.5% (95% CI: 33.5% - 45.6%).
Kashmore District
In Kashmore, CMAM started in July 2011 and has been running for the last 2 years by different
partners. Johanitter international was implementing in the assessed 10 Union Counsels. Coverage
was estimated to be 41.8% (95% CI: 31.6% - 51.9%). The coverage was lower than the SPHERE
minimum standards.

Page 4 of 50
1. INTRODUCTION
1.1. CONTEXT AND BACKGROUND
According to the National Nutrition Survey (NNS)-201, in Pakistan, 43 per cent of children under 5
(around 10 million) suffer from chronic malnutrition and more than 15 per cent (around 3.5 to 3.7
million) from acute malnutrition. These high malnutrition rates have shown little to no improvement
since the last national survey was conducted 10 years ago. In Pakistan, the scale of nutrition
emergency response needs is one of the highest in the world; an estimated number of 1.5 million
children are severely malnourished and require therapeutic treatment as a live saving intervention.
In Sindh province, Global Acute Malnutrition (GAM) rate of 17.5% and Severe Acute Malnutrition
(SAM) rate of 6.6% was recorded in the NNS 2011. The malnutrition attributed to inadequate infant
feeding practices and access to nutritious foods in adequate quantities.
Pakistan, being vulnerable to disasters, a delicate security situation and economic down turn in the
country has affected the purchasing power and household level food insecurity for vast numbers of
people. Emergencies exacerbated the underlying nutrition crisis in Pakistan. The flood emergencies
in several districts of Sindh, Punjab and Baluchistan in 2010, 2011 and 2012 caused displacement of
considerable number of people and resulted in massive livelihood losses, damages to infrastructure
to health and other basic services, as a result which nutrition vulnerability have persistently
increased. Sindh province was the most affected in the flood incidents of 2010, 2011 and 2012.
Different nutrition survey conducted from 2010-12 documented very high malnutrition rates in the
flood affected districts. In 2010, in flood affected district of North Sindh, the Global Acute
Malnutrition (GAM) rate was 23.1%, and Severe Acute Malnutrition (SAM) was 6.1%. In South Sindh,
the GAM rate was 21.2% and SAM 2.6%. ACF conducted nutritional survey in Tando Mohammad
Khan (TMK) District in October 2012, and documented GAM of 24.1% and SAM of 6.1. In addition,
screening figures from CMAM program implementation showed persistently high level of
malnutrition, as shown in the figure below.
0%
5%
10%
15%
20%
25%
Mo
nth 8
10
12 2 4 6 8
10
12 2 4 6 8
10
12 2 4 6
Year 2010 2011 2012 2013
Percent of Children Identified as SAM and MAM from the
screened in Sindh
MAM SAM
Page 5 of 50
1.2. NUTRITION RESPONSE
The nutrition response to flood affected communities started in 2010. Since then, the nutrition
program has expanded to thirteen disaster affected districts and is addressing malnutrition through
Community based Management of Acute Malnutrition (CMAM) intervention. The programme is
targeting1 moderate and severely malnourished children (6-59m) and moderately malnourished
pregnant and lactating women (PLWs). A total of 89,032 severely malnourished children, 255,640
moderately malnourished children, 129,475 PLWs at risk of malnutrition were treated from October
2010 to December 2012 in Sindh Province.
Community Outreach is the main activity to reach the community for mobilization and sensitization
regarding nutrition. Children under five years of age, and PLWs are screened in the community by
male and female community mobilizers, Lady Health Workers (LHWs) and Community Volunteers for
active case findings. Malnourished children and PLWs at risk of malnutrition cases are then referred
to the OTP and SFP site for treatment. Nutrition education awareness sessions are also conducted to
mothers of under-five children, and PLWs in the community and at the facility level. Dedicated
community mobilizers are hired together with community volunteers and LHWs for this activity.
Defaulters and absentees are also traced during outreach and motivated to attend the clinics.
1.3. SQUEAC Assessed Districts Umerkot has been officially declared as food insecure by the government of Sindh. With very big
geographical union councils and scarce infrastructure, this district is home to a large number of
minorities including Hindu communities. Less than half of the district is desert area and livelihood
depends on cattle farming in desert areas while working off farms on daily basis in other areas.
UNICEF supported CMAM programme in 2011-2012 in 11 UCs through ‘Health and Nutrition
Development Society’ (HANDS) and Blessing Welfare Association (BWA), International Medical Corps
(IMC) established 5 more UCs in 2012. Presently, CMAM is being implemented by SHIFA Foundation
in 24 UCs and Save the Children in 3 UCs of the district.
The southern coastal district of Thatta, western Shikarpur and Jacobabad districts have been
emergency prone due to flash floods, heavy rains and cyclones since 2010. In Thatta, Health
Oriented Preventive Education (HOPE), Society for Conservation and Protection of Environment
(SCOPE), IMC, Action Against Hunger (ACF) and Merlin delivered CMAM services in 40 UCs during
2010 -2011. While in 2012 Merlin continued delivering nutrition services in 13 Union Councils (UCs)
and at present 11 union councils are being covered for CMAM interventions. In Jacobabad, Save the
Children implemented in 10 Union counsels since 2011. In Kashmore, CMAM implemented by
HANDs since October 2010 and the assessed 10 UCs handed over to Johanitter International since
January 2013.
1 Out Patient Therapeutic Program (OTP) for the treatment of severely acute malnourished children. The admission criteria in the OTP is; a
child with MUAC less than 11.5 cm and bilateral pitting edema of grade three (+++). Ready to use therapeutic food (RUTF) is provided for
the treatment. After getting the 15% weight gain with MUAC more than 11.5 cm with no edema the child is discharged / cured and
transferred to SFP program.
Supplementary Feeding Program (SFP) for the treatment of children admitted with less than 12.4 cm to 11.5 cm MUAC and completed
treatment in OTP. The children are discharge after 15% of weight gain with more than 12.5 cm of MUAC and at least spent 2 months in the
program.
Stabilization Centre: Severely acute malnourished children with medical complication are referred to the stabilization center for further
treatment.

Page 6 of 50
2. METHODOLOGY
2.1. EVALUATION FOR ACCESS AND COVERAGE
SQUEAC was conducted in four nutrition intervention districts of Sindh including Thatta, Umerkot,
Kashmore and Jacobabad. SQUEAC was planned and conducted by Nutrition Cell, Department of
Health, and Sindh with technical assistance from UNICEF during the period of March and April 2013.
The evaluation and investigation was designed to take maximum benefit of the understanding of
community systems operating towards referral and treatment seeking behavior by detailed
interviews of CMAM workers, community members, beneficiaries and caretakers. This was also
reinforced by analysis of information gathered by Nutrition Information System (NIS) and many
others previous surveys. Other factors which may prove boosters or barriers for the programme
including health systems, socio-economic condition of the community and infrastructure were also
discussed.
A multi-pronged approach was used to gather quantitative and qualitative information in all the
selected union councils. A number of tools were adopted for recording, compilation and analysis of
the quantitative and qualitative information gathered. Coverage was estimated using a Bayesian
Beta-Binomial Conjugate Analysis performed using the SQUEAC Coverage Estimate Calculator
(BayesSQUEAC.app).
The study provided us with insight into the factors that promote and reduce the success of the
programme. It also helped to identify and consequently reduce any barriers operating in the
community towards better mobilization, sensitization and ultimately community participation in the
programme leading to better coverage of screening of children (6-59m) and pregnant and lactating
women in the programme union councils.
2.2. OBJECTIVES OF SQUEAC
The main objectives of the evaluation were the following:
1. Establish barriers and boosters to CMAM program coverage and uptake by the community
2. Measure CMAM coverage for purpose of measuring its performance
3. Provide informed recommendations for improved implementation
SQUEAC method was used to assess the CMAM programme in all four districts a 3 stages assessment
model was used:
Stage 1: analysis of qualitative and quantitative data
Stage 2: conducting a‘small area survey’ to test the hypothesis
Stage 3: conducting a ‘wide area survey’ to confirm or deny hypotheses about program coverage
that arises from the initial analysis of program data.
Sources of data: Use of data that was already available from sources such as NIS and NNS 2011.
More data was gathered by community and DoH interviews and discussions. Quantitative routine
program data and qualitative information obtained from care takers, facility in-charges, and CMAM
focal persons, LHWs, CBVs, key community figures, program staff and community members.
Methods: Three basic methods of collecting subjective data from a variety of sources were used in
investigation and assessments.

Page 7 of 50
Informal group discussions with:
• Carers of children attending OTP sites
• Relatively homogenous groups of key-informants (e.g. community leaders and religious leaders)
and lay-informants (e.g. mothers and fathers)
• Program staff
Semi-structured interviews with key-informants such as:
• Program staff
• Clinic staff
• Community-based informants such as schoolteachers, traditional healers, and traditional birth
attendants
• Carers of defaulting and Did Not Attend (DNA) cases
Simple structured interviews, undertaken as part of routine program monitoring and during small-
area surveys, with:
• Carers of defaulting and Did Not Attend (DNA)A cases
• Carers of non-covered cases found by small-area surveys
Stage 2: the hypotheses is generated and tested using small study and small surveys.
Stage 3: wide-area surveys to confirm or deny hypotheses about program coverage that arise from
the analysis of program and anecdotal data.
2.3. TIMELINES AND SCHEDULE FOR THE EVALUATION
W1 W2 W3 W4 W1 W2 W3 W4
Preparation for the survey (planning with DoH-provincial) -and NOC
Preparation for the survey (planning with DoH-Districts)
Transfer money to Provincial Nutrition Cell
Hiring of Enumerators and logistic Arrangement
Training for SQUEAC survey
Planning for the Fieldwork
Implementation of SQUEAC survey
March April
ACTIVITY
Jacobabad Kashmore Thatta Umerkot
2 days training on Quantitative and Qualitative tools 9th - 10th April 9th - 10th April
1 day field testing 11th April 11th April
2 days qualitative information 15th - 16th April 17th - 18th April 15th - 16th April 17th - 18th April
1 day brain storming 17th April 19th April 17th April 19th April
1 day planning of quantitative 18th April 20th April 18th April 20th April
Coverage Survey
4 days quantitative (4 days fieldwork) 19th -22nd April 21st - 24th April 19th -22nd April 21st - 24th April
2 days brain storming 23rd - 24th April 25th - 26th April 23rd - 24th April 25th - 26th April
Qualitative and Coverage field survey schedulle
Page 8 of 50
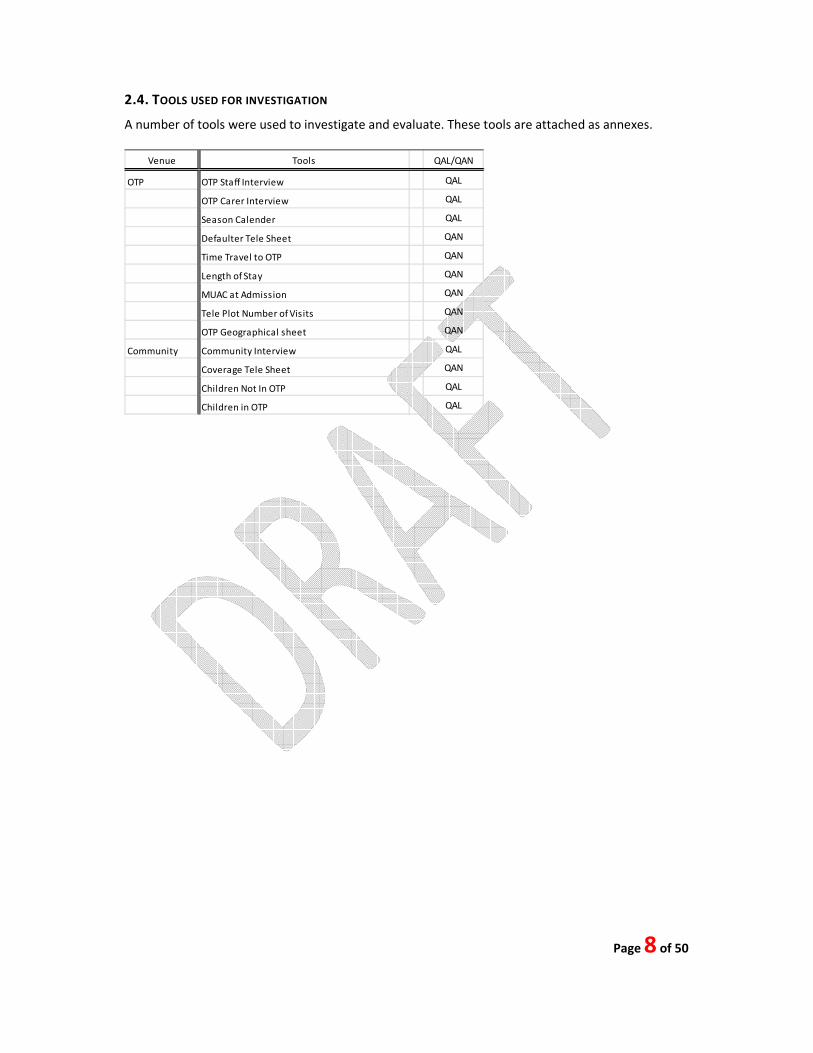
2.4. TOOLS USED FOR INVESTIGATION
A number of tools were used to investigate and evaluate. These tools are attached as annexes.
Venue Tools QAL/QAN
OTP OTP Staff Interview QAL
OTP Carer Interview QAL
Season Calender QAL
Defaulter Tele Sheet QAN
Time Travel to OTP QAN
Length of Stay QAN
MUAC at Admission QAN
Tele Plot Number of Visits QAN
OTP Geographical sheet QAN
Community Community Interview QAL
Coverage Tele Sheet QAN
Children Not In OTP QAL
Children in OTP QAL

Page 9 of 50
3. RESULTS
3.1. IN DEPTH INTERVIEWS WITH CARERS IN UMERKHOT AND THATTA DISTRICTS
In depth interviews with the community and staff were conducted as follows in district Umerkot:
17 April & 18th April
Team 1: Two staff and two Caregivers at RHC Nabisar Road. Two staff and two caretakers at GD
Soomardal
Team 2: Two staff and two caretakers at RHC mitho Rajar and two staff and two caretakers Samaro
road, GD Mureed Khaskheli. Two staff and three cargivers at GD Pithoro
Team 3: Two staff and five caregivers at GD Arif khan Bhurgari. Two staff and four caregivers at THQ
Samaro City
While in district Thatta the interviews were conducted as follows
15 April & 16th April
Team 1: Two staff and two caregivers at RHC Nabisar Road. two staff and two caretaker at GD
Soomardal.
Team 2: Two staff and two caretakers at RHC mitho Rajar and two staff and two caretakers Samaro
road, GD Mureed Khaskheli. Two staff and three cargivers at GD Pithoro.
Team 3: Two staff and five caregivers at GD Arif khan Bhurgari. Two staff and four caregivers at THQ
samaro City
Male Carers
Pathways
The male carers reported a number of pathways for entry into the OTP. One carer reported that his
son was screened by the visiting CMAM screening team and referred to the OTP when he was
identified as SAM. Another man became aware of the OTP through word of mouth, from a
shopkeeper residing close to the OTP. He then took his son for a checkup and he was admitted into
the programme. A third carer was informed about the program by a visiting Polio Team.
Names for SAM
Male caregivers used Kamzoor and Abhro as the most frequently used terms for malnourished
children
People who can identify SAM
A caregiver at RHC nabisar Road said it is the LHW of the area who can help identify the
malnourished cases since she knows all villagers. Shakar Lal at THQ Samaro said Volunteer in their
village can help. Saddam who lives Goth Mocharo Shar said land lord Shahnawaz and Kako Qasim in
their village can help. Rano lives at Arif Khan Bhurgari said a blind man in their village has all the
information about the villagers and is very active; he can help identify the malnourished children
Perception of the Nutrition program
Mostly the males in Umerkot perceived the cause of malnutrition to be poverty, due to not affording
good food for their children. Mostly they thought that it was dangerous and could lead to death.

Page 10 of 50
Gays hano who lives in Sommar Dal said a couple of days back a child who was very week in their
village with diarrohea died, so he was upset about malnourished child as well. In Thatta most male
carers mentioned that they did not know about disease malnutrition which can cause death. but
now they realized when they got into the program and appreciated it for their community and their
children.
Female Carers
Pathways
Most mothers in Umerkot and Thatta both said that they came to know from another woman in
their village or place they visited about the programme. Haleema lilving at araro bhurgari said she
was refered by a LHW Fatima. Chemi and Bavi from Arif Bhurgari said that they were informed by
masi Shareefan who was elder lady in their village. Hastu lives at Bamrejho village in Shadi Pali said
outreach team came to their village and screened the children. Attia living at Soomar Rajar said she
was informed by local Dr Abdul Lateef that her child was week and she must take her to OTP Mitho
Rajar. While in Thatta, most answered that their children were referred by the CBV and community
mobilizers who had done case finding in the their villages eg Nur Mohammad Gopang, Minther
samaypoto,. Some carers mentioned that they go to Tando mohammad Khan RHC, private hospital
in their localities. To those who went the local hopistals they mentioned that they did not have the
information about the nutrition program.
Knowledge about malnourished children
Most mothers in both districts knew about some of the children who they thought was
malnourished and OTP staff was notified about such children. Replying to the question that why they
were not admitted to the programme most said they were poor and had no one to take their child to
the OTP. In Thatta, most of the CTs did not know of any other children who looked like their who
was not in the program
Perception of the Malnutrition and Nutrition program
Mothers in general thought it was a very useful programme and they want to expand it to most
villages. words they used for malnourished children were Lanjho, Abro and week. Mother from most
villages in Thatta attending the CMAM sites stated that they did not know that malnutrition was a
disease. but they were aware of the referral term used locally-"Kangi" and "abro" for muslim
community. Most people referred to the malnutrition as weakness.
Key terms
Key terms used frequently by the community for malnutrition
Kangi (having visible bones and ribs like a comb)
Abhro (visibly getting week in a given time period)
Shukho (Thin)
Kamzoor (Physically week)
Distance to the site
Most mothers or caretakers came by walk to the OTPs, Chagul from Mocharo Shar came by walk
that took 30 min to two hours. Some came by rikshaw, Vans and cattle carts to the OTPs as well.

Page 11 of 50
3.2. COMMUNITY IN DEPTH GROUP DISCUSSION: UMERKHOT AND THATTA
Visit dates were 21st till 24th April 2013
Team 1: visited 16 villages
21/4 Naeem Nohri, Dodo Mangrio and Bilawal Mangrio and Malhi Paro
22/4 Ibrahim Nohri, Ali Bux Sharr and Mir Farm
23/4 nawab Jamshed, Imam Ali Sial and Hussain Sial and Pir Sarhadi
24/4 Khaskheli Mohalla, Abdul Aziz Nawab Khan and Kharoro Khaskheli, Kanwar Lal
Team 2: Visited 12 Villages
21/4 Ramzan Dokhai, Haji Kahro Lokai, Misri Lokai
22/4 Heral Station, Noor Ahmed Palli, Bahadar Theim,
23/4 Long Mangrio, Hardas Kohli, Amin Bix Rajar
24/4 Soomar dal, Usmani farm, Umar Bangro
Team 3: Visited 18 villages
21/4 Ramzan rajar, Ali Kharak, Dharelo and Old Paro
22/4 Samaro city, Ghulam Hedeaer Bhurgari, Juned Shah, Buxo kapri and makrani mohalla
sommaro
23/4 Pir majeed jan, Pir altaf, Pir nazeer jan, Dost Mohammad Sarhadi and Syed Jalal Sh
24/4 Mohammad raheem, Hameed Kallaro, mohammad Khan Chandia, Mahar Capri
IGD discussions
Most of the community members who participated in the discussion did not know about the recent
programme in Umerkot but knew that the programme has been operating previously.. The majority
had not seen a MUAC tape or RUTF. Generally the community members wanted to have such
programme close to their community. They said due to poverty, malnutrition was quite prevalent
and they could not afford private doctors. While in Thatta, only few villagers knew about the
programme. Surprisingly even the communities closer to the CMAM sites showed no knowledge of
the programme. In some villages, LHWs were quite active in active case finding and screening.
Community volunteers also were known for working for nutrition programme in some far off villages
Behavior of Staff
Staff members were generally perceived as having good behavior. Properly helping patients and
were carrying out all protocols with politeness.
3.3. OBSERVATION: UMERKHOT AND THATTA
Site location
Mostly the OTP sites were located within the community so most beneficiaries were coming to the
OTPs by walk. But considering very big geographic boundary of each UC in Umerkot and Thatta,
these sites were not proving easy access to all villages. The people knew about the health facility
name and about the programme. While space in Rural Health Centre (RHC) was enough, it was not
enough for OTP/SFP operation at government dispensaries. IYCF sessions were being held at OTP
Mureed Khaskheliu UC Samro road and GD Somar dal had IYCF Session under the tree. There was no
breast feeding corner at Samaro city OTP.
Beneficiary’s cards

Page 12 of 50
The staff was filling in all OTP cards and registers according to protocols.
Beneficiaries
Overcrowding at Aroro Burgari and Samaro city was creating discipline problems. They did not have
any covered place to sit and no water for drinking. Some OTPs had water coolers for the
beneficiaries as well. Generally, government dispensaries had little space for CMAM site and a single
room was being used for all components of CMAM including IYCF. OTPs were not allowed to be
setup at BHUs operated by PPHI.
Observations in villages
Most villages were quite far from OTPs. Ramzan Rajan was 45 km away from OTP Mitho Rajan.
Village Nawab aziz Kaimkhani was about 45 min by vehicle from OTP. Most SAM patients not in OTPs
were living far from OTPs as perceived by the caretakers.
3.4. INTERVIEWS WITH PROGRAM STAFF: UMERKHOT AND THATTA
Methodology: Semi structured interviews (SSIs) with program staff in the following facilities
Distance/Cost of travel
Most staff members had the perception that most caretakers come to OTPs by walk since there is
not much public transport available. Other means of commuting to the site were donkey cart,
rickshaw, motor bike and vans. Frequently mothers come in group from the same village by hiring
suzuki pickups. Likewise in Thatta, Most of the patients visiting the sites were those who came from
less than 2km away or within 30 minutes of walk. Some CTs use rickshaw and personal vehicles like
motorcycles and also public transport (bus)
Perception/Stigma
Villagers in Umerkot initially thought the program was doing food distribution, but theye were later
understood it was a treatment programme for malnourished children. Ameena at GD Pithoro told
some communities were making trouble for their operation since they wanted to have oil and
wanted to admit some children regardless of their malnutrition status. Jahan Ara, OTP asistant at GD
Arif Khan said bhurgari cast people did not allow their females to go to OTPs and they had they had
to have long advocacy sessions with them before they allowed outreach team to enter in their
villages. In Thatta, malnutrition is perceived as weakness and the patients are taken for treatment
only in case of medical ailments.
Phrases used to express Malnutrition
• Abro
• Sukho
• Kamzor
Daily beneficiaries coming to CMAM site
The range of beneficiaries attending the sites was ranging from 2 to 100 beneficiaries per day in both
districts. OTP children identified daily averaged to be 20 to25 patients per day in Umerkot and 10 to
15 patients per day in Thatta
Main challenges
Challenges mentioned by the program staff are:
• Long distances
• Poor availability of transportation

Page 13 of 50
• Inadequate salaries and transport for CMAM staff especially females
• Religious stigma
• Oil distribution for PLWs as part malnourished PLWs treatment caused political pressure to
be distributed to women who did not come under criteria of SFP
• Lack of electricity and sanitation
• Ware house problems at GD Pithoro
• Low education among the community makes it hard to make them understand the
treatment related messages
• Small room space for CMAM operation
Dealing with defaulters
The OTP staff told they are recording phone numbers of all admissions so that they can be contacted
if they miss any follow-up visit. List of defaulters was developed of all such patients to be given to
dedicated outreach staff in each UC for defaulter tracing in the community. Very few defaulters
were noted in both districts.
Other sources of referrals
The staff mentioned referrals from:
• Outreach staff and volunteers
• Referrals from mother to mother
• Traditional Birth Attendants (TBAs)
• LHVs, Polio and EPI staff and other HF staff
• PPHI
• Self-referrals.
• Pesh Imams of villages
• While in Thatta, some more referring pathways were identified together with the previous
list
• EPI technicians
• HDF (Trust/local NGO)
Supplies
Since SHIFA foundation started a few weeks back, they had enough supplies and there was no supply
breaks during the short program duration. Responding to questions on their understanding of supply
breaks all were clear that supply breaks will cause more defaulters and a negative impression of the
programme on the community. They also mentioned that community may become violent if they
come repeatedly and were told there was no supply. In Thatta, programme staff commented closure
of SFP generally has implications on OTP activities negatively.
Specific communities not accessing program
The following communities were considered to be problematic by others so they have low access to
the program.
• Sharr
• Chandia
• Murry
• Bhurgari
• Bhaya
• Mangrio
• Syeds

Page 14 of 50
3.5. IN DEPTH INTERVIEWS WITH CARERS AND STAFF, AND COMMUNITY INTERVIEW: JACOBABAD AND
KASHMORE
Village visited Jacobabad Dates of visits
UC Joungle: Sher muhammad khoso, Sohno samejo, Joungle city , Ali Nawaz
pahore, Achar Khan banglani.
UC Gari Chand: Meboob Jatoi, Arif Machi, Abad City,Gari chand,Khudadad
Kehar , Qadir Bux mangrio, Zeeshan khan Pahore.
UC Muhammad Pur: Faiz Muhammad, Muhammad Pur, Partab,
Nasrullah,Pathan wah , Shoro taheem.
UC Allah Abad: Zaman Brohi, Mitho Brohi, Feroz khan, Dur Muhammad,
Sawaql Brohi.
UC Ahmad Pur: Shah Bux, Sahib Dino, Sobidar Khoso, Ali pur, Goli Mar, Ayub
Brohi.
UC Kot Jangu: Sharif Bughti, Amanullah Khoso, Sakhi Hamzo, Kot Jangu,
Ramzan Khoso.
16th
April, 2013
Village visited Kashmore
UC Dari: Siyano ogahi, Nachoo jagirani, Markh bhayo,Bahoo lolai, Old Fojo
Lolai,
UC Dolat Pur: Lal Bux sajrani, Kamil Shah, Ali Muhammad khoso, Kawro khan
Bangwar, Ali Muhammad Khoso.
UC Akehro: Sobo Khan Ogahi, Rehmat Abad, Nabi Bux Golo, Rabnawaz Pathan,
Ghazi Khan.
17th
April, 2013
Pathways to Care
The purpose of the interview from the carers was to know about the children already admitted in
the program. Most of the carers in both districts mentioned that their children were referred by
CBVs and Community Mobilizers. Some of the carers said that they have come to know from an
awareness sessions held by community worker in the respective village. Most of the cases were also
referred by the medical doctors of the health facility, EPI technician, LHVs and neighbours whose
child was already admitted in the program. Moreover they said that some of the malnourished
children are still in the community and we are ready to help for referring these cases to the OTP
sites.
Distance to the CMAM Sites
In order to get the exact information of the villages, which are far away from the sites, carers were
interviewed and according to them they are living near to the satellite sites but for static sites it was
revealed that it took them 30 to 40 minutes to reach to these sites. Those villages, which are far
away from static sites, they mostly use local transport, motorbikes, rickshaws and donkey carts to
reach to the sites.
Distance/ transportation issue
The information collected during the interviews with program staff was regarding access of the
beneficiaries to the OTP sites. It revealed that most of the beneficiaries are coming from different
villages of the union councils, which are not far away from the OTP sites. In district Jacobabad, 2
satellite sites are being operated at each union council in order to provide access to beneficiaries

Page 15 of 50
living in very remote villages. These sites were mostly established in communal locations provided
by the respective communities. In district Kashmore services are being provided at mobile health
units where beneficiaries are coming from far flung areas around 2-4 km away. They mostly use local
transport, rickshaw, motorbikes and donkey carts to reach to the health facility and it takes them on
average; 30-40 minutes to reach to the health facility.
Flow of Beneficiaries to OTP sites
According to the program staff, the average caseload of beneficiaries on these sites is 30 to 50
beneficiaries; including follow-up cases with average of 50 persons per site. By establishing the
satellite sites, Save the Children was able to provide services to people living in remote villages of
targeted UCs. In routine setup of the OTP, Supplementary Feeding Program (SFP) for (SAM U5, MAM
U5 and Moderate Acute Malnutrition Pregnant &Lactating Women) and IYCF services were delivered
at the same site. In the interviews, responders identified a period that decreased the flow of
beneficiaries due to SFP supplies unavailability in January 2013.
Key definition of malnutrition and perception of the program
As per understanding of program staff; malnutrition is considered as weakness and children need to
take medical treatment in case of medical complications. However community does not consider
malnutrition as a problem. Both partners working in the area (Save the Children, and Johanitter
International) working to raise the awareness of the community on malnutrition and their impact on
the growth of the children.
Referrals and default tracing
It is reported that dedicated community mobilizers are doing door-to-door visits, identifying
malnourished children and women and referring them to the facilities. Moreover, community
volunteers trained on MUAC and referrals are an additional source for the program.
Other sources of referrals
The program staff stated that children and PLWs were referred to OTP sites by Community
Volunteers who belong to the same communities. The programs in both districts also involved Lady
Health Workers of National Program for referrals, default tracing and awareness-raising in the
community regarding CMAM program. Moreover medical doctors and LHVs at static facilities are
also referring malnourished patients to CMAM program. Many children were also coming to CMAM
sites as “self-referrals” cases.
3.6. QUANTITATIVE INFORMATION FROM PROGRAM DATA: UMERKHOT AND THATTA
Length of Stay
Length of Stay (LOS) is averagely 6 to 7 weeks showing early treatment seeking of carers and
identification of malnourished children by the outreach teams.

Page 16 of 50
Defaulters
Most defaulters were noted as residing in villages more than one hour distance from the OTPs. This
is understandable in terms of low community and household financial resources and public
transport. This particular pattern of defaulters will be analyzed later in the programme when SHIFA
will start recording their own defaulters.
MUAC Ranges
Majority of patients admitted were close to the admission threshold. This shows an early treatment
seeking behavior of the community together with good sensitization and outreach activity
performance.
Page 17 of 50
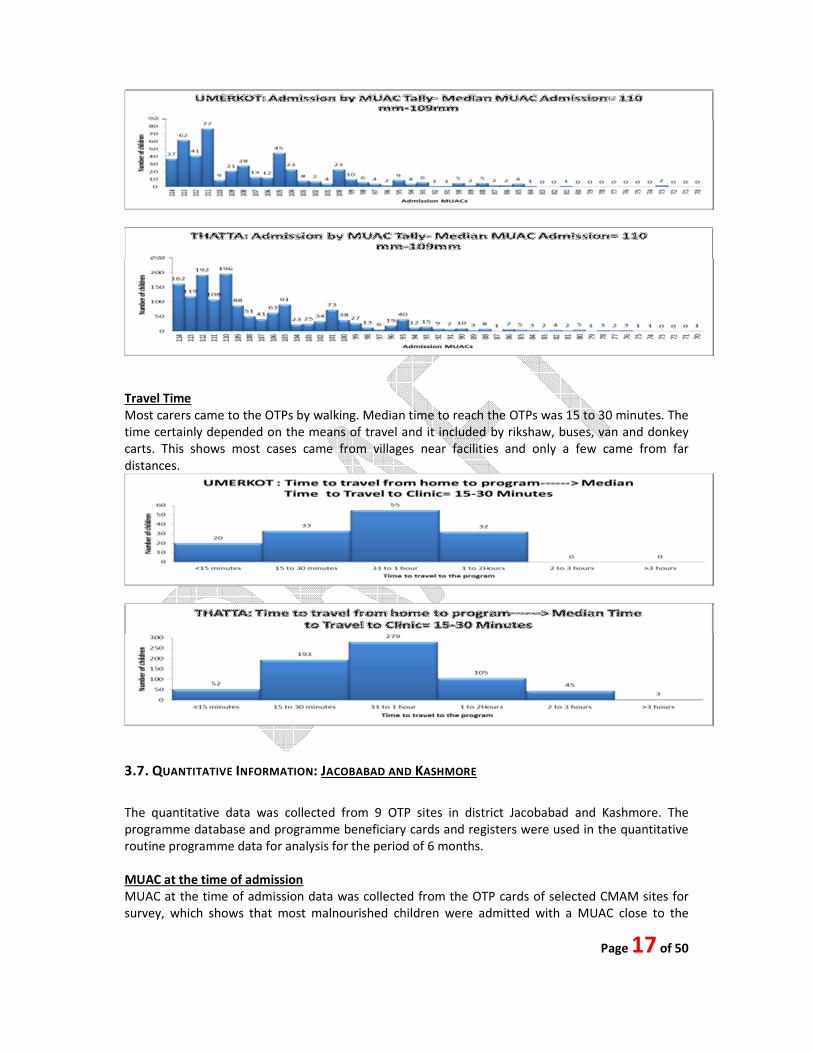
Travel Time
Most carers came to the OTPs by walking. Median time to reach the OTPs was 15 to 30 minutes. The
time certainly depended on the means of travel and it included by rikshaw, buses, van and donkey
carts. This shows most cases came from villages near facilities and only a few came from far
distances.
3.7. QUANTITATIVE INFORMATION: JACOBABAD AND KASHMORE
The quantitative data was collected from 9 OTP sites in district Jacobabad and Kashmore. The
programme database and programme beneficiary cards and registers were used in the quantitative
routine programme data for analysis for the period of 6 months.
MUAC at the time of admission
MUAC at the time of admission data was collected from the OTP cards of selected CMAM sites for
survey, which shows that most malnourished children were admitted with a MUAC close to the

Page 18 of 50
admission criteria. The median MUAC at admission was 10.0 to 9.9cm, which indicates that more
than 50% of the children were admitted into OTP program in time and were admitted early in the
program, which shows the evidence of a good practice of early treatment seeking behavior.
Distance from the OTP sites (Time to travel)
As both the partners (Save the Children and Johanitter International) have satellite and static OTP
sites in both districts, the time was noted from the OTP cards for all the OTP children of the selected
CMAM sites. The limit of distance assumed in program planning was 3 km, which aims to make the
program accessible to the community. The distance to be covered by carers of the beneficiaries
would increase as the program expands and more of the beneficiaries would be increases over time.
The time to travel by the beneficiaries was assumed in walking time rather than time used in local
transport. Most of the carers indicate that they were using local transport because the distance they
covered would have been more than 2 hours walk. In recent months, some of the nomadic children
have been admitted were brought on donkey carts to access the OTP site, thus over the course of
the program more beneficiaries came from far areas.

Page 19 of 50
Length of stay
Most of the SAM cases were discharged cured after acceptable number of visits according to the
CMAM guidelines and protocols. The median length of stay was 6 weeks. Cases that stay beyond 16
weeks were those retained in OTP due to absenteeism from the program as well as SFP supplies
shortage. The reasons for absentees was the busy schedule of the carers as well as well as long
distance from the OTP sites because of no resources of transportation. Most of the beneficiaries
were admitted in the program with a critical SAM condition. It is also important to mention that
most of the cases were admitted early in the program that was very close to the discharge criteria,
as such SAM cases were cured quickly as they were admitted to the program with very closer MUAC
to discharge criteria which leads to acceptable length of stay.
Defaulters

Page 20 of 50
Visits before defaulting
The visits before defaulting counted from the OTP cards of defaulted beneficiaries of selected
CMAM sites. For this purpose all the enrolment cards of the facilities included in the assessment
were checked for default and the data was recorded. The median visits before defaulting was noted
as 3rd
visit. It is important to mention here that some of the nomadic children were admitted from
the community were shifted from the area where OTP site was established, while in statics site like
RHC Jhudo, most of the children were coming from other adjacent union councils also connected to
the Rural Health Centre. One female carer also mentioned that she had visited hospital for the
treatment of her child from a medical doctor who referred him to the OTP site. The flow of
beneficiaries and catchment area of this RHC is very high.
3.8. BARRIER AND BOOSTERS: UMERKHOT AND THATTA
Barriers and boosters were valued according to the weight they contribute to coverage. Each group
provided weight with score ranging between 0 and 5; to each barriers and boosters on the basis of
their importance for coverage. Average of those weights was calculated which are shown in the
table below. Thereafter, the boosters were added to the minimum coverage (0%) while the barriers
were deducted from the maximum coverage (100%), and then the mean value of the two calculated.
Barriers
Over Crowding
Most beneficiaries came to the OTPs after hearing from other members of the community,
neighbors and through mother to mother communication. OTP staff had screened all attendees at

Page 21 of 50
the OTP. This created over crowding at the premises. This will improve as the outreach teams will
reach more villages and screen and will refer the malnourished children only
Low resources of community
District Umerkot is considered food insecure and consists of large number of Hindu and nomad
community dependent on daily wedged labour in the field and hence do not have much resources to
hire transport to the OTPs which on average charge Rs 100 for the round trip
Low availability of Transport
Very few buses were available for travelling within the UCs. Most beneficiaries travelled in groups
hiring rickshaws, while some by cattle carts and motor cycles.
Lack of adequate vehicles for outreach / travelling
Although SHIFA Foundation had 11 vehicles for 24 UCs, but this was considered not enough due to
large distances and because of the fact that the same vehicles were being used for transporting
supplies, staff and outreach.
Lack of Electricity/Sanitation/water
Lack of basic facilities at the OTPs in the hot weather was considered as one of the barriers in
smooth operation of SAM treatment protocols
Some community creating problems at OTPs
Some staff complained of people coming to OTPs and asking for oil or admission of their child where
he was labeled as normal. More sensitization among the community leaders and the community
itself will be needed to make them understand the objectives and target beneficiaries of the
programme
Language issues between staff and community
District Umerkot has variety of different language speaking communities. Majority were Sindh is but
large number of Dhatki, Baluchi, and Punjabi speaking community were also present. OTPs at
Nabisar and Soomardal had Urdu speaking staff that were having a hard time understanding and
making the benficiaries understand the key messages. On the other hand OTP at Mitho Rajar had all
the local staff and the communication between them and the carers was optimal.
Travelling problem for wemen due to cultural restriction
Ownership of DoH in CMAM
There appeared a lack of ownership of DoH in CMAM programme. Government staff at the
Dispensaries where OTPs were setup were not seen taking interest in the proceedings of the OTPs.
SHIFA has plans of training all Government staff including LHWs on CMAM and IYCF.
Mothers busy in field work
Women were generally involved with all stages of harvesting and therefore they had to work in the
fields from early morning till afternoon. This appeared to be a big problem in sensitization activities
in the villages.

Page 22 of 50
Boosters
DoH / Polio / HF staff referrals
Evidence of HF and EPI staff and Polio team referrals were found in all UCs evaluated. This was
considered good for the progarmme but needed to be strengthened
Mother to Mother communication
Evidence found in all UCs. For example, village Somoomar Khaskheli, mothers gathering at water
source communicated others regarding the programme. Carers at RHC Nabisar told about
knowledge of the programme through neighbors and food stalls.
Mosque announcements
Village Moreed Khaskheli had mosque announcements which are to be replicated in other places as
well. This shows good level of advocacy and sensitization among the Imams and Key Leaders
Involvement of LHWs
LHWs were witnessed screening in village Araro Bhurgeri. LHWs were involved in the programme
from the start and were helping in screening and referring.
Involvement of TBAs
Evidence of TBAs involved in screening and refereeing was found at RHC Arif Khan Bhurgari.
Awareness of community due to previous programme
Community was aware of a successful previous programme and was happy to have it again in their
area.
Good Outreach
Although no List of villages and plans were still developed but the outreach teams were doing
outreach activities and this was also evident from the community interviews as well in different

Page 23 of 50
villages evaluated and surveyed. 2 males and 2 females were dedicated to outreach activities in each
Union Council
Motivated Staff
Staff was seen dedicatedly involved with CMAM implementations in spite of all problems related to
basic facilities and hot weather.
Good Defaulter Strategy
Phone numbers of carers were noted of all SAM admitted, the staff had planned to contact to
follow-up in case of absent or when there is a chance of a patient getting defaulted. They also had
planned generation of regular defaulter list through NIS.
Volunteers
Volunteers were being identified in most villages to follow-up on the patients in their areas. These
volunteers were in addition to the Community Resource Persons (CRPs).
Staff from Local Community
Most OTP staff was being hired from the local area resulting in good communication between the
staff and the local community. These staff members also had contacts with local land lords and key
figures to secure their support for outreach activities.
List of Villages and plan of outreach present OTP
Most OTP sites had list of villages to be covered in their union councils in both districts. These lists
were used for weekly outreach plans.
Concept Mapping of CMAM Programme Implications
All factors affecting the implementation of CMAM programme in the district at health facility and
community level were discussed in detail while the quantitative and qualitative data was gathered
and compiled. These factors were analyzed and put in a graphical form to understand the success
and failure of the programme in that particular district’s perspective. The concept map in both
districts were based on the views of Early Treatment Seeking Behavior and to a less extent opinion of
the CMAM programme
Umerkot
Early treatment of severely malnourished children was encouraged by various factors as well as
inhibited by others. Some of the factors that inhibited early seeking behavior were: 1) narrow
recruitment of case finders, making it hard for program to thrive in areas which had not recruited
community volunteers yet, 2) absence of linkage with religious leaders and local and private
practitioners, and 3) breaks in the SFP supply pipeline (SFPs and OTPs operate at same sites) led to
decrease overall attendance to OTPs (SFP and OTP beneficiaries tend to travel together to CMAM
sites), and at time of SFP failure MAM cases slipping into SAM were not being detected, and 4) Lack
of regularly working satellite sites to facilitate the access to program for far placed communities (
Please see Annex 1.1 for the diagram of the concept note)
Thatta
Almost same factors were identified in district Thatta as well. While some other factors like, LHW
involvement, better community volunteer network throughout the programme UCs, better defaulter
tracing mechanism and more community referral due to long presence of programme played a

Page 24 of 50
positive part in the success of the overall programme results ( Please see Annex 1.2 for the diagram
of the concept note).
While developing a concept for the CMAM programme implications in the programme area, it was
clear that the key determinants of coverage, less so in district Umerkot but generally were in place.
Before embarking on the second part of the SQUEAC, the data collected from the routine program
data and qualitative data was combined to provide information about where coverage was likely to
be satisfactory and also, was summarized into likely boosters and barriers to service access and
uptake that exist within the program.
Table 1 & 2 lists barriers and boosters identified for each district. The sources of information for
triangulation included; Program Staff interviews, Community Nutrition Volunteers –IGD, Male &
female carer interviews, Review of record, Self-observations, case studies, Survey Questionnaires
and Carer interview within the community
.The SQUEAC team believed that they had exhausted collecting all the necessary information
through the cases studies, semi structured interviews and the in-depth discussions as explained
earlier in the report.
Assumptive Coverage
Un-Weighted Barriers and Boosters: Each of the barriers and boosters were discussed in depth and
abridged and given equal scores of 5 to be used to weigh the total boosters and barriers. The
positive scores were added together for the boosters and likewise negative scores for barriers.
District Umerkot
The total score of barriers was calculated to be 28% and the total score of boosters was 13%. The
total score for boosters was added to the minimum possible coverage (0%), to give 28% while the
total score for barriers was subtracted from the highest possible coverage (100%), to give 83%. The
average of the two, i.e., 49% was used in the calculation of the mode for a trial distribution curve
(prior) plotted using the Bayes SQUEAC Calculator.
Assumptive Coverage 0.49
Minimum Assumption 0.29
Maximum Assumption 0.69
District Thatta
Barriers Score Simple Boosters Score Simple
Over Crowding 4 5 DoH / Polio / HF staff referrals 1 5
Low resources of community 3 5 Mother to Mother communication 3 5
Low availability of Transport 4 5 LHWs 1 5
Lack of adquate veicles for out reach / travelling 3 5 Awareness of community due to previous programme 1 5
Lack of Electricity/Sanitation/water 1 5 Good Outreach 2 5
Lack of Electricity/Sanitation/water 1 5 Motivated Staff 3 5
Some community creating problems at OTPs 1 5 Good Defaulter Stretegy 1 5
Language issues btw staff and community 1 5 Voluntiers 1 5
Travelling problem for wemen due to parda 2 5
Ownership of DoH in CMAM 3 5
Availaibility of List of Village at UC OTP 3 5
Mothers busy in field work 2 5
28 60 13 40

Page 25 of 50
Assumptive Coverage 0.58
Minimum Assumption 0.38
Maximum Assumption 0.78
Bayesian Beta-Binomial Conjugate Analysis
Bayesian technique (Beta-Binomial Conjugate Analysis) was used to estimate program coverage with
the prior probability density (the prior) created using routine data and qualitative data (summarized
above). Typically the process of defining the prior starts with a uniform probability for all coverage
proportions between 20% and 80%. The prior is then ‘shaped’ by consideration of the collected
routine and qualitative data with the mode decided by working up from 20% and down from 80%
and the limits defined by ‘informed belief’ about coverage. The modal value 58% was plotted using
the Bayes SQUEAC Calculator with a precision of +/- 10% at 95% credible interval (confidence
interval).
BELIEF HISTOGRAM FOR DISTRICT UMERKOT AND THATTA
3.9. BARRIERS AND BOOSTERS: JACOBABAD AND KASHMORE
Barriers and boosters were valued according to the weight they contribute to coverage. Each group
provided weight with score ranging between 0 and 5; to each barriers and boosters on the basis of
their importance for coverage. Average of those weights was calculated which are shown in the
Barriers Score simple Boosters Score simple
Long Distances 5 5 OTP services well known 3 5
Week Outreach 4 5 Good perception of programme due to high cure rates 4 5
Less Staff 4 5 Communication within community is strong / Self Referrals 4 5
Less OTP time due to staff travelling 2 5 Presence of CRPs 3 5
Less Public Transport / Resources 3 5 Religeous Dargah 1 5
Small Space for OTP 3 5 LHWs Support 2 5
Break/Shortage of Supplies 1 5 DoH / Polio / HF staff referrals 3 5
Over crowding at OTPs 3 5 OTPs setup at GDs 2 5
Screening at OTPs 3 5 Dedicated Staff 3 5
Irregular OTP session IYCF & Nutrition 3 5 Local Satff 1 5
Lack of Electricity/Sanitation/water 1 5 Good outreach at certain areas 1 5
No Defaulter Listing 2 5
Staff Attitude 1 5
No Microplaning for field activities 3 5
38 70 27 55

Page 26 of 50
table below. Thereafter, the boosters were added to the minimum coverage (0%) while the barriers
were deducted from the maximum coverage (100%), and then the mean value of the two calculated.
Boosters Jacobabad
Reasons N
Self-referrals 5
Buffer stock 4
Referrals from the community 4
Active community based volunteers 3
Communal places for services/acceptance of the program 3
Mobile sites 3
Behavior of staff/ session in the community 4
High cure rate/low defaulters /low death rate 4
efficient flow of patients/good quality CMAM services 2
visibility of the program/IEC materials 1
timely treatment seeking 3
Reduction in problems associated with the community 1
Coverage questions( from caregiver interview) referrals & follow-ups 1
sensitization sessions/awareness raising sessions 1
effective referrals from SFP and IYCF 1
Barriers Jacobabad
Reasons N
Long Distances 4
Busy in other activities (Farming) 4
Conflict within the communities 3
No Knowledge about the program 4
Stock outs 3
Late follow ups 3
No community outreach activities 2
Un-weighted barriers and boosters (Jacobabad)
For all barriers and boosters an equal weight of 5 were given and summarized. The total weight for
barriers and boosters were determined which were 35% & 75% respectively. The positive scores
were added together that is, giving 75% for the boosters pushing the program towards increased
coverage while the sum of barriers scores 35% was subtracted from 100% which pulling the
coverage lower. The un-weighted value was 70%.
Prior Mode = 75% + (100% - 35%) = 75% +65% = 70%
2 2
Weighted barriers and boosters (Jacobabad)

Page 27 of 50
All the barriers and boosters collected from qualitative information and routine program data were
ranked (1-5 scores) initially as 5 for highest and 1 for lowest. The total weight of barriers and
boosters were determined by giving them proper weight according to repetition in qualitative
information. The most important barriers and boosters were ranked high as 5 to complete the
weighing process. The average of the two resulting number was taken.
Prior Mode= 40% + (100% - 23%) = 40% + 77% = 58.5%
2 2
Boosters Kashmore
Reasons N
Mobile sites 4
involvement of LHWs 4
Self referrals 4
volunteers uncovered areas 3
Communal places for services/acceptance of the program 3
referrals from the community 3
trained staff 3
High cure rate/low defaulters /low death rate 4
sessions in the community 2
involvement of community members 2
flow of patients to OTP 1
behavior of program staff 1
Barriers Kashmore
Reasons N
Access to OTP sites 3
Security issues 2
No community volunteers 3
Breakage in supplies 2
No knowledge of the program 2
Transport issues 1
Low community mobilization/sensitization 1
Un-weighted barriers & boosters (Kashmore)
For all barriers and boosters an equal weight of 5 were given after taking qualitative data from the
field and were summarized according to the repetition. The total weight for barriers and boosters
were determined which were 35% & 60% respectively. The positive scores were added together that
is, giving 60% for the boosters pushing the program towards increased coverage while the sum of
barriers scores 35% was subtracted from 100% which pulling the coverage lower. The un-weighted
value was 62.5%.
Prior Mode = 60% + (100% - 35%) = 60% +65% = 62.5%
2 2

Page 28 of 50
Weighted barriers and boosters (Kashmore)
All the barriers and boosters collected from qualitative information and routine program data were
ranked (1-5 scores) initially as 5 for highest and 1 for lowest. The total weight of barriers and
boosters were determined by giving them proper weight according to repetition in qualitative
information. The most important barriers and boosters were ranked high as 5 to complete the
weighing process. The average of the two resulting number was taken.
Prior Mode= 34% + (100% - 14%) = 34% + 86% = 60%
2 2
Concept Mapping of CMAM Programme Implications
All factors affecting the implementation of CMAM programme in the district at health facility and
community level were discussed in detail while the quantitative and qualitative data was gathered
and compiled. These factors were analyzed and put in a graphical form to understand the success
and failure of the programme in that particular district’s perspective. The concept map in both
districts were based on the views of Early Treatment Seeking Behavior and to a less extent opinion of
the CMAM programme
The SQUEAC team believed that they had exhausted collecting all the necessary information through
the cases studies, semi structured interviews and the in-depth discussions as explained earlier in the
report.
Bayesian Beta-Binomial Conjugate Analysis
Bayesian technique (Beta-Binomial Conjugate Analysis) was used to estimate program coverage with
the prior probability density (the prior) created using routine data and qualitative data (summarized
above). The belief histogram was based on the ranking proposed by consensus by each of the
participant of the coverage assessment. Each participant decision was based on their findings
obtained through qualitative and quantitative information from the first stage of assessment of
CMAM program. The values of the belief of coverage for each member were ranked on the basis of
repetition. The belief model was then decided on the basis of weighted and un-weighted barriers
and boosters to obtain prior mode of 58.5% for Jacobabad while 60% for Kashmore.
The prior value was plotted on the SQUEAC calculator using prior mode of 60% against the
uncertainty + 20 percentage points at 95% credible interval. Alpha prior of 31.8 and the beta prior of
21.2 were used to shape the prior mode. The final curve obtained from the analysis is presented in
the Bayes SQUEAC survey coverage prior, likelihood and posterior.
The plot of the prior, likelihood, and posterior for the Bayesian Beta-Binomial conjugate analysis for
both districts are presented below

Page 29 of 50
BELIEF HISTOGRAM FOR DISTRICT JACOBABAD AND KASHMORE
3.10. WIDE AREA SURVEY: UMERKHOT AND THATTA
Sample size
Simulation of the BAYES SQUEAC calculator was used to estimate the sample size of the wide area
survey using the modal prior of 58%, alpha prior 33 and Beta prior of 26 for Thatta and 48%, alpha
prior 25 and Beta prior of 27 for Umerkhot. A likelihoods sample size of 57 SAM children was
calculated for Thatta and 50 for Umerkhot.
Minimum sample size for Umerkhot = alpha prior + beta prior-2
25+ 27-2 = 50
Minimum sample size ≥ 50
Minimum sample size for Thatta = alpha prior + beta prior-2
33 + 26-2 = 57
Minimum sample size ≥ 57
Active case finding
Active and adaptive case finding was conducted in the communities using the following
methodology:
Sampling method
Spatial sampling approach was used to randomly select villages that were stratified
comprehensively in UCs. This was done as follows:

Page 30 of 50
Step 1: List of villages with estimated population (taken from UNOCHA provided projection of UC
wise population in Sindh) was developed for all the areas of OTP sites. The percentage of under-fives
(15%) per village was obtained and a prevalence SAM (6.6%) was used to estimate the number of
SAM children that could be obtained from each village. Approximately 2 SAM children were
expected to be found in each village.
Step 2: Systematic sampling started at 7th village and then every 9th
was used to select the villages
to be visited from the composed list of villages by UC where CMAM program operates. A total of 27
villages were identified for Umerkot and visits. While first 4th
village and then every 7th
village was
selected from the list in Thatta.
Details of data collection
The teams screened all the children in the sampled villages to find all or near all SAM cases in the 27
selected villages to estimate the coverage and confirm the prior. Identified SAM cases were
categorized as 1) SAM cases that were currently attending the program, 2) SAM cases that were not
enrolled in the program, and 3) recovering cases (those that have MUAC above 115 mm but yet to
attain discharge criteria-15% weight gain).
Data compilation and analysis
During the SQUEAC survey, a total of 3,395 children screened out of which 209 cases were
identified. This included 109 under treatment (including 37 recovering cases) and 100 not in
programme SAM cases. Based on the figures, the severe malnutrition rates both in Umerkhot and
Thatta was 5.1% as shown in the Table below.
District Total screened Total identified Total SAM SAM rate
Umerkhot 1915 102 97 5.1%
Thatta 1479 107 75 5.1%
Total 3394 209 172 5.1%
SCHILDREN SCREENED AND SAM IDENTIFIED IN UMERKOT AND THATTA
The survey likelihood data was summarized using the numerator and denominator as shown below
to calculate the coverage. The point coverage estimator was used because of reasonably effective
Umerkot
Union counciuls Team 1 Team 2 team 3 Total
SAM cases identified 32 29 36 97
Sam in program 11 12 13 36
SAM not in program 21 17 23 61
Recovering caese 1 2 2 5
Thatta
Union councils Team 1 Team 2 Team 3 Total
SAM cases identified 23 23 29 75
SAM in program 12 10 14 36
SAM not in program 11 13 15 39
Recovering cases 13 11 8 32

Page 31 of 50
case-finding resulting in timely identification and referrals, and acceptable lengths of stay, hence
coverage was calculated as:
Number of severe cases in feeding program X 100
Total number of severe cases
The point coverage for Umerkhot is estimated to be 37.1% (CI 27.5% - 46.7 %).
The point coverage for Thatta is estimated to be 48.8% (CI 36.7% - 59.3%).
The period coverage calculated as the below formula to compare with the point coverage. The
period coverage for Umerkhot was 40.2% (95% CI 30.7% - 49.7%) and Thatta 64.6% (95% CI 55.6% -
73.1%).
Number of severe cases + recovering cases in feeding program X 100
Total number of severe cases + recovering cases in feeding program
The point coverage of Umerkhot was much below the minimum SPHERE standards of 50% and
period coverage was also comparable with the point coverage. This was not a surprise results as the
coverage survey was conducted just 2 months after the program established, coverage is expected
to increase with time.
The point coverage of Thatta was below the minimum SPHERE standards of 50%, the period
coverage was higher than point coverage, this might reflect on the weakness of the timely
identification of current severe cases in spite of the fact that the program was in place for long time.
3.11. WIDE AREA SURVEY: JACOBABAD AND KASHMORE
Sample size
As per the calculator of the BAYES SQUEAC, the modal prior of 58.5%, alpha prior 33 and Beta prior
of 25 for Jacobabad and 60%, alpha prior 35 and Beta prior of 23 for Kashmore. A likelihoods sample
size of 56 SAM children was calculated for Jacobabad and 56 for Kashmore.
Minimum sample size for Jacobabad = alpha prior + beta prior-2
33 +25-2 = 56
Minimum sample size ≥ 56
Minimum sample size for Kashmore = alpha prior + beta prior-2
35 + 23-2 = 56
Minimum sample size ≥ 56
Active case finding
Active and adaptive case finding was conducted in the communities using the following
methodology:

Page 32 of 50
Sampling method
Spatial sampling approach was used to randomly select villages that were stratified
comprehensively in UCs. This was done as follows:
Step 1: List of villages with estimated population (taken from UNOCHA provided projection of UC
wise population in Sindh) was developed for all the areas of OTP sites. The percentage of under-fives
(15%) per village was obtained and a prevalence SAM (6.6%) was used to estimate the number of
SAM children that could be obtained from each village. Approximately 2 SAM children were
expected to be found in each village.
Step 2: Systematic sampling was used; comprehensive list of all villages was used to select the
villages to be visited from the composed list of villages by UC where CMAM program operates.
Details of data collection
The teams screened all the children in the sampled villages to find all or near all SAM cases in the 27
selected villages to estimate the coverage and confirm the prior. MUAC of the SAM cases were taken
and semi structured questionnaire-annexed to this report-was administered on non-covered cases.
Specific local definitions of SAM and etiologies were used to ask community members to bring the
survey team to children with SAM. Identified SAM cases were categorized as 1) SAM cases that were
currently attending the program, 2) SAM cases that were not enrolled in the program, and 3)
recovering cases (those that have MUAC above 115 mm but yet to attain discharge criteria-15%
weight gain).
Data compilation and analysis
The survey team used active as well as adaptive case finding technique to find out all children in the
village who are SAM to estimate coverage and confirm the value of prior, for this purpose all the
selected 20 villages in Jacobabad and 11 villages in district Kashmore were screened and MUAC was
taken for all cases. The identified cases were categorized as;
i) SAM cases who are currently enrolled in the program
ii) SAM cases who are not in the program
iii) Recovering cases with MUAC above 11.5cm (MAM cases).
The data is presented in below tables for both the districts. The severe malnutrition rate in
Jacobabad found to be 3.7% and Kashmore 6.4% as shown in the Table below.
District Total screened Total cases identified Total SAM SAM rate
Jacobabad 1,915 117 70 3.7%
Kashmore 1,479 124 95 6.4%
Total 3,394 241 165 4.9%
Jacobabad
Union councils Kot
Jungu
Joungl
e
M.Pu
r
Gari
Chand
Ahmad
Pur
Allah
Abad
Tota
l
SAM cases
identified 9 15 9 11 19 7 70
Sam in program 6 7 5 7 7 5 37
SAM not in program 3 7 4 4 3 2 23

Page 33 of 50
Recovering caese 5 9 6 11 7 9 47
Kashmore
Union councils Dari Akhero Dolat Pur Kashmore 1 Gublo Total
SAM cases identified 25 16 13 18 23 95
SAM in program 11 7 6 8 7 39
SAM not in program 5 6 8 7 5 31
Recovering cases 5 8 3 4 9 29
The point coverage estimator was used because of reasonably effective case-finding resulting in
timely identification and referrals, and acceptable lengths of stay, hence coverage was calculated as:
Number of severe cases in feeding program X 100
Total number of severe cases
The point coverage for Jacobabad is estimated to be 56.8% (45.0 – 68.6%).
The point coverage for Kashmore is estimated to be 41.8% (31.6% - 51.9%).
The period coverage calculated as the below formula to compare with the point coverage. The
period coverage for Jacobabad was 73.6% (65.8% - 81.8%) and Kashmore 55.3% (46.3% - 64.3%).
Number of severe cases + recovering cases in feeding program X 100
Total number of severe cases + recovering cases in feeding program

Page 34 of 50
4. RECOMMENDATIONS
More Resources for Outreach
One most important factor which became clear during the investigation among others was that a
single team of male and female community outreach workers could not cover the entire union
council, and therefore it is critical to actively involve
• Lady health workers whereever they are functional
• Develop a network of volunteers in all villages who may function not only in screening and
active case finding but also to cover defaulters and act as resource persons for their
community
• Community Midwives
• Local medical practitioners and healers including religious healers
Organized Micro Plans for Outreach
Micro-plans for every UC must be created with extra efforts and support must be taken from EDOH
and district authorities to get proper maps and complete list of all villages and settlements within
each UC. The Polio micro-plan may help prepare such detailed plans for nutrition workers as well.
These micro-plans should be enabling the outreach team to cover the entire UC within two to three
months at the most. Listing of all villages or settlements already covered must be prepared together
with their volunteers and their contact numbers.
Involvement of DoH and PPHI
All medical staff of DoH and PPHI must be trained on CMAM and all possible efforts must be taken to
establish CMAM sites within health facilities. However care must be taken while developing CMAM
site which is too far away from most community, in which case mobile clinics must be established
within the community as well.
Emphasis on IYCF and Nutrition Counseling for Mothers
More emphasis must be given to properly train all community workers on IYCF and nutrition
counseling for mothers and in general all household. Breast feeding corners are acting as first
contact for the mothers, but the messages must be continuously delivered at their home as well
through outreach workers and community volunteers. The outreach workers while screening do not
get enough time for community sessions or counseling on IYCF, it is therefore pertinent that
volunteers must be identified and their capacity to be raised to an extent that they may work as
nutrition resource for their community

Page 35 of 50
ANNEXES
Annex– 1.1 Concept Map of Umerkhot District

Page 36 of 50
Annex – 1.2 Concept Map of Thatta District

Page 37 of 50
Annex – 2 Tools used for the investigation
2.1. CMAM Coverage survey Tally Sheet

Page 38 of 50
2.2 Community Questionnaire

Page 39 of 50
2.3 Health Facility Staff Interview

Page 40 of 50
2.5. Mother / Caregiver Interview

Page 41 of 50
2.6. Survey SAM Children not in programme

Page 42 of 50
2.7. Coverage Survey Compilation

Page 43 of 50
2.8. Coverage Survey Village info

Page 44 of 50
2.9. Admission Tally-sheet

Page 45 of 50
2.10. Length of Stay Tally Sheet

Page 46 of 50
2.11. Tally Plot of Defaulters

Page 47 of 50
2.12. OTP Area tally Sheet

Page 48 of 50
2.13.OTP Time to Travel