SINCLAIR BROADCAST GROUP
21
SINCLAIR BROADCAST GROUP
Transcript of SINCLAIR BROADCAST GROUP

SINCLAIR BROADCAST
GROUP

Safe Harbor
The following information contains, or may be deemed to contain, "forward-looking statements" (as
defined in the U.S. Private Securities Litigation Reform Act of 1995). Any statements about our
expectations, beliefs, plans, objectives, assumptions or future events or performance are not historical
facts and may be forward-looking. We base these forward-looking statements on our expectations,
assumptions, estimates and projections about our business and the industry in which we operate as of
the date of this presentation. By their nature, forward-looking statements involve risks and uncertainties
because they relate to events and depend on circumstances that may or may not occur in the future
and cannot be predicted, quantified or controlled, and as such these statements could cause actual
results to differ materially from those set forth in, contemplated by or underlying any forward-looking
statements. Statements made in these presentation materials and during this presentation and factors
set forth under the title “Risk Factors” in our SEC filings, describe factors, among others, that could
contribute to or cause any material difference in outcome from those set forth in, contemplated by or
underlying any forward-looking statements. However, additional factors and risks not currently known to
us or that we deem immaterial may also materially and adversely affect our financial condition and
results of operation, and you should review the factors and risks we describe in reports we file with the
Securities and Exchange Commission or that are provided to you by us from time to time.
You are cautioned not to place any undue reliance on any forward-looking statements, which speak
only as of the date made. All subsequent forward-looking statements are expressly qualified in their
entirety by the cautionary statements contained or referred to herein. We undertake no obligation to
update these statements or publicly release revisions to these statements to reflect subsequent events,
except as required by law.

Sinclair Broadcast Group – Who We Are
Ticker: SBGI
Market Cap: $2.7B
Enterprise Value: $6.3B
Largest broadcaster & leading
consolidator
Asset base with geographic and
content diversity
79 markets reaching 38% of U.S.
377 channels
Affiliated with all major networks
Largest producer of local news
with growing sports content
Multi-platform distributor
Over-the-air
Digital
Cable channel
Radio
Syndicated 33%
Network 28%
Local News 26%
Local Sports 8%
Paid/DR 5%
Content Revenue
Mix

Owned and Operated Television Stations
U.S. TV Households Reached
Source: Company filings and presentations for public companies and websites for private companies
Pro forma for pending acquisitions, net of dispositions
44%
38% 38% 37%
30% 27%
23% 23%
18% 18% 16%
13% 10%
7%
Tribune SBGI CBS FOX Gannett NBC ABC MEG/Lin Hearst Scripps/Jrn Nextstar Raycom Meredith Gray
162
108
75 75
53 46 42
30 29 28 27 34
16 8
SBGI Nexstar Gray MEG/LIN Raycom Gannett Tribune CBS Hearst FOX NBC Scripps/Jrn Meredith ABC
We are the only broadcaster with scale & reach
We have multiple revenue streams driving cash
flow & a more stabilized business model
Revenue Stream Long Term Growth Potential Volatility of Cash
Flow
TV Advertising GDP + Political every 2 years Medium
Retransmission Fees 400%+ Low
Digital (web, social, apps) 9%1 Medium
Multi-channels/Content Low
Next Generation
Broadcast Platform
Very high once new platform
adopted
Unknown
(1) Per SNL

We offer compelling content …
Network Content
Sinclair Local News Content –
2,000 hours per week
Sinclair Sports Content –
College, High School, Wrestling
Syndicated Content

…attracting mass audiences bigger than any
cable news
52,200
2,600 1,700 500 400
WTTE(FOX)
FXNC MNBC CNN CNBC
18,200
1,400 1,000 500 300
WWMT(CBS)
FXNC CNN MNBC CNBC
Grand Rapids, MI
Evening News 5p-7p
May ‘14, A25-54
17,500
2,400 1,400
400 0
KUTV(CBS)
FXNC CNN MNBC CNBC
Columbus, OH
Late News 10p-11p
May ‘14, A25-54
Salt Lake City, UT
Morning News 5a-7a
May ‘14, A25-54
Source: Nielsen

… with a competitive sports offering rivaling
network audiences
35,400
23,900 22,100
15,800
UCLA/UVA - ESPN Clemson/Georgia -ESPN
Hampton/OldDominion - Mynet
Wisconsin/LSU -ESPN
Our ASN game in
Norfolk, VA on 8/30/14
on MyNet:
Ranked #3 out of 19
college games that
weekend in the market.
Ranked #1 in its time
slot.
Source: Nielsen
5.1
4.5 4.1
3.5
2.8
WJTC (IND) CBS ABC NBC FOX
Our high school game
in Mobile, AL on 9/19/14
on an independent:
Had a larger audience
than all 4 of the major
networks in prime time.
Viewing households
Household ratings

(1) SNL Kagan 2014E
(2) Nielsen
Broadcasters rate is avg of top 25 markets
Our content fees lag reality
$6.04
$1.40 $0.99 $0.76 $0.92 $0.62 $0.58
ESPN TNT FOX News ESPN2 USA CNN Broadcasters'Avg
Monthly rate paid by MVPD per homes passed1
$19.28
$9.24
$6.59 $5.36
$3.60 $3.48 $3.41 $2.67 $0.57
ESPN ESPN2 TNT CNN TBS USA FXNC Discovery Broadcast
Monthly rate paid by MVPD per viewing household1,2

$31.8 $34.9
$38.4 $41.8
$45.2 $48.4
$3.6
$4.9
$5.9
$6.7
$7.5
$8.2
2013E 2014E 2015E 2016E 2017E 2018E
Cable Nets Broadcast$56.6
Broadcasters should be receiving at least $14B on 36%
audience delivery versus $5B today
1SNL Kagan
$35.5
$39.8
$44.3
$48.5
$52.7
Our net retrans will grow as we close the
compensation gap

We offer a digital platform that rivals the most
popular websites
175.0
150.0
110.0 95.0
70.0 65.0 63.0 53.0 47.0 42.0 40.0 36.0 35.0 35.0 34.0 32.0
Most Popular News Websites Unique Monthly Visitors (mils)
110.0
35.0 25.0 21.0 16.0 15.0 14.0 13.0 12.5 10.0 9.8 9.5 9.0 6.5 6.0 5.5
Most Popular Political Websites Unique Monthly Visitors (mils)
Source: eBiz

We offer multiple distribution platforms for benefit of
advertisers, content creators and MVPDs
Over the air:
• One-to-many
platform with mass
audiences
• 162 primary
channels for
traditional networks
• 215 multicast
channels for new
content
creators/aggregators
• Future spectrum
opportunities from
next generation
technology
Digital:
• Offer websites,
social media,
mobile apps,
digital agency
• Digital frequency
paired with TV
reach is optimal
marketing
combination
• Increase share
of total
advertising pie
Cable channel:
• Local
NewsChannel8
ratings meet or
exceed cable
news networks
• Ability to drive
retransmission
revenue
• Launch across
our 38%
coverage and
even
nationwide

1SNL Kagan 2012-2016
The market over-estimates industry risk and
under-estimates our competitive advantage
Audience & advertising
eroding
TV advertising share to grow
from 35% to 37%1
Broadcast digital revenue to
grow 9%
Sports and local news
audiences growing
Broadcast network ratings
performing better than cable
Younger demographic
accessing local news through
broadcast digital platform
TV is the dominant branding
medium
Network/Affiliate
relations worsening
Reverse retrans and sports
contribution fees have
increased network
dependency on affiliates
Affiliates’ local news lead-
in/lead-out programming
drives network ratings
Affiliates allow networks to
reach 100% of the country
Affiliates brand network
content
High leverage
More stable business model
due to increasing subscription-
based revenues
Significant free cash flow
generation for debt repayment,
if needed
Substantial covenant capacity
(2x net leverage vs 4x
covenant)
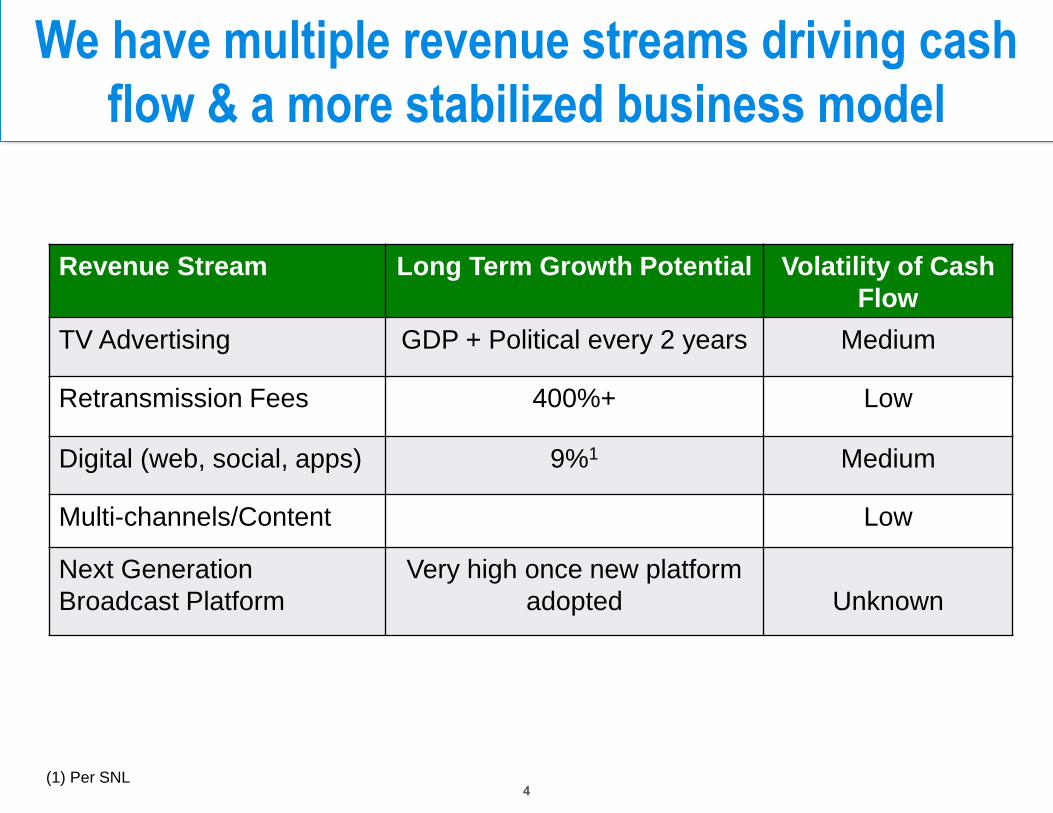
The industry is building the next generation
broadcast wireless network
Capabilities:
Distribute data and multiple programming streams to mass audiences in an OTT
Each station will be able to transmit 211 gigabytes per day per person of mobile capacity
Broadcast in Ultra High Definition (4K and 8K) Television
Benefits:
Unlimited, congestion free capacity
No consumer data plans
Not broadcaster capital intensive
Reach out-of-home viewers
Greater in-home signal penetration
Examples of Business Models:
Advertising
Subscription
Leasing of bit throughput

We are seeking equal regulatory treatment
• Why can cable, satellite, the phone companies, networks and the web
reach 100% of the country; but broadcast is limited to 39%?
• Why can the largest cable system own TV stations in the largest
markets, 2 broadcast networks, cable channels and production studios;
but broadcasters can’t own 2 TV stations in some local markets?
• Why can cable systems sell all the cable and satellite local inventory in a
market through the interconnect and JSAs; but broadcasters can’t have
JSAs?
• Why are there no limitations on the type of content that cable, satellite
and the phone companies can transmit over the UHF airwaves; but
broadcast content is regulated using the same spectrum?
• Why can cable companies combine in negotiation collectives such as
NCTC to jointly negotiate programming fees; but broadcasters can’t
jointly negotiate retransmission rights?

Free Cash Flow per SBG’s definition
We are on track to generate record-breaking
pro forma performance in 2014

Sinclair well-
positioned for
2016:
Nation’s
capital
21 state
capitals
10 swing
states
($ in Millions)
$31 $41
$42 $97 $130 $31 $41
$161
$258
$146
2006 2008 2010 2012 2014 2016
?
As reported and pro forma totals
We expect significant political advertising in
2016

1 2 Excludes capital lease obligations, amortization of debt, VIE and non-recourse debt
Note: Term Loan balance does not account for Delayed Draw Term Loan
Maturity Schedule
224
950
378
485
709 607
1,328
500 550
2014 2015 2016 2017 2018 2019 2020 2021 2022 2023 2024
Revolver
Senior Unsecured Notes
Term Loans
Our balance sheet is solid providing us capacity
to grow
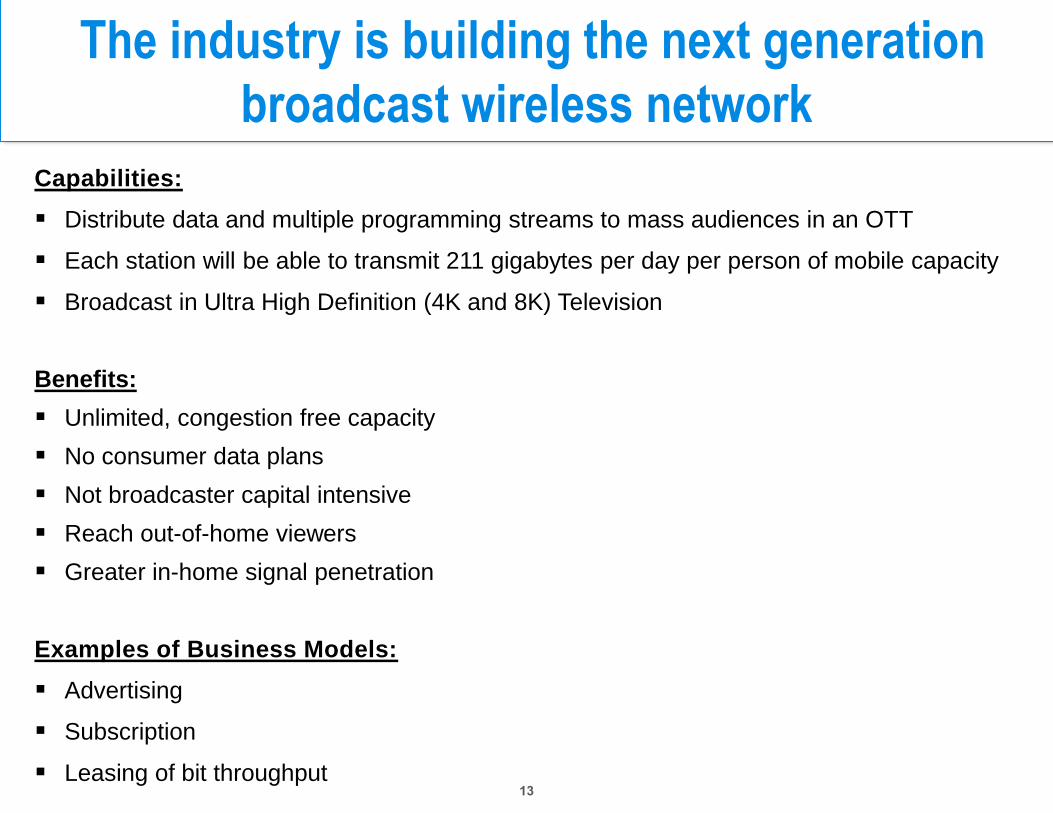
55% EBITDA conversion ratio
13% FCF yield
~50% 2014E payout ratio in 2014
$4.25 FCF per share PF 2014
Uses of FCF
Content, digital, cable nets
Station optimization
Dividends
Share repurchases
Debt repayment
$213
$263
$367 $363
$408
2012 2013 2013PF 2014E 2014PF
Free Cash Flow
($ in Millions)
We generate significant cash flow

Based on comparable industry multiples, our
stock is undervalued
1 Avg 2014/2015 based on Wall Street estimates
27.7
17.5
14.8 13.5
6.6
-
5.0
10.0
15.0
20.0
25.0
30.0
Studios Diversifieds Cable Nets OTT Sinclair
2014/2015 FCF Industry Avg. Multiples

Sinclair Broadcast Group – Why Us