Since accurate characterigstion of secondary-side heat ...
21
_ ' CATHENA* BOILER TOP-BLOWDOVN SIMULATIONS _ by B.N. Hanna, G.R. McGee, and T.E. Macdonald Thermalhydraulics Branch Whiteshell Nuclear Research Establishment Atomic Energy of Canada Limited Pinawa, Manitoba ROE ILO ABSTRACT Since accurate characterigstion of secondary-side heat transfer is an important part of the analysis of certain postulated reactor upset conditions, two boiler blowdown experiments were used to verify the two-fluid code CATRENA. The boiler top-blowdown experiments were conducted at the Whiteshell Nuclear Research Establishment as part of the CANDEV program. Calculations for a fine nodalisation and a coarse nodalization are - presented for each of the two experiments. The coarse nodalization is representative of that wnich would be applied if an entire loop were to be simulated. The CATHENA predictions- demonstrate that, even for a course t- nodalization, the general boiler trends are well predicted. However, for improved securacy, a fine nodalization is required. , * Canadian AlgoritNn for THEtmalhydraulic Network Analysis (f ormerly ATHENA) phgO ji 920302 p 679A PDR L
Transcript of Since accurate characterigstion of secondary-side heat ...

_
'
CATHENA* BOILER TOP-BLOWDOVN SIMULATIONS_
by
B.N. Hanna, G.R. McGee, and T.E. Macdonald
Thermalhydraulics BranchWhiteshell Nuclear Research Establishment
Atomic Energy of Canada LimitedPinawa, Manitoba ROE ILO
ABSTRACT
Since accurate characterigstion of secondary-side heat transfer isan important part of the analysis of certain postulated reactor upsetconditions, two boiler blowdown experiments were used to verify thetwo-fluid code CATRENA. The boiler top-blowdown experiments were conductedat the Whiteshell Nuclear Research Establishment as part of the CANDEVprogram. Calculations for a fine nodalisation and a coarse nodalization are-
presented for each of the two experiments. The coarse nodalization isrepresentative of that wnich would be applied if an entire loop were to besimulated. The CATHENA predictions- demonstrate that, even for a course
t-
nodalization, the general boiler trends are well predicted. However, forimproved securacy, a fine nodalization is required.
,
* Canadian AlgoritNn for THEtmalhydraulic Network Analysis (f ormerly ATHENA)
phgO ji 920302p679A PDR
L

, , ,r n ., . y p .+ c . w s. - - . . - + - - .n.. ~-~ ~ - - . a a . . . . . -~~ >-s. - . usa.x-a~.-- .s 1...- e,
/ <,
*
y. . .>
~ 'f- k
fd t ' ,>!. pc..
< .,_ ,
.,; [ [ 1 g |,. . ,
m
i
,1e:
'bh- '"
),
,
.I
+3 .
S
k
&.h
, b.1
,
$4'
!
}.
-, :
A ;}
*r
$,
d
' $.
4 (*i
b
b
iP
f,|
.'
e
.'>.
:pa
- b
i
u
^ I
f'
!! I
h
&'
. i- -,
si
5
t
S. !, .
-b
):.
>
4 1 *
I
e!I
T h
I
9% 9
I h
"..i
. :
),'~ ..
3
l' a
6
>.
g . ''
.
-_y'+''
..-$
)-
(k.
*. ;; :';.*
I- ~ , ' Ss..
I i. -[
,
)
! - -Y
')mj'
>:|-l'
il*.
i
l rI-
1.
[ =-t,
.
!i.
(i '
1 'j '.r 7 .; ,:,,-e.'|i
#
, o- . . . . . . . . ~ . - _ ,. _ , , . . . . . _ _ , , _ , _._. _._ ,, , , . _ , _ . . . . . . , _ , , _ _ _ ..., , _ , . . _ . , _ . , _ .. . , _ , . _ , , . . , ,

_ _ _ - _ _ _ _ _ _ _ .
'
.
l. INTRODUCTION
Accurate characterization of accondary-Jide heat transfer isrequired for the analysis of postulated reactor upset conditions. Some
multi-dimensional thermalhydraulic modelling of steam generators has beenconducted, for example the THlRST code described by inch et al. [1] and themodelling of 51nghal and Spalding [2]. However, such multi-dimensionalcodels are prohibitively expensive to implement as part of a reactor transt-ent analysis code. Another approach is the drif t-flux method described byCrolmes et al. [3), where a single region or multiple regions are treatadsemi-analytically through level swell calculations. Although simple andcomputationally efficient, this approach would be dif ficult to integrateinto a transient analysis code because it is decoupled f rom the primary-sidedynamics.
The purpose of this paper is to describe the status of the CATiiENAtwo-fluid thermsihydraulics code with respect to the prediction heatt ransf er and fluid dynamics in a steam generator.
The boiler top-blowdown tests were conducted at the Whiteshellt!uclear Research Establishment (VNRE) under the CANDEV program to provideexperimental data on boilers and their instrumentation under severetransient conditions. The tests also provide an experimental data base toassess and verify thermalhydraulic modelling methods.
This paper describes briefly the boiler top-blowdown facility andexperiments, outlines the main features of the CATHENA code, shows the fineand coarse nodalitations of the boiler f or the CATHENA simulations, discuss-es in detail the simulations, and assesses the accuracy of the simulationsidentifying some areas where further modelling capability is required.
2. BOILER TOP-BLOWDOWN EXPERIMENTS
The boiler top-blowdown tests were conducted with a modif ied RD-12boiler. The vertical U-tube (42 tube) boiler is shown in Figure 1. The
modifications included a taller boiler riser section with a 4-wing, centri-fugal, primary seperator and a perforated plate secondary separator, (the
distance aboveoriginal RD-12 boiler used a single perforated plate a shortthe top of the tube bundle as the boiler's only separator). Also, plates atthe edge of the boiler's central baf fle box, below the preheater section,were installed to ensure no crossflow between the boiler and preheatsections below the top of the preheat baffles. These modifications weremade to decrease liquid carry-over at high boiler powers and allow operation
-
higher boiler downcomer levels. The modifications also make the boileratmore representative of a typical reactor boiler.
The modif f ed boiler was installed in the RD-14 loop and used theRD-14 loop piping with a single heated channel as the primary-side heattransport circuit (see Figure 2). The blowdown line for the boiler was
|
- __ _ _ -_ ____ -_- _ _ _ _ -

--. -
4
'
-2-
conn?cted to RD-14 header 3, which except for the discPstge connection wasA series of 22 top-blowdown experiments were conducted withblanked off.break sites ranging f rom 0.11 to 5.01 (% of vessel area) and powers f rom 0.3
HW to 10 MW and downcomer water levels f rom 721 to 931.
Instrumentation in the boiler measured pressures in the steam drumand downcomer, levels in the downcomer, temperatures in the secondary side,and temperatures in the primary-side tubes. Boiler power was determinedf rem fluid temperature measurements in the boiler inlet and outlet plenums ,
and a flow measurement in the primary loop. For the smaller break tests(21 of boiler steam drum area), a spool piece containing a turbine meter anda Venturi was installed to measure the discharge rate. The spool piece wasremoved for the larger break cases since it was felt that choked flow would
the minimum area in the Venturi, thus limiting the discharge rate.result at
The experimental procedure consisted of establishing a steady-state boiler condition at relatively low channel input power (0.3 HW), tobring the boiler's metal mass to equilibrium. The top-blowdown was theninitiated by
(1) closing the steam valve to the jet condenser,(2) closing the boiler feed water valve, and(3) opening the f ast acting blowdown valve at header 3.
For the higher power tests, a low power warm-up period was f ollowed by apower ramp to higher power somewhat (~ 20 min) bef ore initiation of theblowdovn.
Two boiler blowdown experiments, a small and a large break wereselected for simulation with CATHENA. The discharge line spool piece wasinstalled for the small break test but not for larger break case. .
3. CATHENA SINULATIONS
3.1 TWO-FLUID TRERMA1. HYDRAULIC CODE CATHENAs A BRIEF OVERVIEW
The two-fluid, thermalhydraulic code CATHENA ws; developed at WNREf or the analysis of CANDU" reactors under postulated reactor upset condit-ions. The thermalhydraulics model used is a nonequilibrium, two-fluidmodel in which conservation equations for mass, momentum, and energy aresolved for each phase, liquid and vapour, individually. The liquid andvapour phase conservation equations are coupled through constitutiverelations that specify mass, momentum and energy transport as functions offlow regime. In addition, of momentum and energy transport to a pipe
constitu-surf ace f or each phase are specified through flow-regine-dependenttiv? relations for wall shear and heat transfer, respectively. Finally, thesystem of partial-dif f erential conservation equations are linearized into amatrix of finite-dif f erence equations from which the time evolution of thethermalhydraulac system is determined.

r _ _
-3-
Some of the main features of the CATHCNA code's models and numeri-cai nethod are as followat
(1) The staggered-mesh, semi-implicit, finite-difference solutionmethod used is not transit (or material Courant) time-step limited.For slow transients, large time steps may be taken improvingcomputational efficiency.
The wall energy transfers are determined through a cc wplex and(2) flexible wall heat transfer package. One feature of this model isthe ability to calcuste the heat transfer in fuel channels understratified flow conditions, where upper fuel pins are exposed oniy
The heatto steam while lower fuel pins are immersed in water.transfer package can model radial and circumferential conduction aswell as radiation heat transfer. ,
The CATHENA code also includes component models required f or com-(3)plete loop simulations such as
(a) pump models,(b) valve models,(c) a nonequi? tbrium pressurizer model,(d) break discharge models,(e) . separator model,and(f) a simplified control sy6 tem.
al.A more complete description of the CATHERA code is giv1n by Richards et[4].
Modelling of boiler secondary-side heat transfer processes isrequired in CATHENA to provide complete loop simulation capability. The
separator component model and profile distribution coefficients are requiredin the two-fluid model for boiler simulation.
The separator model used in CATHENA asaumes a complete phaseseparation of the two-phase mixture leaving the riser. The vapour phaseTheflows ts the steam drum while the liquid phase enters the downcomer.separator ef ficiency is assumed to be 100%. However, an improved separatormodel, which includes the ef ficiency, is under development.
The profile distribution coef ficients included in the CATHENAtwo-fluid model allow certain multi-dimensional ef f ects to be accounted forwithin the one-dimensional therus1 hydraulics model. The distribution coef-ficients, incorporated in the two-fluid model, allow a more accurate repre-sentation of the cross-section, average relative motion of vapour and liquidand, therefore, a more accurate prediction of phenomena such as level swellin large' vessels like boilers. The coefficients are analogous to the C u
distribution coefficient of Zuber and Findlay [5). The profile distr;butioncoef ficients used in the boiler top-blevdown test simulations shown here are
to the assumption of a Co of 12 in a drif t-fluxapproximately equivalentThe details of the foruulstion and application of profile distri-approach. in the CATHENA two-fluid model are given by Hanna (6].bution coefficients
s
^ - - - - - - _ _ _ ~ _ _ _ _ _ _ _ _ _ _ _ _ _ , , _ , _ _ _ _ _.

. - .~ , -.. - - , _ . - - - -_ - . . --- . _ _ .
-6- ,
3.2 BOILER NODALIZATION
Two boiler nodalizations were used for the boiler top-blowdownsimulations (see Figures 3(a) and 3(b)). The nodalization diagram for theboiler blowdown line used in the small break case, which u6ed the dischargeflow measuring spool piece is shown in Figure 4(a). The nodalizationdiagram for the boiler blowdown line .for the large break case which did notuse the spool piece, is shown in Figure 4(b). In all of the CATHENA simula-tions, the primary circuit of RD-14 was assumed to provide constant boundaryconditions at the boiler plenuma since the boiler blowdown transient isshorter than the primary circuit transit time.
In this fine-grid nodalization, shown in Figure 3(a), great carewas taken to describe in detail the internal structure of the boiler,
>
including the distribution of metal mass. The level of detail re*vits in alarge number of thermalhydraulic nodes (43 nades and 46 links) ar all
models (44) used for these simulations.
The coarse-grid nodalization, si.own in Figure 3(b), is morerepresentative of that which would be used if a combined loop simulation,both primary side and secondary side, were to be performed. The approachtaken was to combine nodes from the fine-grid simulation, keeping totalvolumes and lengths constant, and keeping flow areas as representative aspossible. The metal mass is the same for both nodslisations. However, forthe coarse-grid sinalation, the distribution of metal mass (with 17 wallmodels), or thermalhydraulics (with 10 nodes and 13 links), cannot be
Forrepresented with the same level of detail as in the fine grid case.both fine- and coarse-grid simulations-of each blowdown test, the nodaliza-
ition of the boiler blowdown line was the same.
The dif f erence between fine and coarse grid simulation resultsprovides a demonstration of the sensitivity of the CATRENA code, bothnumerical methods and models, to the idealization of a physical facility.
3.3 SIMUI.ATION RESULTs IUG OISC" cst 0N
3.3.1 Steady State Simulation
All of the simulations were conducted by establishing a steadystate with the required downconer water level, feed-water temperatute,primary-side inlet temperature and pressure, and secondary-side pressure atthe steam valve. This was accomplished by manually adjusting the feed-waterflow rate until the desired conditions were obtained. A boiler levelcontrol model is currently _ under development to do this automatically.
3.3.2 Small Break Case
Comparisons of the CATHENA simulations of the small break case,both for the fine- and coarse-grid runs are shown in Figures 5 through 12.In general, the agreement is good. Detailed discussion of' the simulationresults follows.
,

._ - . . _ . . _ . . .._
4
5--
In Firure $ the boiler-shell pressure is compared with the CATHeNAsimulation results, in general, the agreement is good for both fine- andcoarse-grid simulations. However, some differences are noted.
First, the
small pressure rise immediately prior to the opening of the break at 11 s,is attributed to the specifications ofnot apparent in the experiment, In all of the simula-closing times for feed-water and steam-line valves.the feed-water and main steam-line valves were assumed to closetions, there asy have beenbr oi* the break was initiated, while in the experiment The closing
3verlap during which all the valves were partially open.som-times of the valves was not precisely known. Second, in both fine andcoarse simulations, the pressure history is higher than in the experimentuntil approximately 40 s. The dif ference is attributed to the homogeneous
During approximately the first second of thebreak discharge model used.the break flow is single-phase vapour; af ter this period, water istransient
carried into the break line and to the header where the flow stratifiesGiven the relative sites of thebecause of the larger size of the header.break and the header the (ischarge would be expected to remove steam prefer-
The homogeneous discharge mooel used is expected to predict aentially.lower volumectic discharge rate leading to the slower depressurizationobserved.
The primary-side fluid temperatures at the top of the tube bundlefor the CATHENA simulations is compared with the experiment in Figure 6.however, the rate ofThe trends predicted by the simulations are correct;
At thistemperature decrease during blowdown is not well represented.*he primary flow direction is across rather than along the tuies.location,
Cross-flow heat transf er coef ficients are known to be somewhat larger thanfor axial flos because of the higher turbulence levels. In CATHENA, the
transfer coef fitots in cross-flow is not presentlycalculation of heatThe temperature rise shown towards the end of the blowdown isavailable.
higher in the CATHENA simulationc since it was assumed for all the simula-A moretions that the boiler inlet plenum temperature was constant.accurate representation could have been obtained by modelling the primaryside of the circuit.
the boiler exit plenumIn Figure 7 the predicted temperatures atThe general agreement is good, indicatingare compared with experiment.
removal by the boiler is well predicted by CATHENA. Again, thethat heat rise in temperature towards the end of the blowdown ja attributeddifferentto the assumption of a constant temperature at the boiler inlet plenum.,
The volumetric flow, as measured by the turbine flow meter in theblowdown line, is comptred with the coarse and fine-grid simulation results40 a of the blow-in Figure 8. The lower flow rate predicted for the first
the break,down is attributed to the homogeneous discharge model used atThis was also seen inallow preferental venting of steam.which does not The peaks inthe predicted slower depressurization rate shown in Figure 5165 and 190 s are thought to be theflow rate shown in the experiment at
of water draining from the feed-water line and water falling from theresult The peaks areupper regions of the boiler into the botter lower region.in the CATHENA simulations; however, considerable smoothing ispresentevident.
- -_ _..__

-.
6-o .
In Figure 9, predictions for the upper region void fraction arecompared with the y-4:nsitometer measurements. The void fraction shown is aline - average of void f ractions in both the riser section just above the topof the primary-side tubes and the downcomer at the same location. Forcomparison, the same weighted average of the CATRENA predicted void frac-tions for the riser and the downcomer is plotted. The CATHENA simulationsshow the experimentally observed trends however; there are dif f erences inthe values. The differences are attributed to coarseness of the grid in the i
CATHENA simulations. For the coarse grid simulation considerable smearing |
is evident. This indicates that prediction of void fraction requires a |finer nodalization in these areas (even finer than the fine grid nodalira- :
tion case). |
The void f raction predictions for the lower region compared in |
Figure 10 with the experiment show a similar behaviour. The trends are I
represented well; however, a finer nodalization appears to be required topredict accurately the void f raction at a specific location.
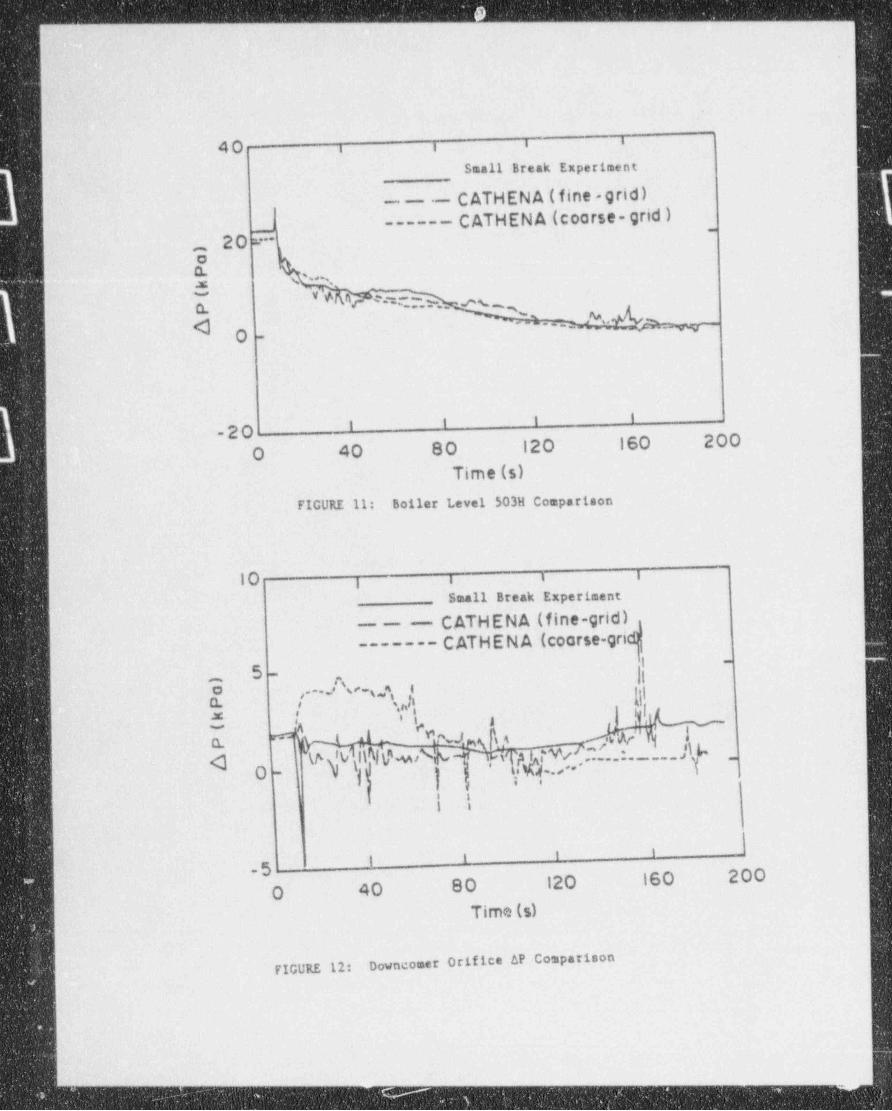
In Figure 11, predictions of the water level are compared with theexperiment. The good agreement shown for both fine- and coarse-grid simula-tions indicates that the prediction of the total quantity of water remaining |
!in the boiler during the transient is accurately represented.
The dif ference oetween fine- and coarse grid simulations is drama-tically demonstrated in the prediction of the downcomer orifice pressuredrop shown in Figure 12. The coarse-grid nodalization is unable toaccurately represent this value because the simulation's pressure locationsare a substantial distance f rom the downcomer orifice location.
3.3.3 Large Break Case
The results of the CATHENA fine and coarse grid simulations are
shown in Figurem 13 through 18. The agreement is good. Discussion of thedetails of the simulation results follow.
In Figure 13 the experimental boiler-shell pressure is comparedwith both fine and coarse-grid CATHENA predictions. The agreement for bothsimulations is excellent. In this experiment the break orifice is muchlarger and, therefore, the assumption of homogeneous flow at the dischargeis more accurate.
- The primary-side fluid temperature for the Ct.TH NA simulations arecompared with the experiment in Figure 14. As in the previous simulation,the predicted temperature .loes not decrease as much as observed in theexperiment. This is again attributed to the heat transfer relations used inthe CATRENA simulations, which do not account for cross-flow.
The boiler exit plenum temperature is compared with the CATRENAsimulation results in Figure 15. The temperature trendo are reasonably wellrepresented in the CATHENA simulations. However, the temperature decreasein the simulations is not as large. As well, the steady-state exit plenumtemperature is not well predicted. It is thought that the coiler, and inparticular the tube sheet and exit plenums, which have a large metal mass
|

( _ _
-7- ;,
,
associated with them, had not reached thermal equilibrium bef ore the blow-This- was indicated by the temperature neardown transient was initiated.the- base of the downconer, which was approximately 10'C subcooled indicating
-
a larger than expected heat loss to the boiler shell. The temperature risetowards the.end of the blowdown transient is the result of the assumptionused for all of the simulations, that - the boiler inlet plenus - temperature .
-was-constant.
..
The predicted and observed amount of water carry-over during thetop-blowdown are compared through the void f ractions near. the top of the
>
boiler steam line in Figure 16. The agreement is good for both fine- andcoarse grid simulations. In this experiment, the spool piece for break lineflow measurement was not installed so that no direct comparison is possible.However,.the break flow is probably well predicted since the void fractionnear the break line and the rate of depressurization are in good agreement ,
with experiment.
Figure 17 compares the experimental and the predicted void f rac-tions in the boiler's upper regica. The agreement is reasonable. However,the coarse-grid simulation shows considerable smearing and a-larger steady-
The additional smearing and steady-state error are largely the 4
state error.of a coarser nodalization not being able to represent accuratelyresult
enough the gravitational separation caused by the relative motion of the .
phases.
The agreement between experimental and calculateo void f ractionsf or the- boiler's lower region is good, as shown by Figure 18. Again, the
coarse grid simulation shows considerable smearing and steady-state error asa result of not being able to represent accurately ' the interphase motion.By ' comparing Figures 17 and 18, it is demonstrated that CATRENA .for bothfine- and coarse-grid nodalizations, ' predicts the observed trend of voiding:the lower region of the boiler before voiding the upper region. . This isthought to be the result of stene generated in the lower region of theboiler rising through the downconer, preventing water in the enlarged upper-downcomer region from falling into the auch-san 11er annular section of the
'downcomer.>
.
3.4 COMPUTATIONAL TIME
It must be noted that the boiler top-blowdown test represents a .5
severe : transient and, therefore, longer simulation times than would beThe_ CPU timeexpected for a . boiler during a combined loop simulation.
required for the . fine-grid nodalizations was approximately 3. h CDC Cyber 175The CPU time for the coarse-grid cases was approximately C.8 h.equivalent.
The coarse-grid simulations thus represent approximately a four-foldedecrease in simulation time.
4. CONCLUSIONS
1-
:A brief overview has been presented of the boiler top-blowdown
~ experiments conducted at WNRE. The CATHENA one-dimensional, two-fluid,
'l|
1I
_ .- _, _,_. ,. . _ . ~. _ , , _ . . . ._ _.

-8-
thermalhydraulics code, developed at WNRE for the analysis of postulatedCATHENA simulationsCANDU reactor transients, has been briefly described.have been given usir,g both fine and coarse nodalizations for two of the
In general, the experimental trends f or the fine- andtop-blowdown tests. Greater numericalcoarse-grid simulations are well predicted by CATHENA.8mesring is, however, evident for the costse node cases.
The CATHERA results suggest that the assumption of constantprimary-side conditions, especially for the small break sizes, introducesFor more accurateconsiderable error in the later portion of the transient.It has also shown that,
predictions, the primary side should be modelled.to predict accurately details such as the distribution of void, particularlyIn addition, somefor smaller break cases, a fine nodalization is required.
transf er processes should be accounted for in theeffect of cross-flow heat allows fortransfer package, and a break discharge model thatCATRENA heatpref erential steam venting under stratified flow conditions is required f orsmall discharge orifice cases.
5. ACKNOWLEDGEMENTS
The authors would like to thank the CANDEV Working Party f ormaking the experimental data available, and in particular R.E. Pauls ofOntario Hydro f or his comments and suggestions on this paper.
6. REFERENCES
1. W.W. Inch, D.A. Scott and M.B. Carver, " Engineering Research inNuclear Components Part 11: Steam Generator Thermal-Hydraulics:Analytical and Experimental", Atomic Cnergy of Canada LimitedReport AECL-6885, Mar. 1980.
A.K. Singhal and D.B. Spalding, " Mathematical Modelling of2. Multi-Phase Flow and Heat Transfer in Steam Generators",Proceedings of the Multi-Phase Flow and Heat Transf er Symposium-Workshop, Vol.1, Miami, Florida Apr. 16-18, 1979.
M. A. Grolmes, A. Sharon, C.S. Kim and R.E. Pauls , " Analys'is of3. the Instrumentation Response of MARV1 KEN Test f-ll", Presented atInternational Conference on Reactor Thermal Nydraulics, Newport,Kl. Oct. 1965.
AD.J. Richards, B.N. Hanna, N. Hobson and K.H. Ardron, " ATHENA:4 3rdTwo-Fluid Code for CANDU LOCA Analysis", Presented at 15-18,International Conference on Reactor Thermalhydraulics, Oct.Newport, RD, 1985
Findlay, " Average Volumetric Concentration inN. Zuber and J.A.Two-Phase Flow Systems", Trans. ASME, Journal of Heat Transf er,5.
pp. 453-468, 1965.
_ . - _ _ _ _ -

. . - - .
.
. - _9
.
' B.N. Hanna. " Formulation of Profile Distribution Coef ficients for6. One-Dimensional Two-Fluid Models: Application to the CATHENAThermalhydraulie Code", in-preparation.
-
|
*
4

;- .
1
lI
N 1
] f siCau.Not/Lg(4 ~ sch '6 0)
|
[ PEeroaatto *Latt
"' PG1 MARY %EPAR&IOR
|- | II| o - .6"
-
',MA XIMUM (EV((... ,
193's. on SO3s t)-
i
~
.s 41$t R..
. .1, , NORMAL LEWLi (81% on SO3MI.,
, MIN! MUM LEVEL(72 % on S03*41
l'
[ constrxtEn tevrvotated 90'sercorityl,
O .L-- -=bI )
PRES 1VRE TA* (tyet.
mi%v- ,, tube sucLg
, ,
( |[ | RAFFLE BOE'
u - f
3 - 00* ACOMEm
'
DEN 5JTout?te 14vrtrototed 9C"or cienty)
Q, l. ca .- > .
-
|.
a .-p- SArrLE PLATE.
.g..e pcts tid un i4c)-
}- 9_$ BotER ow,
I i*
,ypsEwEATE9 ZCWC4
11 l' h ?'' ''i -J! -FEEDWATEa w g7ti S xa teci, %,,
N, fl ! \
! i h bI h | TusEs<ET-
_C-so
-r"L' T,44v M ET pefMARY CVFLEF
5 MR 56 0) (25 sem igo;
I
!-FIGURE la Boiler Top-Blovdown Vessel

.. . .-- . - - _ _ _ _ _ _
'
NVENTURIj [NO7ZLC / \ ,, n..;.g
STAi7n.Noi:N300gy rf nW
( TW HS Tgig gDISK
SECONDNRYSEPAPATOR'N
L,......... A"""
sy e,ND 3 BREAK /,
FAS*-ACTINGOptr1CE BALL VALyr.
H)
(H) P RIt%RYSEPARATOR
|
(H)
0EMSITOMETER ,, ,, ,WCECASS SYST.
EED TER
~ ,L.. '
b, ,
'F Ou VS
PLMP !
T T ,
rLow @2METER
, i
bV Ho 2Hs 2
FIGURE 2: Boller Top-Blowdown Flow Schematic
_ _ ___ ___- -_______ -___ _ - .__

;
" ,.q To Jct Csndsnest..
To. Jct'Candsacar
Ii
_ To_ Discharge Line .N 111 *c hot ge i t ier .
if
;
I. .
T :iT
Secondary Side- -- ~
Secondary Side -
cp
To Feed-Water Valve-To Feed Water Valve. -
jp.
?- . Primary Side Primary Side '
.T* 71 - 1 Q g-
.
_ . .
f
''_ . . ,
,
'
1/-- 'g ' :- [ -- _ { . }- . / - ~j.
_ . . .
- - . .,
T
I i
h h T. T .IP
{ -|
, -,- e $g y, ,r-
outlet Inlet Outlet 1"letp-
L ~ .
E y p;pgy, . 3(a) : Boiler Nodalization: FIGURE 3(b): Boiler NodalizationFine-Grid Simulations Ga -Gdd . SMah,
--
' .
-
.. . _ _ _ , - - - .- _ _ . . _ . . . . _

. - - - - - , - - - - , - - - - - - - _ ___
.
9
L
Header 3
d 4 i i-
3-
Venturi Location 1
from Boiler
Y
*
FIGURE 4(a): Discharge Line with Spool Piece
Header 3
._
To Atmosphere
From Boiler
~
FIGURE 4(b): Discharge L,ine without Spool Piece
. - - - _ _ _ _ - _ _ - - _ _ _ _ _ _ _ _ __

- - - _ _ ___ __ _ . _ _ _
.
6.0 i , , ,
Small Break Experiment
C ATHEN A ( fine- grid )---
CATHENA( coarse-grid)~"3 - - - - - - -
c. 4.0 --
3 %
\ge-
5 Ag=
* 2.0 -
g-
n. v.As ,_
-
-,%
' '-
0.0 i i I
0 40 80 12 0 160 200Time (s)
FIGURE 5: Pressure History Comparison
300-1 I
Small Break Experiment
C ATHENA (fine-grid)---
-- ---- C ATHEN A (coarse -grid)r d," ~ <-.- _275~ -.
Vt |- s |e 's s
/V |{ -. . ''\..-- .
5 f i--
-
5 250 -s-r. , jg ,
1 % .n " .:~
', ji.'
E i i
' - ~*F- 225 -
-
i i i t200'
O 40 80 120 16 0 200
Time (s)
Top of the Tube Bundle Primary-Side Fluid Temperature ComparisonFIGURE 6:
I
-- - - - - _ - - - _ _ - _ _ - _ _ - _ _ _ _ _ _ ~ ~ ~-- _ _ _

. .. . . ...
. . . . . . _ _ _ _ _ _ _ . _ _ _ _ _ _ _ . _
i300- . ,.
Small Break Experiment
- -- - C ATH EN A ( fine - grid): ^ " "# # ''''9' v ---- -~ ~ ~ ~ ~ ~
U 275 oW/-
lIo~
) *I* ;,
% / |--
o r-
j 250 -
f e .
% ~,'s | 4osCL \ 'E \ ' , ' /
('% , 'G
F 225- \ /-
-
N / /
%% rH U
\ |/'~.
2001 i i i i
O 40 80 12 0 160 200Tim e ( s)
FIGURE 7: Boiler Exit Pier.um Temperature Comparison
0.3 , , , ,
Small Break Experiment_
C -- C ATHENA ( fine- grid)------ C ATH E N A( coa rs e - grid )*
E -
O.2- -
32LL
,
M ,
w I's
, _ __ _ _ _ _ ,.,.,_ g,_ 3 _j: / ', -
O. I - ,
\^ d % r
3 VV
ga/'
y/I ' '
iO.OO 40 80 12 0 16 0 200
Time (s)
the Discharge Line Turbine Meter Comparisont'ICURE 8: Volumetric Flow at
- _ _ _ _ -'- - -- __

. . _ . ._. _ - . - __ , .- . , _.
T -&.
IO ,, , 4 - 7 ii .,,.
,-
g~ x;U; ,e'- ,
..
I il v " 7 ..^. - .
3..0.66_
..A &" --- -
4.
g f .. .. :|. ..
.= ,..
uO. Small Break Experiment
,,
. - g0.33 -- CATHENA (fine-grid) -
-oj J C ATHENA (coarse -grid)* -
- - . - - -.
Ms'.c.;
i I I I0.0__
80' 12 0 18 0 200-O. 40>
Time (s)FIGUP2-9:- Boiler Upper-Region Void Fraction Comparison
.
-
l.O i i i i
;/.. .--- . 4 -lg
/. h 'I.
=,/ jvV5N\ ./../. t.(/
- 0.66- -r-
j}es ..
-|/
,
~--:t
- g'-
,,f_- .,.-.
e- o:
.
N, Sma'll Break Experiment
[ l - --- CATHENA (fine -grid ).
*-
-~
f --------- CATH EN A (coarse- grid ) -
O.0- ' ' ' '^ '
.
O. 4 0_- 80 12 0. 16 0 200
Time ( s)
FIGURE 10 - Boiler Lower-Region Void Fraction Comparison
.~.. -. - . _ . . _ . , . , . . - - . . _ . . . _ _ _ _ . _ .. _. . . _ . - . _ . .
- - - _ - - _ _ - _
1'
f
|--
40 i i i i
Small Break Experiment
-- - C ATHEN A ( fine - grid)------ C ATHEN A (coarse- grid )
-.- -
_ 20 =--00 s ' -- ,,x
?' d'dhO -
I I I '-20
O 40 80 12 0 160 200
Time (s)FIGURE 11: Boiler Level 503H Comparison
10 , , , ,
Small Break Experiment
- - CATHENA (fine-grid)------- C ATHE N A (coarse-gri
i -
5 I-_ ,
[ ,-J %-a,d! lls.
/ ici'
x i ie-
',Qg -- ' 'f -''
O
i !
' ' ' '-5 '
O 40 80 12 0 16 0 200
Time (s)
FIGURE 12: Downtomer Orifice AP Comparison
- - - _ - _ _ - - _ _ _ _ _ _ - _ _ - _ _ - _

. . . _ - ~ . . . . - - . -- , - - - . - - -..
-
,'s. 4,-
_
t,-.,
4
6.0 , , ,. , , ,
_
Large Break Experiment;,
CATHENA (fine'- grid):- - -e '
I CATHEN A (coarse-grid)...---,.--
' O- 1- 4.0 . gy
':
t \ : *
g--!
2 h:* \ :-
_ L -210 g.-
\.
- _s.-
:. _\'%
% 4t g
0. 0 i i i -- T -
;. .
'O' - 10 -20 -30 -40 50 60 70 ,
-Time (s), , - ;
FIGURE'13: Pressure History: Comparison
_330 , , _,. , , ,
.. ,
-4- '305 , ~mm.s. .r. ,. -, --_ .--
_ _
, */'
_ ....----- . ,p3> - 2 8 O -
~~- --
E.-G
' O. Larse= Break ExperimentE:
| 4::!255 - - CATHENA ( fine -grid)- --- -
...----- CATH ENA (coarse- grid)--
,
' ' ' ' '' ''i
? -:230i O 10 - 20- : 3 0. 40 50 60 70 ,
Time (s)"
Top of the Tube Bundle Primary-Side Fluid Temperature Comparison! .pIGURE 14:
..
y ~ 2-v 14 rm er uw w-' # # w- -g 'r y-+-qr- w~ m wm --Ju=>- M a N-s-m--

inm
p:
330' i i , i i _ii
,
I-,
} 305-
,,, g ,,,.. , _ m - ;- . . .
* i I2 | |
$|280 /[ -,
= c .. r q .* jo.E g '
,
4 N / Larse Break Experiment255 --
- -- CATHENA (fine grid)-------- CATHEN A ( coarse-grid )
-
230 ' ' ' ' ' '.
O 10- 20 30 40- 50 60. 70
Time ( s) -
FIGURE 15: Boiler Exit Plenum Temperature comparison ,
,,
1.0 - F~ ' I I
d f_
7; O.66 -
-
2-. U 'Large Break Experimentg,
--- CATHENA (fine- grid)_ g
------- C ATHENA (coarse-grid) .~ i 0 33
_
-.
>- .
t
' ' ' '--
- 0.0O 14 28 42 56 70
.
Time (s)
FIGURE 16: Steam-Line Void Fraction Comparison
a
.h',._ .- , y y-e-"