Simultaneously increasing the hydrophobicity and ...
15
Simultaneously increasing the hydrophobicity and interfacial adhesion of carbon fibres: a simple pathway to install passive functionality into composites. Chantelle L. Arnold, Daniel J. Eyckens, Linden Servinis, Mark D. Nave, Huaying Yin, Ross K. W. Marceau, Jean Pinson, Baris Demir, Tiffany R. Walsh, Luke C. Henderson. XPS spectra of modified Carbon Fibers C1s (eV) Unmodified CF 284.7 88.8% Tailing of the C1s peak Surface 1 285.5 63.5% 287.2 9.2% 289.0 5.1% Surface 2 285.1 56.1% 286.5 16.2% 289.0 4.6% Surface 3 285.0 44.4% 286.7 8.6% 289.9 3.1% 292.0 4.9% 294.3 0.6% Surface 4 285.0 43.8% 286.3 17. 6% 288.9 4.2% 291.8 3.9% 294.2 0.5% Surface 5 284.6 10.3% 285.8 4.5% 286.9 4.0% 289.1 2.2% 291.7 a) 17.2% 293.8 a) 3.4% Assignment CH2 Aromatic CH C-O C(=O)OH CF2 a) CF3 a) a) see references 1,2, 3,4 N1s O1s F1s Unmodified CF 400.1 1.5% 532.6 9.8% Surface 1 400.1 1.3% 402.1 0.3% 405.8 1.4% 532.6 18.7% 685.8 0.5% Surface 2 399.9 2.3% 401.7 1.0% 406.1 2.1% 533.0 17.7% Surface 3 400.2 1.0% 402.4 1.1% 406.0 1.7% 532.6 11.9% 689.3 22.8% Surface 4 400.2 3.0% 402.4 0.75% 406.2 1.2% 532.6 15.2% 689.0 9.4% Surface 5 400.7 1.2% 532.6 2.2% 689.0 55.0% Assignment Contamination +Azo bonds a) N +c) NO2 Contamination, NO2 Perfluoro group Electronic Supplementary Material (ESI) for Journal of Materials Chemistry A. This journal is © The Royal Society of Chemistry 2019
Transcript of Simultaneously increasing the hydrophobicity and ...

Simultaneously increasing the hydrophobicity and interfacial adhesion of carbon fibres: a simple pathway to install passive functionality into composites.
Chantelle L. Arnold, Daniel J. Eyckens, Linden Servinis, Mark D. Nave, Huaying Yin, Ross K. W. Marceau, Jean Pinson, Baris Demir, Tiffany R. Walsh, Luke C. Henderson.
XPS spectra of modified Carbon Fibers
C1s (eV)
Unmodified CF
284.7 88.8%
Tailing of the C1s peak
Surface 1 285.5 63.5%
287.2 9.2%
289.0 5.1%
Surface 2 285.1 56.1%
286.5 16.2%
289.0 4.6%
Surface 3 285.0 44.4%
286.7 8.6%
289.9 3.1%
292.0 4.9%
294.3 0.6%
Surface 4 285.0 43.8%
286.3 17. 6%
288.9 4.2%
291.8 3.9%
294.2 0.5%
Surface 5 284.6 10.3%
285.8 4.5%
286.9 4.0%
289.1 2.2%
291.7a) 17.2%
293.8a) 3.4%
Assignment CH2 Aromatic CH
C-O C(=O)OH CF2a) CF3
a)
a) see references1,2, 3,4
N1s O1s F1s
Unmodified CF
400.1 1.5%
532.6 9.8%
Surface 1 400.1 1.3%
402.1 0.3%
405.8 1.4%
532.6 18.7%
685.8 0.5%
Surface 2 399.9 2.3%
401.7 1.0%
406.1 2.1%
533.0 17.7%
Surface 3 400.2 1.0%
402.4 1.1%
406.0 1.7%
532.6 11.9%
689.3 22.8%
Surface 4 400.2 3.0%
402.4 0.75%
406.2 1.2%
532.6 15.2%
689.0 9.4%
Surface 5 400.7 1.2%
532.6 2.2%
689.0 55.0%
Assignment Contamination +Azo bonds a)
N+c) NO2 Contamination, NO2
Perfluoro group
Electronic Supplementary Material (ESI) for Journal of Materials Chemistry A.This journal is © The Royal Society of Chemistry 2019

+Reduction NO2
b)
a) see ref5, b) reduction of the nitro group under the XPS beam, see ref6, c) some NPF6+ entrapped in the
film.
Figure S1. XPS spectra of A) bare carbon fibers (C1s), B) Surface 1 (N1S), C) Surface 5 (F1s), D) Surface 5
(C1s)
Bare carbon fiber: the thin (1.2 eV FWMH) C1s peak at 284.6 eV is characteristic of the carbon
fiber, tailing of this peak on the high energy side is due to the numerous oxidized groups (C-O,
C=O, C(=O)OH) present on the surface of the fibers (Figure S1 A), these groups are also
responsible for the O1s peak.7 The surface also includes some nitrogen
4: The C1s peak at 285.0 eV corresponds to the aromatic groups attached the surface, a
tentative deconvolution with a peak at 284.6 eV as in the bare carbon fiber indicates that it
should be quite small. If the 284.6 eV is shadowed by the organic film, the thickness of the
later should in the 5-10 nm range. The two peaks at higher energy (286.7, 289.0 eV) can be
0
35000
282287292
Cou
nts
8000
10000
12000
396.00401.00406.00
Cou
nts
0
100000
280285290295
Binding energy (eV)Binding energy (eV)
Binding energy (eV)
0
250000
680685690695
Cou
nts
Binding energy (eV)
Cou
nts
A B
CD

assigned to oxidized species, but also C-N (at 286 eV8) and C-N=N (formation of azo bonds
inside the film5). The presence of the nitro group is attested by the N1s peak at 405.8 eV. The
peak at 402 eV corresponds to some residual NBu4+ cation from the supporting electrolyte
while the anion PF6- is observed as a small F1s peak (Figure S1 B). Despite extensive rinsing
some supporting electrolyte remains entrapped in the film.
5: The reduction of the nitro group is only partial (~ 50%) it is known that some nitro groups
are electrochemically silent and are not reduced by electrochemistry.9 The reduction is
performed in acidic medium that results ins some protonated amines at 401.7 eV.
6: Both the NO2 (406.0 eV) and the perfluoro groups (689.3 eV) are present on the surface.
The CF2 and CF3 groups appear at 292.0, 294.3 eV, the experimental ratio CF2/CF3 = 8.2 is
somewhat higher than the expected value of 5. The two CH2 should appear at 284.4 and 285.6
eV4 , they are included in the aromatic and oxidized carbons at 285.0 and 286.3 eV. The ratio
N1s (400.2 eV)/CF2(291.8eV) = 0.25 indicates that the ratio number of nitrophenyl groups
/number of perfluoro chain is ~1.3.
7: The reduction is more efficient than with 5, 82% of the nitro groups are reduced.
8: The main contribution of the carbon C1s peak is located at 284.6 eV that correspond to the
carbon fiber and the CH2 group bonded to the fiber. One observes a high percentage of F1s
(Figure S1 C) and the CF2 and CF3 contributions to the C1s peak with the expected ratio of 5
(Figure S1 D).
IR spectra Carbon Fibers
Figure S2 IRATR spectrum of bare carbon fibers
0
0.001
1200130014001500160017001800
Wavenumber cm-1
Ab
sorb
an
ce
Oxidized
groups
Aromatic
groups

Bare carbon fibers present three main peaks at 1758, 1694 and 1655 cm-1 that can be assigned
respectively to lactones, carboxylic acids and ketones10,11. Aromatic signals are observed in
the 1600-1500 cm-1 range (Figure S2).
References for XPS and IR Section
1 H. Lu, D. Zeysing, M. Kind, A. Terfort, M. Zharnikov, J. Phys. Chem. C 2013, 117, 18967-
18979.
2 A. Shaporenko, P. Cyganik, M. Buck, A. Ulman, M.Zharnikov, Langmuir 2005, 21, 8204-
8213.
3 F. Laffineur, Z. Mekhalif, L. Tristani, J. Delhalle, J. Mater. Chem. 2005, 15, 5054-5062.
4 D. Hetemi, F. Kanoufi, C. Combellas, J. Pinson, F. I. Podvorica, Langmuir 2014, 30, 13907-
13913
5 P. Doppelt, G. Hallais, J. Pinson, F. Podvorica, S. Verneyre, Chem. Mater. 2007, 19, 4570-4575 6 A. Adenier, E. Cabet-Deliry, A. Chaussé, S. Griveau, F. Mercier, J. Pinson, C. Vautrin-Ul
Chem. Mater. 2005, 17, 491-501.
7 E. Desimoni, G. I. Casella, A. Morone, A. M. Salvi, Surf Interface Anal., 1990, 15, 627-634
8 N. Graf, E. Yegen, T. Gross, A. Lippitz, W. Weigel, S. Krakert, A. Terfort, W. E.S. Unger, Surf.
Sci. 2009, 603, 2849–2860
9 S. S. C. Yu, E. S. Q. Tan, R. T. Jane, A. J. Downard, Langmuir 2007, 23, 11074-11082.
10 Socrates, G. Infrared and Raman characteristic group frequencies, 3rd ed.; John Wiley &
Sons, 2008.
11 C. Sellitti, J. L. Koenig, H. Ishida, Carbon, 1990, 28, 221-228.

Separation of water and chloroform using a fibre plug.
Finally, to highlight the potential non-traditional uses of these fibres, perfluoroalkyl functionalized
fibres (Surface 5) were taken, and sought to determine if these could be used as a means to separate
mixtures of water and organic solvent. To do this, a plug of these fibres was placed into a Pasteur
pipette and a mixture of water (blue) and chloroform (green) was poured on top. For the untreated
fibres both phases quickly passed through the fibre plug giving no discrimination between the aqueous
and organic phases. When repeating this with treated fibres (Figure 7b), the chloroform phase quickly
passed through the fibre plug, while the aqueous phase remained on top, with the image presented
below being taken 1 hour after initial filtration.
Similar observations are made when organic solvents such as methanol versus water are dropped onto
the fibre surface (video in ESI). The former is rapidly taken up by the fibres, while the latter is unable
to penetrate the fibre bundle. This is confirmed in the observations made regarding interfacial
adhesion, as the fibres are hydrophobic yet organo-philic, as there is only one carbon distinguishing
water from methanol.

Additional SEM images at 15,000x magnification
The SEM images were taken using a Jeol JSM 7800F FEG-SEM and was prepared by placing the
fibres on double sided carbon tape. The conductivity of the fibres was sufficient for sputtering
not to be required.
Pristine
Surface 1
Surface 2

Surface 3
Surface 4
Surface 5

SEM of Fibre Fractures Highlighting Wet-Out
To complement the videos taken of fibre wet-out SEM of fibres after being sheared from epoxy
were taken to show encapsulation of the resin. Here, the resin is seen surrounding the fibre
clearly still adhering to the surface. In several instances the resin can be seen to fill the
longditudinal striations along the fibre axis showing that these fibres are indeed easily
infiltrated by the epoxy resin.
Modelling Additional Methodology
General Simulation Details: In this work we used the all-atom DREIDING force-field2 to describe the
interactions between bare/grafted fibre substrate and polymer matrix. Periodic boundary conditions
were implemented in all three dimensions. The Nosé-Hoover thermostat 3-4 and barostat 3, 5 were used
to control the temperature and pressure, respectively (unless otherwise stated). The cut-off distance
for long-range interactions was set to 12 Å and the particle-particle-particle-mesh solver was used 6.
Throughout this study we used time-step of 1 fs, using the LAMMPS (lammps.sandia.gov) simulation
software package7.
Our polymer model consisted of EPON-862 (diglycidyl ether of bisphenol F) and DETDA (diethyl
toluenediamine) in a ratio of 2:1. Following our previous works, 8-9 we used the activated form of the
EPON-862, where the epoxide bond was opened and the epoxide carbon atoms were saturated with
hydrogen atoms. This modified EPON-862 molecule herein referred to as EPON. Reactive atomic sites

of these two molecules were cross-linked in the presence of the grafted fibre surface to form a 3D
network. Five different surfaces were modelled. Surfaces 1 and 3 were modelled to be reactive with
respect to chemical cross-link formation with the polymer molecules. Surfaces 2, 4 and 5 were
modelled as unreactive towards the formation of chemical cross-link bonds with the polymer
molecules. A graphite slab, comprising three graphene layers with an initial interlayer spacing of 3.348
Å was used as an approximation of the carbon fibre surface. Each graphene layer contained 7200
carbon atoms, and the lateral dimensions of our graphite slab (and thus our simulation cell) were 127.8
x 147.6 Å. Each carbon atom of the substrate carried a zero partial charge.
Partial Charge Calculations: The DREIDING force-field did not include partial atomic charges, and these
must be calculated for all the atoms present in the system. To accomplish this, we followed our
previously-published computational procedure 8, 10, such that the initial structures of the EPON and
DETDA molecules, and functional groups, were generated using the AVOGADRO software 11 and
subjected to geometry optimisation using the Generalized Amber force field (GAFF) 12. We geometry
optimised these structures until the energy difference between two successive configurations was
smaller than 1 x 10⁻⁸ kJ/mol. Following this, we predicted the partial atomic charges using our
previously-reported procedure 8, 10. The partial atomic charges for the EPON and DETA molecules were
reported in our previous study 10. As for the SGM, Table S1 reports the partial atomic charges for the
unique atomic sites on each functional group, whose labels were provided in Figure S3.
Carbon Fibre Surface Functionalisation: We generated our initial simulation cell for surface grafting of
the substrate by placing the graphite slab in the centre of the simulation cell while filling the remaining
space with the SGMs. A total of 50 molecules were grafted at random locations on the exterior surfaces
of the carbon fibre substrate (50 molecules per surface of the graphite slab, giving a total of 100 grafted
molecules in total). This resulted in a grafting density of 1 grafted molecule for every ~4 nm2 of
available carbon fibre surface.
Preparation of Composite Simulation Cell Prior to Cross-linking: Once we obtained our surface grafted
substrate, we placed this substrate at the bottom of an orthorhombic periodic cell, of which the
remaining space was randomly filled with 1600 EPON and 800 DETDA using the PACKMOL software
package 13. The initial dimensions of our simulation cell were 127.8 x 147.6 x 194 Å for surfaces 1, 2
and 5 and 127.8 x 147.6 x 200 Å for surface 3 and 4, where 192 Å and 200 Å are the dimension of the
cells perpendicular to the substrate surface. Following this, we geometry optimised this low-density
pre-composite sample (containing the liquid precursor mixture and the surface grafted substrate) via
the FIRE algorithm 14 for 50000 steps. Once the optimisation step was finalised, molecular dynamics
(MD) simulations were performed in the isothermal-isobaric ensemble (NpT ensemble), at 300 K and
1 atm, to ensure the liquid precursor mixture was at the appropriate density and was well mixed in the
presence of the surface functionalised substrate. More details regarding this procedure can be found
in our previous studies 8, 10.
Simulated Annealing Procedure: We reported in our previous studies 8, 10 that the presence of the
bare/functionalised fibre surface influenced the spatial distribution of the liquid polymer precursor.
Based on this, prior to forming chemical cross-link bonds between the monomer and the cross-linking
agent (also between the monomer and SGMs on surfaces 2 and 4) to obtain polymerised composite
sample, we ensured that the interfacial liquid structure was equilibrated by applying a simulated
annealing (SA) procedure as reported in our previous work, 8-9. In this procedure we heated the pre-
composite sample to high temperature (1000 K) and then cooled back to the cross-linking temperature
(500 K, as per our previous studies) 8, 10. This SA process utilised MD simulations in the canonical (NVT)
ensemble and the schedule necessitated equilibration at 500 K for 0.2 ns, heating to 1000 K over a
period of 0.2 ns, maintenance of 1000 K for a further 1.0 ns, followed by cooling to 500 K over 0.5 ns.
This entire SA schedule was repeated twice for each surface.
Surface Grafted Molecule Conformational Distribution Analysis: We characterised the
conformational distribution of the surface grafted molecules (SGMs) on the fibre surface in the
presence of the liquid precursor mixture. To achieve this, we calculated the vertical distance (which is
perpendicular to the fibre surface plane) between the distal nitrogen atoms of the nitro and amino
groups on surfaces 1, 2, 3 and 4, and between the distal carbon atoms of the CF3 group on surfaces 2,
4 and 5 and the centre of mass (COM) of the graphene layer to which the functional group was
covalently bonded. This calculation was done for every SGM in each trajectory frame following the
procedure below. We considered frames from the last SA cycle. Our SA cycle ended with a 200 ps NVT-
MD simulation at 500 K. We generated frames from this 200 ps interval, at a rate of 1 frame per ps,
which amounted to 200 frames that were used for our analyses. The probability distribution for each
fibre-SGM distance was histogrammed using these 200 frames with a bin width of 0.2 Å and provided
in Figure S4.
Dynamic in-situ Cross-linking Procedure: Upon the completion of the equilibration of pre-composite
sample, we formed new chemical cross-link bonds via our in-situ cross-linking procedure 8, 10. In this
procedure, the reactive atom pairs were dynamically detected and connected to form the covalent
cross-link bonds. We pre-determined a distance-based cut-off for cross-linking (initially set to 3 Å) and
used this to detect the reactive atomic sites in the EPON and DETDA molecules (as well as the reactive
sites in the EPON and reactive amino groups on surfaces 2 and 4) within this cut-off distance. After the
formation of new chemical bonds, the resultant structure was relaxed via our multi-step relaxation
protocol 8, 10. Once the desired degree of cross-linking (in this case, 78%) was achieved, this crosslinking
procedure was terminated, and the partly-polymerised composite samples were relaxed for 0.5 ns at
300 K via NpT MD simulations at 1 atm pressure. The details for this protocol are provided in our
previous works 8, 10.
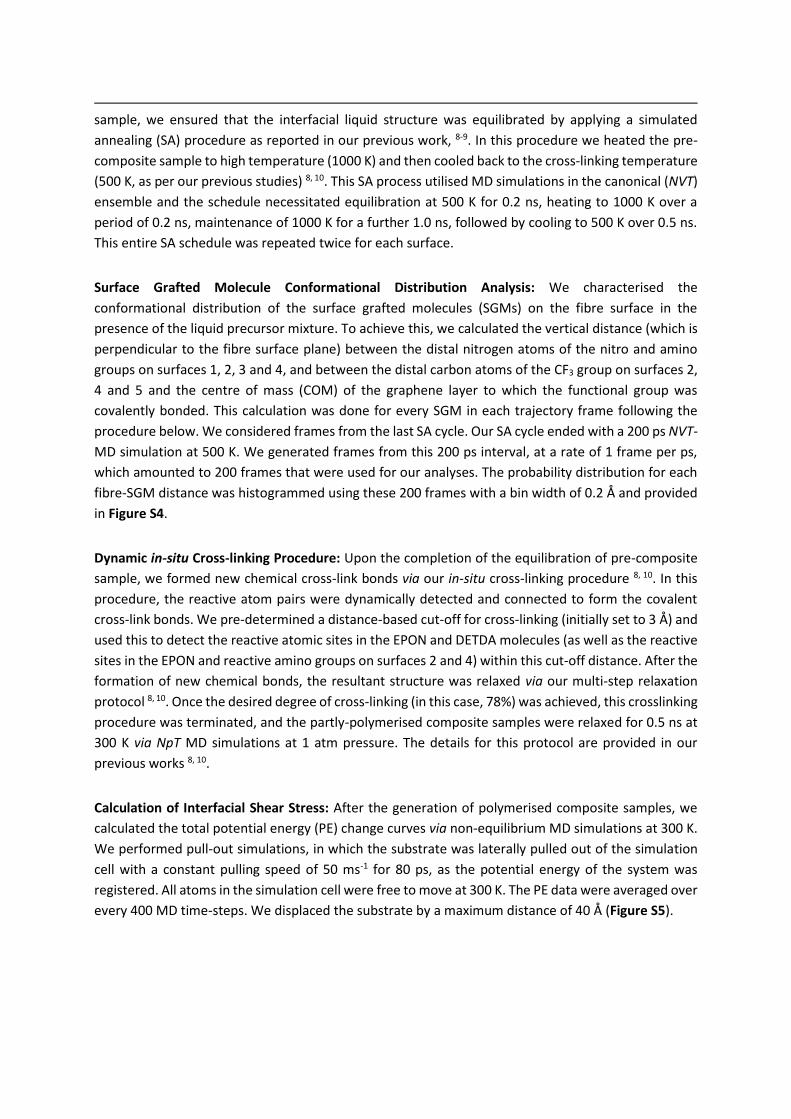
Calculation of Interfacial Shear Stress: After the generation of polymerised composite samples, we
calculated the total potential energy (PE) change curves via non-equilibrium MD simulations at 300 K.
We performed pull-out simulations, in which the substrate was laterally pulled out of the simulation
cell with a constant pulling speed of 50 ms-1 for 80 ps, as the potential energy of the system was
registered. All atoms in the simulation cell were free to move at 300 K. The PE data were averaged over
every 400 MD time-steps. We displaced the substrate by a maximum distance of 40 Å (Figure S5).

Figure S3. Atomic labels for the unique atomic sites on the surfaces (CR’ is the carbon atom that will
be covalently connected to the fibre surface. The partial atomic charge of HR will be added to the
partial atomic charge of CR’ after the molecule is chemically attached to the surface (because one
hydrogen atom (HR) will be deleted)).

Table S1. Partial atomic charges (in esu) for the unique atomic sites of the surface grafted
molecules.


Figure S4. Probability distribution of the vertical site-surface distance between the distal nitrogen (on
surfaces 1, 2, 3, 4, 5) and carbon atoms (on surfaces 3, 4 and 5) of the surface grafted molecules and
the fibre surface, in the presence of liquid precursor mixture.
Figure S5. Total potential energy change curves as a function of substrate displacement for each
surface at 300 K.
References for Modelling Section
(1) Weibull, W. A statistical distribution function of wide applicability. J. Appl. Mech. 1951, 18, 293-
297.
(2) SL Mayo; Olafson, B. D.; Goddard, W. A. DREIDING, a generic force-field for molecular simulations.
J. Phys. Chem. 1990, (94), 8897-8909.
(3) Nosé, S. A unified formulation of the constant temperature molecular dynamics methods. J. Chem.
Phys. 1984, 81 (1), 511-519.
(4) Hoover, W. G. Canonical dynamics: Equilibrium phase-space distributions. Phys. Rev. A 1985, 31 (3),
1695-1697.
(5) Hoover, W. G. Constant-pressure equations of motion. Phys. Rev. A 1986, 34 (3), 2499-2500.
(6) Hockney, R. W.; Eastwood, J. W. Computer simulation using particles, Taylor & Francis, Inc.: 1988;
p 564.

(7) Plimpton, S. Fast Parallel Algorithms for Short-Range Molecular Dynamics. J. Comput. Phys. 1995,
117 (1), 1-19.
(8) Demir, B.; Henderson, L. C.; Walsh, T. R. Design Rules for Enhanced Interfacial Shear Response in
Functionalized Carbon Fiber Epoxy Composites. ACS Appl. Mater. Interfaces 2017, (9), 11846-11857.
(9) Servinis, L.; Beggs, K. M.; Scheffler, C.; Wöfel, E.; Randall, J. D.; Gengenbach, T. R.; Demir, B.; Walsh,
T. R.; Doeven, E. H.; Francis, P. S.; Henderson, L. C. Electrochemical surface modification of carbon
fibres by grafting of amine, carboxylic and lipophilic amide groups. Carbon 2017, 118, 393-403.
(10) Demir, B.; Walsh, T. R. A robust and reproducible procedure for cross-linking thermoset polymers
using molecular simulation. Soft Matter 2016, 12 (8), 2453-2464.
(11) Hanwell, M. D.; Curtis, D. E.; Lonie, D. C.; Vandermeersch, T.; Zurek, E.; Hutchison, G. R. Avogadro:
an advanced semantic chemical editor, visualization, and analysis platform. J. Cheminform. 2012, 4 (1),
17.
(12) Wang, J.; Wolf, R. M.; Caldwell, J. W.; Kollman, P. A.; Case, D. A. Development and testing of a
general amber force field. J. Comput. Chem. 2004, 25 (9).
(13) Martínez, L.; Andrade, R.; Birgin, E. G.; Martínez, J. M. PACKMOL: A package for building initial
configurations for molecular dynamics simulations. J. Computat. Chem. 2009, 30 (13), 2157-2164.
(14) Bitzek, E.; Koskinen, P.; Gähler, F.; Moseler, M.; Gumbsch, P. Structural Relaxation Made Simple.
Phys. Rev. Lett. 2006, 97 (17), 170201.