
Simultaneous quantification of lopinavir and ritonavir in human plasma by high performance liquid...
7
SCIENCE CHINA Life Sciences © The Author(s) 2012. This article is published with open access at Springerlink.com life.scichina.com www.springer.com/scp *Corresponding author (email: [email protected]; [email protected]) • RESEARCH PAPER • April 2012 Vol.55 No.4: 321–327 doi: 10.1007/s11427-012-4303-1 Simultaneous quantification of lopinavir and ritonavir in human plasma by high performance liquid chromatography coupled with UV detection KOU HuiJuan 1 , YE Min 2* , FU Qiang 2 , HAN Yang 1 , DU XiaoLi 2 , XIE Jing 1 , ZHU Zhu 2 & LI TaiSheng 1* 1 Department of Infectious Diseases, Peking Union Medical College Hospital, Chinese Academy of Medical Sciences-Peking Union Medical College, Beijing 100730, China; 2 Department of Pharmacy, Peking Union Medical College Hospital, Chinese Academy of Medical Sciences-Peking Union Medical College, Beijing 100730, China Received January 17, 2012; accepted March 9, 2012 High performance liquid chromatography was coupled with UV detection for simultaneous quantification of lopinavir (LPV) and ritonavir (RTV) in human plasma. This assay was sensitive, accurate and simple, and only used 200 μL of plasma sample. Samples were liquid-liquid extracted, and diazepam was used as an internal standard. The chromatographic separation was achieved on a C18 reversed-phase analytic column with a mobile phase of acetonitrile-sodium dihydrogen phosphate buffer (10 mmol L 1 , pH 4.80) (60:40, v/v). UV detection was conducted at 205 nm and the column oven was set at 40°C. Calibration curves were constructed between 0.5–20 μg mL 1 for LPV and 0.05–5 μg mL 1 for RTV. The relative standard deviations were 2.16%–3.20% for LPV and 2.12%–2.60% for RTV for intra-day analysis, and 2.34%–4.04% for LPV and 0.31%–4.94% for RTV for inter-day analysis. The accuracy was within 100%±10%. The mean extraction recoveries were 79.17%, 52.26% and 91.35% for RTV, LPV and diazepam, respectively. This method was successfully applied to human plasma samples from pa- tients orally administered a salvage regimen of lopinavir-ritonavir tablets. lopinavir, ritonavir, HPLC, UV detection, human plasma Citation: Kou H J, Ye M, Fu Q, et al. Simultaneous quantification of lopinavir and ritonavir in human plasma by high performance liquid chromatography coupled with UV detection. Sci China Life Sci, 2012, 55: 321 – 327, doi: 10.1007/s11427-012-4303-1 Lopinavir (LPV) is a protease inhibitor that has been co-formulated with a low dose of ritonavir (RTV) to im- prove its pharmacokinetic properties, resulting in substan- tially increased plasma exposure that maintains high drug levels throughout a 12-h dosing interval [13]. Lop- inavir-ritonavir (LPV/r) shows sustained suppression of viral replication and durable elevation of CD4 + T cell counts in both antiretroviral therapy-naive and -experienced human immunodeficiency virus (HIV) infected patients [4,5]. To date, LPV/r has been reserved for salvage therapy in coun- tries with limited HIV treatment resources. The relationship between plasma concentrations of pro- tease inhibitors and antiviral efficacy and/or toxicity has been clearly demonstrated [46]. The current guideline from the United states Department of Health and Human Services (updated December 2009) suggests a target trough concentration (C trough ) of LPV in human plasma of 1 μg mL 1 [7]. Gutiérrez et al. [8] demonstrated a significant correlation between LPV C trough and changes in triglyceride and cholesterol levels. Patients with grade 2 or higher cho- lesterol elevation have been found to have a LPV C trough at
Transcript of Simultaneous quantification of lopinavir and ritonavir in human plasma by high performance liquid...

SCIENCE CHINA Life Sciences
© The Author(s) 2012. This article is published with open access at Springerlink.com life.scichina.com www.springer.com/scp
*Corresponding author (email: [email protected]; [email protected])
• RESEARCH PAPER • April 2012 Vol.55 No.4: 321–327
doi: 10.1007/s11427-012-4303-1
Simultaneous quantification of lopinavir and ritonavir in human plasma by high performance liquid chromatography coupled with
UV detection
KOU HuiJuan1, YE Min2*, FU Qiang2, HAN Yang1, DU XiaoLi2, XIE Jing1, ZHU Zhu2 & LI TaiSheng1*
1Department of Infectious Diseases, Peking Union Medical College Hospital, Chinese Academy of Medical Sciences-Peking Union Medical College, Beijing 100730, China;
2Department of Pharmacy, Peking Union Medical College Hospital, Chinese Academy of Medical Sciences-Peking Union Medical College, Beijing 100730, China
Received January 17, 2012; accepted March 9, 2012
High performance liquid chromatography was coupled with UV detection for simultaneous quantification of lopinavir (LPV) and ritonavir (RTV) in human plasma. This assay was sensitive, accurate and simple, and only used 200 µL of plasma sample. Samples were liquid-liquid extracted, and diazepam was used as an internal standard. The chromatographic separation was achieved on a C18 reversed-phase analytic column with a mobile phase of acetonitrile-sodium dihydrogen phosphate buffer (10 mmol L1, pH 4.80) (60:40, v/v). UV detection was conducted at 205 nm and the column oven was set at 40°C. Calibration curves were constructed between 0.5–20 μg mL1 for LPV and 0.05–5 μg mL1 for RTV. The relative standard deviations were 2.16%–3.20% for LPV and 2.12%–2.60% for RTV for intra-day analysis, and 2.34%–4.04% for LPV and 0.31%–4.94% for RTV for inter-day analysis. The accuracy was within 100%±10%. The mean extraction recoveries were 79.17%, 52.26% and 91.35% for RTV, LPV and diazepam, respectively. This method was successfully applied to human plasma samples from pa-tients orally administered a salvage regimen of lopinavir-ritonavir tablets.
lopinavir, ritonavir, HPLC, UV detection, human plasma
Citation: Kou H J, Ye M, Fu Q, et al. Simultaneous quantification of lopinavir and ritonavir in human plasma by high performance liquid chromatography coupled with UV detection. Sci China Life Sci, 2012, 55: 321–327, doi: 10.1007/s11427-012-4303-1
Lopinavir (LPV) is a protease inhibitor that has been co-formulated with a low dose of ritonavir (RTV) to im-prove its pharmacokinetic properties, resulting in substan-tially increased plasma exposure that maintains high drug levels throughout a 12-h dosing interval [13]. Lop-inavir-ritonavir (LPV/r) shows sustained suppression of viral replication and durable elevation of CD4+ T cell counts in both antiretroviral therapy-naive and -experienced human immunodeficiency virus (HIV) infected patients [4,5]. To date, LPV/r has been reserved for salvage therapy in coun-
tries with limited HIV treatment resources. The relationship between plasma concentrations of pro-
tease inhibitors and antiviral efficacy and/or toxicity has been clearly demonstrated [46]. The current guideline from the United states Department of Health and Human Services (updated December 2009) suggests a target trough concentration (Ctrough) of LPV in human plasma of 1 µg mL1 [7]. Gutiérrez et al. [8] demonstrated a significant correlation between LPV Ctrough and changes in triglyceride and cholesterol levels. Patients with grade 2 or higher cho-lesterol elevation have been found to have a LPV Ctrough at

322 Kou H J, et al. Sci China Life Sci April (2012) Vol.55 No.4
week 4 greater than 8 µg mL1. Therapeutic drug monitoring of protease inhibitor is beneficial for identification of suboptimal drug exposure, detection of drug-related toxicity, and prevention of viral resistance [9,10]. Additionally, be-cause LPV/r is metabolized by cytochrome P450 enzymes, monitoring may be useful for evaluation of drug-drug inter-actions, such as those with a potent CYP 3A4 inducer or inhibitor that has been shown to increase or decrease the LPV plasma concentration [11,12]. Finally, the plasma concentrations of LPV and RTV are required for pharmaco-kinetic studies, which may be used to assist in the determi-nation of the most suitable dosing regimen for each patient. Therefore, a simple and sensitive analytical method for quantification of LPV and RTV in human plasma is needed.
Several HPLC methods for simultaneous determination of LPV and RTV have been described [1322]. Most of the methods using UV detection [15,16,18,20,21] have some critical disadvantages, including requirements for gradient elution programs, cumbersome operation procedures, bulk plasma samples, and multiple wavelengths. These require-ments make the methods time-consuming and difficult for high throughput assays. More recently, HPLC methods coupled with mass spectrometry or diode array detection for quantitative determination of LPV and RTV have been re-ported [13,14,22]. However, this technique imposes a high requirement for instruments and materials and increases the analysis cost, which limits its application in re-source-limited settings such as China and other developing countries. This paper describes a novel method for simulta-neous quantification of LPV and RTV in a 200 µL plasma sample. An optimized liquid-liquid extraction (LLE) pro-cedure was combined with isocratic elution HPLC and UV detection. This method is sensitive, simple, rapid and has low requirements for instrumentation and chemical reagents, which means it can be used in many situations.
1 Materials and methods
1.1 Chemicals and reagents
LPV (LOT#DH106-070601b) and RTV (LOT#090702) standards were generously provided by Shanghai Desano Chemical Pharmaceutical Corporation (Shanghai, China). Diazepam (internal standard, IS) was purchased from Sig-ma-Aldrich (St. Louis, MO). Acetonitrile (Honeywell Bur-dick & Jackson, Morristown, NJ), methanol and methyl tert-butyl ether (TEDIA, Fairfield, OH) were of HPLC grade. Sodium dihydrogen phosphate (Sinopharm Chemical Regent Corporation, Beijing, China) was of AR grade. De-ionized water was obtained from a Milli-Q ultra-pure water system (Millipore, Billerica, MA).
1.2 Chromatography
A HPLC system consisting of a LC-20AT pump, a SIL-20A
autosampler, a SPD-20A UV-Vis detector and a CTO-20A column oven (Shimadzu, Kyoto, Japan) was used for this experiment. The autosampler was set at 20°C. The analyti-cal column was a Shimadzu Shim-pack CLC-ODS C18 column (15 cm×6 mm I.D., 5 µm) with a μBondapak C18 Guard-pak precolumn (Waters, Milford, MA). The detec-tion wavelength was 205 nm and the column oven was set at 40°C. The chromatographic data were collected by LC Solution chromatography system (Scientific Software, Shi-madzu).
The mobile phase was a mixture of acetonitrile-sodium dihydrogen phosphate (10 mmol L1, pH 4.8) (60:40, v/v). The run time was 12 min, and the mobile phase flow rate was 1 mL min1. The injection volume was 20 µL.
1.3 Preparation of calibration standards and quality control (QC) samples
LPV and RTV were dissolved in methanol at concentrations of 400 and 100 µg mL1, respectively. Calibration curve samples were prepared by spiking fresh blank plasma with the LPV and RTV stock solutions to give final concentra-tions of 20, 16, 12, 8.0, 4.0, 2.0 and 0.5 µg mL1 for LPV and 5.0, 4.0, 3.0, 2.0, 1.0, 0.5, and 0.05 µg mL1 for RTV. Three QC samples were prepared in plasma at concentra-tions of 18 (high quality control, HQC), 10 (medium quality control, MQC) and 1 µg mL1 (low quality control, LQC) for LPV and 4.5 (HQC), 2.5 (MQC), 0.25 µg mL1 (LQC) for RTV. The QC samples were used for evaluation of the recovery, precision and accuracy of the developed method, and the stability of LPV and RTV. When analyzing un-known samples, the QC samples were analyzed randomly along with the unknown samples. A 120 µg mL1 stock so-lution of the IS, diazepam, was prepared in deionized water containing methanol (approximately 10 %). The working IS solution (12 µg mL1) was prepared by diluting the stock solution with deionized water.
The calibration, QC, and IS samples were stored at –60°C before use.
1.4 Plasma extraction procedures
On the day of analysis, the calibration, QC and plasma samples were thawed and allowed to equilibrate at room temperature. Methyl tert-butyl ether (1 mL) and the diaze-pam working IS solution (20 µL) were added to 200 µL of plasma in a 1.5 mL vial. After vortex mixing (Ping-Pong 74580, Block Scientific, Bohemia, NY) the sample was left for 5 min at ambient temperature. The organic layer was evaporated to dryness with highly purified nitrogen, and the residue was redissolved in 100 µL of 20 % acetonitrile. The resulting solution was carefully vortex mixed and then cen-trifuged at 3000×g for 5 min (Model 113, Sigma-Aldrich). Finally, 20 µL aliquots was injected into the chromato-

Kou H J, et al. Sci China Life Sci April (2012) Vol.55 No.4 323
graphic system.
1.5 Analytic method validation
Seven-point calibration was constructed by plotting the peak height ratios of LPV and RTV to the IS (diazepam) against the sample concentrations. Weighted least square linear regression (weighting factor: 1/concentration) was used because of the large calibration curve range. The cali-bration curves were used to calculate the LPV and RTV concentrations in the QC and unknown samples.
The absolute recoveries of LPV and RTV and the IS from human plasma were determined by comparing the peak heights of LPV and RTV and IS in the extracted QC samples with those in aqueous solutions at the same con-centrations. The method recoveries of LPV and RTV from plasma samples were measured by comparing the extracted QC samples after liquid-liquid extraction with the spiked concentrations of LPV and RTV.
The intra-day and inter-day variability of the low, me-dium, and high concentration QC samples was used to evaluate the precision of the method. The accuracy was evaluated by comparing the relative values of the calculated concentrations of the QC samples with their theoretical values.
The freeze-thaw stability was determined after three freeze-thaw cycles of freezing at –60°C for 24 h and then thawing completely at room temperature. The stability of extracted samples at 20°C in the autosampler was evaluated up to 24 h after extraction. The long-term stability of LPV and RTV was evaluated using QC samples that were stored at –60°C for at least 3 months.
1.6 Specificity
The specificity was determined by analyzing six different blank human plasma samples. Interference from twelve commonly used and potentially coadministered medications was also investigated. These medications included ribavirin, fenofibrate, fluconazole, ibuprofen, atorvastatin, the non- nucleosides reverse transcriptase inhibitors nevirapine and efavirenz, and the nucleosides reverse transcriptase inhibi-tors lamivudine, didanosine, stavudine, zidovudine and tenofovir. For the method to be successfully applied, there should be no interference from endogenous or exogenous materials at the retention time of the two analytes or IS.
1.7 Sample collection
The study was approved by the Ethics Committee of Peking Union Medical College Hospital (Beijing, China), and writ-ten informed consent was obtained from each HIV-positive patient in the study. Three Chinese HIV-positive adults were orally administered a salvage regimen of one tablet of
300 mg of tenofovir DF (Viread, Gilead sciences, US) and lamivudine (Desano, Shanghai, CN) once daily and two tablets of 200/50 mg LPV/r (Kelatra, Abbott, USA) twice daily. Good compliance was found at a 48-week follow up. After effective antiretroviral treatment, sustained virological suppression and favorable immunological response were achieved. The patients were not prescribed CYP3A4 inhib-itors or inducers.
To measure the trough concentration (Ctrough) blood sam-ples were collected before the next drug administration, and to measure the peak concentration (Cmax) blood samples were collected 2 h after administration. All samples were collected in tubes coated with spray dried EDTA and cen-trifuged in the real time to obtain plasma samples, which were stored at –60°C until analysis.
2 Results
2.1 Chromatograms
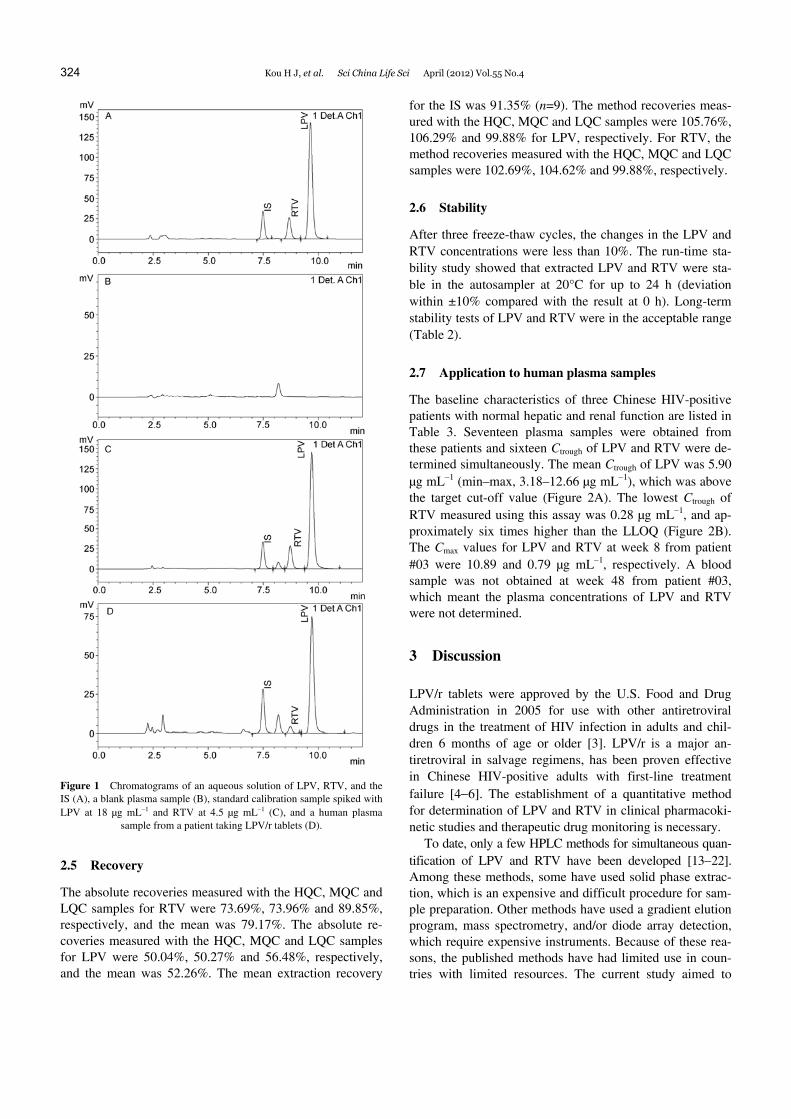
Chromatograms were obtained of an aqueous solution of LPV, RTV, and the IS (Figure 1A), a blank plasma sample (Figure 1B), standard calibration sample spiked with LPV at 18 µg mL1 and RTV at 4.5 µg mL1 (Figure 1C), and a hu-man plasma sample from a patient receiving LPV/r tablets (Figure 1D). The retention times of the IS, RTV and LPV were 7.566, 8.838 and 9.835 min, respectively.
2.2 Specificity
No interfering peaks from endogenous compounds or po-tential coadministered drugs were observed at the retention times of LPV, RTV, or the IS in the chromatograms of six different blank plasma samples.
2.3 Linearity
The calibration curves were linear from 0.5–20 µg mL1 for LPV and 0.05–5 µg mL1 for RTV (n=6). Typical equations of calibration curves were Y=0.208X-0.0013 (r=0.9995)
for LPV and Y=0.198X-0.0009 (r=0.9997) for RTV. The lower limit of quantification (LLOQ) of LPV was 0.5 µg mL1 and that of RTV was 0.05 µg mL1.
2.4 Precision and accuracy
The precision and accuracy of this method were evaluated using the HQC, MQC and LQC samples. The intra- and inter-day relative standard deviations (R.S.D.s) for LPV were 2.16%–3.20% and 2.34%–4.04%, respectively (Table 1). For RTV, the intra- and inter-day R.S.D.s were 2.12%– 2.60% and 0.31%–4.94%, respectively. The accuracies for the QC samples were within an acceptable range (±10%).
324 Kou H J, et al. Sci China Life Sci April (2012) Vol.55 No.4
Figure 1 Chromatograms of an aqueous solution of LPV, RTV, and the IS (A), a blank plasma sample (B), standard calibration sample spiked with LPV at 18 µg mL1 and RTV at 4.5 µg mL1 (C), and a human plasma
sample from a patient taking LPV/r tablets (D).
2.5 Recovery
The absolute recoveries measured with the HQC, MQC and LQC samples for RTV were 73.69%, 73.96% and 89.85%, respectively, and the mean was 79.17%. The absolute re-coveries measured with the HQC, MQC and LQC samples for LPV were 50.04%, 50.27% and 56.48%, respectively, and the mean was 52.26%. The mean extraction recovery
for the IS was 91.35% (n=9). The method recoveries meas-ured with the HQC, MQC and LQC samples were 105.76%, 106.29% and 99.88% for LPV, respectively. For RTV, the method recoveries measured with the HQC, MQC and LQC samples were 102.69%, 104.62% and 99.88%, respectively.
2.6 Stability
After three freeze-thaw cycles, the changes in the LPV and RTV concentrations were less than 10%. The run-time sta-bility study showed that extracted LPV and RTV were sta-ble in the autosampler at 20°C for up to 24 h (deviation within ±10% compared with the result at 0 h). Long-term stability tests of LPV and RTV were in the acceptable range (Table 2).
2.7 Application to human plasma samples
The baseline characteristics of three Chinese HIV-positive patients with normal hepatic and renal function are listed in Table 3. Seventeen plasma samples were obtained from these patients and sixteen Ctrough of LPV and RTV were de-termined simultaneously. The mean Ctrough of LPV was 5.90 µg mL1 (min–max, 3.18–12.66 µg mL1), which was above the target cut-off value (Figure 2A). The lowest Ctrough of RTV measured using this assay was 0.28 µg mL1, and ap-proximately six times higher than the LLOQ (Figure 2B). The Cmax values for LPV and RTV at week 8 from patient #03 were 10.89 and 0.79 µg mL1, respectively. A blood sample was not obtained at week 48 from patient #03, which meant the plasma concentrations of LPV and RTV were not determined.
3 Discussion
LPV/r tablets were approved by the U.S. Food and Drug Administration in 2005 for use with other antiretroviral drugs in the treatment of HIV infection in adults and chil-dren 6 months of age or older [3]. LPV/r is a major an-tiretroviral in salvage regimens, has been proven effective in Chinese HIV-positive adults with first-line treatment failure [46]. The establishment of a quantitative method for determination of LPV and RTV in clinical pharmacoki-netic studies and therapeutic drug monitoring is necessary.
To date, only a few HPLC methods for simultaneous quan-tification of LPV and RTV have been developed [1322]. Among these methods, some have used solid phase extrac-tion, which is an expensive and difficult procedure for sam-ple preparation. Other methods have used a gradient elution program, mass spectrometry, and/or diode array detection, which require expensive instruments. Because of these rea-sons, the published methods have had limited use in coun-tries with limited resources. The current study aimed to

Kou H J, et al. Sci China Life Sci April (2012) Vol.55 No.4 325
Table 1 Precision and accuracy of the assay for LPV and RTV
Spiked concentration
(µg mL1)
Intra-assay (n=10)
Inter-assay (n=6) Calculated concentration
(µg mL1) (mean±SD) R.E.C.a) (%)
R.S.D.b) (%)
Calculated concentration (µg mL1) (mean±SD)
R.E.C.a) (%) R.S.D.b) (%)
LPV
18 19.45±0.48 108.07 2.48 18.34±0.46 101.91 2.53
10 10.82±0.23 108.21 2.16 10.31±0.24 103.09 2.34
1 0.99±0.03 98.92 3.20 1.01±0.04 101.47 4.04
RTV
4.5 4.70±0.11 104.40 2.41 4.49±0.01 99.83 0.31
2.5 2.66±0.07 106.23 2.60 2.55±0.05 101.92 1.83
0.25 0.25±0.01 98.77 2.12 0.25±0.01 101.74 4.94
a) R.E.C. (%)=calculated concentration/spiked concentration×100. b) R.S.D. (%)=SD/calculated concentration×100.
Table 2 Stability tests of LPV and RTV
LPV
RTV
Calculated concentration
(µg mL1) (mean±SD) R.E.C.a) (%)
R.S.D.b) (%)
Calculated concentration
(µg mL1) (mean±SD) R.E.C.a) (%)
R.S.D.b) (%)
Freeze and thaw (72 h) HQC 17.46±0.54 97.00 3.12 4.26±0.20 94.72 4.76
MQC 10.11±0.19 101.09 1.91 2.52±0.03 100.63 1.27
LQC 1.00±0.02 100.14 1.77 0.24±0.00 97.90 1.54
Autosampler (24 h) HQC 18.09±0.32 100.51 1.76 4.49±0.07 99.88 1.49
MQC 9.89±0.60 98.87 6.04 2.55±0.11 101.84 4.48
LQC 0.94±0.04 94.17 4.55 0.24±0.01 97.60 5.31
Long term (90 d) HQC 16.87±1.13 93.75 6.69 4.49±0.32 99.73 7.19
MQC 9.89±0.14 98.86 1.46 2.51±0.03 100.52 1.07
LQC 1.08±0.03 108.28 3.23 0.25±0.01 100.22 2.50
a) R.E.C. (%)=calculated concentration/spiked concentration×100. b) R.S.D. (%)=SD/calculated concentration×100.
Table 3 Baseline characteristics of three HIV-positive Chinese patients
Patient #01 Patient #02 Patient #03
Gender Male Female Female
Age (years) 46 34 41
Body-mass index (kg m2) 64 48 54
Route of transmission Blood Heterosexual Heterosexual
Duration of HIV diagnosis (years) 13 10 10
HIV-1 RNA (log10c mL1) 4.41 4.73 3.91
CD4+ cell count (cells mm3) 155 272 254
Hepatitis B coinfection No No No
Hepatitis C coinfection Yes No No
Figure 2 Plasma trough concentrations at 48-week follow-up in three patients orally administered LPV/r tablets. A, LPV. B, RTV. (Triangles represent patient #01, circles represent patient #02, and squares represent patient #03).

326 Kou H J, et al. Sci China Life Sci April (2012) Vol.55 No.4
establish a simple, sensitive, accurate, and reproducible HPLC-UV-Vis method for quantitative determination of LPV and RTV in human plasma.
The developed assay was sensitive and did not require any expensive equipment or extra processing steps. The LLOQ values were 0.05 µg mL1 for RTV and 0.5 µg mL1 for LPV. The high sensitivity of this method can be at-tributed to several factors. The first and the most important factor is high recovery of LPV and RTV from the matrices. LLE of 200 µL plasma samples was carried out using 1 mL of methyl tert-butyl ether, and this provided higher extrac-tion efficiency than other organic solvent such as ethyl ether, ethyl acetate, or methylene chloride. The high sensitivity can also be attributed to a lack of background noise in the chromatogram and high signal-to-noise ratio. In the mobile phase, the phosphate buffer (pH 4.80) showed satisfactory separation of LPV and RTV. Careful adjustment of the ratio of phosphate buffer to acetonitrile gave a clean baseline between the peaks of interest. The final factor contributing to the sensitivity was the use of a single wavelength (205 nm) for detection. This wavelength gave a relatively high absorbance compared with other wavelengths. The injection volume was only 20 µL, and the LLOQ could be decreased by increasing the injection volume if necessary. If we dou-ble the injection volume, the plasma sample size can be halved, which would be very useful in situations when it is difficult to obtain blood samples.
LPV and RTV are both weak bases with very low pKa values (<3) and are not ionized at neutral pH values [23]. During method development, the retention times of LPV and RTV were affected by the pH of the phosphate buffer in the mobile phase. When the pH of phosphate buffer was below 4.50, endogenous substances from the plasma inter-fered with detection of LPV and RTV. However, if the pH was above 5.00, the two analytes of interest and the IS were not separated. A pH of 4.80 was used to prepare the mobile phase to obtain suitable retention times and optimize the peak shapes of the analytes of interest.
A gradient elution program is commonly used for deter-mination of LPV and RTV [13,14,18]. However, this re-quires binary pump system, a difficult elution procedure, long run time, and results in reagent waste. Under isocratic conditions in the present study, the run time was short (12 min) and the analytical column did not need washed or re-equilibrated between runs. This condition provided good resolutions for the analyte peaks and separated them from endogenous interferences in plasma and potential concomi-tant antiretroviral drugs. Notably, the analytical column did not show any deterioration after more than 6 months of use.
A structural analog of the analyte of interest is an ideal IS because it will exhibit similar behavior in the sample ex-traction, chromatographic elution, and UV detection proce-dures. Compound A-86093 (Abbott Laboratories, North Chicago, IL) is commonly used as the IS [1922,24,25]. Unfortunately, A-86093 is not commercially available in
China. Therefore, we tried to find another compounds for use as the IS, and considered diazepam, clonazepam, and ranitidine. Diazepam was chosen as the IS because it gave a high extraction recovery and suitable retention time. The other advantages of diazepam include its low cost, availa-bility, and the fact it is rarely prescribed to HIV-positive patients in China.
The developed method showed high sensitivity and spec-ificity, reproducible sample treatment, and had small sample size requirements and a simple isocratic elution. It was suc-cessfully applied to plasma samples from HIV-positive pa-tients that were orally administered LPV/r tablets. The re-sults indicated that the range of the calibration curve and LLOQ of the assay were sufficient for quantitative deter-mination of LPV and RTV in human plasma in patients rou-tinely taking LPV/r tablets. This method could be used for routine therapeutic drug monitoring.
4 Conclusion
A HPLC-UV-Vis method was developed for quantitative determination of LPV and RTV in human plasma. Efficient LLE provided excellent sample clean up, high extraction efficiency, and high sensitivity with a small sample size. The analysis method was specific, accurate, and reproduci-ble. It was successfully applied to human plasma samples from HIV-positive Chinese patients, and was robust and reliable. Because this method is simple and inexpensive, it could be used in pharmacokinetic studies and routine thera-peutic drug monitoring of LPV and RTV, especially in re-source-limited settings.
This work was supported by the National Key Technologies R&D Program for the 11th Five-year Plan (Grant No. 2008ZX10001-006) and the Key Clinical Program of the Ministry of Health 20102012. The authors thank Dr. Ma Qing (Pharmacy and Pharmaceutical Sciences, University at Buf-falo, Buffalo, NY) for his suggestions and language help.
1 Barragan P, Podzamczer D. Lopinavir/ritonavir: a protease inhibitor for HIV-1 treatment. Expert Opin Pharmacother, 2008, 9: 2363–2375
2 Cvetkovic R S, Goa K L. Lopinavir/ritonavir: a review of its use in the management of HIV infection. Drugs, 2003, 63: 769–802
3 Kaplan S S, Hicks C B. Lopinavir/ritonavir in the treatment of human immunodeficiency virus infection. Expert Opin Pharmacother, 2005, 6: 1573–1585
4 Manosuthi W, Kiertiburanakul S, Amornnimit W, et al. Treatment outcomes and plasma level of ritonavir-boosted lopinavir monother-apy among HIV-infected patients who had NRTI and NNRTI failure. AIDS Res Ther, 2009, 6: 30
5 Josephson F, Andersson M C, Flamholc L, et al. The relation be-tween treatment outcome and efavirenz, atazanavir or lopinavir ex-posure in the NORTHIV trial of treatment-naive HIV-1 infected pa-tients. Eur J Clin Pharmacol, 2010, 66: 349–357
6 Hsu A, Isaacson J, Brun S, et al. Pharmacokinetic-pharmacodynamic analysis of lopinavir-ritonavir in combination with efavirenz and two nucleoside reverse transcriptase inhibitors in extensively pretreated human immunodeficiency virus-infected patients. Antimicrob Agents

Kou H J, et al. Sci China Life Sci April (2012) Vol.55 No.4 327
Chemother, 2003, 47: 350–359 7 DHHS. Guidelines for the Use of Antiretroviral Agents in HIV-1-
nfected Adults and Adolescents. 2009. http://AIDSinfonihgov 8 Gutierrez F, Padilla S, Navarro A, et al. Lopinavir plasma concentra-
tions and changes in lipid levels during salvage therapy with lop-inavir/ritonavir-containing regimens. J Acquir Immune Defic Syndr, 2003, 33: 594–600
9 Hammer S M, Eron J J Jr., Reiss P, et al. Antiretroviral treatment of adult HIV infection: 2008 recommendations of the International AIDS Society-USA panel. Jama, 2008, 300: 555–570
10 Thompson M A, Aberg J A, Cahn P, et al. Antiretroviral treatment of adult HIV infection: 2010 recommendations of the International AIDS Society-USA panel. Jama, 2010, 304: 321–333
11 la Porte C J, Colbers E P, Bertz R, et al. Pharmacokinetics of adjust-ed-dose lopinavir-ritonavir combined with rifampin in healthy volun-teers. Antimicrob Agents Chemother, 2004, 48: 1553–1560
12 Sham H L, Kempf D J, Molla A, et al. ABT-378, a highly potent in-hibitor of the human immunodeficiency virus protease. Antimicrob Agents Chemother, 1998, 42: 3218–3224
13 D’Avolio A, Siccardi M, Sciandra M, et al. HPLC-MS method for the simultaneous quantification of the new HIV protease inhibitor darunavir, and 11 other antiretroviral agents in plasma of HIV-infected patients. J Chromatogr B Analyt Technol Biomed Life Sci, 2007, 859: 234–240
14 Colombo S, Guignard N, Marzolini C, et al. Determination of the new HIV-protease inhibitor atazanavir by liquid chromatography af-ter solid-phase extraction. J Chromatogr B Analyt Technol Biomed Life Sci, 2004, 810: 25–34
15 Droste J A, Verweij-Van Wissen C P, Burger D M. Simultaneous determination of the HIV drugs indinavir, amprenavir, saquinavir, ri-tonavir, lopinavir, nelfinavir, the nelfinavir hydroxymetabolite M8, and nevirapine in human plasma by reversed-phase high-performance liquid chromatography. Ther Drug Monit, 2003, 25: 393–399
16 Hirano A, Takahashi M, Kinoshita E, et al. High performance liquid chromatography using UV detection for the simultaneous quantifica-tion of the new non-nucleoside reverse transcriptase inhibitor et- ravirine (TMC-125), and 4 protease inhibitors in human plasma. Biol
Pharm Bull, 2010, 33: 1426–1429 17 Proust V, Toth K, Hulin A, et al. Simultaneous high-performance
liquid chromatographic determination of the antiretroviral agents amprenavir, nelfinavir, ritonavir, saquinavir, delavirdine and efavi-renz in human plasma. J Chromatogr B Biomed Sci Appl, 2000, 742: 453–458
18 Marzolini C, Beguin A, Telenti A, et al. Determination of lopinavir and nevirapine by high-performance liquid chromatography after solid-phase extraction: application for the assessment of their trans-placental passage at delivery. J Chromatogr B Analyt Technol Bio-med Life Sci, 2002, 774: 127–140
19 Ray J, Pang E, Carey D. Simultaneous determination of indinavir, ri-tonavir and lopinavir (ABT 378) in human plasma by high- performance liquid chromatography. J Chromatogr B Analyt Technol Biomed Life Sci, 2002, 775: 225–230
20 Takahashi M, Yoshida M, Oki T, et al. Conventional HPLC method used for simultaneous determination of the seven HIV protease inhib-itors and nonnucleoside reverse transcription inhibitor efavirenz in human plasma. Biol Pharm Bull, 2005, 28: 1286–1290
21 Usami Y, Oki T, Nakai M, et al. A simple HPLC method for simul-taneous determination of lopinavir, ritonavir and efavirenz. Chem Pharm Bull, 2003, 51: 715–718
22 Elens L, Veriter S, Di Fazio V, et al. Quantification of 8 HIV-protease inhibitors and 2 nonnucleoside reverse transcriptase in-hibitors by ultra-performance liquid chromatography with diode array detection. Clin Chem, 2009, 55: 170–174
23 Gavard L, Gil S, Peytavin G, et al. Placental transfer of lop-inavir/ritonavir in the ex vivo human cotyledon perfusion model. Am J Obstet Gynecol, 2006, 195: 296–301
24 Remmel R P, Kawle S P, Weller D, et al. Simultaneous HPLC assay for quantification of indinavir, nelfinavir, ritonavir, and saquinavir in human plasma. Clin Chem, 2000, 46: 73–81
25 Solas C, Poizot-Martin I, Drogoul M P, et al. Therapeutic drug mon-itoring of lopinavir/ritonavir given alone or with a non-nucleoside reverse transcriptase inhibitor. Br J Clin Pharmacol, 2004, 57: 436–440
Open Access This article is distributed under the terms of the Creative Commons Attribution License which permits any use, distribution, and reproduction
in any medium, provided the original author(s) and source are credited.


