Simultaneous Online Enrichment and Identification...
6
Simultaneous Online Enrichment and Identification of Trace Species Based on Microfluidic Droplets Ji Ji, † Lei Nie, †,‡ Yixin Li, † Pengyuan Yang,* ,† and Baohong Liu* ,† † Department of Chemistry and Institutes of Biomedical Sciences, Fudan University, 220 HanDan Road, Shanghai 200433, China ‡ Shanghai Institute of Quality Inspection and Technical Research, Shanghai 201114, China * S Supporting Information ABSTRACT: A facile online enrichment protocol has been proposed based on microfluidic droplets acting as an interface between a liquid chromatography separation system and detection systems of ESI-MS/MS and laser-induced fluorescence. Low-abundance species were successfully concentrated and analyzed in this system via droplet shrinkage. The proposed platform significantly increased the enrichment efficiency and detection sensitivity with reduced sample handling steps, short analysis time, and no cross-contamination. The presented system is universal, shows no discrimination, and is easily coupled with other separation and detection approaches. B iomarkers are valuable targets for early diagnosis of diseases and for monitoring therapy and postsurgical recurrence. 1-5 Electrospray ionization mass spectrometry (ESI- MS n ) coupled with liquid-based separation, such as reversed phase chromatography, 6-8 electrophoresis, 9 or electrochroma- tography, 10 has been the foundation of biomarker discovery in large scale. 11,12 Medically significant biomarkers are usually low- abundance molecules compared with normal proteins or peptides. 13-15 To effectively detect and predict these biomarkers, the ability to concentrate limited molecules within the analytic vessels is critical. Various sample preprocessing methods have been developed, such as selective enrichment of targeted biomolecules or depletion of abundant species. To some extent, these methods are still challenging for the general applications of online and undiscriminating enrichment of low- abundance molecules where the key markers may be covered. 5 To address this challenge, we propose a new concept of online enrichment of low-concentration targets in microfluidic droplets acting as a simple and universal interface between liquid-based separation and mass spectrometry. Droplet-based microfluidic chips, with their flexible manipulation, precise volume control, and ability to integrate multiple analysis steps, offer promise for performing high throughput and automated chemical and biological experiments without cross-contami- nation. 16-24 We have recently developed a droplet-based microfluidic chip used not only as a microreactor for protein digestion but also as an interface between liquid-based separation and ESI-tandem mass spectrometry. 25 This concept would be an ideal tool for online enrichment of trace analytes, if the species within individual droplets could be concentrated to a high level. The droplet shrinkage method has been developed based on the phenomenon that water has slight solubility in many oil phases, whereas ions, solutes, or biomolecules can remain in the water droplets. 26-28 This performance has been applied for fabrication of various particles and protein crystallization. 29-31 In recent research, Chiu et al. 32 have demonstrated a flexible method to concentrate dissolved solutes and nanoparticles in aqueous microdroplets and investigated the kinetics and factors affecting droplet shrinkage. So far there has been no report to introduce the droplet shrinkage method with ESI-MS n to realize online concentration and simultaneous detection of trace species. In this work, we have developed a facile and versatile protocol capable of online enrichment of separated peptides based on droplet shrinkage in a microfluidic chip coupled with ESI-MS/MS. Herein, the separated sample effluents were compartmentalized into droplets sequentially, where the solvents of each droplet were dissolved in continuous phase in microchannels, and the remaining samples were concen- trated in these shrinking droplets and detected by ESI-tandem mass spectrometry (ESI-MS n ) with high sensitivity. Such an approach was successfully demonstrated for peptide mixtures of bovine serum albumin (BSA) digestion at low concentrations by using reverse-phase liquid chromatography (RPLC), online concentration in droplet-based microchips, and identification with ESI-MS/MS. Received: June 17, 2013 Accepted: September 15, 2013 Published: September 16, 2013 Article pubs.acs.org/ac © 2013 American Chemical Society 9617 dx.doi.org/10.1021/ac4018082 | Anal. Chem. 2013, 85, 9617-9622
Transcript of Simultaneous Online Enrichment and Identification...

Simultaneous Online Enrichment and Identification of Trace SpeciesBased on Microfluidic DropletsJi Ji,† Lei Nie,†,‡ Yixin Li,† Pengyuan Yang,*,† and Baohong Liu*,†
†Department of Chemistry and Institutes of Biomedical Sciences, Fudan University, 220 HanDan Road, Shanghai 200433, China‡Shanghai Institute of Quality Inspection and Technical Research, Shanghai 201114, China
*S Supporting Information
ABSTRACT: A facile online enrichment protocol has been proposed basedon microfluidic droplets acting as an interface between a liquidchromatography separation system and detection systems of ESI-MS/MSand laser-induced fluorescence. Low-abundance species were successfullyconcentrated and analyzed in this system via droplet shrinkage. Theproposed platform significantly increased the enrichment efficiency anddetection sensitivity with reduced sample handling steps, short analysis time,and no cross-contamination. The presented system is universal, shows nodiscrimination, and is easily coupled with other separation and detectionapproaches.
Biomarkers are valuable targets for early diagnosis ofdiseases and for monitoring therapy and postsurgical
recurrence.1−5 Electrospray ionization mass spectrometry (ESI-MSn) coupled with liquid-based separation, such as reversedphase chromatography,6−8 electrophoresis,9 or electrochroma-tography,10 has been the foundation of biomarker discovery inlarge scale.11,12 Medically significant biomarkers are usually low-abundance molecules compared with normal proteins orpeptides.13−15 To effectively detect and predict thesebiomarkers, the ability to concentrate limited molecules withinthe analytic vessels is critical. Various sample preprocessingmethods have been developed, such as selective enrichment oftargeted biomolecules or depletion of abundant species. Tosome extent, these methods are still challenging for the generalapplications of online and undiscriminating enrichment of low-abundance molecules where the key markers may be covered.5
To address this challenge, we propose a new concept ofonline enrichment of low-concentration targets in microfluidicdroplets acting as a simple and universal interface betweenliquid-based separation and mass spectrometry. Droplet-basedmicrofluidic chips, with their flexible manipulation, precisevolume control, and ability to integrate multiple analysis steps,offer promise for performing high throughput and automatedchemical and biological experiments without cross-contami-nation.16−24 We have recently developed a droplet-basedmicrofluidic chip used not only as a microreactor for proteindigestion but also as an interface between liquid-basedseparation and ESI-tandem mass spectrometry.25 This conceptwould be an ideal tool for online enrichment of trace analytes, ifthe species within individual droplets could be concentrated toa high level. The droplet shrinkage method has been developedbased on the phenomenon that water has slight solubility in
many oil phases, whereas ions, solutes, or biomolecules canremain in the water droplets.26−28 This performance has beenapplied for fabrication of various particles and proteincrystallization.29−31 In recent research, Chiu et al.32 havedemonstrated a flexible method to concentrate dissolvedsolutes and nanoparticles in aqueous microdroplets andinvestigated the kinetics and factors affecting droplet shrinkage.So far there has been no report to introduce the dropletshrinkage method with ESI-MSn to realize online concentrationand simultaneous detection of trace species.In this work, we have developed a facile and versatile
protocol capable of online enrichment of separated peptidesbased on droplet shrinkage in a microfluidic chip coupled withESI-MS/MS. Herein, the separated sample effluents werecompartmentalized into droplets sequentially, where thesolvents of each droplet were dissolved in continuous phasein microchannels, and the remaining samples were concen-trated in these shrinking droplets and detected by ESI-tandemmass spectrometry (ESI-MSn) with high sensitivity. Such anapproach was successfully demonstrated for peptide mixtures ofbovine serum albumin (BSA) digestion at low concentrationsby using reverse-phase liquid chromatography (RPLC), onlineconcentration in droplet-based microchips, and identificationwith ESI-MS/MS.
Received: June 17, 2013Accepted: September 15, 2013Published: September 16, 2013
Article
pubs.acs.org/ac
© 2013 American Chemical Society 9617 dx.doi.org/10.1021/ac4018082 | Anal. Chem. 2013, 85, 9617−9622
■ EXPERIMENTAL SECTION
Chemicals and Materials. Bovine serum albumin andtrypsin were all obtained from Sigma Chemical Co. Inc. (St.Louis, MO). Fluorescein isothiocyanate (FITC) labeled Pep I(KCDICTDEY-FITC) and Pep II (CYIQNCPRG) werepurchased from Sangon Biotech (Shanghai) Co., Ltd.Acetonitrile (HPLC grade) was purchased from FisherScientific (Ottawa, ON, Canada) and used without furtherpurification. Formic acid (analytical reagent, 98%) waspurchased from BDH Chemicals, (Toronto, ON, Canada).Dimethyl carbonate (DMC) was purchased from AladdinRegent (Shanghai, China). Aquapel was purchased from PPGIndustries. Deionized water (>18 MΩ·cm) was obtained from aMilli-Q Gradient water purification system (Millipore, Bedford,MA). The C18 column (0.2 × 50 μm MagicC18AQ 3 μm, 200Å) used for reversed-phased chromatography and the trapcolumn (C18, 0.5 × 2 mm) were purchased from MichromBioresources Inc. (Auburn, CA).Fabrication of the Microchip. The microfluidic device
was made by conventional soft lithographic techniques.33 Thedetailed design of the PDMS chip is shown in Figure SI-1 ofSupporting Information. The height of the channels is 100 μm,and the width and length of the reaction channels are 250 μmand 47 cm, respectively. The microdevice was assembled byattaching the PDMS cast to a glass slide. The bonding strengthwas provided by pretreating the contact surfaces with oxygenplasma for 60 s in the plasma cleaner (PDC-32G, HarrickPlasma). After plasma bonding, Aquapel, a water repellentagent, was flushed through the microchannel for a few secondsfor surface modification. Then the microchannel was flushedwith air and baked at 65 °C for 20 min.34 A stainless capillary(250 μm o.d. and 100 μm i.d.) was used as the MS emitter andglued onto the outlet of chip using 502 glue.Protein/Peptide Separation and Enrichment. BSA
digests were separated by an HPLC system (MichromBioresources Inc. CA) equipped with a C18 column (0.2 ×50 mm Magic C18AQ3 μm, 200 Å). The C18 column wasconnected to the HPLC system and operated at a flow rate of 2μL/min. The BSA peptides were loaded and analyzed. SolventA was 5/94.9/0.1% acetonitrile (ACN)/H2O/formic acid (FA),solvent B was 95/4.9/0.1% ACN/H2O/FA, and solvent C was99.9/0.1% H2O/FA. First, the sample was loaded by pump Cwith a flow rate of 30 μL/min for about 5 min to the trapcolumn (C18, 0.5 × 2 mm), and then the valve was switched tobegin the gradient. The following separation gradient was set asfollows: solvent A 90% (0 min) → 90% (5 min) → 50% (10min)→ 50% (30 min)→ 95% (30.1 min)→ 95% (35 min). Atthe end of the HPLC column, a quartz capillary (length 8 cm,25 μm i.d., and 365 μm o.d.) was used to connect the HPLCand a flexible tube (Pharmed BPT, 250 μm i.d.). The other endof the flexible tube was inserted into the microfluidic chip inletA (as shown in Figure SI-1, Supporting Information. Dimethylcarbonate (DMC) was employed as a carrying organic phase,which is miscible with acetonitrile and dissolved in water at2.9% in weight. The oil phase of DMC was injected bymultichannel syringe pumps (LONGER Apparatus, Shanghai)from inlet B at a flow rate of 200 μL/h. A photo of themicrofluidic-ESI-MS platform is shown in Figure SI-2 ofSupporting Information. A self-improved MS ion source wasused. The chip was adhered to the three-dimensional platform,and high voltage was applied on the end of the stainlesscapillary for ESI-MS identification. All standard samples were
dissolved in a solution containing 50% ACN/49.9% water/0.1%FA and injected by syringe pumps at inlet A at a flow rate of120 μL/h.
ESI-MS/MS Identification. LTQ MS (Thermo Corpo-ration, USA) was run under data-dependent mode, the sprayvoltage was 1.9 kV, the capillary temperature was 220 °C, andthe injection time was set to 50 ms. The first mass spectrometrystage was set to full scan, and the mass range was m/z 350−1800. The ten highest strength ions were selected for thesecond stage mass spectrometry, and the minimum ion strengthfor the MS2 was 5000. The energy of CID was adjustableaccording to the size of peptide, dynamic exclusion was used,and the repeat duration time was 30 s. All the solvent ions wereset in the reject list table and would not be selected for the MS2.
Data Processing. The data were searched in the Swissportdatabase using Bioworks software. Trypsin was set as theenzyme for database searching, peptides were searched usingfully tryptic cleavage constraints, and up to two missed internalsites were allowed for tryptic digestion. The parent ion’stolerance was 2.0 amu. The fragment ion’s tolerance was set to1 amu, B and Y ions were used to calculate the series, and themodification was set to methionine (+15.9994 Da). Accordingto the filtrate criterion of SEQUEST,35 the identification ofpeptides was reliable when its confidence was more than 95%.The Xcorr Vs charges were 3.0 > (+4) > 2.5 (+3), > 2.0 (+2), >1.50 (+1), ΔCn > 0.1.
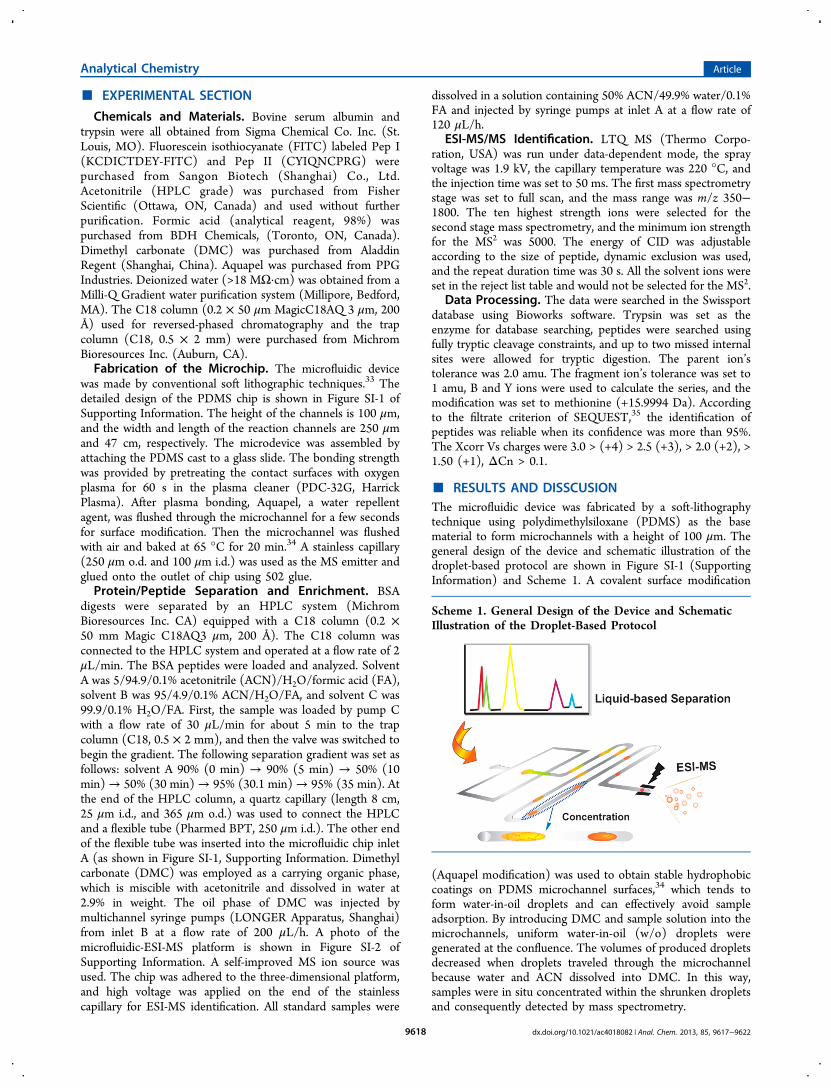
■ RESULTS AND DISSCUSIONThe microfluidic device was fabricated by a soft-lithographytechnique using polydimethylsiloxane (PDMS) as the basematerial to form microchannels with a height of 100 μm. Thegeneral design of the device and schematic illustration of thedroplet-based protocol are shown in Figure SI-1 (SupportingInformation) and Scheme 1. A covalent surface modification
(Aquapel modification) was used to obtain stable hydrophobiccoatings on PDMS microchannel surfaces,34 which tends toform water-in-oil droplets and can effectively avoid sampleadsorption. By introducing DMC and sample solution into themicrochannels, uniform water-in-oil (w/o) droplets weregenerated at the confluence. The volumes of produced dropletsdecreased when droplets traveled through the microchannelbecause water and ACN dissolved into DMC. In this way,samples were in situ concentrated within the shrunken dropletsand consequently detected by mass spectrometry.
Scheme 1. General Design of the Device and SchematicIllustration of the Droplet-Based Protocol
Analytical Chemistry Article
dx.doi.org/10.1021/ac4018082 | Anal. Chem. 2013, 85, 9617−96229618

To explore the possibility of this platform for concentratinganalytes, a peptide solution (containing 50% acetonitrile and50% water) of Lys-Cys-Asp-Ile-Cys-Thr-Asp-Glu-Tyr(KCDICTDEY, PepI) labeled with fluorescein isothiocyanate(FITC) was used as analyte for the experiment. Thefluorescence signals of droplets were measured by the laser-
induced fluorescence (LIF) detector. Figure 1a displays thefluorescence signals detected at different locations in themicrofluidic channels corresponding to different concentrationtimes. The fluorescence signal of the initial droplet (10 μg/mL)was 0.0065 V, while after a 20 s and 2 min concentration in themicrochannel, the signals increased to 0.035 and 0.08 V,
Figure 1. (a) The fluorescence signals corresponding to different concentration times within the microchip. The fluorescence signals of FITC-labeled peptides (Pep I) in droplets after (b) 0.14 s, (c) 20 s, and (d) 2 min concentration. The inserts are the corresponding images of a droplettaken by a microscope coupled with a digital camera (scale bar 100 μm).
Figure 2. The base peak chromatography of peptides (Pep II, 20 nM) by the integration of the microfluidic chip and ESI-MS/MS (a) with onlineconcentration and (c) without concentration. (b) The mass spectrum of peptides at RT = 1.25 min from spectrum a. (d) The mass spectrum ofpeptides at RT = 0.48 min from spectrum c.
Analytical Chemistry Article
dx.doi.org/10.1021/ac4018082 | Anal. Chem. 2013, 85, 9617−96229619
respectively. The fluorescence signal was enhanced more than10 times. The inserted images in Figure 1b−d show theexpected droplet shrinkage during this process. The significantenhancement of fluorescence signals can be ascribed to twofactors. First, the decrease in droplet volume during shrinkageled to the concentration increase. Second, the fluorescencesignals were affected by the solvents. The fluorescence signalsof the FITC-labeled peptide in different solvents (acetonitrileconcentration from 0% to 80%) were measured and are shownin Figure SI-3 of Supporting Information. There are enhancedfluorescence signals for the lower acetonitrile concentration,and the signals were maximally enhanced 4−5 times when theacetonitrile concentration was decreased (from 50% to 0%).Overall, this may not be a good method for quantification. Onthe other hand, no obvious fluorescence signal was observed inthe DMC phase at any position of the microchannel, indicatingthat only the solvents diffused into the organic phase while thepeptides stayed in the droplets for enrichment. Given thatpeptides contain charges and polar groups, their partitioncoefficients in most organic phases are negligible. Thus, thesepeptide molecules cannot dissolve into the oil phase as thesolvent molecules exit the droplet.32 The above results showthat this method can effectively concentrate the analytes.ESI-MS has been developed as an attractive technique for the
analysis of segmented flows.36−40 In proteomics research,complex proteins are enzymatically digested, separated byRPLC, and identified by ESI-MS/MS, which is one of the mostimportant protocols for biomarker discovery. Although manypeptides at very low concentrations can be separated, withoutenrichment it is difficult to detect them successfully withsatisfactory signal-to-noise ratios. To evaluate the concentrationefficiency of this approach for ESI-MS analysis of low-concentration analytes, a peptide (CYIQNCPRG, MW1050.22, PI 8.06, Pep II) was used as a sample model. Theelectrospray voltage was optimized with a series of Pep IIsamples. At a voltage of 1.9 kV, the total ion current (TIC)graph (Figure SI-4 of Supporting Information) revealed ahigher signal of peptide while no interferential signal fromDMC was observed in this system. Thus, 1.9 kV was applied forthe following experiments. A 20 nM Pep II solution and DMCwith flow rates of 120 and 200 μL/h, respectively, werepumped into the microchannels to form droplets, where thepeptides were online concentrated and subsequently identifiedby ESI-MS at the end of the channel. Two well-resolved peaksof Pep II corresponding to the single charged (m/z 1051.55)and double charged (m/z 526.36) signals were clearly observed(Figure 2b) with a high intensity of 105, which was theoreticallyenough for the identification with ESI-MSn. For comparison,only a 20 nM Pep II solution was pumped into themicrochannel without enrichment for ESI-MS detection, andno obvious signal could be observed in the mass spectrum (asshown in Figure 2d). The significant improvement obtained inthe mass spectrometry may be induced by two factors. First, anenhancement of concentration results from the droplet volumedecrease. Second, the water−oil interface also plays animportant role in the signal enhancement. Previous reportshave investigated this issue. According to Chiu’s research,32 thesolute molecules accumulate along the W/O interface, whichcan hinder further water diffusion. In Kennedy’s work, theinterface phenomenon was also referenced.40 At present, a clearmechanism has not yet been reported to explain the interfaceeffect on the mass spectrometry. The results show that thisdroplet-based protocol has a high efficiency and good
compatibility for the enrichment and identification of peptidesat low concentrations with ESI-MSn.In general proteomics research, the maximum concentration
of acetonitrile was 80% for elution buffer.41 To test its universalfeasibility, the acetonitrile concentration of the sample solutionwas altered accordingly. Uniform droplets could be successfullyformed when the acetonitrile concentration ranged from 0% to80% (see Figure SI-5 of Supporting Information), respectively.No obvious changes were observed in the generation frequencyof droplets; however, the size of droplet decreased with a higheracetonitrile concentration, which can be attributed to twofactors. First, the fluidic dynamics varied with the changedacetonitrile concentrations. Second, with higher concentration,acetonitrile diffused into DMC more quickly and the partitionequilibrium state was achieved faster.Furthermore, the droplet-based approach was applied for
analyzing the peptide mixture to demonstrate its generalenrichment capability without cross-contamination and dis-crimination. Herein, BSA tryptic digests (20 fM) wereseparated by RPLC and the effluents were compartmentalizedto droplets with DMC. Then the separated peptides wereconcentrated when proceeding through the microchannel andanalyzed by ESI-MS/MS (shown in Figure 3 and Figures SI-6and SI-7 of Supporting Information). In Figure 3a,b, the graphshave a small difference in peak position and relative abundance.Although the droplet roughly retained the separation ability,42
the effluent flow through the microchip could lead to somepeak banding in the chromatogram. Moreover, the diverseenhancement factor of different peptides may induce relativesignal intensity variation. There are differences among thepeptides to accept the influence of the electrospray. Theabsolute signal intensity (5.85 × 10⁷) in Figure 3b was far abovethe intensity (5.59 × 10⁵) in Figure 3a. Although the relativeabundances of the peaks (from t = 11 min to t = 17 min)became low in Figure 3b, their absolute intensities were greatlyenhanced. For example, the signal intensity in Figure 3a at t =14.71 min was about 2.8 × 10⁵; however, the signal intensity inFigure 3b at t = 13.77 and 17.78 min was 2.52 × 10⁶ and 7.24 ×10⁶, respectively. After the online enrichment, a total of 22peptides were successfully identified corresponding to an aminoacid coverage of 38.2% (Table SI-1, Supporting Information).Nevertheless, only seven peptides were identified, and thecoverage was 10.2% without enrichment (Table SI-2,Supporting Information). When the sample concentrationwas down to 10 fM, six peptides were still identified after theonline enrichment (Table SI-3, Supporting Information).However, only one peptide could be observed withoutenrichment, leading to a failed identification (Table SI-4,Supporting Information). All compared results without enrich-ment were obtained by sequential HPLC separation, effluentflowing through the microfluidic channel, and ESI-MSn
detection. Figure SI-8 (Supporting Information) showed theblank sample (no sample; just the HPLC mobile phase wascompartmentalized into droplets with DMC and analyzed byESI-MS/MS), and there was little interference with the samplesignals. These results indicate that such a microfluidic droplet-based device can be a general protocol for efficient enrichmentof peptide mixtures in low abundance.
■ CONCLUSIONIn summary, a facile online enrichment protocol has beenproposed based on microfluidic droplets acting as an interfacebetween the separation system (such as HPLC) and the
Analytical Chemistry Article
dx.doi.org/10.1021/ac4018082 | Anal. Chem. 2013, 85, 9617−96229620

detection system (such as a spectrograph or ESI-MSn). Low-abundance species such as peptides were successfullyconcentrated and analyzed in this system via droplet shrinkage.This established method is suitable for most biologicalmolecules, such as ions, amino acids, DNA, proteins, ormetabolites. This is the first proof-of-concept experiment ondroplet-based online concentration. The proposed platformsignificantly increased the enrichment efficiency and detectionsensitivity with reduced sample handling steps, short analysistime, and no cross-contamination. The presented system is
universal, shows no discrimination, and is easily coupled withother separation and detection approaches. This protocol couldopen a new window for the enrichment of low-abundancemolecules in a large scale and further application in the field ofbiomarker discovery.
■ ASSOCIATED CONTENT
*S Supporting InformationAdditional information as noted in text. This material isavailable free of charge via the Internet at http://pubs.acs.org.
■ AUTHOR INFORMATION
Corresponding Authors*E-mail: [email protected]. Fax: (+86) 21-6564-1740.*E-mail: [email protected].
Author ContributionsThe manuscript was written through contributions of allauthors. All authors have given approval to the final version ofthe manuscript. J. Ji and L. Nie contributed equally to this work.
NotesThe authors declare no competing financial interest.
■ ACKNOWLEDGMENTS
This work was supported by NSFC (20925517, 21175028,21105014, 21375022), 863 (2012AA020202) andMARC2012D002.
■ REFERENCES(1) Kahn, P. Science 1995, 270, 369−370.(2) Abbott, A. Nature 2001, 409, 747−748.(3) Manne, U.; Srivastava, R. G.; Srivastava, S. Drug Discovery Today2005, 10, 965−976.(4) Hanash, S. M.; Baik, C. S.; Kallioniemi, O. Nat. Rev. Clin. Oncol.2011, 8, 142−150.(5) Munge, B. S.; Coffey, A. L.; Doucette, J. M.; Somba, B. K.;Malhotra, R.; Patel, V.; Gutkind, J. S.; Rusling, J. F. Angew. Chem., Int.Ed. 2011, 50, 7915−7918.(6) Rochat, B.; Bolay, S.; Pascual, A.; Calandra, T.; Marchetti, O. J.Mass Spectrom. 2007, 42, 440−449.(7) Pettersson, S. W.; Persson, B. S.; Nystrom, M. J. Chromatogr., B2004, 803, 159−165.(8) Hart, S. R.; Waterfield, M. D.; Burlingame, A. L.; Cramer, R. J.Am. Soc. Mass Spectrom. 2002, 13, 1042−1051.(9) Ye, H. Z.; Xia, S. F.; Lin, W.; Yu, L. S.; Xu, X. Q.; Zheng, C. S.;Liu, X. X.; Chen, G. N. Electrophoresis 2010, 31, 3400−3406.(10) Georgiou, H. M.; Rice, G. E.; Baker, M. S. Proteomics 2001, 1,1503−1506.(11) Aebersold, R.; Mann, M. Nature 2003, 422, 198−207.(12) Liu, T.; Belov, M. E.; Jaitly, N.; Qian, W. J.; Smith, R. D. Chem.Rev. 2007, 107, 3621−3653.(13) Lu, Z. D.; He, L.; Yin, Y. D. Chem. Commun. 2010, 46, 6174−6176.(14) Fields, S. Science 2001, 291, 1221−1224.(15) Polaskova, V.; Kapur, A.; Khan, A.; Molloy, M. P.; Baker, M. S.Electrophoresis 2010, 31, 471−482.(16) Janasek, D.; Franzke, J.; Manz, A. Nature 2006, 442, 374−380.(17) Whitesides, G. M. Nature 2006, 442, 368−373.(18) Inglis, D. W.; Goldys, E. M.; Calander, N. P. Angew. Chem., Int.Ed. 2011, 50, 7546−7550.(19) Foote, R. S.; Khandurina, J.; Jacobson, S. C.; Ramsey, J. M. Anal.Chem. 2005, 77, 57−63.(20) Dhopeshwarkar, R.; Suna, L.; Crooks, R. M. Lab Chip 2005, 5,1148−1154.
Figure 3. (a) The base peak chromatography of HPLC-separated BSAdigests (20 fM) identified with ESI-MS/MS directly. (b) The basepeak chromatography of HPLC-separated BSA digests (20 fM)compartmentalized with DMC for concentration and identified withESI-MS/MS. (c) The mass spectrum of peptides from a fraction ofBSA digests eluted at RT = 21.50 min. The insert is the MS/MSspectrum of a parent peak at m/z 653.0 with a sequence ofHLVDEPQNLIK.
Analytical Chemistry Article
dx.doi.org/10.1021/ac4018082 | Anal. Chem. 2013, 85, 9617−96229621

(21) Chen, D. L.; Du, W. B.; Liu, Y.; Liu, W. S.; Kuznetsov, A.;Mendez, F. E.; Philopson, L. H.; Ismagilov, R. F. Proc. Natl. Acad. Sci.U.S.A. 2008, 105, 16843.(22) Fidalgo, L. M.; Whyte, G.; Ruotolo, B. T.; Benesch, J. L. P.;Stengel, F.; Abell, C.; Robinson, C. V.; Huck, W. T. S. Angew. Chem.,Int. Ed. 2009, 48, 3665−3668.(23) Niu, X. Z.; Zhang, B.; Marszalek, R. T.; Ces, O.; Edel, J. B.;Klug, D. R.; Demello, A. J. Chem. Commun. 2009, 6159−6161.(24) Link, D. R.; Grasland-Mongrain, E.; Duri, A.; Sarrazin, F.;Cheng, Z. D.; Cristobal, G.; Marquez, M.; Weitz, D. A. Angew. Chem.,Int. Ed. 2006, 45, 2556−2560.(25) Ji, J.; Nie, L.; Qiao, L.; Li, Y. X.; Guo, L. P.; Liu, B. H.; Yang, P.Y.; Girault, H. H. Lab Chip 2012, 2625−2629.(26) Shen, A. Q.; Wang, D.; Spicer, P. T. Langmuir 2007, 23, 12821−12826.(27) Manoharan, V. N.; Elsesser, M. T.; Pine, D. J. Science 2003, 301,483−487.(28) Wu, T. Z.; Hirata, K.; Suzuki, H.; Xiang, R.; Tang, Z. K.; Yomo,T. Appl. Phys. Lett. 2012, 101, 074108.(29) Wang, B. G.; Shum, H. C.; Weitz, D. A. ChemPhysChem 2009,10, 641−645.(30) Zhang, B.; Roach, L. S.; Ismagilov, R. F. J. Am. Chem. Soc. 2003,125, 11170−11171.(31) Shim, J.; Cristobal, G.; Link, D. R.; Thorsen, T.; Jia, Y.; Piattelli,K.; Fraden, S. J. Am. Chem. Soc. 2007, 129, 8825−8835.(32) He, M. Y.; Sun, C. H.; Chiu, D. T. Anal. Chem. 2004, 76, 1222−1227.(33) Duffy, D. C.; McDonald, J. C.; Schueller, O. J. A.; Whitesides, G.M. Anal. Chem. 1998, 70, 4974−4984.(34) Fidalgo, L. M.; Abell, C.; Huck, W. T. Lab Chip 2007, 7, 984−986.(35) Keller, A.; Nesvizhskii, A. I.; Kolker, E.; Aebersold, R. Anal.Chem. 2002, 74, 5383−5392.(36) Domon, B.; Aebersold, R. Science 2006, 312, 212−217.(37) Mitchell, P. Nat. Biotechnol. 2001, 19, 717−721.(38) Chatterjee, D.; Ytterberg, A. J.; Son, S. U.; Loo, J. A.; Garrell, R.L. Anal. Chem. 2010, 82, 2095−2101.(39) Zhu, Y.; Fang, Q. Anal. Chem. 2010, 82, 8361−8366.(40) Li, Q.; Pei, J.; Song, P.; Kennedy, R. T. Anal. Chem. 2010, 82,5260−5267.(41) Wang, H.; Tang, H.; Tan, G. C.; Speicher, D. W. J. Proteome Res.2011, 10, 4993−5005.(42) Nie, L.; Xu, G. B.; Ji, J.; Liu, Q. P.; Fan, H. Z.; Liu, B. H.; Yang,P. Y. Anal. Methods 2013, 5, 3371−3378.
Analytical Chemistry Article
dx.doi.org/10.1021/ac4018082 | Anal. Chem. 2013, 85, 9617−96229622


![Identification of Genes Involved in the Response of ...Identification of Genes Involved in the Response of Arabidopsis to Simultaneous Biotic and Abiotic Stresses1[C][W][OPEN] Nicky](https://static.fdocuments.in/doc/165x107/5f76526eb8bd7b51d716b4a8/identiication-of-genes-involved-in-the-response-of-identiication-of-genes.jpg)