Simultaneous calorimetric and respirometric...
36
EUROPEAN COMMISSION JOINT RESEARCH CENTRE Institute for Environment and Sustainability Inland and Marine Waters Unit I-21020 Ispra (VA) Italy Project TOWEF0 Simultaneous calorimetric and respirometric measurements for textile wastewater characterisation Emilio Daverio and Jos Ligthart 2003 EUR 20557 EN
Transcript of Simultaneous calorimetric and respirometric...

EUROPEAN COMMISSION JOINT RESEARCH CENTRE
Institute for Environment and Sustainability
Inland and Marine Waters Unit I-21020 Ispra (VA) Italy
Project TOWEF0
Simultaneous calorimetric and respirometric measurements for textile
wastewater characterisation
Emilio Daverio and Jos Ligthart
2003 EUR 20557 EN

0
LEGAL NOTICE
Neither the European Commission nor any person
acting on behalf of the Commission is responsible for the use which might be made of the following information.
A great deal of additional information on the European Union is available on the Internet. It can be accessed through the Europa server
(http://europa.eu.int)
EUR 20557 EN © European Communities, 2003
Reproduction is authorised provided the source is acknowledged Printed in Italy

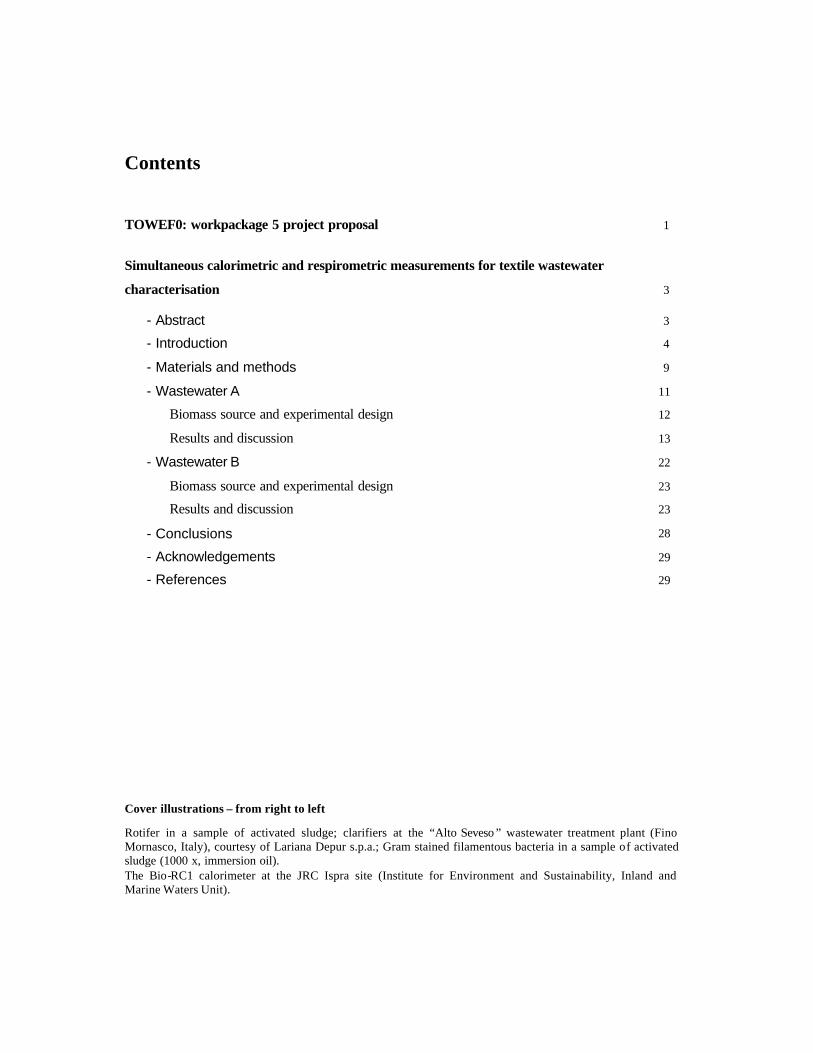
Contents TOWEF0: workpackage 5 project proposal 1
Simultaneous calorimetric and respirometric measurements for textile wastewater
characterisation 3
- Abstract 3
- Introduction 4
- Materials and methods 9
- Wastewater A 11
Biomass source and experimental design 12
Results and discussion 13
- Wastewater B 22
Biomass source and experimental design 23
Results and discussion 23
- Conclusions 28
- Acknowledgements 29
- References 29
Cover illustrations – from right to left
Rotifer in a sample of activated sludge; clarifiers at the “Alto Seveso ” wastewater treatment plant (Fino Mornasco, Italy), courtesy of Lariana Depur s.p.a.; Gram stained filamentous bacteria in a sample of activated sludge (1000 x, immersion oil). The Bio-RC1 calorimeter at the JRC Ispra site (Institute for Environment and Sustainability, Inland and Marine Waters Unit).

1
TOWEF0 (Towards Effluent Zero)
Evaluation of the effect of the IPPC application on the
sustainable wastewater management in textile industries
Contract No: EVK1-CT-2000-00063
Deliverable: report on the application of simultaneous calorimetry and respirometry in
investigating biodegradability and treatability of textile effluents in aerobic activated sludge
processes.
Objective: application of calorimetry in investigating and better understanding
biodegradability and treatability of textile effluents in aerobic activated sludge processes.
Comparison between calorimetry and established respirometric techniques for wastewater
characterisation.
Summary of workpackage 5 project proposal: a strategy will be developed to support the
decision for the best (pre) treatment scenario out of a given set of available scenarios. The
aim will be to meet effluent standards and to obtain optimum recovery of specific
compounds and re-use of process water in order to realise sustainable waste management.
Existing wastewater characterisation techniques will be improved and adapted to the
measurement of textile process wastewater streams. The techniques will enable the on-line
measurement of key variables for the biological and physico/chemical treatment of the
wastewater such as toxicity, nutrient deficiency and degradability. The techniques will be
based in the first instance on respirometry, i.e. the measurement of the oxygen uptake rate of
biomass in contact with wastewater under well defined measuring conditions. A comparison
with micro-calorimetry will also be undertaken. From the comparison of thermograms
evaluated in both the absence and the presence of particular compounds, it will be possible
to reach a better comprehension of the effect of toxicity, nutrient deficiency and
degradability on the metabolic activities of microorganisms (activated sludge). Moreover, in

2
WP5 a protocol will be developed to determine the optimal composition of the wastewater
produced in the factories in terms of treatment performance. To fully develop the “waste
design” concept for finishing textile industries, a network of “on-line” sensors will be
designed, in order to allow a real time monitoring and control of wastewater characteristics.
The task of the “on-line” sensor is to inform waste producers, treatment plant and industrial
operators when and how to discharge into the sewer or a specific pre-treatment or,
alternatively, continue to re-use water in production process. The protocol will be based on
the on-line information and should also include the means of feeding back the information
on the optimal composition to the production units. In collaboration with WP4 the Water
Pinch technology approach will be integrated with the characterisation and design of
wastewater as far as treatability is concern. Treatability will be used as an index for
understanding how many recycling loops wastewaters can undergo before being discharged
from the process and disposed of at satisfying grade of treatability.

3
Simultaneous calorimetric and respirometric measurements
for textile wastewater characterisation
E. Daverio and J. Ligthart
European Commission, JRC, IES, Inland and Marine Waters Unit, TP 300, 21020 Ispra, Varese.
Tel.: +39-0332-786193; fax: +39-0332-785212, E-mail address: [email protected]
Abstract
Isothermal direct calorimetry has been applied to investigate aerobic biodegradability of mixed
final effluents from two textile factories. For this purpose, a bench scale calorimeter (Bio-RC1),
especially modified for biological studies and equipped with a dissolved oxygen (DO) probe,
has been used. Through pulses of selected substrates (textile wastewaters, acetate or
ammonia), aerobic metabolic activity has been assessed for heterotrophic and autotrophic
nitrifying bacterial populations in sludge samples from wastewater treatment plants treating
domestic and/or textile effluents. Calorimetric data (thermograms) have been compared to DO
measurements simultaneously carried out (respirometry), so that wastewater stream
degradation has been characterised in terms of microbial heat dissipation and short term
biological oxygen demand. A satisfactory agreement was observed between OUR (Oxygen
Uptake Rate) profiles and power-time curves confirming that, under strictly aerobic conditions,
calorimetry and respirometry provide the same information. Oxycaloric equivalent, defined as
the amount of heat released by the culture per mole of oxygen consumed, was estimated when
textile wastewaters were the sole exogenous substrate. The values obtained are close to the
theoretical value for heterotrophic aerobic metabolism (460 kJ mol O2- 1) and to literature data.
Additionally, toxicity effect on microbial communities due to raw wastewater additions has been
investigated.
Keywords: calorimetry; oxycaloric equivalent; respirometry; textile wastewater; toxicity
4
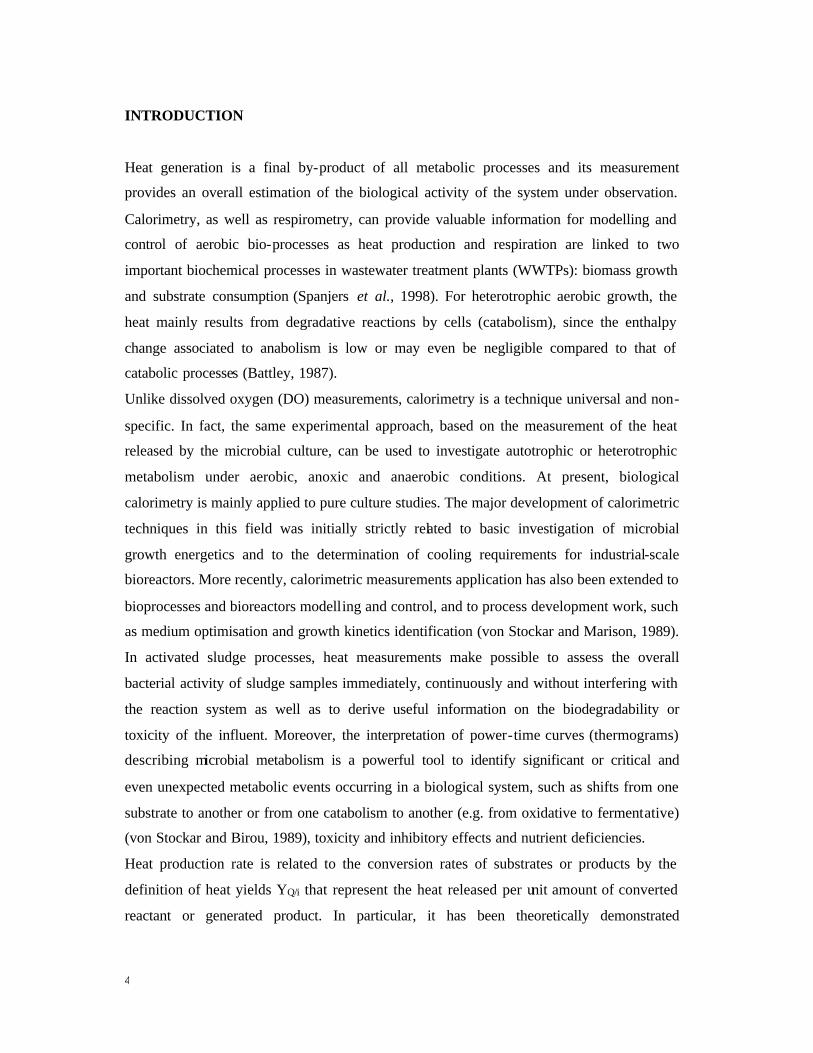
INTRODUCTION
Heat generation is a final by-product of all metabolic processes and its measurement
provides an overall estimation of the biological activity of the system under observation.
Calorimetry, as well as respirometry, can provide valuable information for modelling and
control of aerobic bio-processes as heat production and respiration are linked to two
important biochemical processes in wastewater treatment plants (WWTPs): biomass growth
and substrate consumption (Spanjers et al., 1998). For heterotrophic aerobic growth, the
heat mainly results from degradative reactions by cells (catabolism), since the enthalpy
change associated to anabolism is low or may even be negligible compared to that of
catabolic processes (Battley, 1987).
Unlike dissolved oxygen (DO) measurements, calorimetry is a technique universal and non-
specific. In fact, the same experimental approach, based on the measurement of the heat
released by the microbial culture, can be used to investigate autotrophic or heterotrophic
metabolism under aerobic, anoxic and anaerobic conditions. At present, biological
calorimetry is mainly applied to pure culture studies. The major development of calorimetric
techniques in this field was initially strictly related to basic investigation of microbial
growth energetics and to the determination of cooling requirements for industrial-scale
bioreactors. More recently, calorimetric measurements application has also been extended to
bioprocesses and bioreactors modelling and control, and to process development work, such
as medium optimisation and growth kinetics identification (von Stockar and Marison, 1989).
In activated sludge processes, heat measurements make possible to assess the overall
bacterial activity of sludge samples immediately, continuously and without interfering with
the reaction system as well as to derive useful information on the biodegradability or
toxicity of the influent. Moreover, the interpretation of power-time curves (thermograms)
describing microbial metabolism is a powerful tool to identify significant or critical and
even unexpected metabolic events occurring in a biological system, such as shifts from one
substrate to another or from one catabolism to another (e.g. from oxidative to fermentative)
(von Stockar and Birou, 1989), toxicity and inhibitory effects and nutrient deficiencies.
Heat production rate is related to the conversion rates of substrates or products by the
definition of heat yields YQ/i that represent the heat released per unit amount of converted
reactant or generated product. In particular, it has been theoretically demonstrated

5
(Minkevich and Eroshin, 1973; Birou et al., 1987) that the heat dissipated per mole of
oxygen consumed (oxycaloric equivalent, YQ/O) under strictly aerobic conditions, is
approximately the same (460 kJ mol O2-1) for all heterotrophic growth processes regardless
of microbial strain and nature of substrates or products. Constancy of this quantity is based
on the regularity for the heat of combustion of organic substrates (Thornton, 1917;
Kharasch, 1929) and dried biomass per 1 gram equivalent of oxygen consumed (Minkevich
and Eroshin, 1973).
The linear correlation between heat production rate and OUR (Oxygen Uptake Rate) has
been experimentally verified mainly on pure cell cultures. Several works are reported in
literature concerning the evaluation of oxycaloric equivalent for mammalian cells, muscle
tissues, brown adipose tissues, aquatic animals and, especially, for bacteria and yeasts.
In their pioneering investigation, Cooney et al. (1968) observed, for the oxycaloric
equivalent, an average experimental value of 518 ± 12 kJ mol O2-1. Experiments were
performed using bacteria (E. coli and B. subtilis), a yeast (C. intermedia) and a mould (A.
niger) aerobically grown on glucose, molasses and soy bean meal. A dynamic calorimetric
technique was used to evaluate the heat production rate during fermentation by recording
the temperature rise of fermentor broth in a 14-liter insulated vessel when temperature
controller was turned off. The heat accumulation measured in this manner was corrected for
heat losses and gains terms (evaporation, agitation and heat losses to the surroundings) and
was compared to oxygen consumption rate determined by measuring the gas flow rate and
the oxygen concentration in the exit gas stream. Loung and Volesky (1980), using a similar
approach, determined the rate of heat evolution and the rate of oxygen consumption for pure
cultures of A. niger, E. coli, C. lipolytica , C. intermedia and C. utilis grown on ethanol,
glucose, sucrose, n-dodecane and n-hexadecane. Based on the experimental data, the
correlation between heat dissipation and oxygen consumption was determined as 461 ± 84
kJ mol O2-1, whereas data ranged from 384 to 600 kJ mol O2
-1. Erickson et al. (1978)
investigated the lysine synthesis process by cultures of Brevibacterium grown on molasses
and corn extract. YQ/O (mean value for three experiments) was estimated to be 26.5 kcal
equiv O2-1 (444 kJ mol O2
-1). Birou et al. (1987), working with a modified BSC 81
isothermal heat flux calorimeter and with different strains of bacteria (E. coli, Ent. cloacae
and M. methylotrophus) and yeasts (C. boidinii, C. lipolytica, C. pseudotropicalis, C. utilis
and K. fragilis) and various substrates with reduction degree from 3 (citric acid) to 6.13

6
(hexadecane), found an average value, for 12 determinations, of 440 ± 33 kJ mol O2-1.
Randolph et al. (1990) working with pure cultures of S. cerevisiae CBS 426, cultivated with
glucose as the sole carbon source in a Mettler -Toledo RC1 calorimeter modified for
investigating biological processes, observed an oxycaloric equivalent of 461 kJ mol O2-1.
The possibility of continuously measuring the heat generated by microorganisms in a
standard laboratory fermentor, by means of an accurate energy balance around the system,
was studied by van Kleeff et al. (1993). Oxygen consumption measurements were coupled
to heat production rate data during growth of C. utilis on glucose. In this case, YQ/O was
estimated to be 457 ± 12 kJ mol O2-1. In the nineties, Johansson and Wadsö (1999), using an
isothermal microcalorimetric perfusion vessel equipped with a Clark cell O2 electrode,
investigated the aerobic growth of E. coli. The mean value (4 experiments) obtained for
oxycaloric equivalent was 442 ± 15 kJ mol O2-1. Recently, Dejean et al. (2001) studied, with
a TAM flow -through microcalorimeter, heat dissipation and oxygen consumption of resting
and growing (lactate) cultures of S. cerevisiae W303-1a. Oxycaloric equivalents were found
to be 439 ± 10 kJ mol O2-1 and 378 ± 7 kJ mol O2
-1 respectively.
The relationship between oxygen consumption and heat production is poorly documented
for activated sludge systems. In fact, very few papers exist dealing with simultaneous
calorimetric and respirometric measurements applied to investigate wastewater treatment
biological processes. Beaubien and Jolicoeur (1985), operating with a twin cell Picker flow
microcalorimeter (SODEV Inc.), assessed biomass activity in sludge samples from a lab-
scale bioreactor fed on a synthetic medium containing beef extract, bacto peptone and soy
broth. During comparative respirometry-calorimetry studies, the oxycaloric equivalent was
determined to be 345 kJ mol O2-1. Aulenta et al. (2002) report for YQ/O a value of 470 kJ
mol O2-1, measured for activated sludge samples fed on acetate in a Mettler Toledo Bio-RC1
calorimeter. To authors knowledge, no explicit values for oxycaloric equivalent are reported
in literature for experiments related to raw wastewater degradation by biomass from
activated sludge WWTPs.
The direct relationship between OUR and heat flux suggests that, for purely aerobic
metabolism, calorimetric measurements may substitute oxygen measurements (indirect
calorimetry) or vice versa (Gustafsson, 1991). Moreover, coupling of calorimetric and
respirometric measurements may be an interesting tool in biotechnological studies and
applications. In fact, complementary information can be extracted from the combination of

7
these two techniques in the presence of mixed respiratory-fermentative metabolisms,
enhanced futile substrate cycling and uncoupling of oxidative phosphorylation (Gnaiger and
Kemp, 1990; Kemp, 2000). In these cases, the oxycaloric equivalent experimentally
estimated is higher than the theoretical value. Volesky et al. (1982) observed an oxycaloric
equivalent as high as 1710 kJ mol O2-1 for growth of S. cerevisiae, when respiration was
partially repressed by a glucose effect and ethanol was formed via the fermentative
pathway. For human cells, under strictly controlled aerobic conditions, there have been
reports of YQ/O as highly exothermic as that presented by Schön and Wadsö (1986) for T-
lymphoma cells (1100 kJ mol O2-1) or by Eftimiadi and Rialdi (1982) for neutrophils (590
kJ mol O2-1). Considerably exothermic YQ/O values indicate the intensity of anaerobic
pathways operating simultaneously with aerobic reactions. Reasons for accumulation and
excretion of anaerobic glycolytic endproducts such as lactate, pyruvate and succinate by
cells under normoxic conditions can be related to the need for biosynthetic precursors from
catabolic substrates in deficient media or to an ATP demand that exceeds mitochondrial
capacity, resulting in the reduction of pyruvate with conservation of NAD+ (Kemp, 2000).
The same approach used for heterotrophic growth can be, in principle, applied also to
autotrophic aerobic metabolism. In particular, the linear relationship between OUR and heat
production rate has been verified on nitrifying biomass from a full-scale activated sludge
plant (Daverio et al., 2003). Oxycaloric equivalent was estimated to be 151 ± 4 kJ mol O2-1
for nitrite oxidisers and 189 ± 13 kJ mol O2-1 for ammonia oxidisers. The finding that YQ/O
for nitrifiers is lower than for heterotrophs is an expected result since the energy sources for
the two bacterial populations are different. In fact, the stoichiometric oxidation of ammonia
to nitrate theoretically dissipates a significantly lower amount of heat (180 kJ) per mole of
oxygen consumed than the combustion of organic compounds (mean value of 444 kJ mol
O2-1 as reported by Thornton (1917)). Indeed, the linear correlation between heat flux and
OUR for heterotrophic and nitrifying populations, with YQ/O for heterotrophs approximately
2.5 times higher than for nitrifiers, suggests that the evaluation of YQ/O variations during
aerobic biodegradation of wastewater containing both organic matter and ammonia can be a
powerful tool to identify and discriminate the biological activity of the two trophic groups.
In Figure 1 (Daverio, 2002), the thermogram and the respirogram acquired after a synthetic
wastewater pulse (mixture of biogenic carbonaceous compounds and ammonia) to an
activated sludge in endogenous conditions are presented. Immediately after the spike, a

8
sudden increase in both heat production rate and OUR was detected and three regions
characterised by different YQ/O (Figure 2) can be identified. In zone A ammonia and
carbonaceous substrates are simultaneously consumed. After the exhaustion of readily
biodegradable organic matter (RBCOD), ammonia oxidation becomes the prevailing oxygen
consuming bioreaction (B). A clear decoupling between heat flux and OUR was observed
and YQ/O approached the value related to autotrophic nitrification. Region C refers to the
consumption of storage polymers accumulated during RBCOD conversion and YQ/O is close
to the theoretical value for purely heterotrophic metabolism.
-28.5
0.0
28.5
57.0
85.5
114.0
142.5
171.0
0 1 2 3 4 5 6Time (h)
qex
(mW
l-1)
-10
0
10
20
30
40
50
60
OU
Rex
(m
g l-1
h-1
)
54 mg COD l-1 + 5.4 mg N-NH4 l- 1
A
B
C
Figure 1. Thermogram and respirogram
recorded after synthetic wastewater pulse to an
activated sludge; - qex; - OURex.
YQ/O = 238 kJ molO2-1
R2 = 0.999
YQ/O = 325 kJ mol O2-1
R2 = 0.998
YQ/O = 466 kJ molO 2-1
R2 = 0.984
0
100
200
300
400
500
600
0 0.5 1 1.5 2Oxygen demand (mmol O2)
Hea
t di
ssip
atio
n (J
)
A
B
C
Figure 2. Oxycaloric equivalents estimated from
data in Figure 1.
An isothermal bench-scale calorimeter (Bio-RC1), especially suited for biological studies
and equipped with a DO probe, has been used to investigate aerobic biodegradability of
mixed final effluents from two textile factories (named “wastewater A” and “wastewater B”
respectively). Sludge samples from WWTPs treating domestic and/or textile effluents have
been considered and, for each sample, bacterial activity of heterotrophic aerobic and
autotrophic nitrifying populations has been assessed. Calorimetric profiles (thermograms)
have been compared to OUR measurements simultaneously carried out (respirometry) so
that it has been possible to estimate the oxycaloric equivalent when textile wastewater was
the sole exogenous energy source and to evaluate effluent biodegradability. Experimental
results obtained working on wastewater A and wastewater B are presented and discussed
separately. In particular, the toxicity effect of wastewater A has been evaluated on aerobic
bacterial communities and a comparison between biomass activity from a full-scale
activated sludge WWTP and a membrane bioreactor (MBR) pilot plant fed exclusively on
wastewater B is presented.

9
MATERIALS AND METHODS The calorimeter Due to the fairly low heat exchanges accompanying biological phenomena compared to
chemical reactions, very sensitive calorimetric devices are required to correctly evaluate
heat generation by bacterial cultures. The Bio-RC1 (Figure 3), developed by Mettler-Toledo
AG, Schwerzenbach, Switzerland for investigating chemical reactions and subsequently
adapted for biological studies, is a heat flux bench-scale calorimeter (Marison et al., 1998).
Stirrer motor
Pump impellers ofthe heated circulation
Calibration heater
Inlet for oil addition
Connection forelectrical heating
Expansion tank (oil)
Tjs sensor
Tj sensor
Tc sensor
Bottom valve ofthe glass reactor
Pump impellers incooling oil container
Cooling oilcontainer
Tr sensor
Oil drain cock
Cryostatconnection (in)
Cryostatconnection (out)
Coolantconnection
Control valve
Pump motor
Floatswitches
Displacement body
Safety valve
Figure 3. Schematic overview of the Bio-RC1 (adapted from Mettler Toledo RC1e Operating
Instructions).
The Bio-RC1 possesses a standard 2-liter jacketed glass reactor and can be operated in
isothermal, isoperibolic (constant jacket temperature) or adiabatic conditions. In the
isothermal mode, in order to maintain constant the temperature of the reactant medium (Tr)
by a proper control of the jacket temperature (Tj), a low-viscosity silicone oil is pumped at
high rate (2 l s-1) through the reactor jacket. The jacket temperature is carefully controlled
by blending oils from a ‘hot’ and a ‘cold’ oil circuit, via an electronically controlled
metering valve. Therefore, when a process dissipates or takes up heat, Tj respectively

10
decreases or increases. The resulting temperature gradient across the reactor wall is directly
proportional to the thermal power liberated or absorbed by the process (Qr) according to:
Qr = UA·(Tr-Tj) (1)
where U is the overall heat-transfer coefficient (W m-2 K -1), A the heat transfer surface (m2)
and (Tr-Tj) the temperature difference (K) between the reactor contents and the jacket oil.
When a new sludge sample is put into the calorimeter, the UA factor has to be
experimentally determined using an internal electrical calibration heater of known power
output.
For biological studies, the calorimetric resolution has been improved by decreasing the full
range of temperature, thermostatting the temperature signals, increasing the Analog/Digital
board resolution and by implementing a PI (proportional-integral) controller for the reactor
temperature, instead of the P (proportional) controller of the standard RC1. Some additional
upgrades were necessary in order to increase the stability and the sensitivity of the system.
In particular, a thermostatted top-plate to reduce evaporation effects, and a bubble column
for pre-saturating and thermostatting the inlet gas stream were added. Therefore, by
changing both the hardware and the software of the original instrument, the system
resolution has been increased to 5-10 mW l-1 (Figure 4b) and the stability of the reaction
volume temperature to ± 1 mK for several hours (Figure 4a).
-1.0
-0.5
0.0
0.5
1.0
0 3 6 9 12
Time (h)
Tr
- Tr a
vg (
mK
)
Figure 4a. Stability of the reaction volume
temperature during isothermal operation.
-30
-20
-10
0
10
20
30
0 3 6 9 12
Time (h)
qr (m
W l-1
)
Figure 4b. Heat flux baseline measurement;
- qr, - qr 25 per. moving average.
The Bio-RC1 does not require to compute any energy balance for the system, so that the
quality of heat measurements does not depend on the accuracy of secondary heat effects
11
estimation. In fact, heat production rate due to biological exogenous reactions (Qex) is
simply equal to the measured heat flux (Qr) corrected for the baseline contribution, assumed
to be constant throughout the test, which is the sum of two terms: the external heat loss and
gain terms (e.g. due to stirring, evaporation and condensation effects, heat losses to the
environment) and the thermal power dissipation related to microbial endogenous
metabolism.
DO concentration and pH are on-line acquired through specific probes directly inserted into
the reaction volume and processed by LabVIEW (National Instruments) together with
temperature and heat production rate signals.
Biological OUR was calculated taking into account the oxygen mass transfer coefficient
(KLa), determined before each substrate pulse and considered constant during the test (Roš et
al., 1988).
Analytical methods
COD and ammonia analyses were carried out by means of a spectrophotometric test
(Spectroquant, Merck). Total (TSS) and volatile (VSS) suspended solids were determined
according to Standa rd Methods (1995).
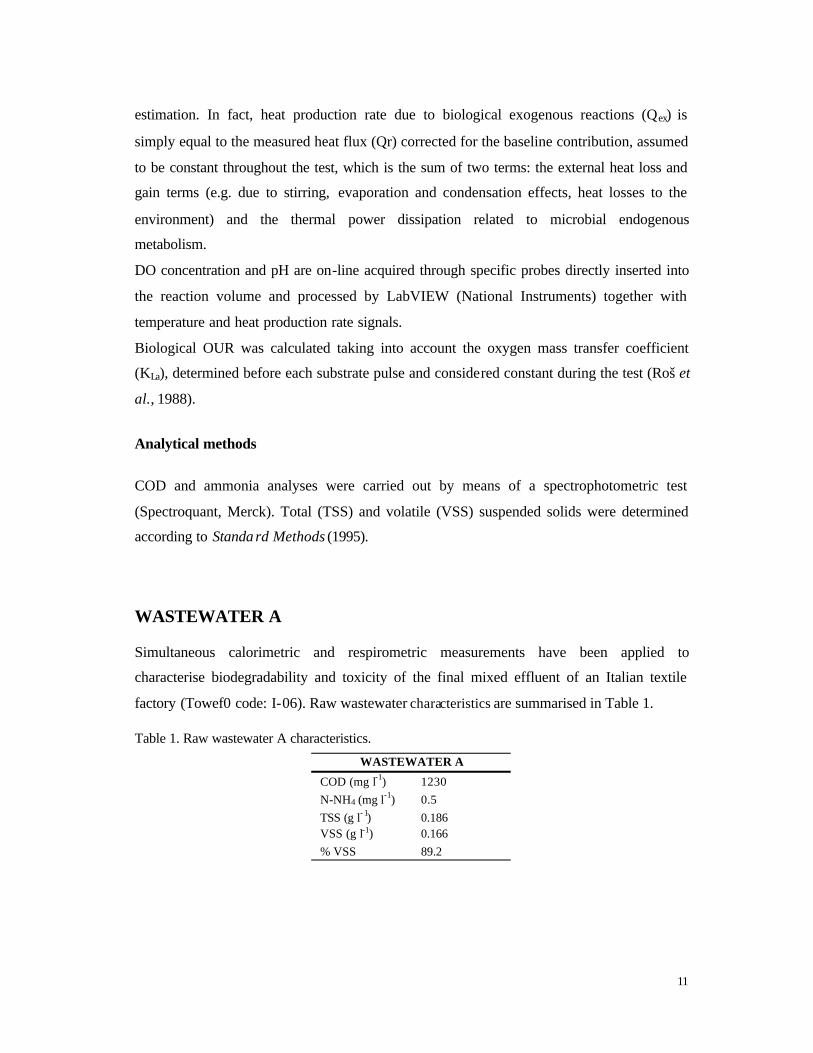
WASTEWATER A Simultaneous calorimetric and respirometric measurements have been applied to
characterise biodegradability and toxicity of the final mixed effluent of an Italian textile
factory (Towef0 code: I-06). Raw wastewater characteristics are summarised in Table 1.
Table 1. Raw wastewater A characteristics.
WASTEWATER A
COD (mg l-1) 1230 N-NH4 (mg l-1) 0.5 TSS (g l- 1) 0.186 VSS (g l-1) 0.166 % VSS 89.2

12
BIOMASS SOURCE AND EXPERIMENTAL DESIGN
Experiments with raw wastewater A have been performed using four different biomass
samples. The first sludge sample was collected at the “Alto Seveso” WWTP (Fino
Mornasco, Italy), that treats 30 % domestic wastewater and 70 % textile industry wastewater
and receives the final effluent of the I-06 factory. 1.4 l of sludge (VSS = 1.81 g l-1, TSS =
2.47 g l-1) were placed into the calorimeter. Temperature was set to 25 °C and agitation to
150 rpm, aeration was ensured by bubbling air. Before the addition, wastewater samples
were accurate ly thermostatted (25 °C) and intensively aerated. Calibration procedure for
overall heat transfer factor determination was performed at the beginning and at the end of
each experiment. During data processing, UA changes (about 5 % rise) due to volume
increase after wastewater addition were taken into account. The total heat dissipation for
each calorimetric peak was simply evaluated as the area under the thermogram.
In order to evaluate biomass adaptation to wastewater consumption and the toxicity effect of
the effluent, two heterotrophic aerobic bacterial cultures were set up in 2-liter lab-scale
bioreactors. The inoculum was sampled at the “Varese lago” WWTP (Gavirate, Italy).
Working volume was 1.5 l. pH and temperature were fixed at 7.5 and 25 °C respectively.
The reactors were operated using intermittent feeding. The first culture was fed with acetate
as the sole carbon and energy source. 150 ml feed were added 1 time per day so that the
organic loading rate was 0.390 g COD l-1 d-1. Feed solution contained per litre: 5.56 g
CH3COONa, 2 g (NH4)2SO4, 0.1 g MgSO4·7H2O, 0.055 g CaCl2·2H2O, 0.44 g K2HPO4,
0.34 g KH2PO4, 0.002 g FeCl3·6H2O, 0.003 g Na2EDTA, 1 ml trace element solution. Trace
element solution contained per litre: 100 mg ZnSO4·7H2O, 30 mg MnCl2·7H2O, 300 mg
H3BO3, 200 mg CoCl2·6H2O, 10 mg CuCl2·2H 2O, 20 mg NiCl2·6H 2O, 30 mg
NaMoO4·2H 2O. The effluent was taken up each day at the end of the cycle from the stirred
and aerated mixed-liquor. Thus, sludge age was correspondent to HRT (Hydraulic Retention
Time) and was 11 days. The same operational parameters were used for the second culture
but 350 ml l-1 wastewater A were added to feed solution.
For calorimetric tests, the mixed liquor (0.7 l) was sampled from the reactor just before a
new feed addition. Sludge was diluted with a solution containing non-limiting N and P
concentrations (same ratio used for culture medium) until a volume of 1.4 l was reached and

13
was put into the calorimeter. Nitrification was inhibited by adding allyl-thiourea (10 mg l-1).
VSS concentration was 0.43 g l-1 (TSS = 0.48 g l-1) for the experiments with biomass
cultivated on acetate and 0.29 g l-1 (TSS = 0.32 g l-1) in the case of biomass cultivated on
acetate and wastewater. Additionally, in order to evaluate wastewater A toxicity effect on
nitrifying population, a sludge sample from the “Varese lago” WWTP, that includes
nitrification, was used as inoculum for an enriched nitrifying culture. Total volume was 8 l
and feed was added four times per day. Volumetric loads were: 100 mg N-NH4 l-1 d-1, 250
mg COD l-1 d-1, 800 mg NaHCO3 l-1 d-1. Yeast extract was used as carbon source for
heterotrophic population. Once a day the sludge was settled and 5 l of supernatant were
removed and replaced with the same volume of tap water (HRT = 1.6 days). The culture
was aerated, agitated and kept at room temperature (20 to 25 °C). In the calorimeter
temperature was fixed at 25 °C and pH was controlled to 8.0 ± 0.2 by adding a 0.5 M NaOH
solution. Biomass concentration was 1.36 g VSS l-1 (TSS = 1.52 g l-1).
RESULTS AND DISCUSSION
The thermogram and the respirogram acquired during an experiment with “Alto Seveso“
biomass are reported in Figures 5 and 6 respectively. At t = 1.5 h, the endogenous sludge
was spiked with 100 ml wastewater. Wastewater degradation is characterised by an
immediate increase in heat production rate and in oxygen uptake rate, probably due to the
presence of a small amount of readily biodegradable COD, and by a quite long tail.
Wastewater additions were repeated 5 times. A sa tisfactory reproducibility was observed for
both oxygen and heat measurements. During the 5 tests, endogenous respiration dropped
from 12 to 7 mg l-1 h-1 and a progressive decrease was observed also in the maximum
exogenous heat production rate and in the maximum exogenous OUR (from 42 to 17 mg l-1
h-1) resulted from repetitive wastewater pulses. This can be mainly attributed to a toxicity
effect due to wastewater additions. The short term biological oxygen demand, evaluated as
the area under the respirogram for each wastewater pulse, was almost constant. For 100 ml
wastewater addition and a total reaction volume of 1.5 l the average value was 15 mg l-1
(Coefficient of Variation = 11 %).

14
-25
0
25
50
75
100
125
150
0 2 4 6 8Time (h)
Qex
(mW
)
Wastewater addition
Total heat dissipationWastewater A
addition
Figure 5. Thermogram acquired during wastewater A degradation (“Alto Seveso” biomass).
-5
0
5
10
15
20
25
30
0 2 4 6 8
Time (h)
OU
Rex
(mg
l-1 h
-1)
Short termBiological Oxygen Demand
Figure 6. Respirogram acquired during wastewater A degradation (“Alto Seveso” biomass).
By plotting the volumetric heat dissipation, calculated as the area under the thermogram
(Figure 5), versus the oxygen demand (area under the respirogram in Figure 6), it is possible
to estimate the oxycaloric equivalent as the slope of the linear regression on the
experimental data (Figure 7). YQ/O resulted to be 403 kJ mol O2-1. This value is in good
agreement with the theoretical value for he terotrophic aerobic metabolism (460 kJ mol
O2-1). Besides the absolute value of the slope, one may note that a satisfactory linear

15
relationship (R2 = 0.995) between heat production rate and oxygen uptake rate was obtained
for a biomass sample from a full-scale WWTP fed on a real raw wastewater stream. The
slight deviation from the calculated value at the end of wastewater degradation (upper points
in Figure 7) can be related to the difficulties in evaluating exogenous heat production rate
and OUR when they approach zero. These inaccuracies are due to the small differences in
oxygen concentration at the end of the test (DO measurements) and to possible shifts in the
thermal baseline value (heat measurements).
R2 = 0.9947
0
40
80
120
160
200
0 0.1 0.2 0.3 0.4 0.5
Oxygen Demand (mmol l-1)
Hea
t (J
l-1)
YQ/O = 403 kJ mol O2-1
Figure 7. Oxycaloric equivalent estimated for wastewater A degradation.
Additionally, in order to evaluate both autotrophic nitrifying and heterotrophic activity, a
new sample (VSS = 2.28 g l-1; TSS = 3.20 g l-1) of “Alto Seveso” sludge was spiked with
ammonia and acetate, selected as reference readily biodegradable carbonaceous substrate.
The thermal response to wastewater addition was compared to acetate and ammonia
consumption. In Figure 8, the respirogram obtained after substrate pulses is reported. Peak
A refers to 100 ml wastewater addition, pea k B to acetate (10 mg COD l-1) and peak C to
ammonia (3.3 mg N-NH4 l-1). Endogenous activity at the beginning of the experiment was
10 mg l-1 h-1 (4.4 mg g VSS-1 h-1) and slightly decreased during the test. Exogenous OUR on
acetate was 30 mg l-1 h-1 whereas only 7 mg l-1 h-1 was the maximum oxygen uptake rate
after wastewater pulse. Respirogram acquired for ammonia has an uncommon shape,
characterised by a slow OUR decrease that starts immediately after the maximum is
reached. More research is needed to explain this phenomenon. Heat flux profiles (Figure 9)

16
confirmed the results obtained with DO measurements. The maximum exogenous heat
production rate for wastewater degradation was 36 mW. The ratio between maximum OUR
and maximum heat production rate, that provides a rough estimate of YQ/O, is similar for
acetate and wastewater (394 and 320 kJ mol O2-1), whereas becomes significantly lower
(165 kJ mol O2-1) for ammonia consumption.
0
10
20
30
40
50
0.0 1.5 3.0 4.5 6.0 7.5 9.0
Time (h)
OU
R (m
g l-1
h-1
)
AC
B
Figure 8. Respirogram acquired after substrate spikes to “Alto Seveso” WWTP biomass.
-50
0
50
100
150
0.0 1.5 3.0 4.5 6.0 7.5 9.0
Time (h)
Qex
(mW
)
AC
B
Figure 9. Thermogram acquired after substrate spikes to “Alto Seveso” WWTP biomass.

17
Similar results were obtained with a sample of the same sludge and identical substrates by
Bisschops (2002). The respirometer used was a Manotherm RA-1000. Respirograms related
to acetate, 20 mg COD (A1) and 40 mg COD (A2), ammonia, 3.5 mg N (N1) and 1.75 mg
N (N2) and raw wastewater, 50 ml (WW1) and 100 ml (WW2) are presented in Figure 10.
Also in this case, an inhibitory effect of wastewater on biomass activity was identified. In
fact, a significant decrease of the maximum OUR related to acetate degradation was
observed after wastewater exposure.
0
10
20
30
40
50
60
70
80
90
0 1 2 3 4 5
Time (h)
OU
R (m
g l-1
h-1
)
A1 A2
A1
A1
WW1WW2
N1
N2
Figure 10. Respirogram acquired with a RA-1000 respirometer after substrate pulses to “Alto
Seveso“ sludge. (Bisschops, 2002).
Subsequently, the toxicity effect of wastewater A was evaluated on cultivated biomass. In
Figures 11 and 12 the results related to biomass fed on acetate as the sole carbon and energy
source are presented. Thermograms and respirograms A1 and A2 refer to acetate
consumption (200 mg COD), thermogram and respirogram WW to wastewater degradation
(100 ml). C is the electrical calibration for UA determination after wastewater addition,
when the reaction volume increased from 1.4 to 1.5 l. Biomass inhibition has been
calculated by comparing the maximum heat production rate acquired before and after
biomass exposure to wastewater according to the following equation:

18
I% = 100·(Q ex - Qex’) / Q ex (2)
where exQ is the maximum exogenous heat production rate related to acetate degradation
before wastewater exposure and 'exQ is the maximum exogenous heat production rate
related to acetate degradation after wastewater exposure.
The maximum heat production rate for acetate consumption decreased from 375 mW to 330
mW after wastewater exposure (12 % inhibition), whereas the total heat dissipation
remained almost constant (650 J) since, at each spike, the same amount of acetate was added
to the system. The percentage inhibition estimated from OUR profile compares well with
the one calculated through heat measurements (Figure 12). In fact, after wastewater
exposure, endogenous OUR measured before acetate pulses dropped from 2.62 mg g VSS-1
h-1 to 2.26 mg g VSS-1 h-1 and maximum OUR during acetate degradation decreased from
193 mg g VSS-1 h-1 to 169 mg g VSS-1 h-1 (12 % inhibition). As reported in the insert in
Figure 12, the sole acetate consumption was related to an oxygen demand of around 55 mg
O2 and YQ/O was estimated to be 370 kJ mol O2-1. This value is in good agreement with
those observed by Beaubien and Jolicoeur (1985) working with activated sludges (345 kJ
mol O2–1) and by Birou et al. (1987) on pure cultures of C. utilis growing on acetate (385 kJ
mol O2–1). In thermograms A1 and A2, the peak related to primary substrate consumption is
followed by an exothermic tail representing the degradation of intracellular storage
polymers, mainly poly-beta-hydroxybutyrate (PHB), accumulated during acetate depletion.
This phenomenon has been typically observed when biomass grows under transient
conditions, for example when a substrate concentration gradient is produced, leading to
successive periods of feast and famine, like in intermittently-fed reactors or when biomass is
subjected to alternating aerobic, anoxic or anaerobic conditions, like in nutrient removal
processes (Majone et al. , 1999; Beun et al., 2000). Taking into account also PHB
consumption the total heat released for acetate degradation was 1170 J and the whole
oxygen demand around 100 mg O2.

19
-100
0
100
200
300
400
500
600
0 8 16 24 32 40 48 56 64
Time (h)
Qex
(mW
)A1
WW
C
A2-50
050
100
150200250300350
400
0 2 4 6 8 10 12 14
Time (h)
Qex
(mW
)
-1800180360
54072090010801260
1440
Hea
t (J
)
A1
Figure 11. Wastewater A toxicity effect: thermogram related to the experiment with biomass fed
exclusively on acetate. In the insert: acetate degradation and calculated heat dissipation (–– qex, ––
heat dissipation).
-10
0
10
20
30
40
50
60
70
80
90
0 8 16 24 32 40 48 56 64
Time (h)
OU
Rex
(mg
l-1 h
-1)
A1
A2
WW
-100
102030405060708090
0 2 4 6 8 10 12 14
Time (h)
OU
Rex
(m
g l-1
h-1
)
-150153045607590105120135
Oxy
gen
Dem
and
(mg
O 2)
A1
Figure 12. Wastewater A toxicity effect: respirogram related to the experiment with biomass fed
exclusively on acetate. In the insert: acetate degradation and calculated oxygen demand (–– OURex, –
– Oxygen Demand).

20
Similar results were obtained for the culture fed on acetate and wastewater. In Figure 13,
thermograms A1, A2 and A3 refer to acetate consumption (200 mg COD) and thermogram
WW1 and WW2 to wastewater degradation (100 ml). C is the electrical calibration. At t =
66 h the sludge was settled and 100 ml supernatant were withdrawn. Subsequently,
wastewater and acetate pulses were repeated. The maximum heat production rate for acetate
degradation decreased from 378 mW to 328 mW after the first wastewater exposure (13 %
inhibition) and to 282 mW (25 % inhibition) after the second pulse. Notwithstanding
biomass had been exposed to wastewater during cultivation (5 weeks), the degree of
inhibition was not significantly different than the one detected for biomass fed exclusively
on acetate. Also wastewater degradation was not affected by the adaptation period.
-100
0
100
200
300
400
500
0 20 40 60 80 100 120 140
Time (h)
Qex
(mW
)
A1
C
WW1
A2
WW2
A3
Figure 13. Wastewater A toxicity effect: thermogram related to the experiment with biomass fed on
acetate and wastewater.
In order to verify that the decrease in heat production rate was mainly related to wastewater
inhibitory effect and not to biomass decay occurred between the first and the second acetate
addition, acetate pulses were repeated on a sample of the same biomass used for the
previous test without adding wastewater. In Figure 14, the thermograms related to acetate
degradation are presented. Only 3 % decrease in the maximum heat production rate was
observed after the second acetate pulse (A2) that was performed 47 hours after the first
addition (A1). Therefore, in the time frame of a single batch test, biomass decay had only a
minor effect on the observed decrease in biological activity.

21
-100
0
100
200
300
400
500
600
700
800
0 2 4 6 8 10 12
Time (h)
Qex
(mW
)A1 A2
48 5250
Figure 14. Acetate additions to biomass cultivated on acetate and wastewater: cell decay effect
investigation.
Finally, wastewater A inhibitor y effect was evaluated on the enriched nitrifying culture
(Figure 15). Thermograms N1, N2 and N3 refer to ammonia pulses (20 mg N-NH4) and
thermogram W to wastewater addition (100 ml). The maximum heat production rate for
ammonia degradation decreased from 227 mW to 165 mW after wastewater exposure (27 %
inhibition). The percentage inhibition estimated for nitrifiers was more than two times
higher than the one for the heterotrophs. This was expected since nitrifying bacteria are
recognised to be, among the aerobic microbial populations, the most sensitive to toxicity
effects, especially in activated sludge processes (Kroiss et al. , 1992). Nevertheless, a
recover of microbial activity was observed when ammonia pulse was repeated (N3) without
new wastewater additions. In fact, in this case, maximum heat flux increased up to 205 mW
(10 % inhibition). The total heat released was almost the same for each ammonia peak
(mean value = 496 J; CV = 4 %), thus confirming a good signal reproducibility also for
nitrification experiments.

22
-50
0
50
100
150
200
250
300
0 4 8 12 16 20 24 28
Time (h)
Qex
(m
W)
N1
W
N3
N2
Figure 15. Wastewater A toxicity effect: thermogram related to the experiment with the enriched
nitrifying culture.
WASTEWATER B
Calorimetric and respirometric measurements have been carried out to investigate the
aerobic biodegradability of the final effluent (wastewater B) of a polyester textile finishing
factory. Wastewater B is treated in an activated sludge (AS) WWTP located at the factory.
The treatment steps are: neutralisation/equalisation, extended aeration, secondary settling
with aerobic digestion of wasted sludge. An additional aerobic MBR (Membrane
BioReactor) pilot plant operating on wastewater B was installed in parallel with the full-
scale WWTP (Malpei et al., 2002). The MBR was a ZeeWeed®-10 bench test unit (Zenon
Environmental Inc., Oakville, Canada) made of a hollow fibre module submerged in a 200 l
aeration tank. Characteristics of raw wastewater B and operational parameters for the two
plants are summarised in Table 2 and Table 3 respectively.
Table 2. Raw wastewater B characteristics.
WASTEWATER B
COD (mg l-1) 3916 N-NH4 (mg l-1) 5.8 TSS (g l- 1) 1.87 VSS (g l-1) 1.64 % VSS 88
Table 3. WWTPs operational parameters.
Full scale (AS) MBR Aeration tank volume (m3) 1500 0.22
Influent (m 3 d-1) 440 0.07 HRT (d) 4 3.3 F/M ratio (g COD g TSS-1 d-1)* 0.05 - 0.13 0.017 – 0.36 TSS range (g l-1) 7.5 - 15.7 4.4 - 23.5 % VSS range 87 - 90 84 - 90
* Food over biomass ratio

23
BIOMASS SOURCE AND EXPERIMENTAL DESIGN
A preliminary experiment was performed to evaluate the biodegradability of raw wastewater
B. The sludge was directly sampled at the AS plant. 700 ml of mixed liquor were diluted
with 700 ml demineralised water so that reaction volume was 1.4 l and biomass
concentration in the calorimeter was 5.87 g VSS l-1 (TSS = 7.03 g l-1). Temperature set point
was 25 °C, agitation 150 rpm and pH 7.8 ± 0.2. After reaching a stable Qr baseline (Qr
endogenous), the sludge was spiked with a known amount (100 ml) of raw wastewater.
In order to compare the biological activ ity of the MBR biomass with the one observed
during the test on AS plant sludge, calorimetric experiments have been repeated under the
same experimental conditions. Three exogenous substrates were used: raw wastewater B
(100 ml), ethanol (30 mg COD) and ammonia (3 mg N-NH4). The initial biomass
concentration in the calorimeter for MBR sludge was 4.71 g VSS l-1 (TSS = 5.50 g l-1).
Additionally, wastewater B was separated into two fractions: the supernatant (filtered at
0.45 µm) and the solid fraction that was obtained by centrifuging raw wastewater (5000
rpm, 5 min), discharging the supernatant, and resuspending in demineralised water. For this
purpose, 500 ml wastewater were used and the procedure was repeated 3 times. At the end
of the process, the solid fraction was resuspended in 100 ml demineralised water. MBR
biomass was used to evaluate biodegradability of the two fractions separately.
RESULTS AND DISCUSSION
In Figure 16, the thermogram and the respirogram simultaneously acquired after raw
wastewater addition to AS plant biomass, are reported.
Immediately after substrate spike (t = 1.8 h), a sudden increase in both heat production rate
and OUR was observed. The maximum heat production rate was 80 mW l-1 and the
associated maximum OUR was 20 mg l-1 h-1. Immediately after the maximum was reached,
OUR and heat flux started to slowly decrease. Subsequently (t = 3 h), the depletion of the
ready biodegradable fraction of the effluent was clearly indicated by a fast drop in both heat
production rate and OUR followed by an exothermic tail related to the consumption of a
slowly biodegradable substrate, probably storage polymers.
24
-4
0
4
8
12
16
20
24
28
0 3 6 9 12 15
Time (h)
OU
Rex
(m
g l-1
h-1
)
-14
0
14
28
42
56
70
84
98
q ex
(mW
l-1)
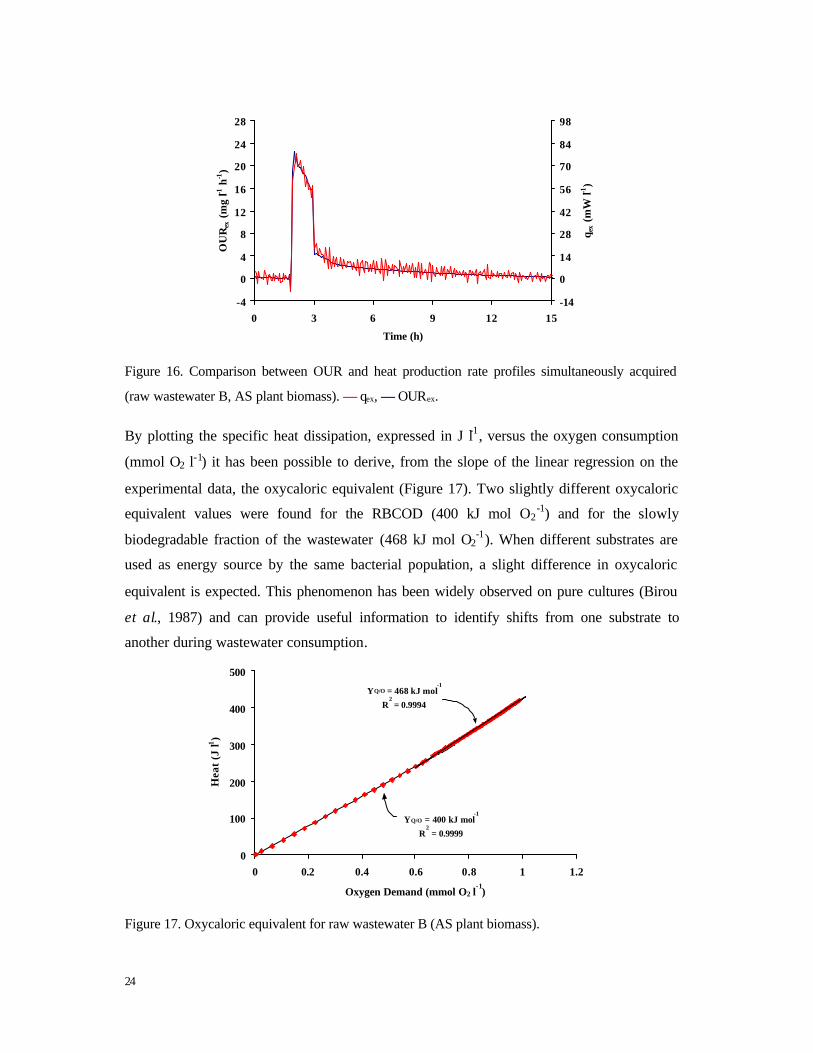
Figure 16. Comparison between OUR and heat production rate profiles simultaneously acquired
(raw wastewater B, AS plant biomass). –– qex, –– OURex.
By plotting the specific heat dissipation, expressed in J l-1, versus the oxygen consumption
(mmol O2 l-1) it has been possible to derive, from the slope of the linear regression on the
experimental data, the oxycaloric equivalent (Figure 17). Two slightly different oxycaloric
equivalent values were found for the RBCOD (400 kJ mol O2-1) and for the slowly
biodegradable fraction of the wastewater (468 kJ mol O2-1). When different substrates are
used as energy source by the same bacterial population, a slight difference in oxycaloric
equivalent is expected. This phenomenon has been widely observed on pure cultures (Birou
et al., 1987) and can provide useful information to identify shifts from one substrate to
another during wastewater consumption.
0
100
200
300
400
500
0 0.2 0.4 0.6 0.8 1 1.2
Oxygen Demand (mmol O2 l-1
)
Hea
t (J
l-1)
YQ/O = 400 kJ mol-1
R2 = 0.9999
YQ/O = 468 kJ mol-1
R2 = 0.9994
Figure 17. Oxycaloric equivalent for raw wastewater B (AS plant biomass).
25
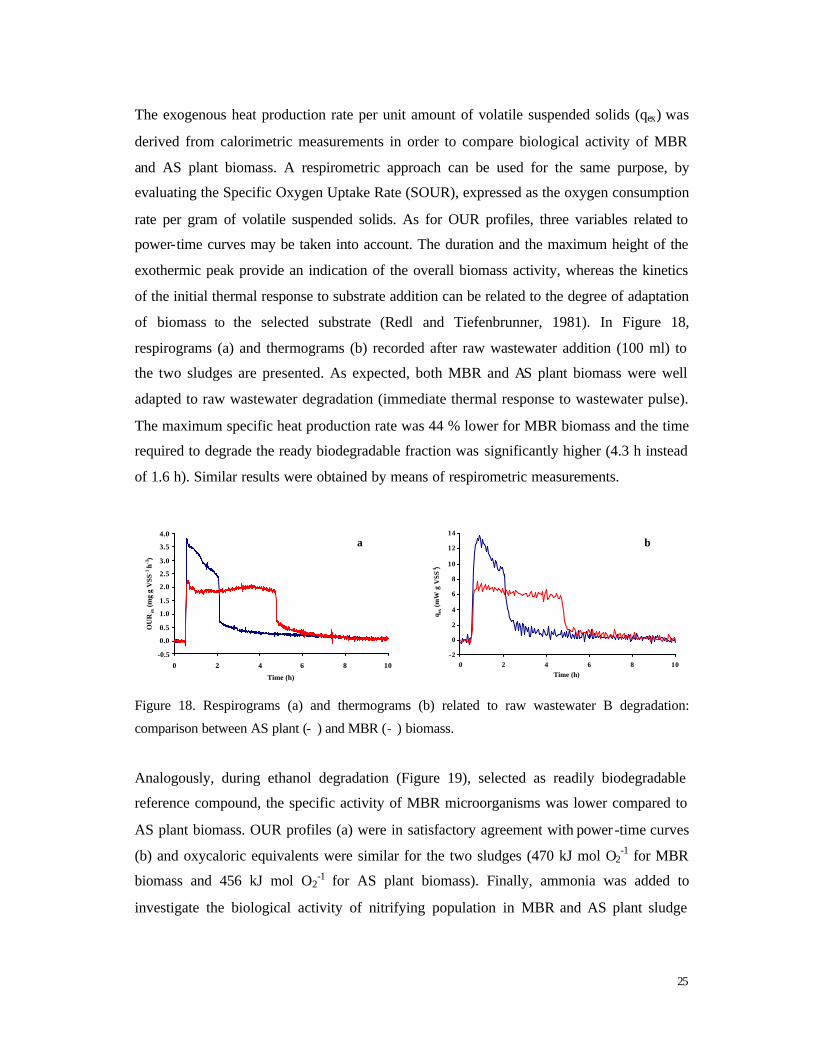
The exogenous heat production rate per unit amount of volatile suspended solids (qex) was
derived from calorimetric measurements in order to compare biological activity of MBR
and AS plant biomass. A respirometric approach can be used for the same purpose, by
evaluating the Specific Oxygen Uptake Rate (SOUR), expressed as the oxygen consumption
rate per gram of volatile suspended solids. As for OUR profiles, three variables related to
power-time curves may be taken into account. The duration and the maximum height of the
exothermic peak provide an indication of the overall biomass activity, whereas the kinetics
of the initial thermal response to substrate addition can be related to the degree of adaptation
of biomass to the selected substrate (Redl and Tiefenbrunner, 1981). In Figure 18,
respirograms (a) and thermograms (b) recorded after raw wastewater addition (100 ml) to
the two sludges are presented. As expected, both MBR and AS plant biomass were well
adapted to raw wastewater degradation (immediate thermal response to wastewater pulse).
The maximum specific heat production rate was 44 % lower for MBR biomass and the time
required to degrade the ready biodegradable fraction was significantly higher (4.3 h instead
of 1.6 h). Similar results were obtained by means of respirometric measurements.
-0.5
0.0
0.5
1.0
1.5
2.0
2.5
3.0
3.5
4.0
0 2 4 6 8 10
Time (h)
OU
Rex
(mg
g V
SS-1
h-1
)
a
-2
0
2
4
6
8
10
12
14
0 2 4 6 8 10Time (h)
q ex (
mW
g V
SS-1)
b
Figure 18. Respirograms (a) and thermograms (b) related to raw wastewater B degradation:
comparison between AS plant (- ) and MBR (- ) biomass.
Analogously, during ethanol degradation (Figure 19), selected as readily biodegradable
reference compound, the specific activity of MBR microorganisms was lower compared to
AS plant biomass. OUR profiles (a) were in satisfactory agreement with power-time curves
(b) and oxycaloric equivalents were similar for the two sludges (470 kJ mol O2-1 for MBR
biomass and 456 kJ mol O2-1 for AS plant biomass). Finally, ammonia was added to
investigate the biological activity of nitrifying population in MBR and AS plant sludge

26
samples (data not shown). In both cases, nitrifying activity was not detected either in terms
of oxygen consumption or in terms of heat dissipation.
-0.5
0
0.5
1
1.5
2
0 1 2 3 4 5
Time (h)
OU
Rex
(mg
g V
SS-1
h-1
)
a
-2
0
2
4
6
8
0 1 2 3 4 5
Time (h)
q ex (m
W g
VSS
-1)
b
Figure 19. Respirograms (a) and thermograms (b) related to ethanol degradation: comparison
between MBR (- ) and AS plant (- ) biomass.
A detailed summary of respirograms and thermograms characteristics for ethanol and
wastewater degradation is reported in Table 4. SOUR has been shown to be a good indicator
of microbial viability of activated sludges (Huang and Cheng, 1984) and an analogous
meaning can also be attributed to qex. Notwithstanding SOUR is affected by many factors, in
particular by mean cell residence time and raw wastewater characteristics, the values
observed for both sludges are significantly lower than those typically reported in literature
(Huang and Cheng, 1984; Henze et al. , 1987; Jørgensen et al. 1992; Kristensen et al., 1992).
To authors best knowledge, no explicit literature data exist for qex in activated sludge,
however, also in this case, the experimental values are lower than those obtained in our
laboratory with different biomass samples and substrates (ranging from 60 to 140 mW g
VSS-1). Moreover, during plants monitoring, the apparent yield (i.e. cumulative increase of
mixed liquor TSS with respect to the cumulative COD removed) for both MBR and AS
plant resulted to be higher than the values of net yield usually observed in conventional
activated sludge plants and in MBR plants operating the same food over biomass ratio
(Malpei et al., 2002). This phenomenon can be explained taking into account that an
appreciable concentration of suspended solids (0.6 - 1.8 g VSS l-1) entered the aeration tanks
together with raw wastewater. This seems to be related to the fact that part of the effluent
from the dewatering process of wasted sludge was mixed with factory wastewater into the
neutralisation/equalisation basin. On the contrary, the contribution of poorly biodegradable
polyester fibre fragments on solid concentration is probably negligible. The high supply of

27
solids with wastewater stream also affects the specific sludge activity since it causes an
increase in VSS concentration that is not proportional to the increase in active biomass.
Table 4. Comparison between MBR and AS plant biomass.
AS plant MBR
qex max raw wastewater (mW g VSS- 1) 13.8 7.7
qex max ethanol (mW g VSS - 1) 6.9 4.0
SOURend (mg g VSS-1 h-1) 0.69 0.23
SOURex max ethanol (mg g VSS- 1 h-1) 1.7 0.9
SOURex max raw wastewater (mg g VSS-1 h-1) 3.8 2.3
Peak duration raw wastewater (h) 1.6 4.33
Peak duration ethanol (h) 0.8 1.9
In order investigate the short term biodegradability of the solids contained in wastewater B,
raw wastewater was divided into supernatant and solid fraction and the MBR biomass was
used to test the two fractions. In Figure 20, power-time curves acquired after substrate
pulses to the MBR sludge and calculated total heat dissipation are reported. Raw wastewater
dose led to a total heat production of 785 J whereas only 233 J were dissipated after solid
fraction addition. By taking into account the heat released per unit amount of COD added it
is possible to evaluate and compare the short term biodegradability of the different fractions.
The specific heat dissipation was 4.5 kJ g COD-1 for filtered wastewater (supernatant), 2.0
kJ g COD-1 during raw wastewater consumption and only 0.23 kJ g COD-1 when the solid
fraction was dosed as exogenous substrate. These findings indicate that suspended solids
contained into wastewater B are poorly biodegradable. OUR measurements (data not
shown) were in good agreement with calorimetric profiles. Data are summarised in Table 5.
Table 5. Data related to wastewater B fractions degradation.
Raw wastewater B
Supernatant Sediment Volume (ml) 100 100 500 COD (mg l-1) 3916 1384 10100 Heat dissipation (J) 785 626 233 Specific heat dissipation (J mg COD-1) 2.0 4.5 0.23 O2 demand (mg) 65 47 23 Specific O2 demand (mg mg COD -1) 0.16 0.34 0.02

28
-20
0
20
40
60
80
0 2 4 6 8 10
Time (h)
Qex
(mW
)
-250
0
250
500
750
1000
Hea
t (J)
Figure 20. Degradation of wastewater B fractions and calc ulated heat dissipation (- raw wastewater
B, - supernatant, - sediment). (Thermograms related to MBR biomass).
CONCLUSIONS
A bench scale isothermal calorimeter (Bio-RC1), especially modified for biological studies
has been used to characterise aerobic biodegradability of final effluents from two textile
factories. Moreover, calorimetric profiles have been compared to DO measurements
simultaneously carried out. The following conclusion can be drawn:
- Wastewater stream degradation has been characterised in terms of microbial heat
dissipation and short term biological oxygen demand. A linear correlation between
calorimetric and respirometric data was observed in aerobic batch tests with biomass
samples from full-scale WWTPs fed on textile effluents confirming that, under strictly
aerobic conditions, calorimetry and respirometry provide the same information.
- Oxycaloric equivalent has been evaluated for two textile wastewaters. YQ/O was estimated
to be 403 kJ mol O2-1 for wastewater A. Two slightly different YQ/O have been detected for
the easily biodegradable fraction (400 kJ mol O 2-1) and for the slowly biodegradable fraction
(468 kJ mol O2-1) of wastewater B. All these values are in good agreement with those
reported in literature for pure microbial cultures and with the theoretical value of 460 kJ mol
O2-1 valid for heterotrophic aerobic metabolism.

29
- Calorimetric measurements, as well as respirometry, have been successfully applied to
detect the toxicity effect on aerobic microbial populations (heterotrophs and nitrifiers) due
to wastewater addition and to evaluate and compare biomass activities from different
WWTPs treating the same textile effluent.
ACKNOWLEDGEMENTS
Iemke Bisschops is greatly acknowledged for the respirometric measurements using the RA
1000 meter. Authors are grateful to Prof. Alberto Rozzi and to Stefania Invernizzi for their
collaboration in wastewater B experiments.
REFERENCES
Aulenta F., Bassani C., Ligthart J., Majone M. and Tilche A. (2002). Calorimetry: a tool for
assessing microbial activity under aerobic and anoxic conditions. Wat. Res. 36, 1297-1305.
Battley E. H. (1987). Energetics of Microbial Growth, John Wiley & Sons, Inc., New York.
Beaubien A. and Jolicoeur C. (1985). Application of flow microcalorimetry to process control in
biological treatment of industrial wastewater. J. Wat. Pollut. Control Fed. 57 (1), 95-100.
Beun J. J., Paletta F., van Loosdrecht M. C. M. and Heijnen J. J. (2000). Stoichiometry and kinetics
of poly-beta-hydroxybutyrate metabolism in aerobic, slow growing, activated sludge cultures.
Biotechnol. Bioeng. 67 (4), 379-389.
Birou B., Marison I. W. and von Stockar U. (1987). Calorimetric investigation of aerobic
fermentations. Biotechnol. Bioeng. 30, 650-660.
Bisschops I. (2002). Respiration experiments – Textile wastewater. TOWEF0 internal work
document and report. LeAF, The Netherlands.
Cooney C. L., Wang D. I. C. and Mateles R. I. (1968). Measurement of heat evolution and
correlation with oxygen consumption during microbial growth. Biotechnol. Bioeng. 11 (3),
269-281.
Daverio E. (2002). Calorimetric assessment of activity in WWTP biomass. In Proceedings of the 1st
IWA Young Researchers Conference, 9 - 10 September 2002, Cranfield, UK.

30
Daverio E., Aulenta F., Ligthart J., Bassani C. and Rozzi A. (2003). Application of calorimetric
measurements for biokinetic characterisation of nitrifying population in activated sludge. Wat.
Res. (In press).
Dejean L., Beauvoit B., Bunoust O., Fleury C., Guerin B. and Rigoulet M. (2001). The calorimetric -
respirometric ratio as an on-line marker of enthalpy efficiency of yeast cells growing on a
non-fermentable carbon source. Biochim. Biophys. Acta 1503, 329-340.
Eftimiadi C. and Rialdi G. (1982). Increased heat production proportional to oxygen consumption in
human neutrophils activated with phorbol-12-myristate-13-acetate. Cell Biophys. 4 (2-3), 231-
244.
Erickson L. E., Selga S. E. and Viesturs U. E. (1978). Application of mass and energy balance
regularities to product formation. Biotechnol. Bioeng., 20, 1623-1638.
Gnaiger E. and Kemp R. B. (1990). Anaerobic metabolism in aerobic mammalian cells: information
from the ratio of calorimetric heat flux and respirometric oxygen flux. Biochim. Biophys. Acta
1016, 328-332.
Gustafsson L. (1991). Microbiological calorimetry. Thermochim. Acta 193, 145-171.
Henze M., Grady C. P. L. Jr, Gujer W., Marais G. V. R. and Matsuo T. (1987). A general model for
single-sludge wastewater treatment systems. Wat. Res. 21, 505-515.
Huang J. Y. C. and Cheng Meng-Dawn (1984). Measurement and new applicatio ns of oxygen
uptake rates in activated sludge processes. J. Wat. Pollut. Control Fed. 56 (3), 259-265.
Kemp R. B. (2000). “Fire burn and cauldron bubble” (W. Shakespeare): what the calorimetric -
respirometric (CR) ratio does for our understanding of cells? Thermochim. Acta 355, 115-124.
Kharasch M. S. (1929). Heats of combustion of organic compounds. Bur. Stand. J. Res. 2, 359.
Kristensen G.H., Jørgensen P.E. and Henze M. (1992). Characterization of functional
microorganisms groups and substrate in activated sludge and wastewater by AUR, NUR and
OUR. Wat. Sci. Tech. 25 (6), 43-57.
Kroiss H., Schweighofer P., Frey W. and Matsche N. (1992). Nitrification inhibition – A source
identification method for combined municipal and/or industrial wastewater treatment plants.
Wat. Sci. Tech. 26 (5/6), 1135-1146.
Johansson P. and Wadsö I. (1999). An isothermal microcalorimetric titration/perfusion vessel
equipped with electrodes and spectrophotometer. Thermochim. Acta 342, 19-29.
Jørgensen P. E., Eriksen T. and Jensen B. K. (1992). Estimation of viable biomass in wastewater and
activated sludge by determination of ATP, oxygen utilization rate and FDA hydrolysis. Wat.
Res. 26 (11), 1495-1501.
Luong J. H. T. and Volesky B. (1980). Determination of the heat of some aerobic fermentations.
Can. J. Chem. Eng. 58, 497-504.

31
Majone M., Dircks K. and Beun J. J. (1999). Aerobic storage under dynamic conditions in activated
sludge processes. The state of the art. Wat. Sci. Tech. 39 (1), 61-73.
Malpei F., Bonomo L. and Rozzi A. (2002). Feasibility study to upgrade a textile WWTP by a
hollow fibre MBR for effluent reuse. In Proceedings of the 3rd IWA World Water Congress, 7
- 12 April 2002, Melbourne, Australia.
Marison I. W., Liu J. S., Ampuero S., von Stockar U. and Schenker B. (1998). Biological reaction
calorimetry: Development of high sensitivity bio-calorimeters. Thermochim. Acta 30, 157-
173.
Minkevich I. G. and Eroshin V. K. (1973). Productivity and heat generation of fermentation under
oxygen limitation. Folia Microbiol. 18, 376-385.
Randolph T. W., Marison I. W., Martens D. E. and von Stockar U. (1990). Calorimetric control of
fed-batch fermentations. Biotechnol. Bioeng. 36, 678-684.
Redl B. and Tiefenbrunner F. (1981). Determination of hydrolytic activities in wastewater systems
by microcalorimetry. Wat. Res. 15, 87-90.
Roš M., Dular M., and Farkas P.A. (1988). Measurement of respiration of activated sludge. Wat.
Res. 22 (11), 1405-1411.
Schön A. and Wadsö I. (1986). Thermochemical characterization of T-lymphoma cells under non-
grow ing conditions. Cytobios. 48 (194-195), 195-205.
Spanjers H., Vanrolleghem P. A., Olsson G. and Dold P. L. (1998). Respirometry in control of the
activated sludge process. Principles, IAWQ Scientific and Technical Report No.7, IAWQ,
London, England.
Standard Methods for the Examination of Water and Wastewater (1995). 19th edn.,
APHA/AWWA/WEF, Washington DC, USA.
Thornton W. M. (1917). The relation of oxygen to the heat of combustion of organic compounds.
Philos. Mag. 33, 196-203.
van Kleeff B. H. A., Kuenen J. G. and Heijnen J. J. (1993). Continuous measurement of microbial
heat production in laboratory fermentors. Biotechnol. Bioeng. 41, 541-549.
Volesky B., Yerushalmi L. and Luong J. H. T. (1982). Metabolic – heat relation for aerobic yeast
respiration and fermentation. J. Chem. Tech. Biotechnol., 32, 650-659.
von Stockar U. and Birou B. (1989). The heat generated by yeast cultures with a mixed metabolism
in the transition between respiration and fermentation. Biotechnol. Bioeng. 34, 86-101.
von Stockar U. and Marison I. W. (1989). The use of calorimetry in biotechnology. Adv. Biochem.
Eng. 40, 93-136.

32
Mission of the JRC The mission of the JRC is to provide customer-driven scientific and technical support for the conception, development, implementation and monitoring of EU policies. As a service of the European Commission, the JRC functions as a reference centre of science and technology for the Union. Close to the policy-making process, it serves the common interest of the Member States, while being independent of special interests, whether private or national.