
Simulations of low-level convergence lines over ...roger/Publications/TS... · Simulations of...
21
Q. J. R. Meteorol. Soc. (2005), ?, pp. 1–21 Simulations of low-level convergence lines over northeastern Australia By Gerald L. Thomsen and Roger K. Smith * Meteorological Institute, University of Munich June 14, 2005 1. Abstract We describe high-resolution numerical model simulations of low-level convergence lines over northeastern Australia using the Pennsylvania State University/National Cen- ter for Atmospheric Research Mesoscale Model (MM5). The simulations are for se- lected events that were documented during the Gulf Lines EXperiment (GLEX), held in September-October 2002, and they are compared with those from the mesoscale version of the Australian Bureau of Meteorology’s operational Limited Area Prediction System. The calculations provide further insights into the dynamics of the convergence lines and the mechanisms involved in their formation. In particular they show a clear distinction between the convergence line that corresponds with the morning-glory and that which corresponds with the North Australian Cloud Line (NACL): the former originates from the east-coast sea breeze over Cape York Peninsula south of about 14 ◦ S while the lat- ter originates from the east-coast sea breeze north of this latitude. They support also a recently proposed conceptual model for the generation of southerly morning glories and show for the first time the separation of a bore-like disturbance following the collision of a nocturnal cold front to the south of the inland trough with a sea-breeze front to the north of the trough. Moreover, they show the progressive transition of the east-coast sea breeze front and the inland cold front from gravity-current-like flows to bore-like disturbances overnight to form northeasterly and southerly morning glories, respectively. 2. Introduction One of the most spectacular atmospheric phenomena in northern Australia is the so-called ”morning-glory”, the name given to a low-level roll-cloud line or a series of such cloud lines that occur early in the morning over the southeastern part of the Gulf of Carpentaria and adjacent seaboard. The cloud lines are associated with bore-waves that form along a low-level convergence line. The most common cloud lines have a northwest- southeast orientation and move from the northeast. We refer to these as northeasterly morning glories. The convergence line in this case is generated by the sea-breeze cir- culations over Cape York Peninsula when there is a broadscale, low-level easterly flow over the peninsula. A closely related phenomenon is the North Australian Cloud Line (NACL), a long line of convective cloud that forms along the west-coast of the Cape York Peninsula in the late afternoon or early evening and moves westwards over the gulf during the night and the following day. A comprehensive list of references relating to both phenomena is contained in the review article by Reeder and Smith (1998). It has long been thought that the NACL is associated with the northern extension of the same convergence line that produces the morning-glory (see e.g. Smith and Page, 1985), * Corresponding author: Roger K. Smith, Meteorological Institute, University of Munich, Theresienstr. 37, 80333 Munich, Germany. Email: [email protected] 1
Transcript of Simulations of low-level convergence lines over ...roger/Publications/TS... · Simulations of...

Q. J. R. Meteorol. Soc. (2005), ?, pp. 1–21
Simulations of low-level convergence lines over northeastern Australia
By Gerald L. Thomsen and Roger K. Smith∗
Meteorological Institute, University of Munich
June 14, 2005
1. Abstract
We describe high-resolution numerical model simulations of low-level convergencelines over northeastern Australia using the Pennsylvania State University/National Cen-ter for Atmospheric Research Mesoscale Model (MM5). The simulations are for se-lected events that were documented during the Gulf Lines EXperiment (GLEX), held inSeptember-October 2002, and they are compared with those from the mesoscale versionof the Australian Bureau of Meteorology’s operational Limited Area Prediction System.The calculations provide further insights into the dynamics of the convergence lines andthe mechanisms involved in their formation. In particular they show a clear distinctionbetween the convergence line that corresponds with the morning-glory and that whichcorresponds with the North Australian Cloud Line (NACL): the former originates fromthe east-coast sea breeze over Cape York Peninsula south of about 14◦S while the lat-ter originates from the east-coast sea breeze north of this latitude. They support also arecently proposed conceptual model for the generation of southerly morning glories andshow for the first time the separation of a bore-like disturbance following the collisionof a nocturnal cold front to the south of the inland trough with a sea-breeze front tothe north of the trough. Moreover, they show the progressive transition of the east-coastsea breeze front and the inland cold front from gravity-current-like flows to bore-likedisturbances overnight to form northeasterly and southerly morning glories, respectively.
2. Introduction
One of the most spectacular atmospheric phenomena in northern Australia is theso-called ”morning-glory”, the name given to a low-level roll-cloud line or a series of suchcloud lines that occur early in the morning over the southeastern part of the Gulf ofCarpentaria and adjacent seaboard. The cloud lines are associated with bore-waves thatform along a low-level convergence line. The most common cloud lines have a northwest-southeast orientation and move from the northeast. We refer to these as northeasterlymorning glories. The convergence line in this case is generated by the sea-breeze cir-culations over Cape York Peninsula when there is a broadscale, low-level easterly flowover the peninsula. A closely related phenomenon is the North Australian Cloud Line(NACL), a long line of convective cloud that forms along the west-coast of the CapeYork Peninsula in the late afternoon or early evening and moves westwards over thegulf during the night and the following day. A comprehensive list of references relatingto both phenomena is contained in the review article by Reeder and Smith (1998). Ithas long been thought that the NACL is associated with the northern extension of thesame convergence line that produces the morning-glory (see e.g. Smith and Page, 1985),
∗ Corresponding author: Roger K. Smith, Meteorological Institute, University of Munich, Theresienstr.37, 80333 Munich, Germany. Email: [email protected]
1

2 Gerald L. Thomsen and Roger K. Smith
but observations during the recent Gulf Lines field EXperiment (GLEX) supported bycalculations presented below suggest that this is generally not the case. Morning gloriesare most frequently observed in the late dry season, typically from mid-September untilthe end of October, although the formation of the low-level convergence line appears tobe an almost daily occurrence when there is easterly flow over the peninsula. The NACLis a very common occurrence in these conditions also. During breaks in the wet season,when easterly flow is temporarily re-established over the peninsula and when there ishigh moisture at low levels, the NACL may develop into a line of thunderstorms thatpose a significant forecasting problem in the gulf region.
A second and less common type of morning-glory develops overnight to the southof the gulf, or over the gulf itself, and moves northwards, or at least with a significantnorthwards component. The generation of these so-called southerly morning glories isless well understood than that of their northeasterly counterparts, but many appear tobe associated with strong ridging to the south of the inland heat trough (Smith et al..1982, 1986, 2005. This trough is a climatological feature of the region of northwesternQueensland at the times of year when morning glories are most common. Southerlymorning glories are discussed also in the review article by Reeder and Smith (1998) andthose documented during GLEX are discussed by Smith et al.. (2005).
A first attempt to determine the predictability of the low-level convergence lines overthe gulf is described by Jackson et al. (2002) using the mesoscale version, mesoLAPS, ofthe Limited Area Prediction System of the Australian Bureau of Meteorology (LAPS)is described by Puri et al. (1998). Events were chosen on occasions when cloud lines ofvarious types were clearly visible in satellite imagery and verification was based on theprediction of a low-level convergence line in the observed location and with the observedorientation as the cloud line. Unfortunately, no other data were available for verification.The GLEX experiment was carried out for a period in September-October 2002 in orderto remedy the deficiency in the data base and to document the occurrence and evolutionof the convergence lines in as much detail as possible. To this end a network of automaticweather stations was installed in the region and an instrumented light aircraft was usedto make measurements of lines over the sea. Details of the experiment and the resultsthereof are described in the series of papers by Goler et al.. (2005), Smith et al.. (2005)and Weinzierl et al.. (2005).
We describe here some high-resolution numerical model simulations using MM5 oftwo of the most interesting events documented during the GLEX experiment and com-ment briefly on the simulations of a further two. We compare these simulations withthe data collected during GLEX and with the coarser-resolution, operational predictionsmade using mesoLAPS, the mesoscale version of the Australian Bureau of Meteorol-ogy’s operational Limited Area Prediction System (LAPS). We discuss also some coarserresolution simulations of the events using MM5 to provide a fairer comparison with meso-LAPS. Finally, the high-resolution simulations are used as a basis for a detailed study ofthe convergence lines that produce morning glories and the NACL.
3. The model configuration
The MM5 model is described in detail by Grell et al. (1995). In brief, the model isnonhydrostatic and uses a finite difference approximation to the equations with σ as the

QUARTERLY JOURNAL STYLEFILE 3
vertical coordinate (σ = (p − pt)/(ps − pt), where p is pressure, ps is the surface pressureand pt the top pressure, assumed constant, equal to 100 mb). We use 23 σ-levels withlevels below 3 km at heights of approximately: 0, 40, 80, 150, 230, 300, 380, 540, 700,870, 1200, 1550, 1900, 2300 and 2750 m, which give a relatively high resolution in theboundary layer. The calculations are carried out on the two horizontal domains shown inFig. 1: an outer domain with relatively coarse resolution and an inner domain with triplethis resolution. Two sets of calculations are carried out as detailed in subsections (a) and(b) below. These are compared with the mesoLAPS simulations described in subsection(c).
Gulf ofCarpentaria
CoralSea
O Mount Isa
O Darwin
Townsville O
X Burketown
O Alice Springs
a)
Burketown X
X Sweers Island
X Milgara
Augustus Downs X
X Karumba
X Delta DownsX Van Rook
Highbury XX Dunbar
b)
Figure 1. Map of northeastern Australia showing (a) the coarse domain of the model with placesmentioned in the text, and (b) the inner domain with the locations of the AWS stations in the southern
gulf region marked by crosses.
(a) High resolution simulations, GLX
In these calculations the outer domain has 221 × 221 grid points with a horizontalresolution of 9 km and the inner domain has 301 × 301 points with a horizontal resolutionof 3 km. The terrain land use and topography are taken from the MM5 data set and havea 5’ resolution for the outer domain and 2’ resolution for the inner domain. The timestep for the outer domain is chosen as 27 s and for the inner domain as 9 s. The Grellcumulus parameterization scheme (Grell 1993) is implemented in the outer domain, butno cumulus scheme is used in the inner domain as the processes believed to be involvedwith the generation of the morning-glory are dry (e.g. Smith and Noonan, 1998). TheMRF boundary-layer scheme as implemented in the National Centers for EnvironmentalPrediction Medium Range Forecast system by Hong and Pan (1996) is select for alldomains. In a sensitivity study of all boundary layer schemes available in MM5 thisscheme proved to be most realistic in capturing the GLEX observations and will bethe topic for another paper. The simple Dudhia scheme is chosen to represent explicitmoisture conversions. A short- and long-wave cloud and ground radiation scheme thattakes account of diurnal variations is used. For this set of experiments we use analysisdata from the European Centre for Medium Range Weather Forecasts (ECMWF) forthe initial conditions and boundary conditions. These data have a horizontal resolutionof 0.25◦. The MM5 model has a 5-layer bucket soil moisture model. For this we use soil

4 Gerald L. Thomsen and Roger K. Smith
moisture data from mesoLAPS as the ECMWF soil moisture scheme applies a lower limitwhich is much too moist for the north Australian dry season and has a deleterious effecton the generation of the sea breezes in the region. These high-resolution calculations arereferred to as ”GLX”.
(b) Medium resolution simulations, BOM
A additional set of medium resolution experiments was carried out with MM5 forcomparison with the corresponding hydrostatic mesoLAPS simulations described below.These simulations are similar to those above, but have an outer domain of 53 × 53 gridpoints with a horizontal resolution of 37.5 km and an inner domain of 76 × 76 grid pointswith a horizontal resolution of 12.5 km, the latter being comparable to the grid spacingof mesoLAPS. In this case, the Grell cumulus parameterization scheme is implementedin both domains and the terrain land use and topography data sets have 10’ and 5’resolution, respectively. The time step is chosen as 112.5 s for the outer domain and 37.5s for the inner domain. In contrast to the GLX experiments, we use ECMWF forecastdata for the boundary conditions as mesoLAPS uses forecast data also, albeit from theBureau’s global prediction system. Experiments of this type are referred to as ”BOM”.
(c) MesoLAPS simulations
Mesoscale predictions using mesoLAPS were available operationally for the gulf re-gion for the duration of the GLEX experiment. MesoLAPS is a hydrostatic model with 29vertical levels and a horizontal resolution of 12.5 km. The initial and boundary conditionswere taken from the Bureau of Meteorology’s Global Analysis and Prediction System.Further details of mesoLAPS and a comparison of the mesoLAPS predictions with thedata obtained from GLEX are described by Weinzierl et al.. (2005).
4. Two major events
In this section we focus on two events during the GLEX experiment. All dates andtimes are given in Eastern Australian Time (EST), which is 10 h ahead of Universal TimeCoordinated, (UTC). In the first case, on 04 October 2002, there were three disturbances:a northeasterly morning-glory, an NACL and a weak southerly morning-glory. In thesecond case, on 28/29 September 2002, a southerly disturbance moved across the southernhalf of the gulf. It was composed of two convergence lines, the leading line had an undular-bore-like structure and was followed some hours later by a significant air-mass change.This event is described in detail in Smith et al.. (2005). In each case we begin by examiningthe ability of the models to reproduce the observations, first with satellite data and thenwith data from the automatic weather stations (AWSs) at Augustus Downs, Burketown,Delta Downs, Dunbar, Highbury, Karumba, Magowra, Milgara, Sweers Island and VanRook (the locations of these stations are shown in Fig. 1b). Thereafter we use the GLXsimulation to explore important aspects of the evolution of the convergence lines.
(a) The northeasterly morning-glory of 04 October 2002
Figure 2 shows the Japanese Geostationary Meteorological Satellite (GMS) imagefor the gulf region at 0630 EST on 04 October 2002. The series of cloud lines stretching

QUARTERLY JOURNAL STYLEFILE 5
Figure 2. GMS visible image of the Gulf of Carpentaria region at 0630 EST on 04 October 2002.
northwestwards from the southeastern corner of the gulf are associated with a northeast-erly morning-glory, while a line stretching north-northwestwards from the same corner isan NACL. A pair of cloud lines forming a slightly curved arc and oriented approximatelyeast-west south of the southern gulf coast is associated with a southerly morning-glory.The model simulations for this event commenced at 1000 EST on 03 October.
Figure 3 compares the predicted low-level divergence at 0730 EST for the GLX andBoM calculations and at 0700 EST for the mesoLAPS calculation (only three-hourlyoutput is available for mesoLAPS). All three calculations show a convergence line overthe southern part of the gulf that corresponds approximately with the observed positionof the northeasterly morning-glory. The presumption made by Jackson et al. (2002) thatthe cloud lines correspond with lines of enhanced convergence in the low-level divergencepatterns was confirmed in the GLEX cases by the surface measurements. The orientationof this convergence line in the GLX and BOM calculations corresponds very well withobservations (see Table 1), but in the LAPS run the line curves to the south at itssouthern end, a feature that is not seen in the satellite image. The GLX run capturesthe orientation and position of the NACL as well, whereas in the other runs provide onlya hint of it in the northern part of the gulf. Moreover, mesoLAPS places this line some300 km too far to the northwest.
TABLE 1. Observed orientation (measured anticlockwise from north) of the northeasterly morning-glory (NEMG) and NACL in Fig. 2 compared between the model and observations (Note that there is
about half an hour difference in times in the case of mesoLAPS).
NEMG NACLObserved 40◦ 11◦
GLX 40◦ 9◦
BoM 40◦ 9◦
LAPS 40◦ 9◦

6 Gerald L. Thomsen and Roger K. Smith
GLX 04 October 0630 ESTa)
BOM 04 October 0630 ESTb) LAPS 04 October 0700 ESTc)
Figure 3. Low-level wind vectors (scale 10 m s−1 below each panel) and divergence (shaded, unit s−1)for the (a) GLX and (b) BOM simulations at σ = 0.9975 at 0630 EST on 04 October 2002, and (c)for the mesoLAPS simulation at 1025 mb and 0700 EST on this day. Note that the contour interval for
divergence is different in the lower panels.
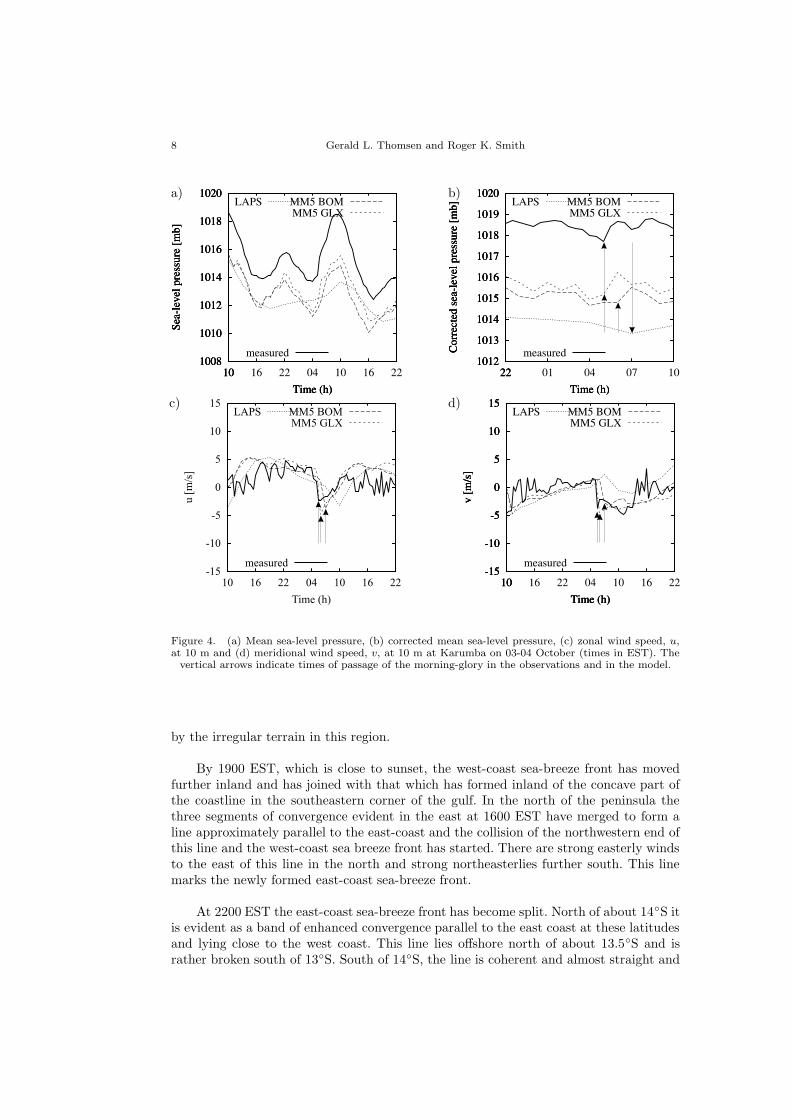
We examine now the ability of the models to reproduce the surface observationsat Karumba and to capture the timing of the morning-glory convergence line at AWSstations in the southern part of the gulf. Figures 4a and b compare observed and model-predicted time-series of mean-sea-level pressure (MSLP) at Karumba on 03 October.Figure 4a shows the total pressure, while Fig. 4b shows a 12 h segment of the correctedpressure, obtained by first removing daily trend and then the diurnal and semidiurnalvariation. The trend was assumed to be linear throughout the day and the diurnal andsemidiurnal variation were removed by performing a Fourier analysis of the pressure andthen subtracting the first two wavenumbers. Both MM5 simulations (GLX and BoM)show a remarkably good agreement with the observed behaviour, but the mean pressureis offset by about 2.5 mb, which we attribute to the difference in mean height of theorography in the grid-box surrounding Karumba and the station height of the model(the actual height was estimated to be 15 m compared with 1.8 m in mesoLAPS, 0.6 min BOM and 0 m in GLX). In contrast the surface pressure variation is not well capturedby LAPS, probably because the radiation scheme in the operational version of this modelis invoked only every three hours (Dr. Bill Bourke, personal communication).

QUARTERLY JOURNAL STYLEFILE 7
TABLE 2. Times of passage, note that GLX times have a temporal resolution of just 30 minutes.
Observed GLXHighbury 2200 0030Dunbar 2250 0030
Van Rook 0150 0130Delta Downs 0315 0330
Karumba 0510 0600Magowra 0540 no signatureMilgara 0620 0700
Sweers Island 0730 0800Burketown 0845 1000
Augustus Downs 1000 1230
Figures 4c and d show time series of the zonal and meridional wind speed at Karumba.The vertical arrows indicate the passage of the morning-glory, which is characterized bya sharp change in wind direction. As expected, the time of passage is captured best in thehigh-resolution GLX run, being within a few minutes of the observed time, and secondbest in the BOM run, where the passage is between two and three hours too late. Thetiming in mesoLAPS is a little worse, but it is difficult to deduce a precise value as thedata are available only every three hours.
In an attempt to quantify the overall agreement between the surface pressure ob-served at AWS stations and the corresponding pressures in the model simulations wecalculate the correlation coefficient defined by
r =
∑
(pmeas − pmeas)(pmod − pmod)√
∑
(pmeas − pmeas)2∑
(pmod − pmeas)2,
where the average is taken over the stations listed in Table 2. The index ’meas’ denotesa measured value and ’mod’ refers to a particular model. The overlined variables areaveraged over the 36 h integration time. For the GLX and BOM runs, the correlation,r = 0.95, is high on this day while for LAPS it is lower: r = 0.82.
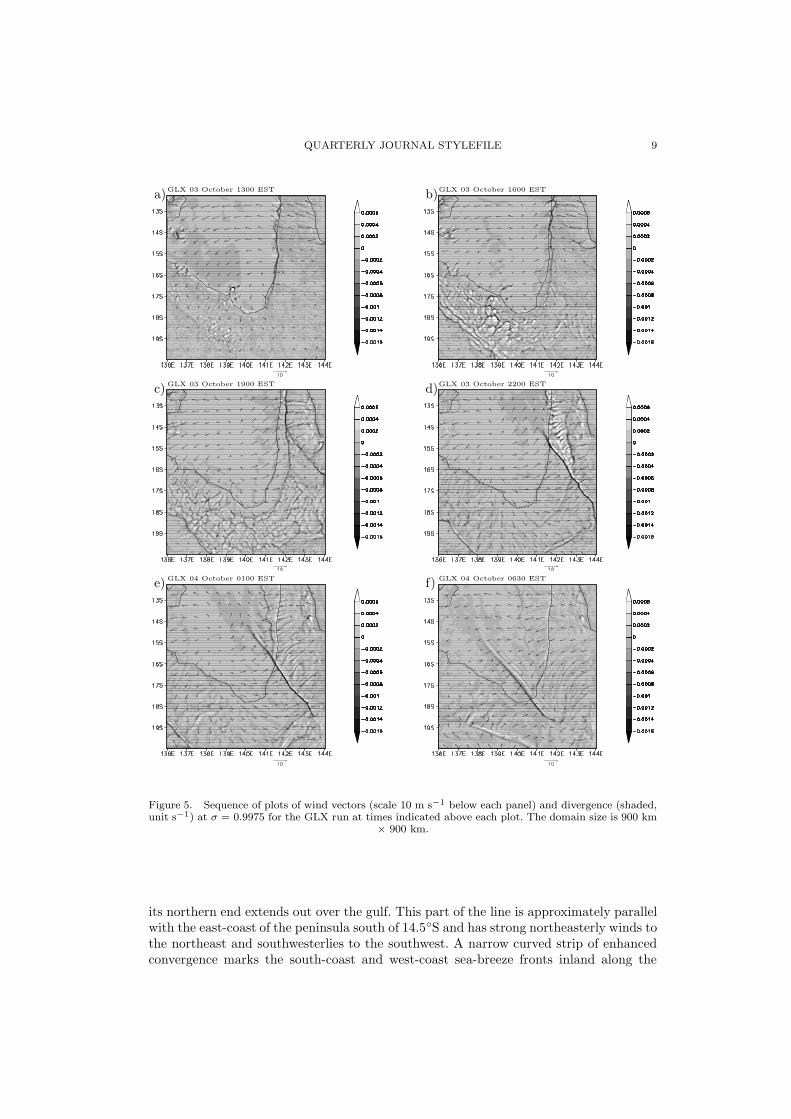
The evolution of the low-level convergence lines in the GLX run is shown in Fig. 5. At1300 EST the sea breeze has just begun to develop along the west-coast of the peninsulaand is marked there by a well-defined line of convergence along the coast because thebroadscale flow is offshore along this coast. Two short lines of convergence have formedon the northeastern side of the peninsula as well. There is also a line of convergenceapproximately parallel to the southern gulf coast and 100 km or more inland and ashorter line nearer to the coast, both west of 140 E. The line further inland is ragged atits southeastern end suggesting a significant influence of orography in this region.
By 1600 EST the convergence line marking the west-coast sea-breeze front has moveda little inland, especially along its southern part and the lines in the northeast havelengthened. These lines are presumably a result of convergence produced by the onshoreacceleration of the easterly flow in conjunction with orography. Note that the daytimeoccurrence of sharp sea breeze fronts is favoured by an offshore component of the broad-scale flow (Clarke, 1983). At this time two long coherent lines of convergence are evidentsouth of the gulf, west of 140◦ E, together with many small cells of convergence, whichmay be an attempt by the model to capture the largest boundary layer eddies induced
8 Gerald L. Thomsen and Roger K. Smith
a) b)
c) d)
Figure 4. (a) Mean sea-level pressure, (b) corrected mean sea-level pressure, (c) zonal wind speed, u,at 10 m and (d) meridional wind speed, v, at 10 m at Karumba on 03-04 October (times in EST). The
vertical arrows indicate times of passage of the morning-glory in the observations and in the model.
by the irregular terrain in this region.
By 1900 EST, which is close to sunset, the west-coast sea-breeze front has movedfurther inland and has joined with that which has formed inland of the concave part ofthe coastline in the southeastern corner of the gulf. In the north of the peninsula thethree segments of convergence evident in the east at 1600 EST have merged to form aline approximately parallel to the east-coast and the collision of the northwestern end ofthis line and the west-coast sea breeze front has started. There are strong easterly windsto the east of this line in the north and strong northeasterlies further south. This linemarks the newly formed east-coast sea-breeze front.
At 2200 EST the east-coast sea-breeze front has become split. North of about 14◦S itis evident as a band of enhanced convergence parallel to the east coast at these latitudesand lying close to the west coast. This line lies offshore north of about 13.5◦S and israther broken south of 13◦S. South of 14◦S, the line is coherent and almost straight and
QUARTERLY JOURNAL STYLEFILE 9
GLX 03 October 1300 ESTa)
GLX 03 October 1600 ESTb)
GLX 03 October 1900 ESTc) GLX 03 October 2200 ESTd)
GLX 04 October 0100 ESTe) GLX 04 October 0630 ESTf)
Figure 5. Sequence of plots of wind vectors (scale 10 m s−1 below each panel) and divergence (shaded,unit s−1) at σ = 0.9975 for the GLX run at times indicated above each plot. The domain size is 900 km
× 900 km.
its northern end extends out over the gulf. This part of the line is approximately parallelwith the east-coast of the peninsula south of 14.5◦S and has strong northeasterly winds tothe northeast and southwesterlies to the southwest. A narrow curved strip of enhancedconvergence marks the south-coast and west-coast sea-breeze fronts inland along the

10 Gerald L. Thomsen and Roger K. Smith
entire gulf coastline. This strip intersects the east-coast sea-breeze front about 16.4◦S.Animations of the low-level flow fields show that the convergence lines associated withthe sea-breezes pass through each other. However, a sequence of vertical-zonal cross-sections of wind and virtual potential temperature at 13◦S show that after the collision,the eastward-moving convergence line propagates as a wave disturbance in the easterlyflow and subsequently decays. In the lower right of Fig. 5d, the south-coast sea-breezefront is already 250 km inland. A second convergence line is also evident a little furtherinland and separates winds with a northerly or westerly component to the north of it fromthose with a southerly to easterly component to the south of it. This line is associatedwith nocturnal ageostrophic convergence into the inland trough.
At 0100 EST on 04 October, the southern section of the east-coast sea-breeze fronthas moved southwestwards. Behind it over the land are strong northeasterlies, while overthe sea the winds behind are southeasterly. At the same time the northern section hasregained coherence and forms a separate line of convergence extending south-southeastto north-northwest over the northeastern part of the gulf. North of its intersection withthe east-coast sea-breeze front, the west-coast sea-breeze front has lost its identity. Thesea-breeze front from the southern gulf coast has moved further inland, forming an arcnear the southern edge of the plotting domain.
Figure 5f shows the situation at 0630 EST, the time of the satellite image in Fig. 2.At this time the convergence line that was the east-coast sea-breeze front lies very closeto the location of the northeasterly morning-glory in the satellite image, which is clearevidence that the latter develops out of the former. Further, the NACL lies close to theconvergence line in the northern part of the gulf, the origin of which can be traced backto the east-coast sea breeze along the northern part of the peninsula. An animation ofthe half-hourly fields like those in Fig. 5 shows also a convergence line moving from thesouth, this being the east-west oriented line at 0630 in Fig. 5f. This line appears to bethe attempt of the model to capture the southerly morning-glory seen in the satelliteimage. However, this line is some 150 km too far south of the observed cloud line at itswestern end and some 200 km at its eastern end. Since the convergence line in the modelis still over land when the mixed layer redevelops after sunrise, the line weakens beforereaching the southern gulf coast. A likely reason for the incorrect location of this line isits incorrect location in the initial analysis. The coarser resolution operational mesoLAPSforecasts described by Weinzierl et al. (2005) failed also to capture this disturbance.
Figure 6 compares the satellite picture at 1430 EST on 04 October with the modelfields like those in Fig. 5. By this time the northeasterly morning-glory cloud line haslong moved over land and disappeared in the satellite imagery, but the NACL is stillevident. The position of the NACL is tolerably well captured in the model (it is closeto the point 14◦S, 139◦E in both the model and the image), but the orientation in themodel is a little different from that observed. The sea-breeze front along the southerngulf coast and along the west coast of the peninsula is reasonably well captured also. Thisfront is presumably close to the northern/western edge of the cumulus cloud field in thesatellite image. An animation of the half-hourly fields like those in Fig. 5 shows that thesea-breeze front along the southern gulf coast forms out of the morning glory convergenceline, which accounts for the series of convergence lines just south of the southern tip ofthe gulf in the model, although such waves are not seen in the corresponding satelliteimage. The southern edge of this cloud field, south of the gulf, appears to correspondapproximately with a continuous line of enhanced convergence in the model, separating

QUARTERLY JOURNAL STYLEFILE 11
a northeasterly airstream to the north from a south- to southeasterly airstream to thesouth. In the model, this line lies close to (not more than 15 km north of) the mean axisof the inland trough at this time.
GLX 04 October 1430 ESTa)
b)
Figure 6. (a) Low-level wind vectors (scale 10 m s−1 below panel) and divergence (shaded, unit s−1)for the GLX simulations at σ = 0.9975 at 1430 EST on 04 October 2002. (b) GMS visible satellite image
at 1425 EST on the same day.
The evolution described above provides a modified view of the generation of north-easterly morning glories compared with previous studies. The early idealized calcula-tions by Clarke (1984) and Noonan and Smith (1986, 1987) indicated that the morning-glory is generated by the collision of the east- and west-coast sea breezes over the CapeYork Peninsula. The collision results in an elevated hump of stably-stratified air thatsubsequently forms a southwestward-propagating bore wave. The observations of bore-formation ahead of a cold front over central Australia (Smith et al.. 1995) and morerecent calculations of morning-glory convergence lines by Smith and Noonan (1998) pro-vide evidence that the collision of the sea-breezes is not a necessary prerequisite forproducing a bore-wave (in the Smith and Noonan calculations, the convergence line isalso well-formed south of the gulf coast where no collision occurs). The forgoing modelsimulations as well as the more recent mesoLAPS calculations by Jackson et al. (2002)all indicate that the morning-glory and NACL are associated with the same convergenceline although the observations during GLEX suggested that this is not the case. Indeed,a feature of the foregoing GLX calculation, in contrast to all previous calculations, isthe clear distinction it shows between the convergence line that corresponds with themorning-glory and that which corresponds with the NACL.
In a very recent study by Goler and Reeder (2004) using an extremely-high resolution(200 m in the horizontal) two-dimensional model, the air behind the east-coast sea-breezefront is warmer than the air behind the west-coast sea-breeze front and runs over thewest-coast sea breeze to form the morning-glory convergence line. In their calculationthe sea surface temperature is the same on both sides of the peninsula. A vertical cross-section of virtual potential temperature, θv , water vapour mixing ratio and horizontalwind vectors from (15.5◦S, 141.5◦E) to (13.5◦S, 143◦E) at 1900 EST and 2000 on 03

12 Gerald L. Thomsen and Roger K. Smith
October, shortly before and shortly after the collision of the two sea breezes, is shownin Fig. 7). Inspection of the 1900 cross-section shows that in the present simulation,the depth of the cold air behind the west-coast sea-breeze front is shallower and the airjust behind the front is a little moister than that behind the east-coast sea-breeze front.Furthermore the horizontal gradient of θv near the surface is largest across the west-coastsea-breeze front, suggesting that the east-coast sea breeze will rise above the west-coastsea breeze at collision, as in the Goler and Reeder calculations. However, one would notexpect the present model with 3 km horizontal resolution to capture the details of thecollision process, especially because the boundary-layer scheme that is implemented inthe model at all grid points is unlikely to be valid near the collision point. Calculationsnot shown indicate that the pseudo-equivalent potential temperature of air behind thewest-coast sea-breeze front is a little larger that that behind the east-coast sea-breezefront.
a) b)
Figure 7. Vertical cross-section of virtual potential temperature (contour lines, interval 0.5 K), watervapour mixing ratio (shaded, in g kg−1) and horizontal wind vectors from the surface to 2 km at (a) 1900EST, and (b) 2000 EST on 03 October. The cross-section extends from (15.5◦S, 141.5◦E) to (13.5◦S,
143.8◦E). In (a) the two sea breezes are about to collide and (b) is just after the collision.
Figure 8 shows the relative flow, u − c, directly behind the NACL and behind themorning-glory at a height of ∼ 250 m and at selected times, where u is the wind speedperpendicular to and towards the line in question and c is the propagation speed of thatline. In these calculations the orientation of the NACL is ∼ 10◦
± 1◦ at 0000 and 0300EST on 04 October, and ∼ 8◦ ± 1◦ at 0500 EST, measured anticlockwise from north. Themean propagation speed of this line between 2200 EST on 03 October and 0700 ESTon 04 October is ∼ 4.8 m s−1. The morning-glory line has an orientation of ∼ 36.7◦
± 1◦
at 0000 EST, ∼ 39.5◦ ± 1◦ at 0300 ETC, and ∼ 40.0◦ at 0500 ETC on 04 October. Thetranslation speeds of this line at these times are 10.1 m s−1, 10.1 m s−1 and 10.7 m s−1,respectively. The errors in calculating these propagation speeds are estimated to be lessthan 1 m s−1. It is seen that the relative flow behind, i.e. to the east of both lines is positive(i.e. towards the line) after the collision of east- and west-coast sea-breezes. A positivevalue of u − c is indicative of mass transport like in a gravity current, while a negativevalue is characteristic of a bore-like disturbance (Simpson 1997). Figure 8 shows that forthis event, at least, the NACL has the clear structure of a gravity current, both before and

QUARTERLY JOURNAL STYLEFILE 13
after the collision of the sea breezes. The same is true of the morning-glory disturbanceat first, but u − c progressively declines behind the disturbance and eventually becomesnegative. After about 0500 EST, the relative flow behind the morning-glory is everywherenegative and its transition to a bore wave is complete.
4 October 0000 EST
a)
4 October 0300 EST
b)
4 October 0500 EST
c)
d) e) f)
Figure 8. Calculations of the relative flow, u − c, normal to and (in m s−1) behind the NACL (upperpanels) and the morning-glory (lower panels) at σ=0.965 in the GLX run on 04 October 2002 at times
indicated. Positive values of u − c are shaded.
(b) The southerly morning-glory of 28-29 September
The synoptic situation for this event is exemplified by the MSLP analysis for 2200EST 28 September shown in Fig. 9a. An anticyclone centred in the Great AustralianBight extends a ridge almost to the southern gulf coast, while the inland trough (markedby the dashed line in this figure) over northern Australia lies just south of this coast. Theprecursors to this event are seen in the National Oceanic and Atmospheric Administra-tion’s Advanced Very High Resolution Radiometer (AVHRR) infrared satellite image at1950 EST on 28 September shown in Fig. 9b. The image shows the sea breeze front alongthe the coastal region of the southern and eastern gulf, which is marked partly by linesegments of cloud and elsewhere by a sharp gradient in texture, presumably associatedwith the cooler sea breeze air (this boundary is highlighted by a dotted line and markedSBF in Fig. 9b). A second boundary evident in Fig. 9b is marked also by a sharp gradientin texture and partly by line segments of cloud. This line is highlighted by a dashed linein Fig. 9b and appears to be associated with a convergence line approaching from thesouth (see below).
Figure 10 shows the low-level wind and divergence at two times on this day. Panel (a)shows fields for the GLX run at 2000 EST, which should be compared with the satelliteimage for 1950 EST in Fig. 9. It is seen that the position of the sea breeze front and the

14 Gerald L. Thomsen and Roger K. Smith
a) b)
Figure 9. (a) Trough line in the Gulf of Carpentaria region at 2200 EST on 28 September (adaptedfrom Bureau of Meteorology mean sea level analysis). (b) NOAA AVHRR infrared satellite image forthe Gulf of Carpentaria area at 1950 EST on 28 September, 2002. SBF stands for sea-breeze front and
CL stands for convergence line.
convergence line south of it agree well with the positions of these lines in the satelliteimage, where they are denoted by SBF and CL, respectively. At 2200 EST, all threemodels show the southerly convergence line, which the calculations indicate marks thetrough line. Only the high-resolution run separates this line into the southerly morningglory to the north and the see breeze to the south. The models show also a northeasterlyline oriented southeast-northwest near the west-coast of the peninsula, the existence ofwhich was evident in the AWS data at Dunbar and Highbury (see Fig. 1b). Moreover, allmodels capture the sea breeze front, parallel to and inland of the gulf coast, the passageof which was also observed at AWS stations. The convergence lines are much sharper inthe GLX run because of its higher resolution, but the positions of these lines are similarin all the models.
Panel (a) of Fig. 11 shows isochrones of the northward-moving convergence line(s)in the high-resolution GLX simulation, while panel (b) shows the convergence line andthe trough line (marked by strong horizontal gradients of water vapour mixing ratio andminimum mean sea-level pressure) at 2000 EST. The position of the convergence linecoincides closely (within 20 km) with the position of the trough line, which, in turn, isconsistent with the satellite picture in Fig. 9b.
Figure 12 shows a vertical cross-section of virtual potential temperature, water-vapour mixing ratio and the (horizontal) wind vectors at 1800 EST and 2200 EST on28 September from 20◦S on 138◦E to 15◦S on 142◦E. At 1800 EST the inland troughcoincides with the region of warmest air and with the deepest well-mixed layer. The low-level flow to the northeast of the trough is moist and corresponds with the sea breeze fromthe southern gulf coast. To the southwest of the trough the air is relatively dry and thereis a decline in mixed-layer temperature towards the south (this decline continues muchfurther south than shown in this figure). Indeed the vertical structure of the atmospherein this region is reminiscent of that behind a cold front. On the right of panel (b), thedisturbance corresponding with the northeasterly morning glory is evident by the sharpjump in the isentropes.
In an hourly animation of low-level wind divergence and moisture gradient associatedwith the inland trough, the coherence of the lines is disrupted by the orography in the

QUARTERLY JOURNAL STYLEFILE 15
GLX 28 September 2000 ESTa)
GLX 28 September 2200 ESTb)
BOM 28 September 2200 ESTc) LAPS 28 September 2200 ESTd)
Figure 10. Low-level wind vectors (scale 10 m s−1 below each panel) and divergence (shaded, unit s−1)in the GLX calculation at (a) 2000 EST and (b) 2200 EST on 28 September 2002. Panels (c) and (d)show the corresponding fields for the BOM and mesoLAPS calculations, respectively, at 2200 EST. Theplots for the GLX and BOM fields are at σ = 0.9975, and that for mesoLAPS at 1025 mb. Panel (a)should be compared with the infrared satellite image in Fig. 9, which is valid 10 min. before. Note that
the contour interval for divergence is different in the lower panels.
vicinity of Mount Isa, but becomes reestablished as the disturbance moves northwardsover the flatter terrain to the north. It is here where it collides with the sea breeze beforecontinuing its generally northward movement. Comparing the two panels in Fig. 12 showsthat following the collision, the warm dry air between convergence line and sea breezeis raised above the surface and a solitary wave disturbance marked by an elevation ofthe isentropes is seen ahead of the front at 2200 EST. The latter is the precursor to themodel analogue of the southerly morning glory. It has strong southerly winds behind itat low levels.
The disturbance observed on 28/29 September consisted of two convergence lines: aleading line with an undular-bore-like structure followed later by a significant air-masschange. The separation in time between the arrival of each line increased from one anda quarter hours to five hours as the disturbance progressed northwards. The GLX modelshows also the formation of two northward-propagating lines. These are seen in Fig. 13,which shows the same fields as in Fig. 11, but at 2200 EST on 28 September and 0200

16 Gerald L. Thomsen and Roger K. Smith
a)b)
Figure 11. (a) Positions of the trough line (from 1000 EST to 1900 EST on 28 September) and southerlymorning-glory disturbance (from 2200 EST to 0200 EST on 29 September) indicated by thick solid lines.Surface orography is shaded. (b) Mean sea-level pressure (shaded) at 2000 EST on 28 September. Solidlines show the region where the low-level wind divergence is less than −8 × 10⁻⁵ s−1 indicating strongconvergence. Dashed lines show where the water vapour mixing ratio gradient exceeds 8 × 10⁻⁴ km−1.
a) b)
Figure 12. Vertical cross-section of virtual potential temperature (contour lines, interval 0.5 K), watervapour mixing ratio (shaded, in g kg−1) and horizontal wind vectors from the surface to 5 km at (a)1800 EST, and (b) 2200 EST on 28 September. The cross-sections extend from 20◦S on 138◦E to 15◦Son 142◦E, a distance of about 750 km (the position of the cross section is indicated by the solid linein Fig. 13a) Panel (a) shows the trough line and sea breeze south of the gulf before their collision nearMount Isa, and panel (b) after the collision. The right panel shows also the disturbance corresponding
with the northeasterly morning glory. The Roman numerals refer to positions in Fig. 13a.
EST on 29 September. The convergence line and dry line that were coincident at 2000EST in Fig. 11b have separated by 2200 EST (Fig. 13a) and the separation continuesto 0200 EST (Fig. 13b). The leading disturbance (marked by the fork-shaped patternof strong convergence near the southeastern corner of the gulf in Fig. 13b) propagatesto the northeast, moving ahead of the region of strong moisture gradient. The latter,which marks the dry line, slows down after collision with the sea-breeze and the dry

QUARTERLY JOURNAL STYLEFILE 17
airmass arrives at the gulf coast at about 0200 EST on 29 September, comparable withthe observed passage at about 0200 EST at Burketown and about 0230 EST at Karumba.While the accuracy of the detailed structures of the convergence lines in the calculationare hard to assess, the broad-scale features of evolution are certainly consistent with theobservations.
a) b)
Figure 13. Legend as for Fig. 11b, but for (a) 2200 EST on 28 September, and (b) 0200 EST on 29September. The black solid line in panel (a) indicates the position of the cross-section in Fig. 12b and
the Roman numerals refer to the positions indicated in that figure.
Figure 14 shows the relative flow in the model, u − c, directly behind the two con-vergence lines (the moving trough line, or dry line, and the bore wave ahead of it) ata height of ∼ 250 m at selected times. Again u is the wind speed perpendicular to andtowards the line in question and c is the propagation speed of that line (note that c’s aredifferent for each line). In these calculations the orientation of the lines is ∼ 60◦
± 1◦ at1800 EST and ∼ 57◦ ± 1◦ at 2200 EST on 28 September and 0000 EST on 29 September,measured anticlockwise from north. The mean propagation speed of the trough line at1800 EST on 28 September is ∼ 6.1 m s−1. The translation speeds of the morning gloryat 2200 EST on 28 September and 0000 EST on 29 September are 10.2 m s−1 and 12.2m s−1, respectively. The errors in calculating these propagation speeds are estimatedto be less than 1 m s−1. It is seen that the relative flow on the southern side of thetrough line is positive (i.e. towards the line) before the collision with the south-coastsea-breeze. As noted earlier, a positive value of u − c is indicative of a gravity current,while a negative value is characteristic of a bore-like disturbance. Figure 14 shows thatu − c becomes negative behind the northward-moving line that emerges from the collisionof the northward-moving convergence line and the sea-breeze. After about 0000 EST on29 September, the relative flow behind the morning-glory is everywhere negative and itstransition to a bore wave is complete.
5. Other events
In addition to the two events described above, we carried out simulations for theevent of 10 September, when a significant southerly morning glory, a weak northeasterlymorning glory and an NACL occurred, and for the event of 09 October, when there

18 Gerald L. Thomsen and Roger K. Smith
28 September 1800 ESTa)
28 September 2200 ESTb)
29 September 0000 ESTc)
Figure 14. Legend as for Fig. 8, but for the relative flow normal to and behind trough line and themorning glory disturbance on 28 September. Positive values of u − c are shaded.
were southerly, southeasterly and northeasterly morning glories as well as an NACL. Weperformed also a simulation for 30 September on which day neither morning glories noran NACL were observed. Space considerations do not permit a full discussion of theseevents, but the calculations support those described above.
On 10 September, a major southerly morning glory and an NACL were observedin satellite imagery and a spectacular morning glory cloud formation was seen from theground at Karumba. This event was at the beginning of the GLEX experiment when onlytwo AWS stations (Karumba and Mornington Island) were operating. There was evidencein the AWS data of the passage of a weak northeasterly disturbance at Karumba at 0350EST, while the southerly morning glory arrived there at 0645 EST. Only the southerlydisturbance was observed at Mornington Island (at 0920 EST). On this day, no dryline was observed following the convergence line, at least as far north as Karumba. Thecalculation, initialized at 1000 EST on 09 September, failed to produce a convergence linecorresponding with an NACL on the following day, but it did capture lines correspondingwith the northeasterly and southerly morning glories. These passed through Karumba at0500 EST (one and a half hours later than observed) and 0800 EST (one and a quarterhours later than observed), respectively. The northeasterly line did not extend quite asfar northwestwards as Mornington Island, consistent with observations, but the modeldid not capture the passage of the southerly disturbance there. An animation of watervapour mixing ratio for this event shows that the trough line/dry line did not move northof 18◦S, which is consistent with the observations.
On 09 October the southerly, southeasterly and northeasterly morning glories andtheir interaction over the gulf were documented in great detail by airborne measure-ments (Smith et al. 2005). The southeasterly morning glory was more extensive than thesoutherly one, which was confined approximately to the west of Mornington Island. Itarrived at Karumba at 0505 EST, shortly before the northeasterly morning glory at 0530EST. The model calculation was initialized at 1000 EST on 08 October. As in the caseof 03 October, model disturbances corresponding with the northeasterly morning gloryand the NACL were generated following the collision of two sea-breezes over Cape YorkPeninsula. Moreover, the NACL was parallel to the east coast north of 14.5◦ and thenortheasterly morning glory was parallel to the east coast south of 14.5◦. As in the caseof 28 September, a southerly disturbance in the model was generated following the col-

QUARTERLY JOURNAL STYLEFILE 19
lision of a convergence line moving from the south ahead of a ridge of high pressure andthe sea-breeze front from the southern gulf coast. The model did not develop separatedisturbances corresponding with the southerly and southeasterly morning glories, but itdid produce an extensive convergence line at the longitudes where the cloud lines wereobserved. Moreover, it showed a clear separation of the convergence line and the dry lineas in the case of 28 September. The disturbance in the calculation corresponding withthe northeasterly morning glory passed over Karumba at about 0500 EST (about halfan hour earlier than observed), while the southerly disturbance arrived their at about0600 EST (about half an hour later than observed). The passage of the dryline at Au-gustus Downs occurred at about 0700 EST, very close to the observed time there, butas on 10 September, the trough line in the model did move north of 18◦, again con-sistent with observations. Finally, the model captured a convergence line correspondingwith the NACL, the position of which at 1330 EST, over 27 h after the initial time, wasclose (within about 25 km) to the position in the satellite image at that time. Verticalcross-sections, similar to those in Fig. 12, but for the 10 September and 09 October casesshow the same course of events during the generation of the southerly and northeasterlymorning glories as in the cases described in section 4.
On 30 September no morning glories or an NACL were observed over the gulf, but abore-like disturbance was recorded the previous evening at the AWS stations at Highbury(at 2130 EST) and Dunbar (2230 EST) on Cape York Peninsula. Such a disturbance isthe usual precursor to a northeasterly disturbance. The model calculation, initialized at1000 EST on 29 September also produced a northeasterly disturbance over the peninsulaafter the collision of the two sea-breezes, but strong southeasterlies inhibited its passagebeyond a line from 140◦ E, 14◦ S to 144◦ E, 18◦ S in accordance with the observations.The times of passage of the model disturbance at Highbury and Dunbar agree within 30min accuracy with those observed.
6. Conclusions
With a horizontal resolution of 3 km in the finest domain and a commensuratevertical resolution, MM5 in the present configuration has considerable skill in predictingthe convergence lines observed in the four GLEX events that we investigated. The higherresolution and nonhydrostatic formulation allow a more accurate depiction of the linesthan the operational mesoLAPS forecasts. Unlike mesoLAPS, MM5 is able to distinguishclearly between the convergence lines corresponding with the northeasterly morning gloryand NACL, showing that the former develops out of the east-coast sea-breeze front onCape York Peninsula south of about 14◦S, while the latter forms from the same sea-breeze front to the north of this latitude. Calculations of the low-level flow towards eachof these lines showed that both had the character of a gravity current (with the relativeflow behind the line and normal to it being positive) during the afternoon and evening,but the morning-glory convergence line progressively acquired the character of a bore asthe region of positive relative flow behind it declined overnight. Eventually the regionof positive relative flow disappears, completing the transition to a bore. In contrast,the line marking the NACL retains a gravity-current-like structure. Also in contrast tomesoLAPS, MM5 captured the generation of a bore-like disturbance moving ahead ofand separating from the airmass change in the event of 28-29 September.
Despite its accuracy in representing the northeasterly disturbances on 04 October,
20 Gerald L. Thomsen and Roger K. Smith
the model failed to capture a disturbance corresponding with the observed southerlymorning glory on this day, but like mesoLAPS, it did predict a northward-moving con-vergence line about 100 km to the south. This line did not reach the southern gulf coastbefore the recommencement of daytime mixing, which would have removed the low-levelstable layer required for propagation of the shallow disturbance. This failure probablyresides in an inaccurate location of the convergence line over the data-sparse region southof the gulf in the initial analysis. These lines form along the northern perimeter of a ridgefrom an anticyclone as the latter moves eastwards across the continent.
The calculations support a recently proposed conceptual model for the generationof southerly morning glories, in which ageostrophic low-level convergence leads to theformation of a shallow northward-moving cold front in the evening on the southern sideof the inland trough. This front collides with an even shallower sea-breeze flow from thesouthern gulf coast and leads to the formation of a bore-like disturbance that movesnorthwards on the stable layer provided by the sea breeze air. Vertical cross-sectionsof moisture on days with southerly disturbances show a strong meridional gradient inmoisture on the northern side of the inland trough. This moisture gradient correspondswith the dryline, which marks the maximum inland penetration of the sea breeze southof the gulf.
7. Acknowledgements
We are grateful to Gordon Jackson from the Australian Bureau of Meteorology’sRegional Forecasting Office in Darwin for providing us with the mesoLAPS forecasts andto the ECMWF for providing analysis data. Financial support for the GLEX experimentwas provided by the German Research Council (Deutsche Forschungsgemeinschaft). Thefirst author gratefully acknowledges receipt of a research scholarship from the Universityof Munich, which supported this study, as well as a Rupert Ford Travel Award from theRoyal Meteorological Society, which enabled him to visit research facilities in Australia,where part of this work was carried out.
8. References
Clarke, R. H. 1983 Fair weather nocturnal inland wind surges and atmosphericbores: Part I Nocturnal wind surges. Aust. Met. Mag.,31, 133-145
Clarke, R. H. 1984 Colliding sea breezes and atmospheric bores: Two dimen-sional numerical studies. Aust. Met. Mag., 32, 207-226
Goler, R. A., and M. J. Reeder 2004: The generation of the morning glory. J. Atmos. Sci. 61,1360-1376.
Goler, R. A., M. J. Reeder, R.K. Smith, S. Arnup, H.Richter, T. D. Keenan, P.May, and J. Hacker
2005: Low-level convergence lines over the Gulf of Carpentaria. I.Northeasterly disturbances. Submitted to Mon. Wea.
Rev.
Grell, G. A. 1993 Prognostic evaluation of assumptions used by cumulus pa-rameterizations. Mon. Wea. Rev., 121, 764-787
Grell, G. A., J. Dudhia and D.Stauffer
1995 A description of the 5th generation Penn State/NCARmesoscale model (MM5). Technical Report 398,
NCAR
Hong, S.-Y. and H.-L. Pan 1996 Nonlocal boundary layer vertical diffusion in a medium-range forecast model. Mon. Wea. Rev., 124, 1322-2399
QUARTERLY JOURNAL STYLEFILE 21
Jackson, G. E., R. K. Smithand T. Spengler
2002 The prediction of low-level mesoscale convergence lines overnortheastern Australia. Aust. Met. Mag., 51, 13-23
Noonan, J. A. and R. K. Smith 1986 Sea-breeze circulations over Cape York peninsula and thegeneration of Gulf of Carpentaria cloud line distur-bances. J. Atmos. Sci., 43, 1679-1693
Noonan, J. A. and R. K. Smith 1987 The generation of Nort Australian cloud lines and the’morning glory’. Aust. Met. Mag., 35, 31-45
Puri, K., G. S. Dietachmayer,G. A. Mills, N. E.Davidson, R. A. Bowen andL. W. Logan
1998 The new BMRC Limited Area Prediction System LAPS.Aust. Met. Mag., 47, 203-223
Reeder, M. J. and R. K. Smith 1998 Mesoscale Meteorology. In Meteorology of the Southern
Hemisphere, 5, 201-241
Simpson, J. E. 1997 Gravity currents in the environment and in the laboratory,2nd edition. Cambridge University Press.
Smith R. K. and M. A. Page, 1985 Morning glory wind surges and the Gulf of Carpentariacloud line of 25-26 October 1984. Aust. Met. Mag.,
33, 185-194.
Smith R. K. and M. J. Reeder, 1988 On the movement and low-level structure of cold fronts.Mon. Wea. Rev., 116, 1927-1944.
Smith R. K. and J. A. Noonan, 1998 On the generation of low-level mesoscale convergence linesover northeastern Australia. Mon. Wea. Rev., 126,167-185.
Smith, R. K., N. A. Crook andG. Roff,
1982 Morning Glory: an extraordinary atmospheric undularbore. Quart. J. Roy. Met. Soc., 198, 937-956.
Smith, R. K., M. J. Reeder, N.J. Tapper and D. R.Christie
1995 Central Australian cold fronts. Mon. Wea. Rev., 123, 16-38
Smith, R. K., M. J. Reeder, P.May, and H. Richter,
2005 Low-level convergence lines over northeastern Australia.II. Southerly disturbances. Submitted to Mon. Wea.
Rev.,
Weinzierl, B., R. K. Smith, M.J. Reeder and Gordon E.Jackson
2005 Low-Level Convergence Lines over northeastern Australia.III. MesoLaps predictions. Submitted toMon. Wea.
Rev.,,