Simulations for Improved Imaging of Faint Objects at Maui ... · Simulations for Improved Imaging...
9
Simulations for Improved Imaging of Faint Objects at Maui Space Surveillance Site Richard Holmes Boeing LTS, 4411 The 25 Way, Suite 350, Albuquerque, NM 87109 Michael Roggemann Michigan Technological University, 1400 Townsend Drive, Houghton, MI 49931 Michael Werth, Jacob Lucas, Daniel Thompson Boeing LTS, 550 Lipoa Parkway, Kihei, HI 96753 ABSTRACT A detailed wave-optics simulation is used in conjunction with advanced post-processing algorithms to explore the trade space between image post-processing and adaptive optics for improved imaging of low signal-to-noise ratio (SNR) targets. Target-based guidestars are required for imaging of most active Earth-orbiting satellites because of restrictions on using laser-backscatter-based guidestars in the direction of such objects. With such target-based guidestars and Maui conditions, it is found that significant reductions in adaptive optics actuator and subaperture density can result in improved imaging of fainter objects. Simulation indicates that elimination of adaptive optics produces sub-optimal results for all of the faint-object cases considered. This research was developed with funding from the Defense Advanced Research Projects Agency (DARPA). The views, opinions, and/or findings expressed are those of the author(s) and should not be interpreted as representing the official views or policies of the Department of Defense or the U.S. Government. 1. INTRODUCTION There are conditions when small-scale adaptive optics (AO) are appropriate [1-3]. One application where small- scale adaptive optics may be of value is in partially-compensated speckle imaging [4-10, 2, page 279-280, 3, page 122-125]. This is the underlying case of interest in this effort, and the corresponding wave-optics simulations will be performed in reference to this application. In particular, of interest is a tradeoff between post-processing and reduced-AO system size on a telescope with a 3.6 meter aperture and a Hartmann Wavefront Sensor (WFS). However, consider that image post-processing by itself can be sufficient to form an image of reasonable quality, especially at higher light levels and with appropriate sensor settings [11-12]. Given this motivation, analysis and simulation of imaging of space objects is performed that includes adaptive optics and image post-processing. A wave optics simulation is used that has significant validation and models the image formation process, including atmospheric aberrations, the optical path, and a camera that has appropriate noise sources [13-14]. The imaging of the pupil onto the deformable mirror (DM) and the wavefront sensor is also modeled, using the Talanov transformation [15]. Several image reconstruction algorithms were used. Of these, results will be shown primarily for physically-constrained iterative deconvolution (PCID), but also with a variant involving deconvolution from wavefront sensing (DWFS) [16]. 2. SIMULATION APPROACH The simulation is performed with Hartmann WFSs that have 4, 6, 8, 16, and 32 subapertures across. Sample WFS and DM maps are shown in Figs. 1 and 2, respectively. The assumed turbulence profile is Maui3 [17], and for zenith angles varying from 25 to 65 degrees. For 45 degrees, the value of the (spherical) r0 is 15.8 cm at 590 nm and 22.8 cm at 800 nm. The value of the Rytov variance in this scenario is 0.0236 at 590 nm and 0.0165 at 800 nm. The value of the anisoplanatic patch angle is 10.7 microradians at 590 nm and 15.5 microradians at 800 nm. Copyright © 2017 Advanced Maui Optical and Space Surveillance Technologies Conference (AMOS) – www.amostech.com
Transcript of Simulations for Improved Imaging of Faint Objects at Maui ... · Simulations for Improved Imaging...
Simulations for Improved Imaging of Faint Objects at Maui Space Surveillance Site
Richard Holmes
Boeing LTS, 4411 The 25 Way, Suite 350, Albuquerque, NM 87109
Michael Roggemann
Michigan Technological University, 1400 Townsend Drive, Houghton, MI 49931
Michael Werth, Jacob Lucas, Daniel Thompson
Boeing LTS, 550 Lipoa Parkway, Kihei, HI 96753
ABSTRACT
A detailed wave-optics simulation is used in conjunction with advanced post-processing algorithms to explore the
trade space between image post-processing and adaptive optics for improved imaging of low signal-to-noise ratio
(SNR) targets. Target-based guidestars are required for imaging of most active Earth-orbiting satellites because of
restrictions on using laser-backscatter-based guidestars in the direction of such objects. With such target-based
guidestars and Maui conditions, it is found that significant reductions in adaptive optics actuator and subaperture
density can result in improved imaging of fainter objects. Simulation indicates that elimination of adaptive optics
produces sub-optimal results for all of the faint-object cases considered.
This research was developed with funding from the Defense Advanced Research Projects Agency (DARPA). The
views, opinions, and/or findings expressed are those of the author(s) and should not be interpreted as representing
the official views or policies of the Department of Defense or the U.S. Government.
1. INTRODUCTION
There are conditions when small-scale adaptive optics (AO) are appropriate [1-3]. One application where small-
scale adaptive optics may be of value is in partially-compensated speckle imaging [4-10, 2, page 279-280, 3, page
122-125]. This is the underlying case of interest in this effort, and the corresponding wave-optics simulations will be
performed in reference to this application. In particular, of interest is a tradeoff between post-processing and
reduced-AO system size on a telescope with a 3.6 meter aperture and a Hartmann Wavefront Sensor (WFS).
However, consider that image post-processing by itself can be sufficient to form an image of reasonable quality,
especially at higher light levels and with appropriate sensor settings [11-12].
Given this motivation, analysis and simulation of imaging of space objects is performed that includes adaptive
optics and image post-processing. A wave optics simulation is used that has significant validation and models the
image formation process, including atmospheric aberrations, the optical path, and a camera that has appropriate
noise sources [13-14]. The imaging of the pupil onto the deformable mirror (DM) and the wavefront sensor is also
modeled, using the Talanov transformation [15]. Several image reconstruction algorithms were used. Of these,
results will be shown primarily for physically-constrained iterative deconvolution (PCID), but also with a variant
involving deconvolution from wavefront sensing (DWFS) [16].
2. SIMULATION APPROACH
The simulation is performed with Hartmann WFSs that have 4, 6, 8, 16, and 32 subapertures across. Sample WFS
and DM maps are shown in Figs. 1 and 2, respectively. The assumed turbulence profile is Maui3 [17], and for zenith
angles varying from 25 to 65 degrees. For 45 degrees, the value of the (spherical) r0 is 15.8 cm at 590 nm and 22.8
cm at 800 nm. The value of the Rytov variance in this scenario is 0.0236 at 590 nm and 0.0165 at 800 nm. The value
of the anisoplanatic patch angle is 10.7 microradians at 590 nm and 15.5 microradians at 800 nm.
Copyright © 2017 Advanced Maui Optical and Space Surveillance Technologies Conference (AMOS) – www.amostech.com

1 2 3 4 5 6 7 8
1
2
3
4
5
6
7
8
8x8 Subaps
5 10 15 20 25 30
5
10
15
20
25
30
32x32 Subaps16x16 Subaps
2 4 6 8 10 12 14 16
2
4
6
8
10
12
14
16
Fig. 1. Sample WFS maps for 8 x 8 (left), 16 x 16, and 32 x 32 subapertures across the clear aperture. The edge of
the clear aperture is shown in orange.
1 2 3 4 5 6 7 8 91
2
3
4
5
6
7
8
9
9 Actuators Across
2 4 6 8 10 12 14 16
2
4
6
8
10
12
14
16
17 Actuators Across 32 Actuators Across
5 10 15 20 25 30
5
10
15
20
25
30
Fig. 2. Sample actuator maps for 8 x 8, 16 x 16, and 32 x 32 cases. Blue denotes a location of an active actuator,
green denotes the location of slaved actuator. The black circles denote the edge of the clear aperture.
The wave-optics simulation parameters are shown in Table 1. The key inputs are the grid sizes, which are 1024 x
1024 in size and a grid point spacing of 1 cm in the atmosphere. The grid point spacing in the optical path of the
telescope varies according to the local path magnification, but always corresponds to a scaled 1 cm in output space.
The simulation simulates 0.5 seconds of real-time operation, with a 125 Hz frame rate for the tracker/imager and a
2000 Hz frame rate for the WFS.
Table 1. Simulation input parameters.
Parameter Value
Turbulence Profile Maui3
Number of Phase Screens along Path 10
Grid Size (pts.) 1024 x 1024
Grid Point Spacing (mm) 10 mm
Beam Path 11 optical components, imaging from M1 to DM, DM to
WFS
Receiver Aperture Diameter (m) 3.63 m
Obscuration Diameter (m) 0.60 m
Imager/Tracker Read Noise (pe/read/frame) 2 pe/read/frame
Imager Spectral Bandwidth (nm) 200 nm (700-900 nm)
Imager Propagation Wavelengths Nominally 3 wavelengths: 733, 800, 867 nm
Imager Pixel Field-of-View (FOV) (nrad) 100 nrad
Imager Frame Rate (Hz) 125 Hz, sub-sampled at 500 Hz
Copyright © 2017 Advanced Maui Optical and Space Surveillance Technologies Conference (AMOS) – www.amostech.com

Tracker Digital Loop Gain 0.55
WFS Read Noise (pe/read/frame) 2 pe/read/frame
WFS Spectral Bandwidth 200 nm (500-700 nm)
WFS Propagation Wavelengths 589 nm
WFS Pixel FOV (nrad) Nyquist (/2dsubap)
WFS Subaperture FOV (microrad) 10 microradians
AO Update/WFS Frame Rate (Hz) 2000 Hz
AO Digital Loop Gain 0.45
Simulated Duration of Run (sec) 0.5 (1000 steps at AO update rate)
WFS Subapertures across Aperture 4 x 4, 6 x 6, 8 x 8, 16 x 16, 32 x 32, and 8 x 8 without AO
DM Actuator Configuration Actuators at corners of subapertures
Reconstructor Type Optimized and stabilized least-mean-square
Scenarios 600 km at 25, 45, and 65 degrees, also geosynchronous orbit
(GEO) at 39 degrees
Objects Spoke, Okean, rocket motor, triple star
Object Brightnesses 8, 9, 10, 11, 11.5 Mv
The objects that were considered are shown in Fig. 3. The Okean and rocket motor objects are scaled down in size
by a factor of 2.5 and 2.2, respectively, from their full size as seen at 600 km altitude, 25 degrees zenith. This is
done in order to match their sizes with the median low Earth orbit (LEO) object that is observed.
It should be noted that many other cases were considered but not shown or discussed herein. These include lower-
altitude objects, different integration times, different spectral bandwidths, different aperture sizes, inclusion of beam
train aberrations, different wavefront reconstructors, different image reconstructors, and different wavefront sensors
(to name just a few of the variants that were simulated). Roughly 55,000 supercomputer node-hours were utilized in
this effort.
Fig. 3. Objects used for simulations. Far-left, high-contrast spoke object with variable resolution with distance from
the center of the spoke. Second from the left, an Okean object with high-contrast features including embedded bar
charts. Third from left, a rocket motor with low-contrast features. Far right, a triple star object for geosynchronous
orbit (GEO) and astronomical imaging applications.
3. SIMULATION RESULTS
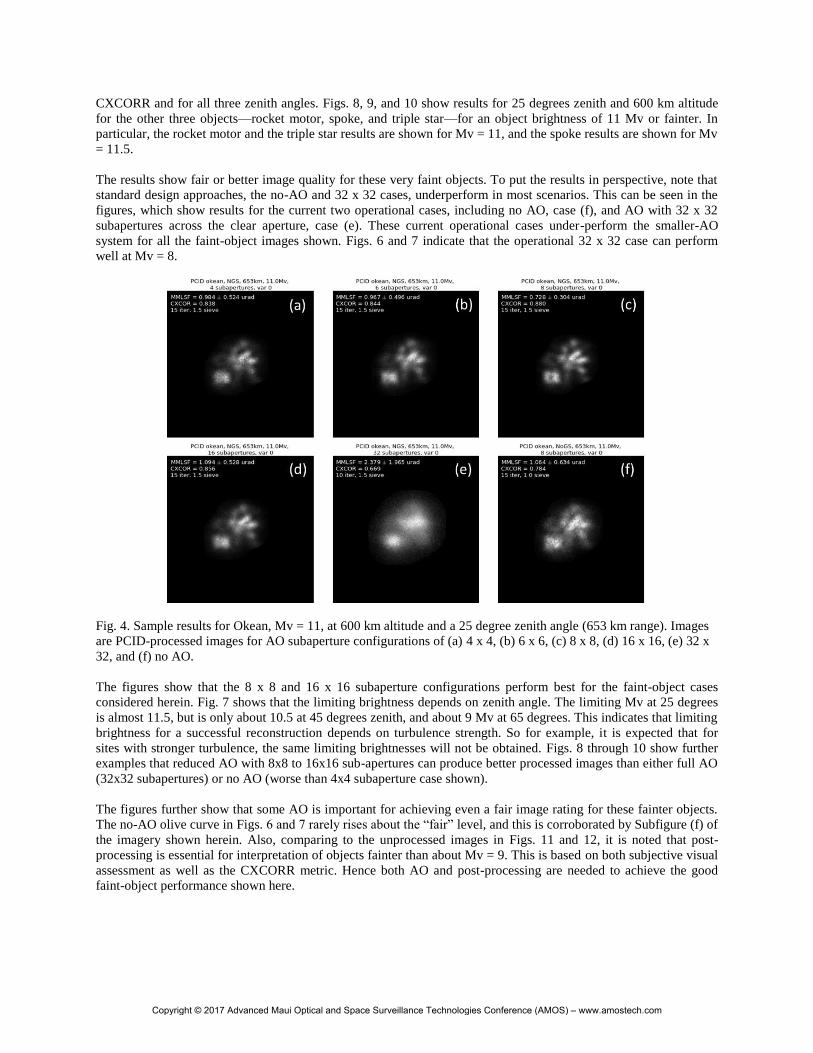
Fig. 4 shows results for 25 degrees zenith and 600 km altitude for various AO configurations for Okean with an
object brightness of 11 Mv. Performance is quantified using a cross-correlation (CXCORR) of the reconstructed
object with the diffraction-limited image, as well as an edge-spread metric (MMLSF) [18, 19]. The CXCORR metric
seems to have a good correlation with a human analyst’s assessments for high-contrast objects such as Okean. A
CXCORR of 0.83 or more has been deemed “fair” by analysts for Okean in this study [20]. The MMSLF metric is a
good measure of resolution measured in microradians, based on the sharpness of edges of the object, and so is truth-
independent. These metrics, as well as the multi-frame blind deconvolution (MFBD) iteration number corresponding
to the best reconstructed image, are shown in the figures.
Fig. 5 shows images for the same conditions except 45 degrees zenith and Mv = 10. Fig. 6 shows plots of the
CXCORR and MMSLF metrics for Okean at 25 degrees zenith angle. Fig. 7 shows similar plots, this time just for
Copyright © 2017 Advanced Maui Optical and Space Surveillance Technologies Conference (AMOS) – www.amostech.com
CXCORR and for all three zenith angles. Figs. 8, 9, and 10 show results for 25 degrees zenith and 600 km altitude
for the other three objects—rocket motor, spoke, and triple star—for an object brightness of 11 Mv or fainter. In
particular, the rocket motor and the triple star results are shown for Mv = 11, and the spoke results are shown for Mv
= 11.5.
The results show fair or better image quality for these very faint objects. To put the results in perspective, note that
standard design approaches, the no-AO and 32 x 32 cases, underperform in most scenarios. This can be seen in the
figures, which show results for the current two operational cases, including no AO, case (f), and AO with 32 x 32
subapertures across the clear aperture, case (e). These current operational cases under-perform the smaller-AO
system for all the faint-object images shown. Figs. 6 and 7 indicate that the operational 32 x 32 case can perform
well at Mv = 8.
Fig. 4. Sample results for Okean, Mv = 11, at 600 km altitude and a 25 degree zenith angle (653 km range). Images
are PCID-processed images for AO subaperture configurations of (a) 4 x 4, (b) 6 x 6, (c) 8 x 8, (d) 16 x 16, (e) 32 x
32, and (f) no AO.
The figures show that the 8 x 8 and 16 x 16 subaperture configurations perform best for the faint-object cases
considered herein. Fig. 7 shows that the limiting brightness depends on zenith angle. The limiting Mv at 25 degrees
is almost 11.5, but is only about 10.5 at 45 degrees zenith, and about 9 Mv at 65 degrees. This indicates that limiting
brightness for a successful reconstruction depends on turbulence strength. So for example, it is expected that for
sites with stronger turbulence, the same limiting brightnesses will not be obtained. Figs. 8 through 10 show further
examples that reduced AO with 8x8 to 16x16 sub-apertures can produce better processed images than either full AO
(32x32 subapertures) or no AO (worse than 4x4 subaperture case shown).
The figures further show that some AO is important for achieving even a fair image rating for these fainter objects.
The no-AO olive curve in Figs. 6 and 7 rarely rises about the “fair” level, and this is corroborated by Subfigure (f) of
the imagery shown herein. Also, comparing to the unprocessed images in Figs. 11 and 12, it is noted that post-
processing is essential for interpretation of objects fainter than about Mv = 9. This is based on both subjective visual
assessment as well as the CXCORR metric. Hence both AO and post-processing are needed to achieve the good
faint-object performance shown here.
Copyright © 2017 Advanced Maui Optical and Space Surveillance Technologies Conference (AMOS) – www.amostech.com

(a) (b) (c)
(d) (e) (f)
Fig. 5. Sample results for Okean, Mv = 10, at 600 km altitude and a 45 degree zenith angle (653 km range). Images
are PCID-processed images for AO subaperture configurations of (a) 4 x 4, (b) 6 x 6, (c) 8 x 8, (d) 16 x 16, (e) 32 x
32, and (f) no AO.
4x4
6x6
8x8
16x16
32x32
No AO
4x4
6x6
8x8
16x16
32x32
No AO
Fig. 6. Image metrics for Okean, Mv = 10, at 600 km altitude and a 25 degree zenith angle (653 km range).
4x4
6x6
8x8
16x16
32x32
No AO
4x4
6x6
8x8
16x16
32x32
No AO
4x4
6x6
8x8
16x16
32x32
No AO
(a) (b) (c)
Fig. 7. Image Metric CXCORR versus object brightness for Okean at 600 km altitude for 25, 45, and 65 degree
zenith angles for sub-figures (a), (b), and (c) respectively.
Copyright © 2017 Advanced Maui Optical and Space Surveillance Technologies Conference (AMOS) – www.amostech.com

Fig. 8. Sample results for rocket motor, Mv = 11, at 600 km altitude and a 25 degree zenith angle (653 km range).
Images are PCID-processed images for AO subaperture configurations of (a) 4 x 4, (b) 6 x 6, (c) 8 x 8, (d) 16 x 16,
(e) 32 x 32, and (f) no AO.
Fig. 9. Sample results for spoke, Mv = 11.5 at 600 km altitude and a 45 degree zenith angle (653 km range). Images
are PCID-processed images for AO subaperture configurations of (a) 4 x 4, (b) 6 x 6, (c) 8 x 8, (d) 16 x 16, (e) 32 x
32, and (f) no AO.
Copyright © 2017 Advanced Maui Optical and Space Surveillance Technologies Conference (AMOS) – www.amostech.com
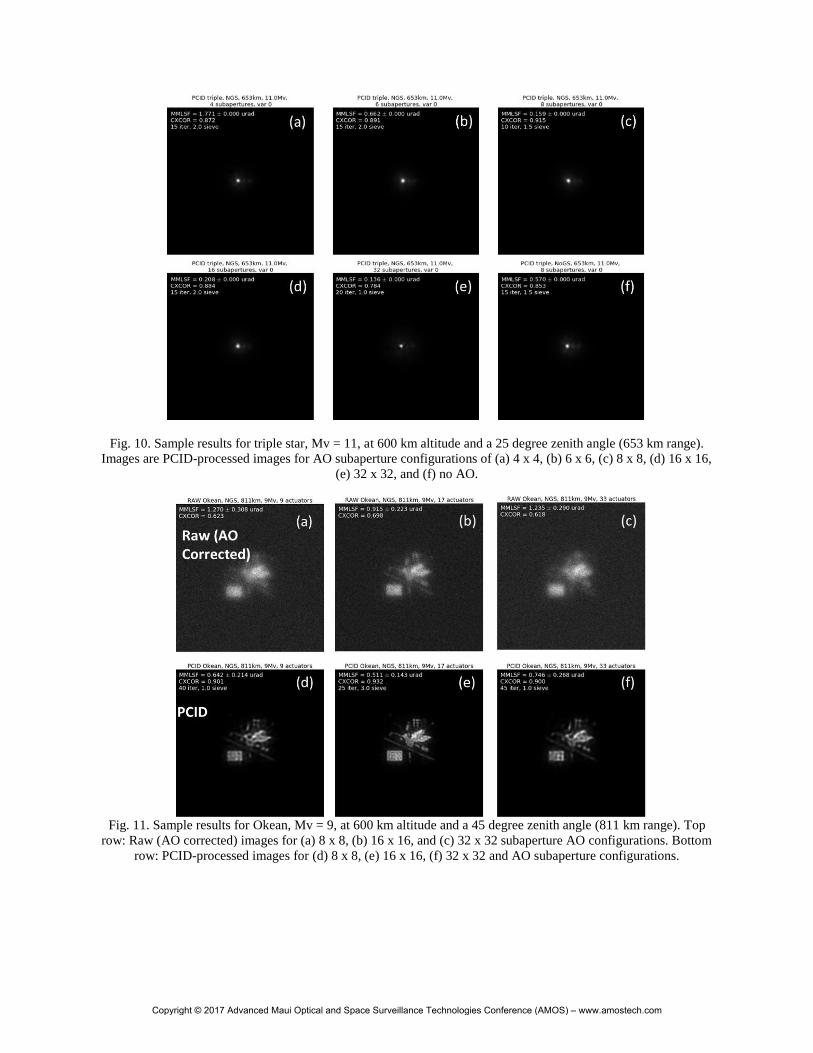
Fig. 10. Sample results for triple star, Mv = 11, at 600 km altitude and a 25 degree zenith angle (653 km range).
Images are PCID-processed images for AO subaperture configurations of (a) 4 x 4, (b) 6 x 6, (c) 8 x 8, (d) 16 x 16,
(e) 32 x 32, and (f) no AO.
Fig. 11. Sample results for Okean, Mv = 9, at 600 km altitude and a 45 degree zenith angle (811 km range). Top
row: Raw (AO corrected) images for (a) 8 x 8, (b) 16 x 16, and (c) 32 x 32 subaperture AO configurations. Bottom
row: PCID-processed images for (d) 8 x 8, (e) 16 x 16, (f) 32 x 32 and AO subaperture configurations.
Copyright © 2017 Advanced Maui Optical and Space Surveillance Technologies Conference (AMOS) – www.amostech.com
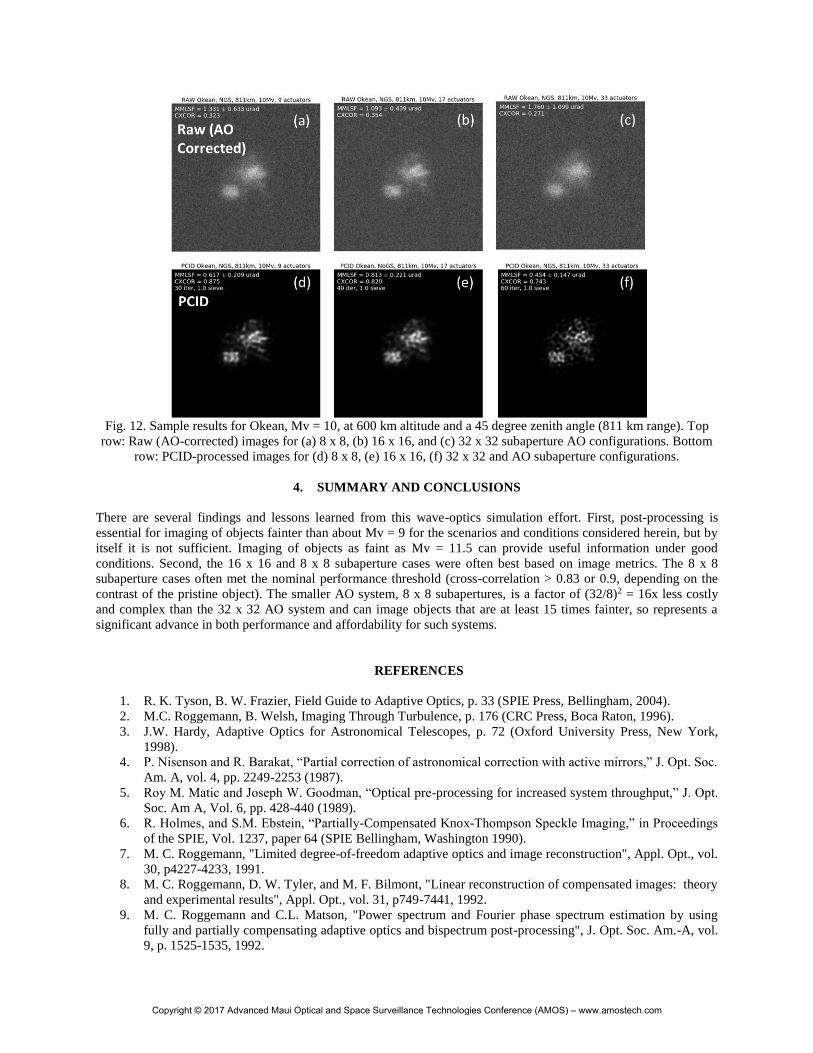
Fig. 12. Sample results for Okean, Mv = 10, at 600 km altitude and a 45 degree zenith angle (811 km range). Top
row: Raw (AO-corrected) images for (a) 8 x 8, (b) 16 x 16, and (c) 32 x 32 subaperture AO configurations. Bottom
row: PCID-processed images for (d) 8 x 8, (e) 16 x 16, (f) 32 x 32 and AO subaperture configurations.
4. SUMMARY AND CONCLUSIONS
There are several findings and lessons learned from this wave-optics simulation effort. First, post-processing is
essential for imaging of objects fainter than about Mv = 9 for the scenarios and conditions considered herein, but by
itself it is not sufficient. Imaging of objects as faint as Mv = 11.5 can provide useful information under good
conditions. Second, the 16 x 16 and 8 x 8 subaperture cases were often best based on image metrics. The 8 x 8
subaperture cases often met the nominal performance threshold (cross-correlation > 0.83 or 0.9, depending on the
contrast of the pristine object). The smaller AO system, 8 x 8 subapertures, is a factor of (32/8)2 = 16x less costly
and complex than the 32 x 32 AO system and can image objects that are at least 15 times fainter, so represents a
significant advance in both performance and affordability for such systems.
REFERENCES
1. R. K. Tyson, B. W. Frazier, Field Guide to Adaptive Optics, p. 33 (SPIE Press, Bellingham, 2004).
2. M.C. Roggemann, B. Welsh, Imaging Through Turbulence, p. 176 (CRC Press, Boca Raton, 1996).
3. J.W. Hardy, Adaptive Optics for Astronomical Telescopes, p. 72 (Oxford University Press, New York,
1998).
4. P. Nisenson and R. Barakat, “Partial correction of astronomical correction with active mirrors,” J. Opt. Soc.
Am. A, vol. 4, pp. 2249-2253 (1987).
5. Roy M. Matic and Joseph W. Goodman, “Optical pre-processing for increased system throughput,” J. Opt.
Soc. Am A, Vol. 6, pp. 428-440 (1989).
6. R. Holmes, and S.M. Ebstein, “Partially-Compensated Knox-Thompson Speckle Imaging,” in Proceedings
of the SPIE, Vol. 1237, paper 64 (SPIE Bellingham, Washington 1990).
7. M. C. Roggemann, "Limited degree-of-freedom adaptive optics and image reconstruction", Appl. Opt., vol.
30, p4227-4233, 1991.
8. M. C. Roggemann, D. W. Tyler, and M. F. Bilmont, "Linear reconstruction of compensated images: theory
and experimental results", Appl. Opt., vol. 31, p749-7441, 1992.
9. M. C. Roggemann and C.L. Matson, "Power spectrum and Fourier phase spectrum estimation by using
fully and partially compensating adaptive optics and bispectrum post-processing", J. Opt. Soc. Am.-A, vol.
9, p. 1525-1535, 1992.
Copyright © 2017 Advanced Maui Optical and Space Surveillance Technologies Conference (AMOS) – www.amostech.com

10. R.R. Parenti and R. J. Sasiela, “Laser-guide-star systems for astronomical applications,” J. Opt. Soc. Am.
A, vol. 11, p. 288-309 (1994).
11. C. Matson, C. Beckner, K. Borelli, S. Jeffries, E. Hege, M. Lloyd-Hart, “A Fast and Optimal Multi-Frame
Blind Deconvolution Algorithm for High-Resolution Ground-Based Imaging of Space Objects.” Appl.
Opt., 48, A75-A92 (2009).
12. D. Thompson, B. Calef, M. Werth, “Performance Comparison of Optimization Methods for Blind
Deconvolution.” AMOS Conference Technical Proceedings (2016).
13. V. S. Rao Gudimetla, Richard B. Holmes, Carey Smith, and Gregory Needham, “Analytical expressions for
the log-amplitude correlation function of a plane wave through anisotropic atmospheric refractive
turbulence,” J. Opt. Soc. Am. A, Vol. 29, pp. 832-841 (2012).
14. V. S. Rao Gudimetla, Richard B. Holmes, James Riker, “Analytical expressions for the log-amplitude
correlation function for spherical-wave propagation through anisotropic non-Kolmogorov refractive
turbulence,” JOSA A 31, pp. 148–154 (2014).
15. V. I. Talanov, “Focusing of light in cubic media,” JETP Lett. 1, 199–201 (1970).
16. M. C. Roggemann and B. M. Welsh, "Signal-to-noise ratio for astronomical imaging by deconvolution
from wavefront sensing", Appl. Opt., vol. 33, pp. 5400-5414, 1994.
17. L. W, Bradford, “Maui4: a 24 hour Haleakala turbulence profile,” AMOS Conference Technical
Proceedings (2010).
18. J. R. Fienup, “Invariant error metrics for image reconstruction,” Appl. Opt., vol. 36, pp. 8352-8357 (1997).
19. M. Werth, B. Calef, D. Thompson, S. Williams, S. Williams, ‘Performance of Hybrid Adaptive Optics
Systems,” AMOS Conference Technical Proceedings (2016).
20. M. Werth, M. Abercrombie, M. Patterson, R. Holmes, “Connecting Objective Image Quality Scores to
Subjective Analyst Ratings,” MAOII-TEM-013 (January 2017).
Copyright © 2017 Advanced Maui Optical and Space Surveillance Technologies Conference (AMOS) – www.amostech.com