Simulation Study of Underground Coal Gasification in ... · PDF fileSimulation Study of...
11
3540 r2010 American Chemical Society pubs.acs.org/EF Energy Fuels 2010, 24, 3540–3550 : DOI:10.1021/ef9013828 Published on Web 05/13/2010 Simulation Study of Underground Coal Gasification in Alberta Reservoirs: Geological Structure and Process Modeling Hossein Nourozieh, Mohammad Kariznovi, Zhangxin Chen, and Jalal Abedi* Department of Chemical and Petroleum Engineering, University of Calgary, 2500 University Drive, Northwest, Calgary, Alberta T2N 1N4, Canada Received November 16, 2009. Revised Manuscript Received April 19, 2010 Underground coal gasification (UCG) as an efficient method for the conversion of the world’s coal resources into energy, liquid fuels, and chemicals has attracted lots of attention in recent years. This paper is concerned with a feasibility study of the UCG process for Alberta reservoirs using the three-dimensional simulation of this process based on a unique porous media approach. The proposed approach combines the effects of heat, mass transport, and chemical reactions to achieve this goal. The Computer Modeling Group (CMG) software STARS is used for simulation. The geological structure including coal and layers interspersed between coal seams (claystone layers), the porosity/permeability variation, and the chemical processes with corresponding parameters are considered in the model. Chemical stoichiometry coefficients of the pyrolysis process are calculated from proximate and extended experimental data. Genetic algorithm and pattern search are used for parameter estimation. This model is developed to study UCG in deep coal seams and can be used for production prediction and optimization of the process. The simulation results, such as cavity formation, temperature profile, and gas composition at the producer, are presented. Finally, the results are analyzed on the basis of field pilot tests. Introduction Coal is a major fossil fuel in the world and plays a critical role in the energy sector. Canada is ranked 10th worldwide in coal reserves, and Alberta’s 33.6 billion tons of proven mine- able coal represents 70% of Canada’s reserves. The deep, stranded coal reserves in Canada, which are not part of the coal reserve base, exceed 600 billion tons in Alberta alone. 1 Consequently, Alberta’s coal resources constitute an enor- mous source of untapped energy. Therefore, there is a need for the development of novel technologies for the use of coal efficiently and cleanly. The underground coal gasification (UCG) technique can be applied to convert the abundant coal resources into a synthetic gas. The process involves the injection of steam and air or oxygen into an underground coal seam and igniting and burning of coal in situ to produce the combustible gas that can be used as either a fuel or a chemical feedstock. UCG has the advantages of high safety, low cost, high efficiency, environmental friendliness, and a high return rate compared to the surface gasification. 2 In addition, it can be applied to deep and thin coal seams that are not economic for mining. The research goals for a recovery process are to find its potential benefits and to address the most significant issues before a field scale test. Experimental studies on UCG are time-consuming and expensive. Thus, computer modeling can be used as an alternative to study this process. In addition, modeling can be considered as an important step for the feasibility study, design, and prediction of the process in the field scale. The UCG process involves complex physical and chemical phenomena, such as mass and heat transport, che- mical reactions, and geomechanical behavior. 3,4 For the time being, the computer modeling is the only tool to achieve a comprehensive and quantitative understanding of such a complex process. All in situ gasification processes include drilling of injection and production wells into coal seams. Then, steam/oxygen or air is injected from the injector, and synthetic gases (syngas) are produced from the producer. Different techniques can be applied for a gasification process, depending upon the coal seam geological structure and technical issues involved. Two main techniques currently used by industry for UCG are linked vertical wells and controlled retracting injection points (CRIPs). The first technique requires drilling of vertical injection and production wells that are linked by a high permeable channel. This relatively old technique is suitable for thick seams and suffers from a number of operational handicaps. For instance, the burning zone and roof collapse lead to bypassing of oxygen and lowering of produced gas quality. The relatively new technique CRIP, 5 suitable for thin, deep coal seams, replaces the vertical injector by a horizontal *To whom correspondence should be addressed: 2500 University Dr., NW, Calgary, Alberta T2N 1N4, Canada. Telephone: 403-220-5594. E-mail: [email protected]. (1) Energy Resources Conservation Board. Alberta’s energy reserves 2007 and supply/demand outlook 2008-2017. ST98-2008, Calgary, Alberta, Canada, http://www.ercb.ca/docs/products/sts/st98-2008.pdf (accessed June 2008). (2) Yang, L. H.; Yu, L.; Liang, J. Underground coal gasification in abandoned coal mines and comprehensive utility of gas products. Coal Min. World 1995, 16 (1), 20–24. (3) Yang, L.; Liu, S. Numerical simulation on heat and mass transfer in the process of underground coal gasification. Numer. Heat Transfer, Part A 2003, 44 (5), 537–557. (4) Perkins, G.; Sahajwalla, V. A mathematical model for the chemi- cal reaction of a semi-infinite block of coal in underground coal gasification. Energy Fuels 2005, 19 (4), 1679–1692. (5) Hill, R. W.; Shannon, M. J. The controlled retracting injection point (CRIP) system: A modified stream method for in situ coal gasification. UCRL-85852, Lawrence Livermore National Laboratory (LLNL) Report, Berkeley, CA, 1981.
Transcript of Simulation Study of Underground Coal Gasification in ... · PDF fileSimulation Study of...

3540r 2010 American Chemical Society pubs.acs.org/EF
Energy Fuels 2010, 24, 3540–3550 : DOI:10.1021/ef9013828Published on Web 05/13/2010
Simulation Study of Underground Coal Gasification in Alberta Reservoirs:
Geological Structure and Process Modeling
Hossein Nourozieh, Mohammad Kariznovi, Zhangxin Chen, and Jalal Abedi*
Department of Chemical and Petroleum Engineering, University of Calgary, 2500 University Drive, Northwest, Calgary,Alberta T2N 1N4, Canada
Received November 16, 2009. Revised Manuscript Received April 19, 2010
Underground coal gasification (UCG) as an efficient method for the conversion of the world’s coalresources into energy, liquid fuels, and chemicals has attracted lots of attention in recent years. This paperis concerned with a feasibility study of theUCGprocess for Alberta reservoirs using the three-dimensionalsimulation of this process based on a unique porous media approach. The proposed approach combinesthe effects of heat, mass transport, and chemical reactions to achieve this goal. The Computer ModelingGroup (CMG) software STARS is used for simulation. The geological structure including coal and layersinterspersed between coal seams (claystone layers), the porosity/permeability variation, and the chemicalprocesses with corresponding parameters are considered in themodel. Chemical stoichiometry coefficientsof the pyrolysis process are calculated from proximate and extended experimental data. Genetic algorithmand pattern search are used for parameter estimation. This model is developed to study UCG in deep coalseams and can be used for production prediction and optimization of the process. The simulation results,such as cavity formation, temperature profile, and gas composition at the producer, are presented. Finally,the results are analyzed on the basis of field pilot tests.
Introduction
Coal is a major fossil fuel in the world and plays a criticalrole in the energy sector. Canada is ranked 10th worldwide incoal reserves, and Alberta’s 33.6 billion tons of proven mine-able coal represents 70% of Canada’s reserves. The deep,stranded coal reserves in Canada, which are not part of thecoal reserve base, exceed 600 billion tons in Alberta alone.1
Consequently, Alberta’s coal resources constitute an enor-mous source of untapped energy.Therefore, there is a need forthe development of novel technologies for the use of coalefficiently and cleanly. The underground coal gasification(UCG) technique can be applied to convert the abundantcoal resources into a synthetic gas. The process involves theinjection of steam and air or oxygen into an underground coalseam and igniting and burning of coal in situ to produce thecombustible gas that can be used as either a fuel or a chemicalfeedstock. UCG has the advantages of high safety, low cost,high efficiency, environmental friendliness, and a high returnrate compared to the surface gasification.2 In addition, it canbe applied to deep and thin coal seams that are not economicfor mining.
The research goals for a recovery process are to find itspotential benefits and to address the most significant issuesbefore a field scale test. Experimental studies on UCG aretime-consuming and expensive. Thus, computermodeling can
be used as an alternative to study this process. In addition,modeling can be considered as an important step for thefeasibility study, design, and prediction of the process in thefield scale. The UCG process involves complex physical andchemical phenomena, such as mass and heat transport, che-mical reactions, and geomechanical behavior.3,4 For the timebeing, the computer modeling is the only tool to achieve acomprehensive and quantitative understanding of such acomplex process.
All in situ gasification processes include drilling of injectionand production wells into coal seams. Then, steam/oxygen orair is injected from the injector, and synthetic gases (syngas)are produced from the producer. Different techniques can beapplied for a gasification process, depending upon the coalseam geological structure and technical issues involved. Twomain techniques currently used by industry for UCG arelinked vertical wells and controlled retracting injection points(CRIPs). The first technique requires drilling of verticalinjection and production wells that are linked by a highpermeable channel. This relatively old technique is suitablefor thick seams and suffers from a number of operationalhandicaps. For instance, the burning zone and roof collapselead to bypassing of oxygen and lowering of produced gasquality. The relatively new technique CRIP,5 suitable for thin,deep coal seams, replaces the vertical injector by a horizontal
*Towhomcorrespondence should be addressed: 2500UniversityDr.,NW, Calgary, Alberta T2N 1N4, Canada. Telephone: 403-220-5594.E-mail: [email protected].(1) Energy Resources Conservation Board. Alberta’s energy reserves
2007 and supply/demand outlook 2008-2017. ST98-2008, Calgary,Alberta, Canada, http://www.ercb.ca/docs/products/sts/st98-2008.pdf(accessed June 2008).(2) Yang, L. H.; Yu, L.; Liang, J. Underground coal gasification in
abandoned coal mines and comprehensive utility of gas products. CoalMin. World 1995, 16 (1), 20–24.
(3) Yang, L.; Liu, S. Numerical simulation on heat and mass transferin the process of underground coal gasification. Numer. Heat Transfer,Part A 2003, 44 (5), 537–557.
(4) Perkins, G.; Sahajwalla, V. A mathematical model for the chemi-cal reaction of a semi-infinite block of coal in underground coalgasification. Energy Fuels 2005, 19 (4), 1679–1692.
(5) Hill, R. W.; Shannon, M. J. The controlled retracting injectionpoint (CRIP) system: A modified stream method for in situ coalgasification. UCRL-85852, Lawrence Livermore National Laboratory(LLNL) Report, Berkeley, CA, 1981.

3541
Energy Fuels 2010, 24, 3540–3550 : DOI:10.1021/ef9013828 Nourozieh et al.
injector. During the gasification process, the burning zonegrows in the upstream direction, in contrast to the gas flow inthe horizontal direction. This occurs by cutting off or perfor-ating the injection linear at successive newupstream locations.The CRIP technique produces higher quality gas, results inlower heat loss than the two-vertical well configuration, andimproves the overall efficiency of the UCG process, as shownby the Rocky Mountain I (RM I) field test.6
UCGmodels of differing complexity have been reported inthe literature. More complex models often give better predic-tion compared to simple models; however, the computationaltime increases considerably. Generally, two main approacheshave been considered formodeling: the packed bedmodel andchannel model. The former assumes that coal gasificationoccurs in highly permeable porous media with a stationarycoal bed. To obtain reliable results, it is necessary to use finegrids or adaptive grid refinement in the vicinity of the front,which causes some limitation for field applications. In addi-tion, these methods cannot clearly model the cavity growth.The latter approach assumes that, during UCG, a permeablechannel or a cylindrical cavity is expanding, in which thegasification occurred in the channel or cylinder wall. Thesekinds of models7-20 were based on the one-dimensionalmodeling of UCG using a computational fluid dynamics
(CFD) approach. A few21 have considered the three-dimen-sional modeling of the UCG process with some assumptions,such as the absence of the heat-transfer calculation or aconstant gasification temperature. A distinguishing featureof three-dimensional modeling is that the physical and che-mical phenomena, such as mass and heat transport, chemicalreactions, and geomechanical behavior, become far morecomplex.
This study considers the three-dimensional modeling ofUCG using a comprehensive porous media flow approach.Themodel involvesmore than 10 chemical reactions, themainreactions that can realistically model the UCG process. Thesechemical processes are coupled with the mass- and heat-transfer equations. The coal seam under study is thin anddeep. Therefore, the CRIP technique is appropriate andapplied for the UCG modeling and prediction. The principalobjectives of this work are to use the Computer ModelingGroup (CMG) software STARS to carry out a feasibilitystudy on the applicability of UCG for this coal seam inAlberta and to study reservoir and operational data that arenecessary for a complete and full simulation of UCG. Thesedata include the geological structure, chemical reaction rates,heat- and mass-transfer phenomena, thermal properties, andignition procedure.
This paper consists of four sections: The first sectionconsiders the geological structure, porosity and permeabilityvariation modeling, and thermal properties of seam layers.The next section provides a short description of the chemicalprocesses occurring during UCG and the modeling of theseprocesses. The third section reviews the governing equationsfor heat and mass transport followed by the model specifica-tions and ignition procedure. Finally, results, discussions, andconclusions will be presented.
Geological Structure of Seam Layers
The geological structure of coal seams including the seamsubdivision is essential for the UCG simulation study. Thecoal seam under study is 9 m thick and consists of nine layers.These layers have different properties, and considering alllayers with very specific properties within aUCGmodel leadsto high computational time. As estimation, all coal layers areconsidered to have almost the same physical properties.Similarly, all claystone layers are treated as the layers withthe same properties. In addition, thin layers (either coal orclaystone layers) are incorporated into other layers to ignorevery thin layers within the model. Two coal layers have athickness of less than30 cm; therefore, they are combinedwithother coal layers to form three coal layers and for a total ofseven layers in the coal seam. The aim of incorporating thelayers is to decrease the simulation time, so that it is possible torun the field scale simulation; therefore, two sets of propertiesfor coal and claystone layers are defined on the basis of theaveragedproperties of different layers.Figure 1 shows the coaland claystone layers after considering these two sets of proper-ties for all layers. The layers interspersed between coal seamsare mostly claystone with 0.5 m thickness. The overall thick-ness of coal layers is 7 m, and the upper subseam coal layer isthe thickest (3.5 m). The average proximate analysis of thecoal under study is summarized inTable 1. The coal is a highlyvolatile bituminous coalwith a high fixed carbon content, andthe interspersed layers are mostly claystone.
Porosity Calculation. The porosity of coal for differentlayers is unknown, and it is required for themodelingpurpose.
(6) Thorsness, C. B.; Hill, R. W.; Britten, J. A. Execution andperformance of the CRIP process during the Rocky Mountain I UCGfield test. UCRL-98641, Lawrence Livermore National Laboratory(LLNL) Report, Berkeley, CA, 1988.(7) Tsang, T. H. T. Modeling of heat and mass transfer during coal
block gasification. Ph.D. Dissertation, University of Texas at Austin,Austin, TX, 1980.(8) Massaquoi, J. G. M.; Riggs, J. B. Mathematical modeling of
combustion and gasification of a wet coal slab—I: Model developmentand verification. Chem. Eng. Sci. 1983, 38 (10), 1747–1756.(9) Massaquoi, J. G. M.; Riggs, J. B. Mathematical modeling of
combustion and gasification of a wet coal slab—II: Mode of combus-tion, steady state multiplicities and extinction. Chem. Eng. Sci. 1983, 38(10), 1757–1766.(10) Beath, A. C.; Wendt, M.; Mallett, C. Underground coal gasifica-
tion as a method for reducing the greenhouse impact of coal utilization.Proceedings of the 5th International Conference on Greenhouse GasControl Technologies, Cairns, Queensland, Australia, Aug 13-16, 2000.(11) Winslow,A.M.Numericalmodel of coal gasification in a packed
bed. UCRL-77627, Lawrence Livermore National Laboratory (LLNL)Report, Berkeley, CA, 1976.(12) Thorsness, C. B.; Grens, E. A.; Sherwood, A. A one-dimensional
model for in situ coal combustion. UCRL-52523, Lawrence LivermoreNational Laboratory (LLNL) Report, Berkeley, CA, 1978.(13) Abdel-Hadi, E. A. A.; Hsu, T. R. Computer modeling of fixed
bed underground coal gasification using the permeation method.J. Energy Resour. Technol. 1987, 109 (1), 11–20.(14) Coeme, A.; Pirard, J.-P.; Mostade, M. Modeling of the chemical
processes in a longwall face underground gasifier at great depth. In Situ1993, 17 (1), 83–104.(15) Dinsmoor, B.; Galland, J. M.; Edgar, T. F. The modeling of
cavity formation during underground coal gasification. J. Pet. Technol.1978, 30 (5), 695–704.(16) Kreinin, E. V.; Shifrin, E. I. Mathematical modeling of the gas
generation process in a coal reaction chamber. J. Min. Sci. 1995, 31 (3),230–236.(17) van Batenburg, D. W. Heat and mass transfer during under-
ground gasification of thin deep coal seams. Ph.D. Dissertation, DelftUniversity of Technology, Delft, The Netherlands, 1992.(18) Thorsness, C. B.; Cena, R. J. An underground coal gasification
cavity simulator with solid motion. UCRL-89084, Lawrence LivermoreNational Laboratory (LLNL) Report, Berkeley, CA, 1983.(19) Eddy, T. L.; Schwartz, S. H. A side wall burn model for cavity
growth in underground coal gasification. J. Energy Resour. Technol.1983, 105 (2), 145–155.(20) Himmelblau, D. M.; Chang, H. L.; Edgar, T. F. A sweep
efficiency model for underground coal gasification. In Situ 1985, 9 (2),185–221.(21) Biezen, E. N. J. Modeling underground coal gasification. Ph.D.
Dissertation, Delft University of. Technology, Delft, The Netherlands,1996.

3542
Energy Fuels 2010, 24, 3540–3550 : DOI:10.1021/ef9013828 Nourozieh et al.
One way to calculate the coal porosity is through the bulkdensity,which ismeasuredby theultimateanalysis.Theassump-tion made here is that the known volume of coal contains ash,water, volatile, carbon, andvoid space (porosity).Thus, thebulkdensity, ash density, and pseudo-density of volatile/carbon arerequired to obtain the porosity of different layers.
The ash density and pseudo-density of volatile/carbon areunknown for all layers. The bulk volume consists of ash,volatile/carbon, water, and void volume. Thus
volume ¼ mass of ash
Fashþmass of carbonþ volatiles
Fpseudo
þmass of water
FH2O
þ void space ð1Þ
Themass of each part can be determined on the basis of 100 gof coal from a proximate analysis. For instance, the mass ofash is
mass of ash ¼ bulk density� volume�mass fraction ð2Þ
Theashdensity andpseudo-density of volatile/carbon canbedetermined by eqs 1 and 2 and the results from the proximateand ultimate analyses. The generic algorithm and patternsearch method are applied to obtain Fash, Fpseudo, and voidspace. Table 2 summarizes the average value of void space for
both coal and claystone layers, with the corresponding valuesfor the ash density and pseudo-density of volatile/carbon.
Porosity Variation. The porosity of a grid block dependsupon its solid concentration. When either pyrolysis or gasifi-cation takes place, the amount of solid inside a grid blockdecreases and the corresponding porosity increases. Themodel considered here for the variation of porosity with thesolid concentration is based on the volume calculation. Thecurrent porosity is a function of the initial porosity, density,and concentration of solid inside each grid block. The pre-vious section discussed the calculation of the averaged initialporosity and density of both coal and claystone layers.
Consider a grid block with an initial porosity of φv andsolid concentration ofCs. Assuming that the solid has a puredensity of Fs, then the current porosity is
φfluid ¼ φv 1-Cs
Fs
!ð3Þ
This current porosity will vary with time as Cs decreases.
Figure 1. Incorporated coal seam layers.
Table 1. Average Proximate Analysis for Coal and Claystone Layers
coal claystone
fixed carbon 55.61 4.92volatile matter 30.36 9.05ash 9.20 82.88moisture 4.83 3.15
Table 2. Calculated Porosity andDensity for the Incorporated Layers
density (kg/m3)
layer
layer
number
specific
gravity
bulk density
(g/cm3)
calculated
porosity
volatile þcarbon ash
claystone layers
1 1.31 1.90
0.05 1596 2794
3 1.92 2.46
5 1.28 2.26
7 2.48 2.39
9 2.38 2.48
coal seam
2 1.27 1.18
0.0866 1196 25894 2.43 1.28
6 2.27 1.14
8 1.28 1.22

3543
Energy Fuels 2010, 24, 3540–3550 : DOI:10.1021/ef9013828 Nourozieh et al.
Permeability Variation. The permeability is a function ofporosity; as the porosity increases, the permeability alsoincreases. The published data12 for theWyodak coal showedthat a logarithmic plot of permeability versus porosity is verynearly a linear function over the range studied. On thisempirical basis, a functional relationship is
lnk
k0¼ σðφ-φ0Þ ð4Þ
where σ is approximately equal to 12, k0 is the initialpermeability, and φ0 is the initial porosity.
Figure 2 shows the permeability variation versus porosityfor the Wyodak coal in a semi-log plot.12 The data approxi-mately indicates a straight line. This logarithmic approach isconsidered in our model for the permeability variation withrespect to porosity.
Thermal Properties of Layers. The thermal properties,such as thermal conductivity for different phases, must beassigned to model the heat transfer in the UCG model. Thefollowing equation is used to calculate the conductivity ofeach block based on various parts of the block:
Kblock ¼ ð1-φvÞKash þðφv -φfluidÞKsolid
þφfluidðSwKw þSgKgÞ ð5ÞThe thermal properties for different layers are taken fromMidttomme andRoaldset22 and given in Table 3. In eq 5, ashis defined as material that remained in the gird block aftergasification.
Chemical Processes
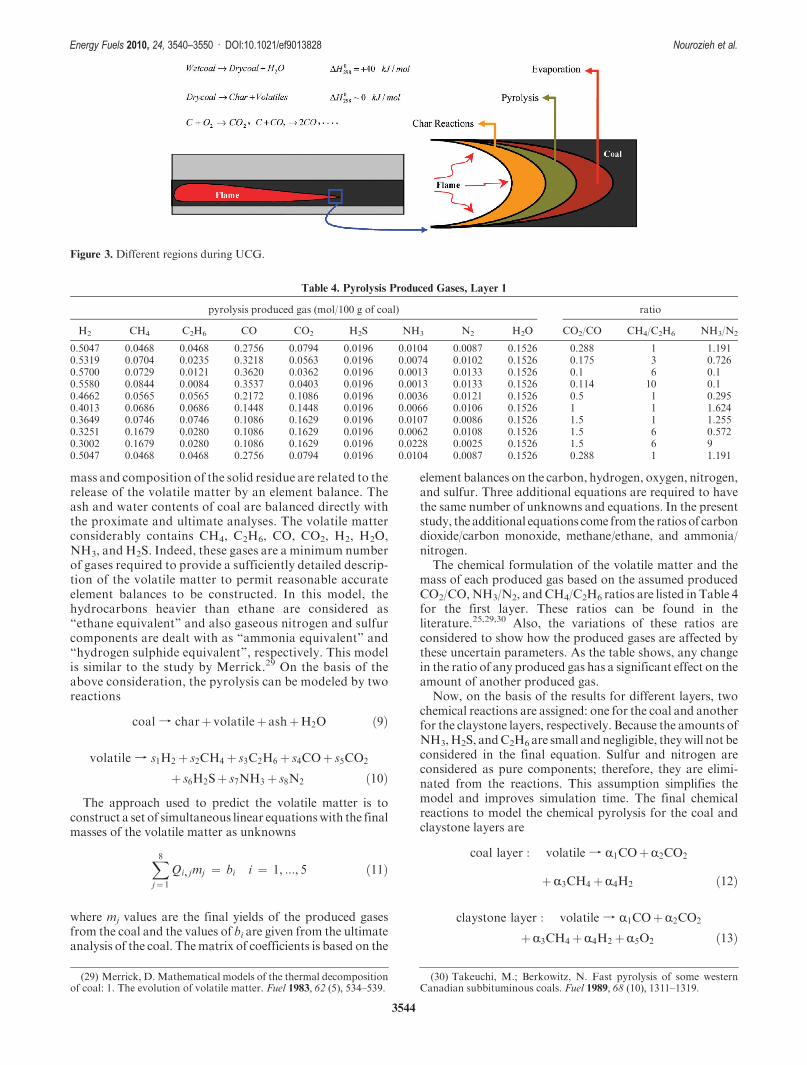
UCG consists of drying, pyrolysis, combustion, and gasi-fication of solid char. Figure 3 shows different regions duringcoal gasification in situ. In the first zone, which is drying (orevaporation), wet coal is converted into dry coal by increasingthe temperature over 100 �C.23 During pyrolysis, coal loses itsweight, generating volatile matters and solid that is called
char. On the basis of available experimental results, thevolatile matters from the coal decompose into tar, coal gas,and chemical water. Finally, the char reacts with the injected/pyrolyzed gases to produce the syngas.
Pyrolysis.Coal pyrolysis is a chemical process inwhich thecoal undergoes decomposition by increasing the tempera-ture. Pyrolysis takes place when the temperature in coal ishigher than the pyrolysis temperature. This process results ina series of reactions releasing volatile gases from the porouscoal matrix, over the temperature range of 400-900 �C24
dry coal f charþ volatiles ΔH0298 ∼ 0 kJ=mol ð6Þ
The yields of volatiles and their composition depend uponthe volatilematter content of coal, temperature, and pressureduring this process. Furthermore, different gases are evolvedat different temperatures during this process.25 To evaluateeach gas component, a kinetic model for this component isrequired, leading to a system of parallel reactions withdifferent kinetic parameters.7 To simplify the process, pyro-lysis is modeled by a simple Arrhenius expression. Therefore,the release of volatile matter is simulated as a combination ofcoal gases, which are evolved by increasing the temperature.Simplifying pyrolysis using a first-order chemical reactionintroduces some sort of error to our model; on the otherhand, using a more complicated model, more uncertainparameters (kinetic parameters) must be estimated, whichcan generate other errors.
Van Krevelen et al.26 considered the pyrolysis process as afirst-order chemical reaction
dξ=dt ¼ εðξo - ξÞ ð7Þwhere ξ is the volatile lost fraction of the original coal weightand ξo is the effective volatile content of the coal.
The rate constant in eq 7 is typically correlated with thetemperature by the Arrhenius expression
ε ¼ ε0e-E=RT ð8Þ
The experimental kinetic parameters for different coals aresummarized elsewhere.27,28 Experimental data are limited tolow pressure; therefore, it is necessary to extrapolate andestimate these data for high pressure.
Element Analysis of Coal Pyrolysis. In this study, therelease of volatile material from coal is modeled on the basisof the following consideration: All of the major componentsof the volatile matter are considered, and the changes in the
Figure 2.Permeability versus the change in porosity for theWyodakcoal during drying and pyrolysis.12
Table 3. Thermal Properties of Coal Seams and Claystone Layers
thermal conductivity (J m-1 day-1 C-1)
layer water gas coal ash
coal seam 48384 4000 2.5� 104 2.000� 105
claystone layers 48384 4000 2.5� 104 2.592� 105
(22) Midttomme, K.; Roaldset, E. Thermal conductivity of sedimen-tary rocks: Uncertainties in measurement and modelling. In Muds andMudstones: Physical and Fluid-Flow Properties; Aplin, A. C., Fleet, A. J.,Macquaker, J. H. S., Eds.; Geological Society of London: London, U.K.,1999; Vol. 158, pp 45-60.(23) Lyczkowski, R. W. Mechanistic theory for drying of porous
media. UCRL-52456, Lawrence Livermore National Laboratory(LLNL) Report, Berkeley, CA, 1978.
(24) Anthony, D. B.; Howard, J. B. Coal devolatilization and hydro-gasification. AIChE. J. 1976, 22 (4), 625–656.
(25) Campbell, J. H. Pyrolysis of subbituminous coal in relation to in-situ coal gasification. Fuel 1978, 57 (4), 217–224.
(26) Van Krevelen, D. W.; Van Heerden, C.; Huntjens, F. J. Physi-cochemical aspects of the pyrolysis of coal and related organic com-pounds. Fuel 1951, 30, 253–259.
(27) Nourozieh, H.; Kariznovi, M.; Chen, Z.; Abedi, J. Simulationstudy of underground coal gasification in deep coal seams. Proceedingsof the 8thWorld Congress of Chemical Engineering,Montreal, Quebec,Canada, Aug 23-27, 2009; 0040.
(28) Kariznovi, M.; Nourozieh, H.; Abedi, J.; Chen, Z. Simulationstudy of underground coal gasification in Alberta reserviors: Kineticparameter estimation. Fuel 2010, manuscript submitted.
3544
Energy Fuels 2010, 24, 3540–3550 : DOI:10.1021/ef9013828 Nourozieh et al.
mass and composition of the solid residue are related to therelease of the volatile matter by an element balance. Theash and water contents of coal are balanced directly withthe proximate and ultimate analyses. The volatile matterconsiderably contains CH4, C2H6, CO, CO2, H2, H2O,NH3, and H2S. Indeed, these gases are a minimum numberof gases required to provide a sufficiently detailed descrip-tion of the volatile matter to permit reasonable accurateelement balances to be constructed. In this model, thehydrocarbons heavier than ethane are considered as“ethane equivalent” and also gaseous nitrogen and sulfurcomponents are dealt with as “ammonia equivalent” and“hydrogen sulphide equivalent”, respectively. This modelis similar to the study by Merrick.29 On the basis of theabove consideration, the pyrolysis can be modeled by tworeactions
coal f charþ volatileþ ashþH2O ð9Þ
volatile f s1H2 þ s2CH4 þ s3C2H6 þ s4COþ s5CO2
þ s6H2Sþ s7NH3 þ s8N2 ð10ÞThe approach used to predict the volatile matter is to
construct a set of simultaneous linear equationswith the finalmasses of the volatile matter as unknowns
X8j¼ 1
Qi, jmj ¼ bi i ¼ 1, :::, 5 ð11Þ
where mj values are the final yields of the produced gasesfrom the coal and the values of bi are given from the ultimateanalysis of the coal. Thematrix of coefficients is based on the
element balances on the carbon, hydrogen, oxygen, nitrogen,and sulfur. Three additional equations are required to havethe same number of unknowns and equations. In the presentstudy, the additional equations come from the ratios of carbondioxide/carbon monoxide, methane/ethane, and ammonia/nitrogen.
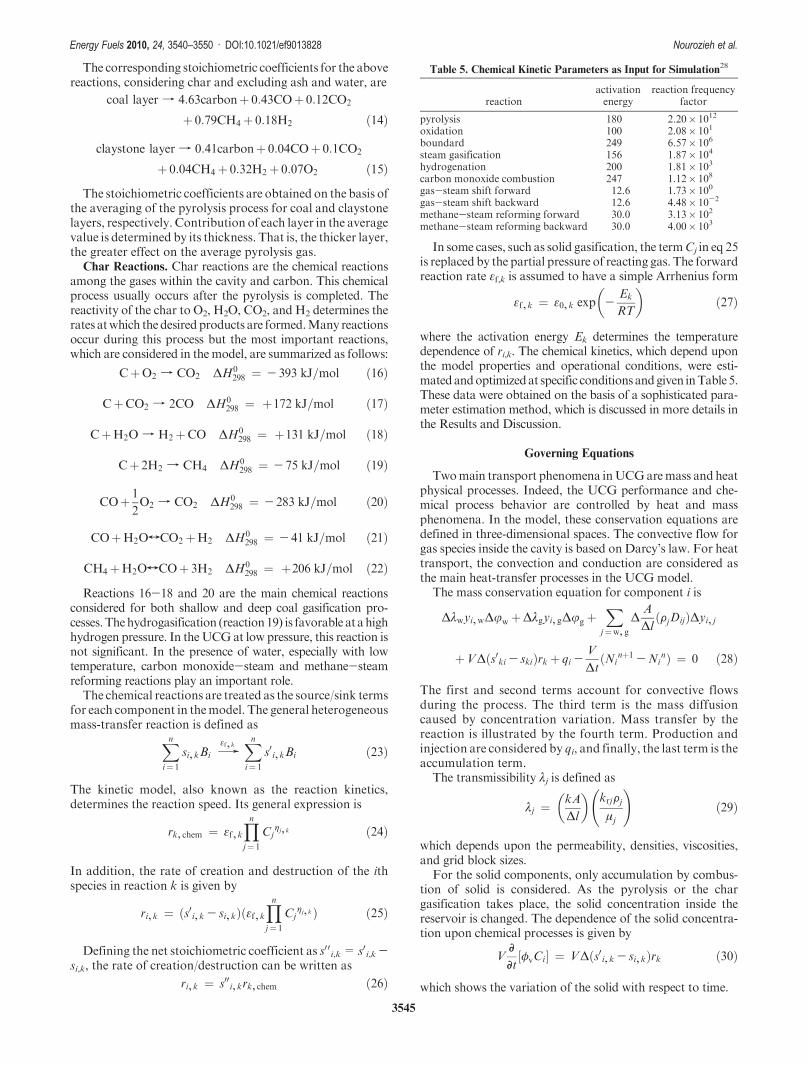
The chemical formulation of the volatile matter and themass of each produced gas based on the assumed producedCO2/CO,NH3/N2, andCH4/C2H6 ratios are listed in Table 4for the first layer. These ratios can be found in theliterature.25,29,30 Also, the variations of these ratios areconsidered to show how the produced gases are affected bythese uncertain parameters. As the table shows, any changein the ratio of any produced gas has a significant effect on theamount of another produced gas.
Now, on the basis of the results for different layers, twochemical reactions are assigned: one for the coal and anotherfor the claystone layers, respectively. Because the amounts ofNH3,H2S, andC2H6 are small and negligible, theywill not beconsidered in the final equation. Sulfur and nitrogen areconsidered as pure components; therefore, they are elimi-nated from the reactions. This assumption simplifies themodel and improves simulation time. The final chemicalreactions to model the chemical pyrolysis for the coal andclaystone layers are
coal layer : volatile f R1COþR2CO2
þR3CH4 þR4H2 ð12Þ
claystone layer : volatile f R1COþR2CO2
þR3CH4 þR4H2 þR5O2 ð13Þ
Figure 3. Different regions during UCG.
Table 4. Pyrolysis Produced Gases, Layer 1
pyrolysis produced gas (mol/100 g of coal) ratio
H2 CH4 C2H6 CO CO2 H2S NH3 N2 H2O CO2/CO CH4/C2H6 NH3/N2
0.5047 0.0468 0.0468 0.2756 0.0794 0.0196 0.0104 0.0087 0.1526 0.288 1 1.1910.5319 0.0704 0.0235 0.3218 0.0563 0.0196 0.0074 0.0102 0.1526 0.175 3 0.7260.5700 0.0729 0.0121 0.3620 0.0362 0.0196 0.0013 0.0133 0.1526 0.1 6 0.10.5580 0.0844 0.0084 0.3537 0.0403 0.0196 0.0013 0.0133 0.1526 0.114 10 0.10.4662 0.0565 0.0565 0.2172 0.1086 0.0196 0.0036 0.0121 0.1526 0.5 1 0.2950.4013 0.0686 0.0686 0.1448 0.1448 0.0196 0.0066 0.0106 0.1526 1 1 1.6240.3649 0.0746 0.0746 0.1086 0.1629 0.0196 0.0107 0.0086 0.1526 1.5 1 1.2550.3251 0.1679 0.0280 0.1086 0.1629 0.0196 0.0062 0.0108 0.1526 1.5 6 0.5720.3002 0.1679 0.0280 0.1086 0.1629 0.0196 0.0228 0.0025 0.1526 1.5 6 90.5047 0.0468 0.0468 0.2756 0.0794 0.0196 0.0104 0.0087 0.1526 0.288 1 1.191
(29) Merrick, D.Mathematical models of the thermal decompositionof coal: 1. The evolution of volatile matter. Fuel 1983, 62 (5), 534–539.
(30) Takeuchi, M.; Berkowitz, N. Fast pyrolysis of some westernCanadian subbituminous coals. Fuel 1989, 68 (10), 1311–1319.
3545
Energy Fuels 2010, 24, 3540–3550 : DOI:10.1021/ef9013828 Nourozieh et al.
The corresponding stoichiometric coefficients for the abovereactions, considering char and excluding ash and water, are
coal layer f 4:63carbonþ 0:43COþ 0:12CO2
þ 0:79CH4 þ 0:18H2 ð14Þ
claystone layer f 0:41carbonþ 0:04COþ 0:1CO2
þ 0:04CH4 þ 0:32H2 þ 0:07O2 ð15ÞThe stoichiometric coefficients are obtained on the basis of
the averaging of the pyrolysis process for coal and claystonelayers, respectively. Contribution of each layer in the averagevalue is determined by its thickness. That is, the thicker layer,the greater effect on the average pyrolysis gas.
Char Reactions. Char reactions are the chemical reactionsamong the gases within the cavity and carbon. This chemicalprocess usually occurs after the pyrolysis is completed. Thereactivity of the char to O2, H2O, CO2, and H2 determines therates atwhich thedesired products are formed.Many reactionsoccur during this process but the most important reactions,which are considered in the model, are summarized as follows:
CþO2 f CO2 ΔH0298 ¼ - 393 kJ=mol ð16Þ
CþCO2 f 2CO ΔH0298 ¼ þ172 kJ=mol ð17Þ
CþH2O f H2 þCO ΔH0298 ¼ þ131 kJ=mol ð18Þ
Cþ 2H2 f CH4 ΔH0298 ¼ - 75 kJ=mol ð19Þ
COþ 1
2O2 f CO2 ΔH0
298 ¼ - 283 kJ=mol ð20Þ
COþH2OTCO2 þH2 ΔH0298 ¼ - 41 kJ=mol ð21Þ
CH4 þH2OTCOþ 3H2 ΔH0298 ¼ þ206 kJ=mol ð22Þ
Reactions 16-18 and 20 are the main chemical reactionsconsidered for both shallow and deep coal gasification pro-cesses.Thehydrogasification (reaction19) is favorable at ahighhydrogen pressure. In theUCGat low pressure, this reaction isnot significant. In the presence of water, especially with lowtemperature, carbon monoxide-steam and methane-steamreforming reactions play an important role.
The chemical reactions are treated as the source/sink termsfor each component in themodel. The general heterogeneousmass-transfer reaction is defined asXn
i¼ 1
si, kBi fεf, k Xn
i¼ 1
s0i, kBi ð23Þ
The kinetic model, also known as the reaction kinetics,determines the reaction speed. Its general expression is
rk, chem ¼ εf, kYnj¼ 1
Cjηj, k ð24Þ
In addition, the rate of creation and destruction of the ithspecies in reaction k is given by
ri, k ¼ ðs0i, k - si, kÞðεf, kYnj¼ 1
Cjηj, kÞ ð25Þ
Defining the net stoichiometric coefficient as s00i,k= s0i,k-si,k, the rate of creation/destruction can be written as
ri, k ¼ s00i, krk, chem ð26Þ
In some cases, such as solid gasification, the termCj in eq 25is replaced by the partial pressure of reacting gas. The forwardreaction rate εf,k is assumed to have a simple Arrhenius form
εf, k ¼ ε0, k exp -Ek
RT
� �ð27Þ
where the activation energy Ek determines the temperaturedependence of ri,k. The chemical kinetics, which depend uponthe model properties and operational conditions, were esti-matedandoptimizedat specific conditions andgiven inTable5.These data were obtained on the basis of a sophisticated para-meter estimation method, which is discussed in more details inthe Results and Discussion.
Governing Equations
Twomain transport phenomena inUCGaremass and heatphysical processes. Indeed, the UCG performance and che-mical process behavior are controlled by heat and massphenomena. In the model, these conservation equations aredefined in three-dimensional spaces. The convective flow forgas species inside the cavity is based on Darcy’s law. For heattransport, the convection and conduction are considered asthe main heat-transfer processes in the UCG model.
The mass conservation equation for component i is
Δλwyi, wΔjw þΔλgyi, gΔjg þX
j¼w, gΔA
ΔlðFjDijÞΔyi, j
þVΔðs0ki - skiÞrk þ qi -V
ΔtðNi
nþ1 -NinÞ ¼ 0 ð28Þ
The first and second terms account for convective flowsduring the process. The third term is the mass diffusioncaused by concentration variation. Mass transfer by thereaction is illustrated by the fourth term. Production andinjection are considered by qi, and finally, the last term is theaccumulation term.
The transmissibility λj is defined as
λj ¼ kA
Δl
� �krjFjμj
!ð29Þ
which depends upon the permeability, densities, viscosities,and grid block sizes.
For the solid components, only accumulation by combus-tion of solid is considered. As the pyrolysis or the chargasification takes place, the solid concentration inside thereservoir is changed. The dependence of the solid concentra-tion upon chemical processes is given by
VDDt½φvCi� ¼ VΔðs0i, k - si, kÞrk ð30Þ
which shows the variation of the solid with respect to time.
Table 5. Chemical Kinetic Parameters as Input for Simulation28
reactionactivationenergy
reaction frequencyfactor
pyrolysis 180 2.20� 1012
oxidation 100 2.08� 101
boundard 249 6.57� 106
steam gasification 156 1.87� 104
hydrogenation 200 1.81� 103
carbon monoxide combustion 247 1.12� 108
gas-steam shift forward 12.6 1.73� 100
gas-steam shift backward 12.6 4.48� 10-2
methane-steam reforming forward 30.0 3.13� 102
methane-steam reforming backward 30.0 4.00� 103
3546
Energy Fuels 2010, 24, 3540–3550 : DOI:10.1021/ef9013828 Nourozieh et al.
The energy conservation equation is
ΔλwHwΔjw þΔλgHgΔjg þΔðKΔTÞ
þX
j¼w, gFjqjHj þVΔðHr, krkÞ-V
DDtfφfluid½
Xj¼w, g
FjSjUj�
þφvCsUs þð1-φvÞUrg ¼ 0 ð31ÞThe first and second terms are the flow terms of energy. Heattransport by conduction is illustrated by the third term. Thewell source/sink term for energy is the fourth term. Thereaction source/sink term for energy is the fifth term, andthe accumulation term for energy is the last term in the aboveequation. Here, the heat loss term is not considered; anisolated model is assumed. The transmissibility, λk, is definedby eq 29.
UCG Modeling
In this study, CMG’s software STARS is used to carry out afeasibility study on the applicability ofUCG for deep coal seams.STARS is a semi-compositional porous-media-based simulatorthat combines the heat- and mass-transport equations withchemical reactions to investigate theUCGprocess. It is a thermaland advanced processes reservoir simulator for modeling of thecomplex oil and gas recovery processes. This software as acommercial tool was developed to simulate the processes, suchas steam flood, steam cycling, steam-assisted gravity drainage(SAGD), dry and wet combustion, along with many types ofchemical processes, using a wide range of grid and porositymodels in both field and laboratory scale.31
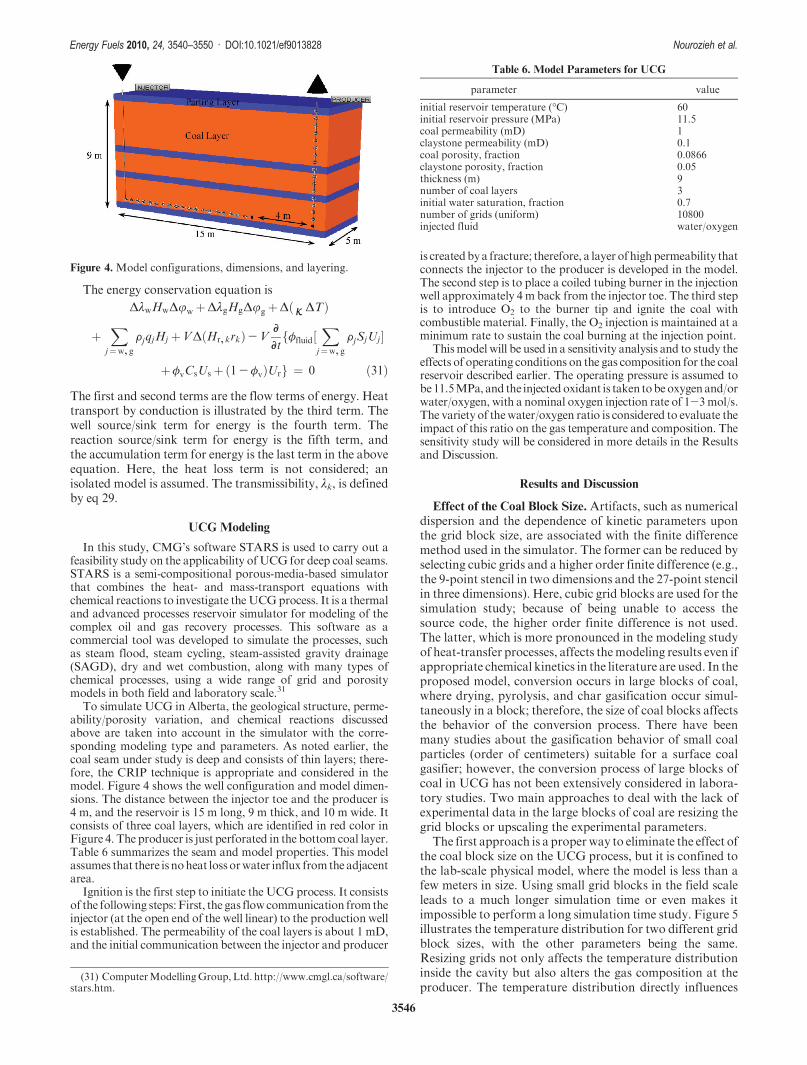
To simulate UCG in Alberta, the geological structure, perme-ability/porosity variation, and chemical reactions discussedabove are taken into account in the simulator with the corre-sponding modeling type and parameters. As noted earlier, thecoal seam under study is deep and consists of thin layers; there-fore, the CRIP technique is appropriate and considered in themodel. Figure 4 shows the well configuration and model dimen-sions. The distance between the injector toe and the producer is4 m, and the reservoir is 15 m long, 9 m thick, and 10 m wide. Itconsists of three coal layers, which are identified in red color inFigure 4. The producer is just perforated in the bottom coal layer.Table 6 summarizes the seam and model properties. This modelassumes that there is noheat lossorwater influx fromthe adjacentarea.
Ignition is the first step to initiate the UCG process. It consistsof the following steps:First, the gas flowcommunication from theinjector (at the open end of the well linear) to the production wellis established. The permeability of the coal layers is about 1 mD,and the initial communication between the injector and producer
is createdbya fracture; therefore, a layer of highpermeability thatconnects the injector to the producer is developed in the model.The second step is to place a coiled tubing burner in the injectionwell approximately 4 m back from the injector toe. The third stepis to introduce O2 to the burner tip and ignite the coal withcombustible material. Finally, the O2 injection is maintained at aminimum rate to sustain the coal burning at the injection point.
Thismodel will be used in a sensitivity analysis and to study theeffects of operating conditions on the gas composition for the coalreservoir described earlier. The operating pressure is assumed tobe11.5MPa, and the injectedoxidant is taken tobeoxygenand/orwater/oxygen, with a nominal oxygen injection rate of 1-3mol/s.The variety of thewater/oxygen ratio is considered to evaluate theimpact of this ratio on the gas temperature and composition. Thesensitivity study will be considered in more details in the Resultsand Discussion.
Results and Discussion
Effect of the Coal Block Size. Artifacts, such as numericaldispersion and the dependence of kinetic parameters uponthe grid block size, are associated with the finite differencemethod used in the simulator. The former can be reduced byselecting cubic grids and a higher order finite difference (e.g.,the 9-point stencil in two dimensions and the 27-point stencilin three dimensions). Here, cubic grid blocks are used for thesimulation study; because of being unable to access thesource code, the higher order finite difference is not used.The latter, which is more pronounced in the modeling studyof heat-transfer processes, affects themodeling results even ifappropriate chemical kinetics in the literature are used. In theproposed model, conversion occurs in large blocks of coal,where drying, pyrolysis, and char gasification occur simul-taneously in a block; therefore, the size of coal blocks affectsthe behavior of the conversion process. There have beenmany studies about the gasification behavior of small coalparticles (order of centimeters) suitable for a surface coalgasifier; however, the conversion process of large blocks ofcoal in UCG has not been extensively considered in labora-tory studies. Two main approaches to deal with the lack ofexperimental data in the large blocks of coal are resizing thegrid blocks or upscaling the experimental parameters.
The first approach is a properway to eliminate the effect ofthe coal block size on the UCG process, but it is confined tothe lab-scale physical model, where the model is less than afew meters in size. Using small grid blocks in the field scaleleads to a much longer simulation time or even makes itimpossible to perform a long simulation time study. Figure 5illustrates the temperature distribution for two different gridblock sizes, with the other parameters being the same.Resizing grids not only affects the temperature distributioninside the cavity but also alters the gas composition at theproducer. The temperature distribution directly influences
Figure 4. Model configurations, dimensions, and layering.
Table 6. Model Parameters for UCG
parameter value
initial reservoir temperature (�C) 60initial reservoir pressure (MPa) 11.5coal permeability (mD) 1claystone permeability (mD) 0.1coal porosity, fraction 0.0866claystone porosity, fraction 0.05thickness (m) 9number of coal layers 3initial water saturation, fraction 0.7number of grids (uniform) 10800injected fluid water/oxygen
(31) ComputerModellingGroup,Ltd. http://www.cmgl.ca/software/stars.htm.

3547
Energy Fuels 2010, 24, 3540–3550 : DOI:10.1021/ef9013828 Nourozieh et al.
chemical processes. Table 7 summarizes the gas compositionfor both coal block sizes.
In the second approach, which is applicable in the case offield studies, the experimental parameters (such as reactionkinetics) need to be extrapolated to be used in the simulator.This approach is used to ensure that there is proper combus-tion in each field-scale grid block; however, it requires fieldresults for estimating some uncertain parameters.
Effect of the Pressure on Kinetic Parameters. The coalseam under study has an initial pressure of 11.5 MPa, butliterature data on chemical reactions were reported at verylow pressure. Most experiments on the chemical reactionswere performed at atmospheric conditions, and there is noavailable data for kinetics of these reactions at higherpressure (>11 MPa). Thus, estimation and extrapolationof experimental parameters to high pressure are essential formodeling the process.
Kinetic Parameter Estimation.As discussed before, 11 che-mical processes (2 pyrolysis and 9 chemical reactions) wereconsidered to model UCG. All of these reactions occur inUCG simultaneously and are modeled with an Arrhenius-type reaction. The chemical processes are sensitive to the coalblock size and the environment conditions where the reac-tion occurs. Any change in the coal block size has a sig-nificant effect on the modeling results. To best represent andmodel UCG for the field scale, the chemical kinetics, whichwere obtained in the laboratory, are required to be estimatedor extrapolated for field scale. From an engineering point ofview, this is an inverse problem, where the aim is thedetermination of the model parameter(s) within a certaindomain from data and information provided as final results.In UCG, the model response, which is the produced gascomposition, is already known from field data, and it isnecessary to estimate reaction parameters based on theseresults. The study by Kariznovi et al.28 confirms that theLevenberg-Marquardt algorithm (LMA) can be used toinvestigate the uncertain parameters. The chemical kinetics(Table 5) are taken from their study, which is based on asophisticated parameter estimation method. These data areappropriate for 11.5 MPa pressure and 0.5 m cubic coalblocks. The results based on these parameters are describedin the following sections.
Cavity Shape and Temperature Profile. As a preliminarystudy, this work focuses on the simulation of a pilot test area
(part of the coal seam), which is 15m long, 9m thickness, and10 m wide, respectively (see Figure 4). The cavity shape,temperature profile, and produced gas composition areexamined here. The results illustrate the feasibility study ofthe UCG process for the coal seam under consideration;more future studies will be presented to investigate the effectof different operational conditions on the performance ofthis process. In addition, more modeling studies are requiredto consider the geomechanical behavior of UCG, which isnot considered in this study.
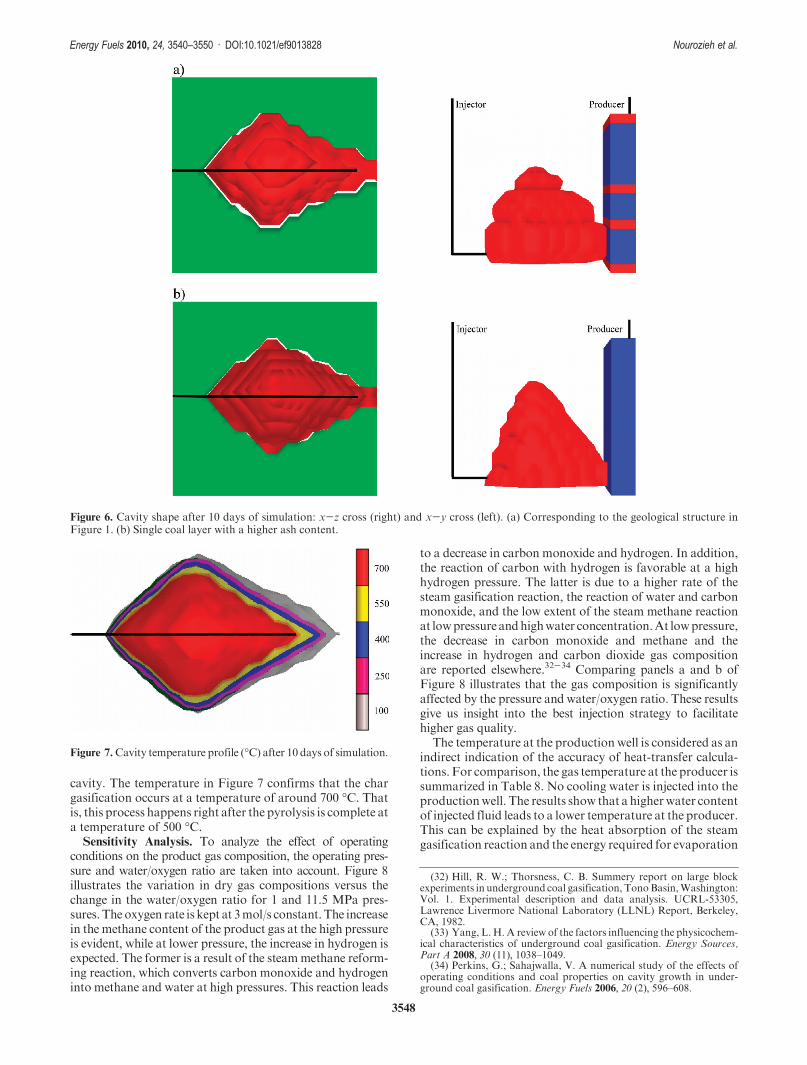
Figure 6a shows the cavity shape (combustion front) after10 days. The ignition happens at the toe of the horizontalinjector, where there is a high permeability region betweenthe wells. As the process proceeds, the injection point isperforated at successive new upstream locations. As thefigure depicts, a single cavity is formed along the coal seam.The cavity grows along the x axismuchmore than along the zaxis, which depends upon the geological structure and igni-tion procedure. The shale layer affects the rate of the cavitygrowth in the vertical direction; however, there is a verticalpenetration for the gasification in the middle coal seam. Inaddition, the backward gasification along the x axis is fasterthan the forward gasification.
To evaluate the effect of interspersed layers (shale layers)on the cavity shape, all coal and interspersed layers areaveraged into a layer with higher ash. The average perme-ability is calculated by
kave ¼P7i¼ 1
kihi
P7i¼ 1
hi
ð32Þ
using the parameters given in Table 6. The cavity shape forthis case is shown in Figure 6b. It clearly shows higher cavitygrowth in the z direction than the previous case, while inother directions, it is not significant. Because the geomecha-nic behavior is not considered in the model, it is likely thatsuch thin interburden does not have much impact on gasifi-cation after initial linking occurs between the coal layers.
There is an area (red region) in Figure 6a where all of thecoal has been affected. The corresponding cavity temperatureprofile is illustrated in Figure 7. The temperature inside thecavity indicates different regions during UCG. These regionsare separated by lines in Figure 7. The pyrolysis region has atemperature around 500 �Cduring this study.This agreeswiththe study of Anthony and Howard,24 which reported atemperature of 400-900 �C for pyrolysis during UCG.
After the pyrolysis is complete, the porous carbonaceous-rich solid referred to as char is reacted with gases inside the
Figure 5. Effect of the coal block size on the temperature distribution: large grids (left) and small grids (right).
Table 7. Effect of the Gridblock Size on Gas Composition
gas composition (mole fraction) CO2 H2 CO CH4
grid size0.5 � 0.5 � 0.5 m 0.3490 0.2887 0.2206 0.14160.25 � 0.25 � 0.25 m 0.2847 0.2557 0.2864 0.1732
3548
Energy Fuels 2010, 24, 3540–3550 : DOI:10.1021/ef9013828 Nourozieh et al.
cavity. The temperature in Figure 7 confirms that the chargasification occurs at a temperature of around 700 �C. Thatis, this process happens right after the pyrolysis is complete ata temperature of 500 �C.
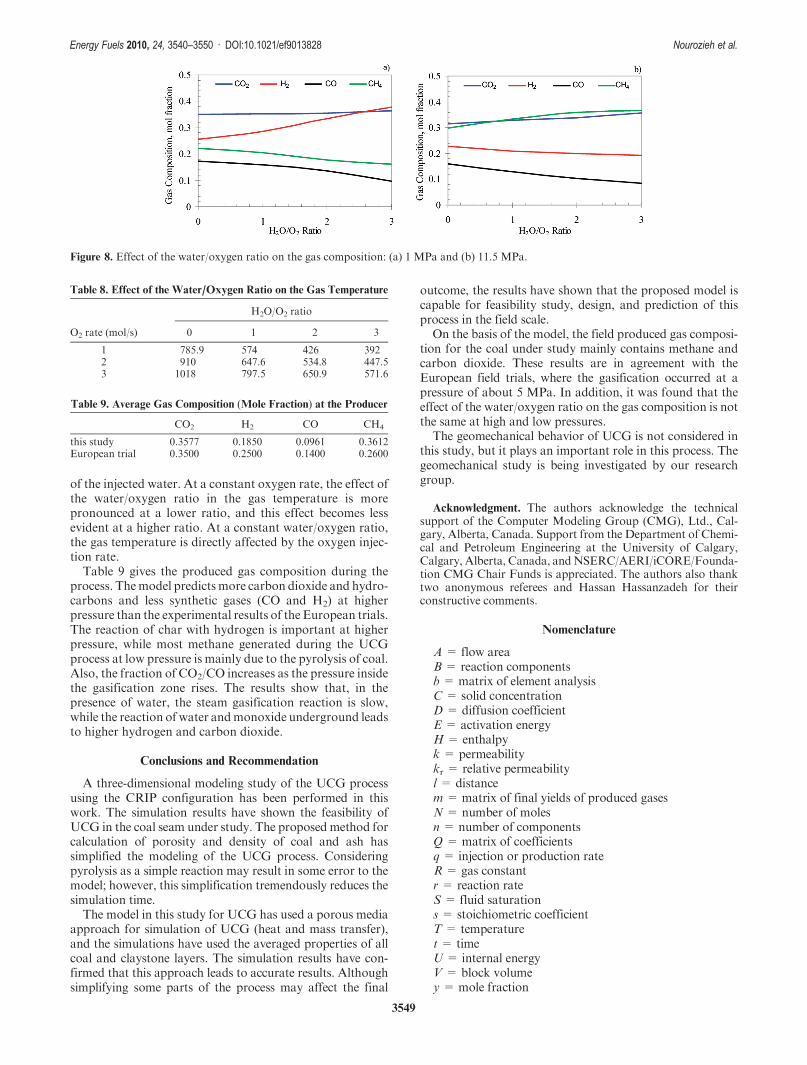
Sensitivity Analysis. To analyze the effect of operatingconditions on the product gas composition, the operating pres-sure and water/oxygen ratio are taken into account. Figure 8illustrates the variation in dry gas compositions versus thechange in the water/oxygen ratio for 1 and 11.5 MPa pres-sures.The oxygen rate is kept at 3mol/s constant.The increasein the methane content of the product gas at the high pressureis evident, while at lower pressure, the increase in hydrogen isexpected. The former is a result of the steammethane reform-ing reaction, which converts carbon monoxide and hydrogeninto methane and water at high pressures. This reaction leads
to a decrease in carbon monoxide and hydrogen. In addition,the reaction of carbon with hydrogen is favorable at a highhydrogen pressure. The latter is due to a higher rate of thesteam gasification reaction, the reaction of water and carbonmonoxide, and the low extent of the steam methane reactionat lowpressure andhighwater concentration.At lowpressure,the decrease in carbon monoxide and methane and theincrease in hydrogen and carbon dioxide gas compositionare reported elsewhere.32-34 Comparing panels a and b ofFigure 8 illustrates that the gas composition is significantlyaffected by the pressure and water/oxygen ratio. These resultsgive us insight into the best injection strategy to facilitatehigher gas quality.
The temperature at the production well is considered as anindirect indication of the accuracy of heat-transfer calcula-tions. For comparison, the gas temperature at the producer issummarized in Table 8. No cooling water is injected into theproductionwell. The results show that a higherwater contentof injected fluid leads to a lower temperature at the producer.This can be explained by the heat absorption of the steamgasification reaction and the energy required for evaporation
Figure 6. Cavity shape after 10 days of simulation: x-z cross (right) and x-y cross (left). (a) Corresponding to the geological structure inFigure 1. (b) Single coal layer with a higher ash content.
Figure 7.Cavity temperature profile (�C) after 10 days of simulation.
(32) Hill, R. W.; Thorsness, C. B. Summery report on large blockexperiments in underground coal gasification, TonoBasin,Washington:Vol. 1. Experimental description and data analysis. UCRL-53305,Lawrence Livermore National Laboratory (LLNL) Report, Berkeley,CA, 1982.
(33) Yang, L. H. A review of the factors influencing the physicochem-ical characteristics of underground coal gasification. Energy Sources,Part A 2008, 30 (11), 1038–1049.
(34) Perkins, G.; Sahajwalla, V. A numerical study of the effects ofoperating conditions and coal properties on cavity growth in under-ground coal gasification. Energy Fuels 2006, 20 (2), 596–608.
3549
Energy Fuels 2010, 24, 3540–3550 : DOI:10.1021/ef9013828 Nourozieh et al.
of the injected water. At a constant oxygen rate, the effect ofthe water/oxygen ratio in the gas temperature is morepronounced at a lower ratio, and this effect becomes lessevident at a higher ratio. At a constant water/oxygen ratio,the gas temperature is directly affected by the oxygen injec-tion rate.
Table 9 gives the produced gas composition during theprocess. Themodel predicts more carbon dioxide and hydro-carbons and less synthetic gases (CO and H2) at higherpressure than the experimental results of the European trials.The reaction of char with hydrogen is important at higherpressure, while most methane generated during the UCGprocess at low pressure is mainly due to the pyrolysis of coal.Also, the fraction of CO2/CO increases as the pressure insidethe gasification zone rises. The results show that, in thepresence of water, the steam gasification reaction is slow,while the reaction of water andmonoxide underground leadsto higher hydrogen and carbon dioxide.
Conclusions and Recommendation
A three-dimensional modeling study of the UCG processusing the CRIP configuration has been performed in thiswork. The simulation results have shown the feasibility ofUCG in the coal seam under study. The proposed method forcalculation of porosity and density of coal and ash hassimplified the modeling of the UCG process. Consideringpyrolysis as a simple reaction may result in some error to themodel; however, this simplification tremendously reduces thesimulation time.
The model in this study for UCG has used a porous mediaapproach for simulation of UCG (heat and mass transfer),and the simulations have used the averaged properties of allcoal and claystone layers. The simulation results have con-firmed that this approach leads to accurate results. Althoughsimplifying some parts of the process may affect the final
outcome, the results have shown that the proposed model iscapable for feasibility study, design, and prediction of thisprocess in the field scale.
On the basis of the model, the field produced gas composi-tion for the coal under study mainly contains methane andcarbon dioxide. These results are in agreement with theEuropean field trials, where the gasification occurred at apressure of about 5 MPa. In addition, it was found that theeffect of the water/oxygen ratio on the gas composition is notthe same at high and low pressures.
The geomechanical behavior of UCG is not considered inthis study, but it plays an important role in this process. Thegeomechanical study is being investigated by our researchgroup.
Acknowledgment. The authors acknowledge the technicalsupport of the Computer Modeling Group (CMG), Ltd., Cal-gary, Alberta, Canada. Support from the Department of Chemi-cal and Petroleum Engineering at the University of Calgary,Calgary, Alberta, Canada, andNSERC/AERI/iCORE/Founda-tion CMG Chair Funds is appreciated. The authors also thanktwo anonymous referees and Hassan Hassanzadeh for theirconstructive comments.
Nomenclature
A = flow areaB = reaction componentsb= matrix of element analysisC = solid concentrationD = diffusion coefficientE = activation energyH = enthalpyk = permeabilitykr = relative permeabilityl = distancem =matrix of final yields of produced gasesN = number of molesn= number of componentsQ =matrix of coefficientsq= injection or production rateR = gas constantr= reaction rateS = fluid saturations= stoichiometric coefficientT = temperaturet = timeU = internal energyV = block volumey= mole fraction
Figure 8. Effect of the water/oxygen ratio on the gas composition: (a) 1 MPa and (b) 11.5 MPa.
Table 8. Effect of the Water/Oxygen Ratio on the Gas Temperature
H2O/O2 ratio
O2 rate (mol/s) 0 1 2 3
1 785.9 574 426 3922 910 647.6 534.8 447.53 1018 797.5 650.9 571.6
Table 9. Average Gas Composition (Mole Fraction) at the Producer
CO2 H2 CO CH4
this study 0.3577 0.1850 0.0961 0.3612European trial 0.3500 0.2500 0.1400 0.2600

3550
Energy Fuels 2010, 24, 3540–3550 : DOI:10.1021/ef9013828 Nourozieh et al.
UCG = underground coal gasificationCMG = Computer Modeling GroupCRIP = controlled retracting injection point
Greek Letters
ε = reaction rate constantφ= porosityj = flow potentialη = reaction orderκ= thermal conductivityλ= transmissibility
μ = fluid viscosityF = densityσ = exponential term in permeability-porosity equationξ= volatile content of coal
Subscript
f = forward reactiong = gass = solidv = bulkw = water