Simulation of the Flicker Phenomenon based on … models are implementing in PSCAD EMTDC simulation...
11
Simulation of the Flicker Phenomenon based on Modeling the Electric Arc MANUELA PANOIU 1 , CAIUS PANOIU 1 , IOAN ŞORA 2 , RALUCA ROB 1 1 Faculty of Engineering Hunedoara, 2 Faculty of Electrical Engineering Polytechnic University of Timisoara 1 Revolutiei street nr. 5, cod 331128 2 Vasile Parvan street, no. 2, Timisoara, cod 300223 ROMANIA {c.panoiu, m.panoiu, raluca.rob}@fih.upt.ro , [email protected] Abstract: - The Electric Arc Furnace (EAF) is a very large power load, determining the negative effects on the power quality like flicker effect, harmonics currents, and reactive power. These effects are due to the nonlinear characteristic of the electric arc. In this paper is made a study based on simulation about flicker effect caused by Ultra High Power Electric Arc Furnaces (UHP-EAF). For simulation it was use two electric arc models, depending on the nonlinearity of the electric arc. The models are implementing in PSCAD EMTDC simulation program, a program dedicated to power systems. The simulation results are comparing with measurements made in an industrial plant in Romania. Key-Words: - simulation and modeling, power quality, flicker, harmonics, interharmonics 1. Introduction The electric arc is a nonlinear element. For study the behavior of the systems based on electric arc it must use techniques to model the nonlinearity of the electric arc. Because the electric arc’s nonlinearity, this is a massive generator of harmonic currents and reactive power in electrical power system. The EAF are also a reactive power source because the electric arc is also a reactive load. The electric arc furnace is also and unbalance load. However, one of the most substantial disadvantages of arc furnace is caused by the variations in the line voltage leading to flicker, which can be observed due to the luminosity fluctuation of incandescent lamps. Electric arc furnaces are a main cause of voltage flicker due to the interaction of the high demand currents of the loads with the supply system impedance. Therefore the main point of analysis focuses on the characteristics of harmonics, and also on the flicker. The effect of these installations was analyzed using simulation program PSCAD/EMTDC [14]. PSCAD (Power System Computer Aided Design) is a multi-purpose graphical user interface capable of supporting a variety of power system simulation programs. This release supports only EMTDC (Electro-Magnetic Transients in DC Systems). For simulation it was use an electric arc model, depending on the nonlinearity of the electric arc. 2. Light flicker due to voltage fluctuations One definition of flicker is “Impression of unsteadiness of visual sensation induced by a light stimulus whose luminance or spectral distribution fluctuates with time” [1]. This means the perception of light flicker is a physiological process. Over the past years numerous studies have been conducted in order to understand the mechanisms behind the flicker phenomenon [15], [16] and [17]. There are at least three different mechanisms influencing the light flicker perception by a human. These are: - The characteristics of the light source. - The frequency response of the eye-brain of a human - The time constant of the eye-brain Examples of flicker sources The flicker is in reality a statistical calculation, defined by the EN IEC 61000-4-15 standard and obtained from measuring the rapid variations in voltage. These rapid variations in voltage (figure 1) are, generally speaking, caused by variable loads such as arc furnaces, laser printers, micro-wave ovens or air conditioning systems being started up. As mentioned in the previous section the main source of severe voltage fluctuations are industrial loads with fluctuating power demands but also wind turbines and wave power etc. can generate flicker. WSEAS TRANSACTIONS on SYSTEMS MANUELA PANOIU,CAIUS PANOIU, IOAN ŞORA,RALUCA ROB ISSN: 1109-2777 1132 Issue 10, Volume 7, October 2008
Transcript of Simulation of the Flicker Phenomenon based on … models are implementing in PSCAD EMTDC simulation...

Simulation of the Flicker Phenomenon based on Modeling the Electric Arc
MANUELA PANOIU1, CAIUS PANOIU1, IOAN ŞORA2, RALUCA ROB1
1Faculty of Engineering Hunedoara, 2Faculty of Electrical Engineering
Polytechnic University of Timisoara 1Revolutiei street nr. 5, cod 331128
2Vasile Parvan street, no. 2, Timisoara, cod 300223 ROMANIA
{c.panoiu, m.panoiu, raluca.rob}@fih.upt.ro, [email protected] Abstract: - The Electric Arc Furnace (EAF) is a very large power load, determining the negative effects on the power quality like flicker effect, harmonics currents, and reactive power. These effects are due to the nonlinear characteristic of the electric arc. In this paper is made a study based on simulation about flicker effect caused by Ultra High Power Electric Arc Furnaces (UHP-EAF). For simulation it was use two electric arc models, depending on the nonlinearity of the electric arc. The models are implementing in PSCAD EMTDC simulation program, a program dedicated to power systems. The simulation results are comparing with measurements made in an industrial plant in Romania. Key-Words: - simulation and modeling, power quality, flicker, harmonics, interharmonics 1. Introduction
The electric arc is a nonlinear element. For study the behavior of the systems based on electric arc it must use techniques to model the nonlinearity of the electric arc. Because the electric arc’s nonlinearity, this is a massive generator of harmonic currents and reactive power in electrical power system. The EAF are also a reactive power source because the electric arc is also a reactive load. The electric arc furnace is also and unbalance load. However, one of the most substantial disadvantages of arc furnace is caused by the variations in the line voltage leading to flicker, which can be observed due to the luminosity fluctuation of incandescent lamps. Electric arc furnaces are a main cause of voltage flicker due to the interaction of the high demand currents of the loads with the supply system impedance.
Therefore the main point of analysis focuses on the characteristics of harmonics, and also on the flicker.
The effect of these installations was analyzed using simulation program PSCAD/EMTDC [14]. PSCAD (Power System Computer Aided Design) is a multi-purpose graphical user interface capable of supporting a variety of power system simulation programs. This release supports only EMTDC (Electro-Magnetic Transients in DC Systems).
For simulation it was use an electric arc model, depending on the nonlinearity of the electric arc.
2. Light flicker due to voltage fluctuations
One definition of flicker is “Impression of unsteadiness of visual sensation induced by a light stimulus whose luminance or spectral distribution fluctuates with time” [1]. This means the perception of light flicker is a physiological process. Over the past years numerous studies have been conducted in order to understand the mechanisms behind the flicker phenomenon [15], [16] and [17]. There are at least three different mechanisms influencing the light flicker perception by a human. These are: - The characteristics of the light source. - The frequency response of the eye-brain of a
human - The time constant of the eye-brain
Examples of flicker sources The flicker is in reality a statistical calculation,
defined by the EN IEC 61000-4-15 standard and obtained from measuring the rapid variations in voltage. These rapid variations in voltage (figure 1) are, generally speaking, caused by variable loads such as arc furnaces, laser printers, micro-wave ovens or air conditioning systems being started up.
As mentioned in the previous section the main source of severe voltage fluctuations are industrial loads with fluctuating power demands but also wind turbines and wave power etc. can generate flicker.
WSEAS TRANSACTIONS on SYSTEMSMANUELA PANOIU,CAIUS PANOIU, IOAN ŞORA,RALUCA ROB
ISSN: 1109-2777 1132 Issue 10, Volume 7, October 2008

Theoretically, flicker can also be caused by sub- and interharmonic frequency components giving a beating frequency component placed within the flicker frequency spectrum [2], [3] as well as caused by modulation of the voltage harmonics [4]. However, the dominating flicker sources are heavy fluctuating loads like arc furnaces, welding machines, rolling-mills etc.
Figure 1. Rapid variation in voltage.
An arc furnace is probably the load that produces
most flicker [5], [6], [7]. When the arc furnace operates, an unstable arc will appear between the electrodes and the scrap resulting in fluctuating power consumption and thereby a potential flicker problem. As a rule of thumb the ratio between the short-circuit capacity at the point of common coupling (PCC) to the maximum demand of the arc furnace should be greater than 80 in order to limit the risk for severe flicker caused by the arc furnace.
The best way to investigate the actual flicker situation is to perform on-site measurements using a flickermeter based on the IEC 61000-4-15 standard.
If the arc furnace is connected to a network with changing loads over time, a good idea is to measure flicker permanently and thereby see the trend of flicker.
Common methods to reduce flicker originating from an arc furnace is to increase the short-circuit level by installing a new main transformer with higher capacity, installing active mitigation equipment like a SVC etc. or to improve the control strategies of the arc furnace. The mitigation methods are quite expensive and discussions between the network operator and the owner of the arc furnace regarding cost sharing are common.
3. Models of the Electric Arc Furnace for flicker simulation
In the specific literature, there are many mathematical models of the electric arc. In [8], [9], [10] and [12] was present some models for the electric arc.
3.1. Model based on the empirical relation between the arc current, arc voltage and arc length
This model are considered by the authors the most appropriate model for describe the electric arc behavior. This model considers the characteristic current-voltage described by relation
A
thA IDCU+
+=U . (1)
In this relation UA and IA are the arc voltage and arc current, and Uth are the threshold voltage. The C and D constants determine the difference between the current increasing part and current decreasing part of the current–voltage characteristic (Ca, Da irrespective Cb, Db). The typical values ([8], [9], [10], [12]) are: Ud = 200 V, Ca = 190000 W, Cb = 39000 W, Da = Db = 5000 A. Because the real values of the model parameters depend on the voltage arc variations, the dynamic arc voltage–current characteristic must be an arc length function, given by relation ([3], [4]):
( )AAA IUkU 0= ⋅ . (2) In (2) UA0 are the value of the arc voltage for a
reference arc length l0 and k is the ratio between the threshold voltage value for arc length l, Uth(l) and the threshold voltage value for arc length , Uth(l0). 0l
BlAU th
The dynamic model for electric arc presumes that the relation between the threshold voltage value and the arc length can be expressed by:
= + . (3) In (3) A is a constant equal with the sum of
cathode and anodic threshold voltages ( VA 40≅ ) and B represent the threshold voltage on the unit length, having usual values of cmV
( )
10 ([9], [12]). The dependency of k by the electric arc length is:
0lBAlBAlk
⋅++ ⋅
= . (4)
Using this model, the correction of the electric arc power can be done within loose limits by modifying the threshold voltage, which corresponds in practice to the modification of the distance between the electrodes and the metal bath. 3.2. Modeling the electric arc using the variable-length dynamic characteristic
The quick variations of the voltage absorbed by the electric furnace arc during the melting process are closely dependent on the variations of the electric arc length, caused by the position changing of the metal pieces and the variation of the electrodes positions. At present, two approaches have been developed as
WSEAS TRANSACTIONS on SYSTEMSMANUELA PANOIU,CAIUS PANOIU, IOAN ŞORA,RALUCA ROB
ISSN: 1109-2777 1133 Issue 10, Volume 7, October 2008

to the variation pattern of the electric arc length, the former supposing a determinist approach and the latter, a statistical one.
In this paper it was use the sinus variation of the electric arc length. According to the determinist variation it is considered that the electric arc length has a time-dependent variation pattern that can be described by a sinus law. The time-dependency of anode voltage can be obtained considering that the arc length is changing according to relation
( ) ( tLltl ωsin120 +−= )
( )
, (5)
where L represents the maximal variation of the electric arc length (the electrode movement range) and l0 is the maximal length of the electric arc (the
maximal distance between the electrode and the metal bath). Using relations (2) - (5) one can obtain the time variation of the dependency UA(IA)
( ) ( )AAAA IUlBA
tLBIU 0
0
sin121 ⋅
⋅++⋅⋅
−=ω (6)
By using the notation
LlLm−
=02
, (7)
one can notice that for L = 0 we obtain m = 0, and for L = l0 we obtain m = 1, parameter m representing the modulation index of the electric arc length. The model implemented in PSCAD are depicted in figure 2.
Uth1
CbN
D
N/D
u1n
N
D
N/D
*
D +
F
+
-1.0
0.19 Caa
0.039 Cb 5.0 Da
-5.0 Db
Da
IA1
Caa D +
F
+
Uth1
u1p
D +
F
+
D +
F
+Db
IA1
A
BCtrl
Ctrl = 1
u1n
u1p
A
B Compar-ator
IA1 IA1
N
D
N/D ra11
Arc resistance on phase 1
0.0
Uth1
A
D +
F
+*
B
l1
Arc length on phase 1
0.16 l0
0.04 A
1.0 B
*ra11
k1
RA1
*
D +
F
+l0
m
D +
F
+
1.0
Phase
FreqMag
Sinam
f
f1B
A
*
k1D +
F
+
D +
F
+
B
l0
N
D
N/DA
*
Negative semialternanceon phase 1
Positive semialternance on phase 1
Thresold voltage on phase 1
Coefficient k on phase 1
Figure 2. The electric arc model for flicker simulation implement in PSCAD EMTDC.
WSEAS TRANSACTIONS on SYSTEMSMANUELA PANOIU,CAIUS PANOIU, IOAN ŞORA,RALUCA ROB
ISSN: 1109-2777 1134 Issue 10, Volume 7, October 2008

It was obtained, by simulation, the arc voltage waveforms, figure 3. The influence of the modulation index can be observe in fig. 4 where is presented the variation of the arc voltage and the signal spectrum for m=0,2 (red) and for m=0.6 (blue). For the modulation frequency it was choice the value 10 Hz. For this value is most probably to appear flicker phenomena [8]. It can be observed, in figure 3, and 4 that the maximum value of the current envelope corresponds to the minimum value of the voltage magnitude, as result from (2).
By analyze the current and voltage spectrum present in figure 4, it can observe that the voltage spectral characteristic contained the 5th, 7th, 11th, 13th harmonics as is well know in literature but appear components with frequencies different from 50Hz. Therefore, it can be observe 60 Hz, 140Hz and 160 Hz components. The same phenomena appear in the current spectrum.
The magnitude for 5th, 7th, 11th, 13th harmonics and the neighboring interharmonics are show in
figure 5. Because by using FFT the frequency step is 2 Hz, in figure 5 are better mark out the interharmonics magnitudes with different frequencies from multiple of modulation frequency.
The influence of modulation index can be analyze from figure 4. It can be observe that form a high value of modulation index (blue), both low frequency harmonics order and interharmonics are significant. For high frequency harmonics order the amplitude of harmonics are more mitigated.
The value of modulation frequency is depending from the distance between harmonics and corresponding harmonic. This distance is increasing with the value of modulation frequency.
The spectral characteristic for the medium voltage line (in the primary of voltage transformer) are show in figure 6. It can be observe the presence of the 5th, 7th, 11th, 13th harmonics and interharmonics. Therefore, the harmonics and interharmonics are transmitted in the medium voltage line.
The items variation for one phase
0.00 0.10 0.20 0.30 0.40 0.50
-80
-60
-40
-20
0
20
40
60
80 Ia1
Arc
curre
nt (A
)
-0.40 -0.30 -0.20
-0.10 0.00 0.10 0.20
0.30 0.40 0.50
Arc
volta
ge
Ea1
(V)
Figure 3. The waveforms for arc current and voltage m=0.4.
WSEAS TRANSACTIONS on SYSTEMSMANUELA PANOIU,CAIUS PANOIU, IOAN ŞORA,RALUCA ROB
ISSN: 1109-2777 1135 Issue 10, Volume 7, October 2008

Figure 4. The waveforms for arc voltage and the signals spectrum for m=0.2 (red) and m=0.6 (blue).
WSEAS TRANSACTIONS on SYSTEMSMANUELA PANOIU,CAIUS PANOIU, IOAN ŞORA,RALUCA ROB
ISSN: 1109-2777 1136 Issue 10, Volume 7, October 2008

Figure 5. The 5th, 7th, 11th, 13th harmonics and the neighboring interharmonics for arc voltage.
Figure 6. The simulated voltage spectral characteristic for medium voltage line feed. 3.3. The model based on the linearization of the electric arc current – voltage characteristic
This model of the AC electric arc used in [8], [10], [11] is based on linearization of the current-voltage characteristic, typical for the electric arc. Also, this simulation technique is based on the fact that the parameters of the model depend on the power of the charge and therefore the model parameters depend on the work conditions. As the model uses the power absorbed by the electric arc furnace as an input, it results that the model allows the modification of the characteristic current-voltage, so that the power absorbed can be the prescribe power to be used by the charge circuit.
The principle according to which the model under consideration takes into account the active power absorbed by the circuit is based on the fact that the area of the current-voltage characteristic represents the active power absorbed. The figure 7 presented the typical dynamic characteristic and the linear approximation of the current-voltage characteristic of the AC electric arc and the real dynamic characteristic too.
The leveled approximation of the current-voltage characteristic can be defined in the first quadrant by the equation:
⎪⎩
⎪⎨
⎧
≤<⎟⎟⎠
⎞⎜⎜⎝
⎛−⋅+⋅
≤≤⋅
=21
1
22
11
i 1
0
iiRR
URi
iiRiu
ig (8)
where
,1
1 RU ig=i (9)
⎟⎟⎠
⎞⎜⎜⎝
⎛−⋅−=
1222
11RR
UR
Ui ig
dr (10)
O
A
B
C
D
Uig+
Udr+
Udr-
Uig-
Figure 7. The linearized and the real dynamic current-voltage cracteristic.
WSEAS TRANSACTIONS on SYSTEMSMANUELA PANOIU,CAIUS PANOIU, IOAN ŞORA,RALUCA ROB
ISSN: 1109-2777 1137 Issue 10, Volume 7, October 2008

The values and correspond to ignition voltage, and drop voltage , of the electric arc and , are the tangents of OA and OB segments. For the negative semi period of the arc voltage relation (8) can be prescribed taking into consideration that and values are negative. Because the active power is proportionally to the current-voltage characteristic area, the arc resistance on OA segment can be computed using relation (10), where P reprezent the electric arc power.
1i
2
2i
igU
1RdrU
R
1i 2i
⎟⎟
⎠
⎞
⎜⎜
⎝
⎛−+
=
2
2
2
2
2
1
RU
RU
P
UR
drig
ig (11)
To obtain equal values of the arc power on each semiperiod it is necessary to compute the value of parameter on every semiperiod. 1R
In simulations where used equal values on each semiperiod, ,for ignition voltage,
, for drop voltage. The 2R value was choose based on data literature [8], [10], [11]
2 =R value of 1R is computed using relation (10), the electric power value been choose MW 4,25=P
V 240|| == −+igig UU
V 200|=
0007272 . The
.
|= −+drdr UU
,0−
In [10] was detailed present the PSCAD-EMTDC electrical scheme of the installation of the electric arc furnace based on this model. It was show the implementation of the model only for one phase of the three phase electric arc because for the other two phases the model implementations are identically. In [10] was also present the waveform of the arc current and voltage obtained by simulation and the dynamic current – voltage characteristic of the electric arc, for simulated data. For the simulation of the flicker phenomenon, it was necessary to obtain the variation of the electric arc characteristic, and this was realized by imposing a variation to a parameter of the model. Some parameters are conditioned by it. The variable chosen parameter is R1. Taking into consideration that the ignition voltage, drop voltage and the power of the electric arc are constants, using the (11) relation, it can be computed in every moment the value of R2. In this way, the current-voltage characteristic of the electric is variable, and its variation depends on the R1 parameter variation law. For an accurate implementation of this model, the following conditions must be accomplished:
- During the implementation of the dynamic model is necessary to ensure constantly the value of the R1 parameter for at least a semi-period of the supply voltage. This demand must be
accomplished for realizing of the current-voltage characteristic for any value of the simulated current and voltage, considering as reference the same time interval.
- The variation of the R1 parameter in every semi-period of the supply voltage ensures the unsymmetrical current and voltage of the electric arc, a characteristic of the electric arc furnace.
- The variation law of the R1 parameter has to ensure constant of its medium value in order to maintain constant the power of the electric arc
There were developed two landing directions for the R1 parameter variation: a determinist landing and statistical landing.
3.3.1. The sinusoidal variation of the R1 parameter The determinist landing presumes that the R1 parameter describes a sinusoidal curve. The time dependence of the R1 parameter can be obtain taking into consideration that is has variation according to the relation:
)2sin1()( 011 tfmRtR = ⋅ + ⋅ π (12) where f0 is the variation frequency of the R1 parameter, and m is the modulation index. For the simulation of the flicker phenomenon, f0 has a value in the frequency domain where this phenomenon is developing. From (12) relation it can be observed that the medium value of the R1(t) parameter is equal to R1, so the medium power of the electric arc is constant. The simulation scheme implemented in PSCAD EMTDC are depicted in figure 9. The simulations are permitting to obtain the wave forms of the current and the voltage of the electric arc, and the value of the R1 parameter presented in figure 8. In these simulations, the modulation frequency is 10Hz, and the modulation index is m=0,8. 3.3.2. The random variation of the R1 parameter The statistic landing presumes that the variation of the R1 parameter is described by a band limited white noise law. In this case the time dependence of the R1 parameter can be obtained according the relation:
)()( 11 trRtR (13) = +where r(t) represents a zero media white noise and a limited frequency band signal. Like in the preceding cases, the frequency band is chosen in the frequency domain where the flicker phenomenon is developing. The figure 10 represents the current and the voltage of the electric arc variation form and the variation of the R1 parameter using the modulation index m=0,6.
WSEAS TRANSACTIONS on SYSTEMSMANUELA PANOIU,CAIUS PANOIU, IOAN ŞORA,RALUCA ROB
ISSN: 1109-2777 1138 Issue 10, Volume 7, October 2008

Ia1
0.24 Vap 0.2 Vst
-0.0007272R2
25.4 P
*Vap
Vap
*Vap
Vap
N
D
N/D D +
F
+ D +
F
+
N
D
N/D
R2 P
* N
D
N/D *
-1.0
Vst
Vst R2
R1N
D
N/DVap
R1
Ip
*Ia1
R11
u11
Ia1 *
R2
D +
F
+ u12
*
Vap
D +
F
+
1.0
*
-1.0
N
D
N/D
R11
R2
Ea1
*
D +
F
+
-1.0
u13
A
BCtrl
Ctrl = 1
u11
u12
A
BCtrl
Ctrl = 1
A
B Compar-ator A
B Compar-ator
Ia1
Ip Ia1
*
Ip
-1.0
N
D
N/D
Ia1
ra1u13
*
0.8
1.0
D +
F
+*
R1
R11
The arc resistance
The ignitionvoltage
The drop voltage
m
m
Sampler
Pulse
0.0f1
-120.0f2
120.0f3
am1.0
s1
0.0zero
ZeroDetector
-1.0
*
Ea1
R11
Phase
FreqMag
Sin
f1
am
f
s1
Figure 8. The model implement in PSCAD EMTDC for sinusoidal variation of the parameter R1.
The items variation for one phase
0.00 0.10 0.20 0.30 0.40 0.50
-120
125
Arc
curre
nt (A
)
Ia1
-0.50
0.50
Arc
volta
ge (V
)
Ea1
0.0
0.100
Para
met
er R
1
R11
Figure 9. The waveforms for arc voltage and the signals spectrum for m=0.8.
WSEAS TRANSACTIONS on SYSTEMSMANUELA PANOIU,CAIUS PANOIU, IOAN ŞORA,RALUCA ROB
ISSN: 1109-2777 1139 Issue 10, Volume 7, October 2008

The items variation for one phase
0.00 0.10 0.20 0.30 0.40 0.50
-100 -75 -50 -25
0 25 50 75
100 125
Ia1Ar
c cu
rrent
(A)
-0.40 -0.30 -0.20 -0.10 0.00 0.10 0.20
Ea1
Arc
volta
ge (V
)
0.010 0.020 0.030 0.040 0.050 0.060 0.070 0.080 0.090
R11
Para
met
er R
1
Figure 10. The waveforms for arc voltage and the signals spectrum for m=0.6.
4. Comparison with measurements
pply installation of a 3-phase EAF of 100t,
e
rmer and
easured spectrum
5 Conclusion furnace can cause
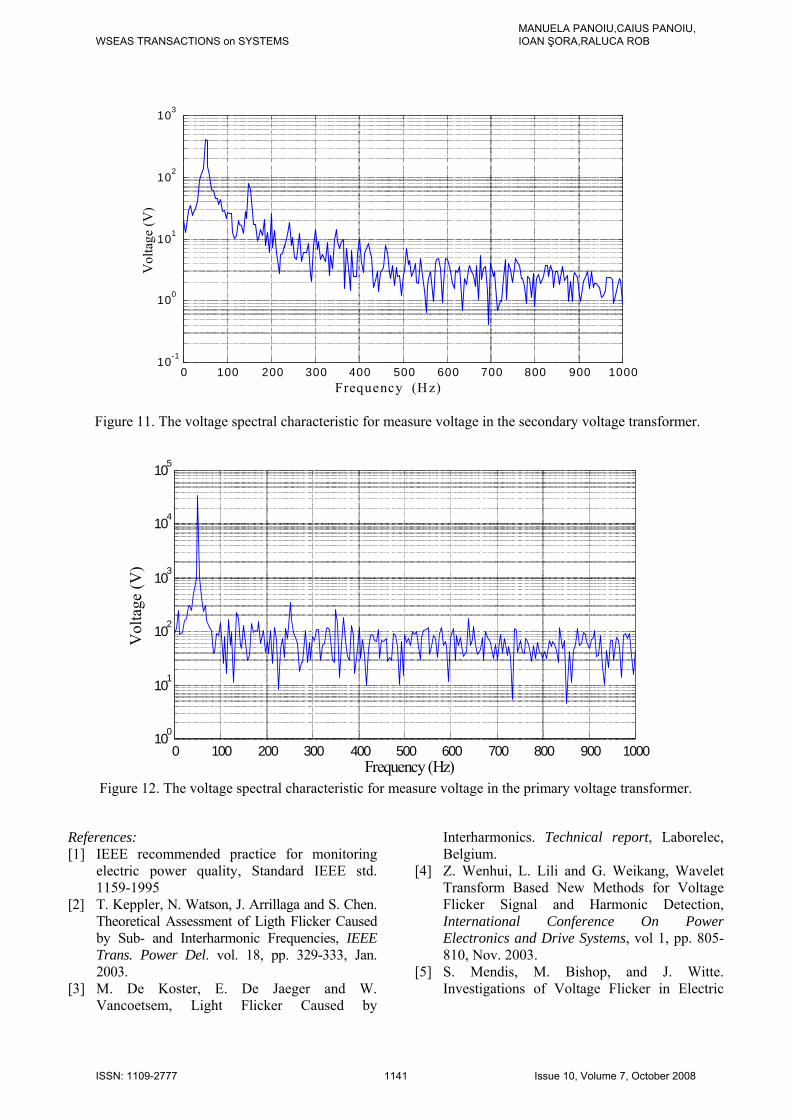
blems, especially as voltage items The measurements were made at a 3-phase power suto which were not connected the harmonics filters. The measurements were made using a numerical data acquisition board. Details about thmeasurements method are present in [13]. In figure 10 are show the signal spectrum for simulated voltage in secondary of transfoin figures 11 and 12 are show the signal spectrum for measured voltage in secondary and in primary of transformer (for one phase). Comparing the simulating spectral characteristic from figure 4 and figure 6, and mfrom figure 11 and figure 12 (for the medium voltage line feed) it can be observe the presence of the same harmonics and interharmonics.
The functioning of electric arcpower quality proflickers, to the power supply system to which it is connected. Nowadays, most utilities and power customers are facing the need to solve the power quality problem created by EAF. In this paper the possibility of flicker simulation was analyze using a dedicated simulation program. For simulation it was use two models of the electric arc. Both these models allow simulating the rapid variation of the electric arc parameters. The results of simulation were comparing with some measurements made on an industrial plant. By compare the simulation with the measurements results that the models are appropriate to study the flicker phenomena and the nonsinusoidal regime.
WSEAS TRANSACTIONS on SYSTEMSMANUELA PANOIU,CAIUS PANOIU, IOAN ŞORA,RALUCA ROB
ISSN: 1109-2777 1140 Issue 10, Volume 7, October 2008
0 100 200 300 400 500 600 700 800 900 1000 10 -1
10 0
10 1
10 2
10 3
Frequency (Hz)
Vol
tage
(V)
Figure 11. The voltage spectral characteristic for measure voltage in the secondary voltage transformer.
0 100 200 300 400 500 600 700 800 900 1000 10 0
10 1
10 2
10 3
10 4
10 5
Frequency (Hz)
Vol
tage
(V)
Figure 12. The voltage spectral characteristic for measure voltage in the primary voltage transformer.
References: [1] IEEE recommended practice for monitoring
electric power quality, Standard IEEE std. 1159-1995
[2] T. Keppler, N. Watson, J. Arrillaga and S. Chen. Theoretical Assessment of Ligth Flicker Caused by Sub- and Interharmonic Frequencies, IEEE Trans. Power Del. vol. 18, pp. 329-333, Jan. 2003.
[3] M. De Koster, E. De Jaeger and W. Vancoetsem, Light Flicker Caused by
Interharmonics. Technical report, Laborelec, Belgium.
[4] Z. Wenhui, L. Lili and G. Weikang, Wavelet Transform Based New Methods for Voltage Flicker Signal and Harmonic Detection, International Conference On Power Electronics and Drive Systems, vol 1, pp. 805-810, Nov. 2003.
[5] S. Mendis, M. Bishop, and J. Witte. Investigations of Voltage Flicker in Electric
WSEAS TRANSACTIONS on SYSTEMSMANUELA PANOIU,CAIUS PANOIU, IOAN ŞORA,RALUCA ROB
ISSN: 1109-2777 1141 Issue 10, Volume 7, October 2008

Arc Furnace Power Systems, IEEE Industry Applications Magazine, Jan./ Febr. 1996.
[6] M. Morcos and J. Gomez. Flicker Sources and Mitigation, IEEE Power Engineering Review, Nov. 2002.
[7] Z. Zhang, N. Fahmi and W. Norris, Flicker Analysis and Methods for Electric Arc Furnace Flicker Mitigation (A Survey), 2001 IEEE Porto Power Tech Conference, Portugal, 2001.
[8] Montanari, G.C., Loggini, M., Cavallini, A., Pitti, L., Zaminelli, D. (1994), Arc-Furnace model for the Study of Flicker Compensation in Electrical Networks, IEEE Transactions on Power Delivery, vol. 9, No. 4, pg. 2026-2036.
[9] Tang, L., Kolluri, S., Mark, F. Mc-Granaghan, Voltage Flicker Prediction for two simultaneously operated Arc Furnaces, IEEE Trans. on Power Delivery, vol. 12, No. 2, 1997.
[10] Panoiu M, Panoiu C, Modeling and simulating the AC electric arc using PSCAD EMTDC, Proceedings of the 5th WSEAS Int. Conf. on System Science and Simulation in Engineering, Tenerife, Spain, Dec. 16-18, 2006
[11] Panoiu M., Panoiu C., Osaci M, Muscalagiu I., Simulation Result about harmonics filtering for Improving the Functioning Regime of the UHP EAF, Proceedings of the 7th WSEAS Int. Conf. on Signal Processing, Computational Geometry and Artificial Vision , Vouliagmeni
Beach, Athens, Greece, Aug. 24-26, 2007, pg. 71-76
[12] Panoiu M., Panoiu C., Osaci M, Muscalagiu I., Simulation Results for Modeling the AC Electric Arc as Nonlinear Element using PSCAD EMTDC, WSEAS Transaction on circuits and systems, pp 149-156. vol 6, 2007
[13] Panoiu M., Panoiu C., Osaci M, Muscalagiu I., Simulation Result about Harmonics Filtering using Measurement of Some Electrical Items in Electrical Installation on UHP EAF, WSEAS Transaction on circuits and systems, vol 7, Jan 2008, pp 22-31.
[14] www.pscad.com [15] Draela, J. Mastny, P.; Prochazka, Z., Light
flicker caused by interharmonics and interharmonic-flicker curves of lamps, WSEAS Transactions on Power Systems, v 1, n 2, Feb. 2006, p 554-61
[16] Yufei Wang, Jianguo Jiang, Mitigation of electric arc furnace voltage flicker using static synchronous compensator, WSEAS Transactions on Power Systems, v 1, n 10, Oct. 2006, p 1734-9
[17] Mazadi, M. Hosseinian, S.H., Estimation of flicker indices in a large power system, WSEAS Transactions on Systems, v 4, n 8, August, 2005, p 1191-1197
WSEAS TRANSACTIONS on SYSTEMSMANUELA PANOIU,CAIUS PANOIU, IOAN ŞORA,RALUCA ROB
ISSN: 1109-2777 1142 Issue 10, Volume 7, October 2008