Simulation of Hot Tearing and Distortion during...
18
Simulation of Hot Tearing and Distortion during Casting of Steel: Comparison with Experiments C. Monroe C. Beckermann Department of Mechanical and Industrial Engineering The University of Iowa, Iowa City, IA 52242 Abstract Hot tears are defects that occur during solidification of a casting that is subjected to mechanical restraints. Several key factors are known to aggravate the hot tearing of cast steel. These factors include: increasing the duration of a hot spot without increasing the feeding, increasing the strain, and increasing the solidification range through alloying elements. The effects of these factors have been evaluated during solidification through the use of a T-section test casting. The T-section test castings provide measurements of distortion and stresses during solidification and during further cooling of the casting. The results confirm previous findings and provide new data for analysis and comparison for accurate hot tear prediction. Introduction Hot tearing in any steel casting is disastrous. Extensive rework is required with the appearance of any small linear indication on the casting. Either design or process changes will be proposed to eliminate this defect. However, even the normal process fluctuations can cause random appearances of this defect during production. It is possible that previous successful changes may not help eliminate future hot tear problems. Improved hot tear prediction and a more fundamental understanding of hot tearing is important when trying to eliminate this defect from any part or process. Fundamentally, two local phenomena are working in the mushy zone to create hot tears. These two phenomena are a lack of liquid feeding and tensile solid deformation. First, liquid feeding is the flow of liquid metal into or away from the mushy zone to account for volumetric changes in the mushy zone. The mushy zone is analogous to a sponge shown in the insert in Figure 1. Initially liquid may flow through the sponge but as the liquid flows it also solidifies. Eventually the flow may be cut off because the liquid pockets become isolated. As long as the liquid pressure is sufficient to drive liquid into the pockets, no porosity will form. But when the pockets become isolated then the liquid will not feed the contraction during solidification and porosity will form. Second, tensile solid deformation is also necessary for the creation of hot tears. In the sponge analogy, this tensile deformation is like stretching the sponge. Alternatively, compressive deformation is like squeezing the sponge and may eliminate porosity and hot tears. Tensile deformation is caused by the restrained thermal contraction of the entire casting. Restrained thermal contraction may occur, for example, by a core surface or by another feature of the same casting. When the mushy zone is being deformed in tension, solid dendrites or grains are being pulled apart. As the solid pieces are pulled apart, additional liquid metal must flow into the mushy zone to fill this space. If the liquid metal cannot feed this deformation, then again porosity will form. Under ample deformation this initial porosity will propagate to form a hot tear.
Transcript of Simulation of Hot Tearing and Distortion during...

Simulation of Hot Tearing and Distortion during Casting of Steel: Comparison with Experiments C. Monroe C. Beckermann Department of Mechanical and Industrial Engineering The University of Iowa, Iowa City, IA 52242 Abstract
Hot tears are defects that occur during solidification of a casting that is subjected to mechanical restraints. Several key factors are known to aggravate the hot tearing of cast steel. These factors include: increasing the duration of a hot spot without increasing the feeding, increasing the strain, and increasing the solidification range through alloying elements. The effects of these factors have been evaluated during solidification through the use of a T-section test casting. The T-section test castings provide measurements of distortion and stresses during solidification and during further cooling of the casting. The results confirm previous findings and provide new data for analysis and comparison for accurate hot tear prediction.
Introduction
Hot tearing in any steel casting is disastrous. Extensive rework is required with the appearance of any small linear indication on the casting. Either design or process changes will be proposed to eliminate this defect. However, even the normal process fluctuations can cause random appearances of this defect during production. It is possible that previous successful changes may not help eliminate future hot tear problems. Improved hot tear prediction and a more fundamental understanding of hot tearing is important when trying to eliminate this defect from any part or process.
Fundamentally, two local phenomena are working in the mushy zone to create hot
tears. These two phenomena are a lack of liquid feeding and tensile solid deformation. First, liquid feeding is the flow of liquid metal into or away from the mushy zone to account for volumetric changes in the mushy zone. The mushy zone is analogous to a sponge shown in the insert in Figure 1. Initially liquid may flow through the sponge but as the liquid flows it also solidifies. Eventually the flow may be cut off because the liquid pockets become isolated. As long as the liquid pressure is sufficient to drive liquid into the pockets, no porosity will form. But when the pockets become isolated then the liquid will not feed the contraction during solidification and porosity will form. Second, tensile solid deformation is also necessary for the creation of hot tears. In the sponge analogy, this tensile deformation is like stretching the sponge. Alternatively, compressive deformation is like squeezing the sponge and may eliminate porosity and hot tears. Tensile deformation is caused by the restrained thermal contraction of the entire casting. Restrained thermal contraction may occur, for example, by a core surface or by another feature of the same casting. When the mushy zone is being deformed in tension, solid dendrites or grains are being pulled apart. As the solid pieces are pulled apart, additional liquid metal must flow into the mushy zone to fill this space. If the liquid metal cannot feed this deformation, then again porosity will form. Under ample deformation this initial porosity will propagate to form a hot tear.
becker
Text Box
Monroe, C., and Beckermann, C., “Simulation of Hot Tearing and Distortion During Casting of Steel: Comparison with Experiments,” in Proceedings of the 60th SFSA Technical and Operating Conference, Paper No. 5.7, Steel Founders' Society of America, Chicago, IL, 2006.
The addition of Sulfur and Phosphorus will not change the fundamentals
mentioned above. Instead, Sulfur and Phosphorus will segregate to the grain boundaries and depress the solidus temperature. This last liquid to solidify is on grain boundaries, which under tensile deformation will easily separate. The depressed solidus temperature increases the time that tensile strain may accumulate when flow is cut off.
Figure 1. Schematic of a deforming mushy zone.
Many hot tear experiments have been performed to characterize this defect. One of the most complete summaries of steel hot tear test castings is in the Steel Founder’s Society of America Research Report #38 by Charles Briggs [1]. In the report, a variety of geometries are investigated for hot tear tendency. Some of the different geometries considered include cylindrical designs (valve and pipe type castings), and straight designs with a transition (I-beams and T-sections). This report is the primary guide for elimination of hot tears through design of steel castings. Recommendations from this report include watching section size transitions and adding taper or radii to transitions.
From this report, the T-section test casting was determined as an excellent case study for evaluating hot tear models. In Figure 2, the original setup and results in the report for this test casting are summarized. These 36” length castings are restrained by cast in bolts which are attached to the flask. Depending on the ratio of the hot spot size to the width of the long section, the casting may or may not tear. The widths of the arm, dimension ‘C’, and leg, dimension ‘E’ are varied in each casting. Increasing the dimension of the arm, dimension ‘C’, will increase the compliance of the section, decrease hot tear tendency, and decrease the stress on the section. Increasing the dimension of the leg, dimension ‘E’, will increase the hot tear tendency by increasing the vulnerable time that the section may be strained to hot tear. In these results, the top casting in the picture with a 2” hot spot (dim E) and a 1” long section width (dim C) tore. The other geometries did not tear. From this experiment, it was concluded that to avoid hot tears restrained thin sections should not be joined to larger sections. Two primary reasons make the T-section casting well suited for repeating and comparing to hot tear models. First, the properties of the mold play little role in the start or propagation of the tear. This is an advantage because mold properties are confounding parameters in many test castings that hot tear. In fact for cylindrical castings, the mold properties are the most significant factors that influence hot tearing behavior [2]. Second,
Liquid hot spot Solid Casting
Mushy zone with liquid pockets
Tensile strain

the simplicity of this casting keeps the stressed direction almost completely in one dimension. For these reasons, this test casting provides an excellent comparison of model results to the actual distortions and stresses achieved. The previous results presented are limited to the picture shown above and a short table listing which castings tore. New experiments with additional measurements of the distortion and forces were repeated in order to attempt to gather data to compare to simulation.
Figure 2. T-Section Hot Tear Test Casting setup and results.
New Experimental Setup
The T-section is a test casting with many desirable features for understanding the basics of hot tears. Figure 3 provides a schematic of the features in the new experimental setup. Table 1 lists the parameters of the different castings poured. Added to the old design, two small location tabs were included. These tabs were located where the greatest casting distortion was expected so that the probes would measure it. All of the new probes added to the experimental setup are designated on Figure 3. The longest length of this casting was 36” and the thickness was 1”, these dimensions were constant for every casting. Surrounding this mold was a flask used for mounting instrumentation and restraining the cast-in bolts. Therefore, this flask did not come in contact with the mold surface. The bolts extended from the flask to the mold cavity where they were cast-in upon pouring. These bolts resisted the thermal contraction of the casting and therefore provided the restraint which was needed for hot tearing.
Table 1. Castings Poured using the New Experimental Setup
Casting # Arm Leg Composition Restraint Tear 1 2” 1” Low Sulfur Bolts None 2 2” 2” Low Sulfur Bolts None 3 1” 1” Low Sulfur Bolts None 4 1” 2” Low Sulfur Bolts None 5 1” 2” High Sulfur Bolts Large Tear 6 2” 2” High Sulfur Bolts Linear Indication 7 1” 2” High Sulfur None None

Figure 3. Schematic of the T-section setup with measurement probe locations.
The molds were made of furan sand, horizontally parted. The mold size was 60”
long, 18” wide, and 12” deep (6” cope and 6” drag). During assembly, the cope and drag were “sanded” across each other to ensure that the flash due to mismatch was eliminated. Figure 4 is included to show the drag and the placeholders for instrumentation which will be discussed later. The castings were poured without a typical flask, but with the surrounding box used to mount the instrumentation and the restraining bolts. This surrounding box or flask is shown assembled around a mold in Figure 5. The cast-in bolts extended to the plates on either side and were tightened onto four 1” diameter steel pipes. The end plates were stiffened using two pieces of angle iron at the top and bottom where the pipes join the plates. Note that there was a large ~12” gap on both sides between the end plates and the mold. This space provided room to install the force gauges. This end plate and pipe assembly will be referred to as the flask.
Figure 4. Drag side for the T-section casting mold.
D5
D2 D4
D1 D3
x
y
F1 F2C
E mold
casting
pipe
pipe End plates

Figure 5. Flask assembled around the T-section casting mold.
The casting was poured from a 200 lb heat, prepared in an induction furnace. The
intended major alloy change between the first four castings and the final three castings was in the sulfur and phosphorus content. An increase in the Sulfur and Phosphorus content increases the likelihood of a hot tear. The alloy targeted was a low alloy, WCB, the final compositions for each casting is listed in Table 2.
Table 2. Alloy Composition
Casting # C Si Mn S P Briggs 0.23 0.5 0.6 0.028 0.016 1 and 3 0.22 0.46 0.39 0.012 0.015 2 and 4 0.29 0.54 0.47 0.009 0.007
5 0.20 0.6 0.64 0.028 >0.084 6 and 7 0.24 0.66 0.54 0.047 0.037
Force Measurement
In order to capture the transient deformation, force, and temperature for this casting, several measurement devices were used. The casting was restrained by bolts which extended from the casting to the flask. To ensure the mechanical contact from the bolt to the casting a nut was threaded on the bolt which was placed in the mold cavity. Load cells were used to measure the force and must be placed in line with the bolts. The load cells used were made from a 0.5” bolt with strain gauges attached to a flat surface, which was ground onto the bolts. This is shown in Figure 6. Similar load cells are rated to ~9000 lbs. In Figure 3, the load cell locations are shown in the schematic form and labeled F1 and F2.

Figure 6. Load Cell bolt. Distortion Measurement
In order to measure the deformation, linear voltage displacement transducers (LVDT) were used. The temperatures nearby the casting were too high to place the LVDT arrangement in the mold; therefore quartz rod and tube assemblies were used to transmit the deformation outside the mold. This was originally proposed by researchers measuring the expansion of graphite in cast iron, because quartz has low thermal expansion [3]. The assembly is illustrated in Figure 7, where a quartz rod of 0.08” (2mm) diameter is inserted through a quartz tube which is secure at the parting line. The rod is free to translate back and forth within the tube thus translating the movement to the LVDT. One end of the 0.08” (2mm) rod was placed inside the mold cavity where the liquid metal would solidify around it. In order to ensure optimum mechanical contact, this end was bulged. Without this bulge, the contracting solid metal would release the quartz rod due to the differences in expansion between the steel and quartz. Outside the mold the 0.08” (2mm) rod is attached to the LVDT by means of a Swagelock fitting using a Teflon ferule. This LVDT was attached to the flask outside of the mold. A total of three transient LVDT measurements were recorded per casting. In Figure 3, the LVDT locations are shown in the schematic form and labeled D2, D4, and D5.
Figure 7. Quartz rod and tube assembly illustrating the bulged end.
The flask was not fixed to the mold or the ground; therefore its movement was
also measured to correct the LVDT probes which were attached to the flask. To accomplish this proximity probes were mounted on either side of the flask near the bolt. In Figure 3, the proximity probe locations are shown in the schematic form and labeled D1 and D3.
All of the transient probe measurements were recorded in volts using a DAQbook
USB data logger. The sampling rate was every ~1.5 seconds. The voltage signals were then converted to displacements or forces using calibration curves obtained before the experiment. Results First, the hot tears found in all castings will be discussed. Then, a detailed review of one casting will be made to show an example of the individual curves and results typical for all castings. In addition, a summary of all the castings will be shown. Finally, comparisons between the experimental results and the simulation results will be shown. Summary of Hot Tearing for all test castings
Table 1 shows the changes in the parameters for the various test castings. As discussed in the introduction, the increase in the leg width increases the hot spot size and thereby increasing the hot tearing tendency. Larger arm widths increase the compliance of the casting and decrease the stress in the casting, thereby decreasing the hot tearing tendency. The addition of Sulfur and Phosphorus depress the solidus temperature and therefore increase the time that the section may hot tear. From the table it is shown that only two of the seven castings poured had linear indications. Casting 5, which was anticipated to hot tear, had a large crack. The other casting with an indication, Casting 6, was not reported to crack although conditions were sufficient for hot tear.
This binary (on-off) effect of hot tearing between castings can be seen to turn on
or off just by the addition of Sulfur and Phosphorus or by increasing the hot spot size. In the previous results from Briggs, it is reported that the increase of hot spot size alone will cause the transition from no tear to tear. However the new results show that the hot tear depends on the addition of Sulfur and Phosphorus. This does not mean that Sulfur and Phosphorus is necessary for hot tearing, but it does mean that this alloy addition will certainly aggravate hot tear issues. Figure 8 shows a magnified view of the crack in the inset. Detailed review of Casting 5 - 1” arm and 2” leg
The following Figure 8 shows the final casting shape from this heat. No temperature measurement was taken on this casting. The data was collected over the course of ~1.75 hours. This casting solidified in approximately ~2 minutes. The measurements were in the desirable range for the probes. The heat was poured at 2966 degrees Fahrenheit. A large hot tear was found. This tear initiated on a flat surface opposite the gating and not in the interior corners as one might expect. The tear

propagated into the hot spot ~2” and opened to a width of ~0.25”. The movement of the probes D2 and D4 are shown in Figure 9.
Figure 8. Final shape for Casting 5 with magnified view of crack in inset.
In Figure 9, the displacement curves separate early into solidification. This movement is almost symmetric, indicating that the flask did not shift much relative to the mold. The measurements D2 and D4 separate, indicating that the forces are building and that the gap is widening. The crack initiated early in solidification, therefore no crack event can be seen in this figure. The change in displacement direction about 15 minutes into cooling is due to a phase change in low alloy steel from austenite to pearlite at about 1100 degrees Fahrenheit (600 degrees Celsius). During that phase change, the solid expands which is picked up by the measurement. After the phase change is complete, and with additional cooling, the displacement resumes. In Figure 10 below, the displacement of D1 and D3 are shown. This movement mimics the deformation shown by D2 and D4 is the movement/distortion of the flask and not crack opening. As the stresses build, the end plates are expected to bend inward. This inward bending accounts for approximately 0.04” (1mm) of the final movement of probes D2 and D4. Again the phase transformation can be seen to relax the displacement of the end plates.
Figure 11 shows the movement of D5 which tracks the movement in the direction of the gating. This probe is moving toward the gating system showing that the gating is providing some restraint in spite of the casting’s design to minimize this movement. This probe breaks ~10 minutes into cooling, due to shearing possibly due to the crack growing or the phase change. It has been estimated from the other experiments that the magnitude of this deformation should be 0.04”-0.06” (1 - 1.5 mm).
Using the displacements from probes D1-D4 the displacement of the casting was
corrected for distortions of the flask. This “zeroed” measurement is shown in Figure 12. The zeroed measurements for probes D2 and D4 show the same pattern from before but exhibit that the final distortions are likely due to the end plates flexing and not further opening of the crack. Perhaps this reveals that the crack reaches the final size during or just after the phase change.

Figure 9. D2 and D4 displacement curves for casting 5.
Figure 10. D1 and D3 displacement curve for casting 5.
-1.5
-1
-0.5
0
0.5
1
1.5
0 20 40 60 80 100 120-1.5
-1
-0.5
0
0.5
1
1.5
Dis
plac
emen
t (m
m)
Time (min)
D1
D3
-4
-3
-2
-1
0
1
2
3
4
0 20 40 60 80 100 120-4
-3
-2
-1
0
1
2
3
4
Dis
plac
emen
t (m
m)
Time (min)
D4
D2

-0.1
0
0.1
0.2
0.3
0.4
0.5
0.6
0.7
0.8
0 20 40 60 80 100-0
0
0.
0.
0.
0.
0.
0.
0.
0.
Figure 11. D5 displacement curve for casting 5.
Figure 12. Zeroed D2 and D4 displacement curves for casting 5.
-3
-2
-1
0
1
2
3
0 20 40 60 80 100 120-3
-2
-1
0
1
2
3
Dis
plac
emen
t (m
m)
Time (min)
D4
D2
D5
Dis
plac
emen
t (m
m)
Time (min)
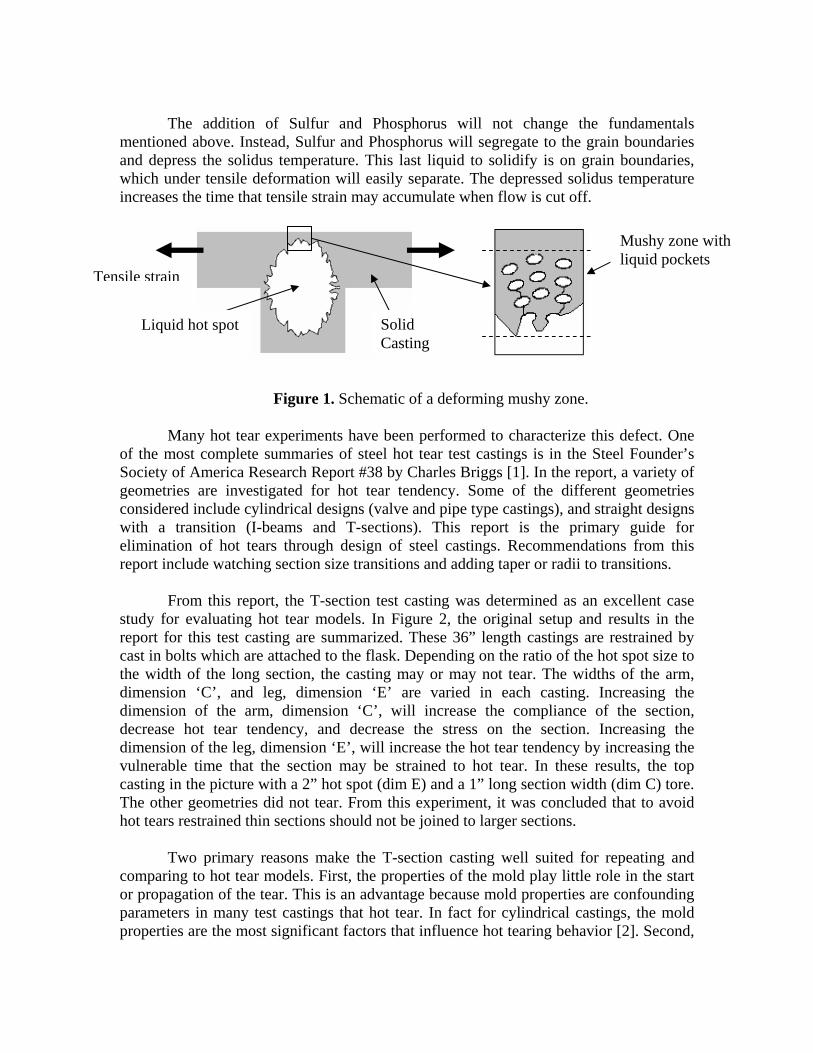
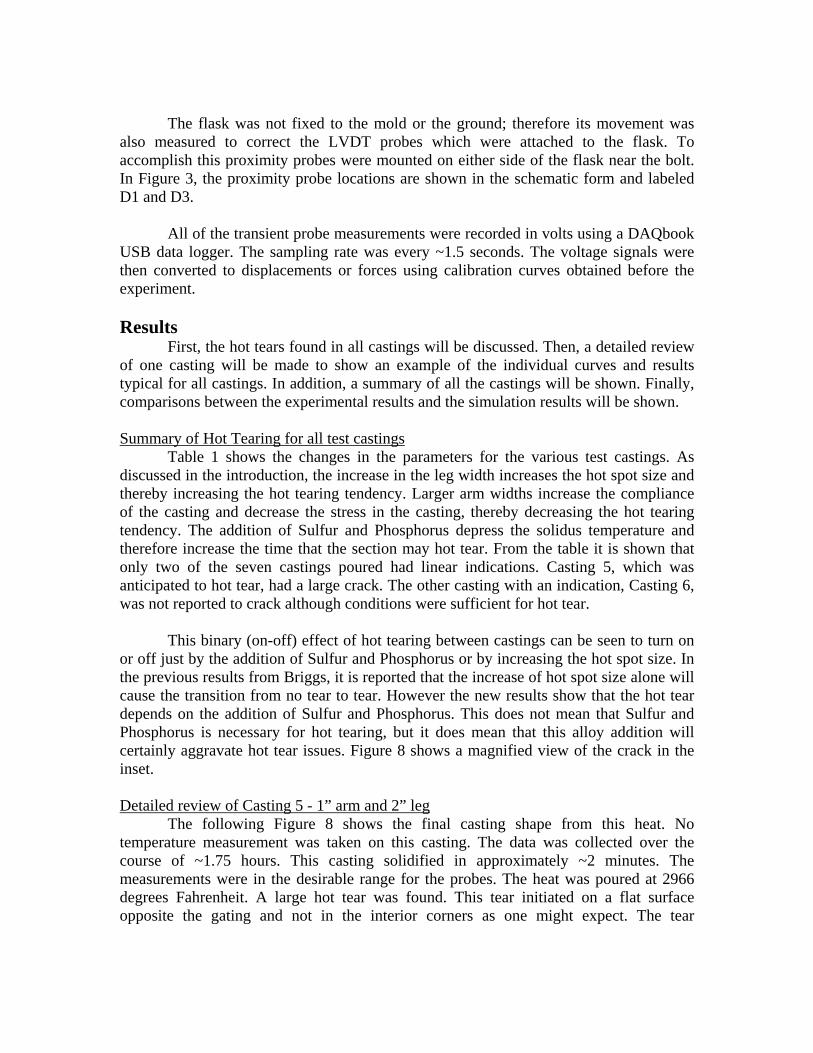
Figure 13. Gap displacement curve for casting 5.
Figure 14. Gap displacement curve zoomed in for first 14 minutes for casting 5.
-1
0
1
2
3
4
5
6
7
8
0 20 40 60 80 100 120-1
0
1
2
3
4
5
6
7
8
Dis
plac
emen
t (m
m)
Time (min)
Gap
Open Close
-1
0
1
2
3
4
5
6
7
8
0 2 4 6 8 10 12 14-1
0
1
2
3
4
5
6
7
8
Dis
plac
emen
t (m
m)
Time (min)
Gap Open Close
4:10 Pour
~6:00 min 100% Solid

Figure 15. Force curve for casting 5.
Figure 16. Force curve zoomed in for the first 14 minutes for casting 5.
-1000
0
1000
2000
3000
4000
5000
0 20 40 60 80 100 120-1000
0
1000
2000
3000
4000
5000Fo
rce
(lbs)
Time (min)
F1
F2
-1000
0
1000
2000
3000
4000
5000
0 2 4 6 8 10 12 14-1000
0
1000
2000
3000
4000
5000
Forc
e (lb
s)
Time (min)
F2
F1
4:10 Pour
~6:00 min 100% Solid

Figure 13 shows the evolution of the gap size during the experiment. The gap
displacement is the change in the “gauge section” of this experiment or the difference in the D2 and D4 probe displacement. The gap displacement measurement for this casting is analogous to a monotonic tension or Gleeble to determine mechanical properties. Although the boundary conditions are different, this test casting measures the forces and strains around a “gauge section” and from the results, temperature dependent yield strength, elastic, and creep properties can be determined. This curve demonstrates many of the previous features of the individual curves including the phase change, crack opening, and growth. Figure 14 looks at the first 14 minutes of Figure 13, showing the gap displacement during solidification. The crack appears to begin to open up about 1 min into solidification.
Figure 15 shows the development of forces for the casting. Two force gauges are used for redundancy. In a perfect test environment, both forces should be the same. However, the forces are different late into cooling. It is believed that this is due to the flask hanging on the mold in an unexpected way. In Figure 16 showing the zoomed-in region, the forces are seen to be identical early in experiment and then deviate roughly at the end of solidification. Although the crack may further confound the force direction, the primary reason for this deviation is believed to be due to some hanging of the flask on the mold. Comparison of all Castings
Figure 17 shows the comparison of the gap displacement for all the 1” wide arm section castings. The gap displacement is a measure of change in the “gauge section” which directly translates to mechanical properties. Note that all of the castings go through the phase change mentioned in the detailed results section at about the same time. This is expected considering the similarity of the section for all the 1” arm sections. All the gap displacements grow with time; this is expected for the restrained castings. The unrestrained casting contracts, this means that the gap is shrinking. Casting 5 develops the hot tear and has the greatest gap opening. Comparing castings 3 and 4, even though casting 4 did not hot tear the larger hot spot contributed to a larger gap opening than in casting 3.
Figure 18 shows the comparison of the gap displacement for all of the 2” wide
arm section castings. The gap opens early in cooling. This is similar to the previous figure but less in magnitude, after which the phase change occurs and the gap closes. The additional mass of the 2” arm lengthens the phase change period by about double the time. The gap closes about 0.08” (2mm) which is approximately double the 1” arm. The total gap displacement is smaller than the 1” arm sections, but this is probably due to the difference in the early displacement which is smaller.

-2
-1.5
-1
-0.5
0
0.5
1
1.5
0 50 100 150 200 250 300-2
-1.5
-1
-0.5
0
0.5
1
1.5
Figure 17. Gap displacement curve for 1” arm castings 3, 4, 5 and 7.
Figure 18. Gap displacement curve for 2” arm castings 1, 2 and 6.
Dis
plac
emen
t (m
m)
Time (min)
Casting 6
Casting 2
Casting 1
Open Close
-4
-2
0
2
4
6
8
0 50 100 150 200 250 300-4
-2
0
2
4
6
8
Dis
plac
emen
t (m
m)
Time (min)
Casting 3
Casting 4 Casting 5
Casting 7 - no restraint
Open Close

Figure 19. Density curve used in simulation illustrating the phase change region.
Figure 20. Temperature profiles from the simulation for times before phase change (a) and after (b).
6800
6900
7000
7100
7200
7300
7400
7500
7600
7700
7800
7900
0 200 400 600 800 1000 1200 1400 1600 18006800
6900
7000
7100
7200
7300
7400
7500
7600
7700
7800
7900D
ensi
ty (k
g/m
3 )
Temperature (oC)
Phase Change from Austenite to Pearlite (663-633oC)
Temperature (oC)
a) Temperatures at ~18 minutes into cooling
b) Temperatures at ~22 minutes into cooling

-1000
0
1000
2000
3000
4000
5000
6000
7000
0 20 40 60 80 100-10
0
10
20
30
40
50
60
70
Plastic Simulation
Experimental
Elastic Simulation
Forc
e (lb
s)
Time (min)
Figure 21. Gap displacement curve comparing experimental and simulated results.
Figure 22. Force curve comparing experimental and simulated results.
-2
0
2
4
6
8
10
12
14
0 20 40 60 80 100 120 140 160 180-2
0
2
4
6
8
10
12
14
Dis
plac
emen
t (m
m)
Time (min)
Plastic Simulation
Experimental
Elastic Simulation

Comparison of simulation Two simulations were run to make a quick comparison to the experimental
results. A more sophisticated model which also considers hot tears is in development but this full model is not yet complete. Therefore, the comparison will be made for a casting that does not hot tear. The temperature and solidification simulation was run using MAGMAsoft. The displacement and force simulation was run using the finite element program, ABAQUS. Two different material models were used, the first was a completely elastic model and the second was a plastic model. Both had temperature dependent properties and the same thermal expansion curves. The thermal properties were generated using the code IDS for the chemistries poured. The temperature dependent mechanical properties were obtained from the general MAGMAsoft property dataset. The density curve is shown in Figure 19 for low alloy chemistry. The phase change from Austinite to Pearlite can be seen at around 650 degrees Celsius. The temperature profiles in the simulated casting are also shown in Figure 20. Two times, one before the onset of phase change and another after phase change, illustrate that the phase change happens almost completely in four minutes.
Figure 21 shows the comparison of the gap displacement for the experimental
results and simulation of casting 3. All of the deformation and stress development in the casting is due to the accumulation of thermal strains upon cooling. The temperature simulation is used as an input to the stress simulation. Then using the density curve, the temperature is changed to thermal strain and the deformation and stress is calculated. In the elastic simulation, the gap displacement is small. This small displacement is attributed to the nearly isothermal cooling of this casting. If the casting were to cool at only one temperature then the casting would also uniformly contract and the elastic deformation would show no gap movement. Even though the casting is nearly isothermal, the non-homogenous temperature does cause a slight feature in the gap displacement near the phase change region showing that something is happening during the cooling.
In the plastic simulation, the gap displacement is much larger than seen in the
experiment. This is due to the poor agreement between the simulation and actual properties. When the simulated yield stress is artificially low compared to the actual yield stress, the gap deformation is expected to be greater than anticipated. In addition, the boundary conditions used in simulation were zero displacement at the ends; this may over-constrain the simulation. In an over-constrained simulation, the forces will be higher and then again the deformation will be greater than expected. Both issues are being investigated. However, the plastic deformation curve shows that the phase change can be accounted for in a simple way. Also the gap is always opening which is also consistent with the experimental results.
In Figure 22, the forces are also compared for the simulation and experimental
results. The force is much harder to match to the experimental results because small changes in the boundary conditions may change both the measured or simulated force. Consider the detailed review of casting 5; in that case the forces were not equal because it is suspected that the flask hung up on the mold. For casting 3 only one force measurement is available, therefore no judgment can be made about this. Also in the
simulation, a fully constrained boundary is used to ensure that no rigid body motions are calculated. However, this may over constrain the casting, causing higher forces internally. These issues are currently being investigated. The elastic curve is greater than the plastic because of the plastic yielding. In a qualitative sense, the forces both simulated and experimental behave similarly; always rising except during the phase change. Discussion
Since the first successful hot tear test casting, the T-section casting has been poured again with refined instrumentation in order to further investigate the distortion and hot tearing of steel castings. The additional measurements provide insights into the fundamentals of hot tearing and also allow comparison to developing simulation. The initial results agree with current understanding.
Comparisons of these results to the simulation show the need to improve the
model. First, improvement of the mechanical properties is necessary for better agreement. Second, the understanding of the boundary conditions applied must be improved. Additional improvement could be gained by including a model for prediction of hot tears, or mechanical porosity creation if no crack propagates.
Acknowledgements
This work was prepared with the support of the U.S. Department of Energy (DOE) Award No. DE-FC36-04GO14230. However, any opinions, findings, conclusions, or recommendations expressed herein are those of the authors, and do not necessarily reflect the views of the DOE. The authors wish to thank the Steel Founder’s Society of America, especially Malcom Blair and Raymond Monroe for their assistance in this work. Also, we thank the member foundry and the University of Northern Iowa, which participated to make the pattern, castings, and to work out the bugs in the experiment.
References 1. C.W. Briggs, Elements of Design for Prevention of Hot Tearing in Steel Castings,
Steel Founders’ Society of America Research Report, No. 38, Technical Research Committee, SFSA, February 1957.
2. C. E. Bates, Effects of Melt Practice, Core Binder, and Core Density on Hot Tearing
of Cast Steel, Steel Founders’ Society of America Research Report, No. 103, Technical Research Committee, SFSA, January 1991.
3. P. Alexandre, A. Goudot, A. Ben Cheikh, J.B. Dalin Renault, D. Celentano, S. Oller,
E. Onate: “Experimental and Numerical Analyses of Thermomechanical Behavior of Sand Cast Iron During Solidification”, pg 237-244, Modeling of Casting, Welding and Advanced Solidification Processes V, edited by M. Rappaz, M.R. Ozgu, and K.W. Mahin, The Minerals, Metals, & Materials Society, 1991.


![Study of Hot Tearing in - Worcester Polytechnic Institute · Study of Hot Tearing in Cast and Wrought Aluminum Alloys by ... silicon [7, 8], A380.1 is Al-Si hypoeutectic [9], whereas](https://static.fdocuments.in/doc/165x107/5ea60bdd934bf3511f1ff7a9/study-of-hot-tearing-in-worcester-polytechnic-institute-study-of-hot-tearing-in.jpg)


![Integrated Approach for Prediction of Hot Tearing...considering the appearance of hot-tear surface that does not show evidence of plastic deformation.[11] Experimental observations](https://static.fdocuments.in/doc/165x107/612872ac204e9d201049af6c/integrated-approach-for-prediction-of-hot-tearing-considering-the-appearance.jpg)