Simulation of Formation Damage After Long-Term Water Flooding
8
Hindawi Publishing Corporation Journal of Petroleum Engineering Volume 2013, Article ID 479827, 7 pages http://dx.doi.org/10.1155/2013/479827 Research Article Simulation of Formation Damage after Long-Term Water Flooding Liu He, 1 Gao Yang, 1 Li Guoxin, 2 and Li Yiliang 1 1 RIPED, PetroChina, Beijing 100083, China 2 Exploration & Production Company, PetroChina, Beijing 100083, China Correspondence should be addressed to Liu He; [email protected] Received 30 January 2013; Revised 18 April 2013; Accepted 18 April 2013 Academic Editor: Alireza Bahadori Copyright © 2013 Liu He et al. is is an open access article distributed under the Creative Commons Attribution License, which permits unrestricted use, distribution, and reproduction in any medium, provided the original work is properly cited. Water flooding is a commonly used technology for enhancing oil recovery. Its main mechanism is to maintain higher pressure to sweep oil towards production wells. However, the strong water flooding will cause higher compression pressure around the injection wellbore. is high pressure in the reservoir causes stress redistribution and higher stress near the wellbore which induces material damage and permeability change. We developed a fluid-solid coupling finite element model to simulate and quantitatively analyze the pressure evolution in the reservoir as well as damage and permeability change in the formation during long-term water flooding process. e obtained results offer theoretical understanding of the benefits (pore pressure increase in the simulation domain), rock damage, permeability change of long-term water flooding, and the insights of how to detect and prevent wellbore failure and collapse due to water flooding. 1. Introduction Water flooding is a worldwide used technology for enhancing oil recovery. Its main mechanism is to maintain higher pressure to sweep oil towards production wells. e effi- ciency and key considerations about the technology have been studied [1, 2]. However the injected water will cause the pressure around the injection wellbore to be much higher than that farther away from the well [3]. is high pressure in the reservoir causes stress redistribution and higher stress near the wellbore which induces material damage and permeability change. Experimental results show that dramatic increase of permeability occurs aſter rock damage [4–6]. Different mechanical models of describing the rock damage and permeability change have been estab- lished. Rutqvist et al. [7] proposed that the permeability is an exponential function of the equivalent strain based on the field measurement data of tunnel excavation prob- lem. According to the uniaxial compression tests of rock material, Tang et al. [5] found that permeability jumps up steeply accompanying rock damage. Other damage models can be consulted in the literature such as Loland damage model, Mazars damage model, and Sidoroff damage model [8]. In the present paper, an axial symmetrical fluid-solid coupling finite element model is established to simulate the water flooding process. e pressure evolution in the reservoir as well as damage and permeability change in the formation during long-term water flooding procedure is studied. e numerical results demonstrate that aſter 5- year water flooding, the maximum pore pressure is increased remarkably. e formation damages gradually near the water injection wellbore and in the damaged area, the reservoir permeability jumps up. e area of damage is enlarged during the water flooding process. e efficiency of water injection is significant. Rock damage and permeability change near the wellbore should be considered when planning a water injection well due to the potential risks. Fully coupled fluid-solid finite element simulation of water-injection is rarely seen in the literature to our knowl- edge. e present model can be used to predict the formation pressure evolution and the formation property variation caused by water injection. It is valuable for engineering design.
description
Water flooding is a commonly used technology for enhancing oil recovery. Its main mechanism is to maintain higher pressure tosweep oil towards productionwells.However, the strongwater floodingwill cause higher compression pressure around the injectionwellbore.This high pressure in the reservoir causes stress redistribution and higher stress near the wellbore which induces materialdamage and permeability change.We developed a fluid-solid coupling finite element model to simulate and quantitatively analyzethe pressure evolution in the reservoir as well as damage and permeability change in the formation during long-termwater floodingprocess.Theobtained results offer theoretical understanding of the benefits (pore pressure increase in the simulation domain), rockdamage, permeability change of long-termwater flooding, and the insights of howto detect and preventwellbore failure and collapsedue to water flooding.
Transcript of Simulation of Formation Damage After Long-Term Water Flooding

Hindawi Publishing CorporationJournal of Petroleum EngineeringVolume 2013, Article ID 479827, 7 pageshttp://dx.doi.org/10.1155/2013/479827
Research ArticleSimulation of Formation Damage afterLong-Term Water Flooding
Liu He,1 Gao Yang,1 Li Guoxin,2 and Li Yiliang1
1 RIPED, PetroChina, Beijing 100083, China2 Exploration & Production Company, PetroChina, Beijing 100083, China
Correspondence should be addressed to Liu He; [email protected]
Received 30 January 2013; Revised 18 April 2013; Accepted 18 April 2013
Academic Editor: Alireza Bahadori
Copyright © 2013 Liu He et al. This is an open access article distributed under the Creative Commons Attribution License, whichpermits unrestricted use, distribution, and reproduction in any medium, provided the original work is properly cited.
Water flooding is a commonly used technology for enhancing oil recovery. Its main mechanism is to maintain higher pressure tosweep oil towards productionwells. However, the strongwater floodingwill cause higher compression pressure around the injectionwellbore.This high pressure in the reservoir causes stress redistribution and higher stress near the wellbore which induces materialdamage and permeability change. We developed a fluid-solid coupling finite element model to simulate and quantitatively analyzethe pressure evolution in the reservoir as well as damage and permeability change in the formation during long-termwater floodingprocess.The obtained results offer theoretical understanding of the benefits (pore pressure increase in the simulation domain), rockdamage, permeability change of long-termwater flooding, and the insights of how to detect and preventwellbore failure and collapsedue to water flooding.
1. Introduction
Water flooding is a worldwide used technology for enhancingoil recovery. Its main mechanism is to maintain higherpressure to sweep oil towards production wells. The effi-ciency and key considerations about the technology havebeen studied [1, 2]. However the injected water will causethe pressure around the injection wellbore to be muchhigher than that farther away from the well [3]. This highpressure in the reservoir causes stress redistribution andhigher stress near the wellbore which induces materialdamage and permeability change. Experimental results showthat dramatic increase of permeability occurs after rockdamage [4–6]. Different mechanical models of describingthe rock damage and permeability change have been estab-lished. Rutqvist et al. [7] proposed that the permeabilityis an exponential function of the equivalent strain basedon the field measurement data of tunnel excavation prob-lem. According to the uniaxial compression tests of rockmaterial, Tang et al. [5] found that permeability jumps upsteeply accompanying rock damage. Other damage modelscan be consulted in the literature such as Loland damage
model, Mazars damage model, and Sidoroff damage model[8].
In the present paper, an axial symmetrical fluid-solidcoupling finite element model is established to simulatethe water flooding process. The pressure evolution in thereservoir as well as damage and permeability change inthe formation during long-term water flooding procedureis studied. The numerical results demonstrate that after 5-year water flooding, the maximum pore pressure is increasedremarkably.The formation damages gradually near the waterinjection wellbore and in the damaged area, the reservoirpermeability jumps up.The area of damage is enlarged duringthe water flooding process. The efficiency of water injectionis significant. Rock damage and permeability change nearthe wellbore should be considered when planning a waterinjection well due to the potential risks.
Fully coupled fluid-solid finite element simulation ofwater-injection is rarely seen in the literature to our knowl-edge.The present model can be used to predict the formationpressure evolution and the formation property variationcaused by water injection. It is valuable for engineeringdesign.

2 Journal of Petroleum Engineering
Wellbore axis
PerforationPay layer
Barrier layer
A B CE
F
D
Interface
G
H
I
J
𝑟
𝑧
Figure 1: The computational model (a meridian plane).
POR+1.888𝑒 + 07
+1.814𝑒 + 07
+1.74𝑒 + 07
+1.666𝑒 + 07
+1.592𝑒 + 07
+1.518𝑒 + 07
+1.444𝑒 + 07
+1.37𝑒 + 07
+1.296𝑒 + 07
+1.222𝑒 + 07
+1.148𝑒 + 07
+1.074𝑒 + 07
+1𝑒 + 07
(a) One year
POR+1.716𝑒 + 07
+1.597𝑒 + 07
+1.656𝑒 + 07
+1.537𝑒 + 07
+1.477𝑒 + 07
+1.418𝑒 + 07
+1.358𝑒 + 07
+1.239𝑒 + 07
+1.298𝑒 + 07
+1.179𝑒 + 07
+1.119𝑒 + 07
+1𝑒 + 07
+1.06𝑒 + 07
(b) Two years
POR+1.381𝑒 + 07
+1.318𝑒 + 07
+1.349𝑒 + 07
+1.286𝑒 + 07
+1.254𝑒 + 07
+1.222𝑒 + 07
+1.191𝑒 + 07
+1.127𝑒 + 07
+1.159𝑒 + 07
+1.095𝑒 + 07
+1.064𝑒 + 07
+1.032𝑒 + 07
+1𝑒 + 07
(c) Five years
Figure 2: Pore pressure distributions at different injection years (The model is rotated by 90∘).
2. Mathematical Model
(1)Governing Equations of Stress-Seepage Flow Coupling Fieldin Formation. In the current configuration, the equilibriumequation of porous formation can be written as [9]
∇ ⋅ 𝜎 + f = 0, (1)
where 𝜎 is the total stress matrix in the formation and f is thebody force vector.
The effective stress couples solid deformation with fluidflow by the following formulation [10]:
𝜎 = 𝜎 − 𝑝𝑤I, (2)
Journal of Petroleum Engineering 3
One year
18
16
14
12
10
Two yearsThree years
Four yearsFive yearsInitial value
0 20 40 60 80 100Distance (m)
Pore
pre
ssur
e (M
Pa)
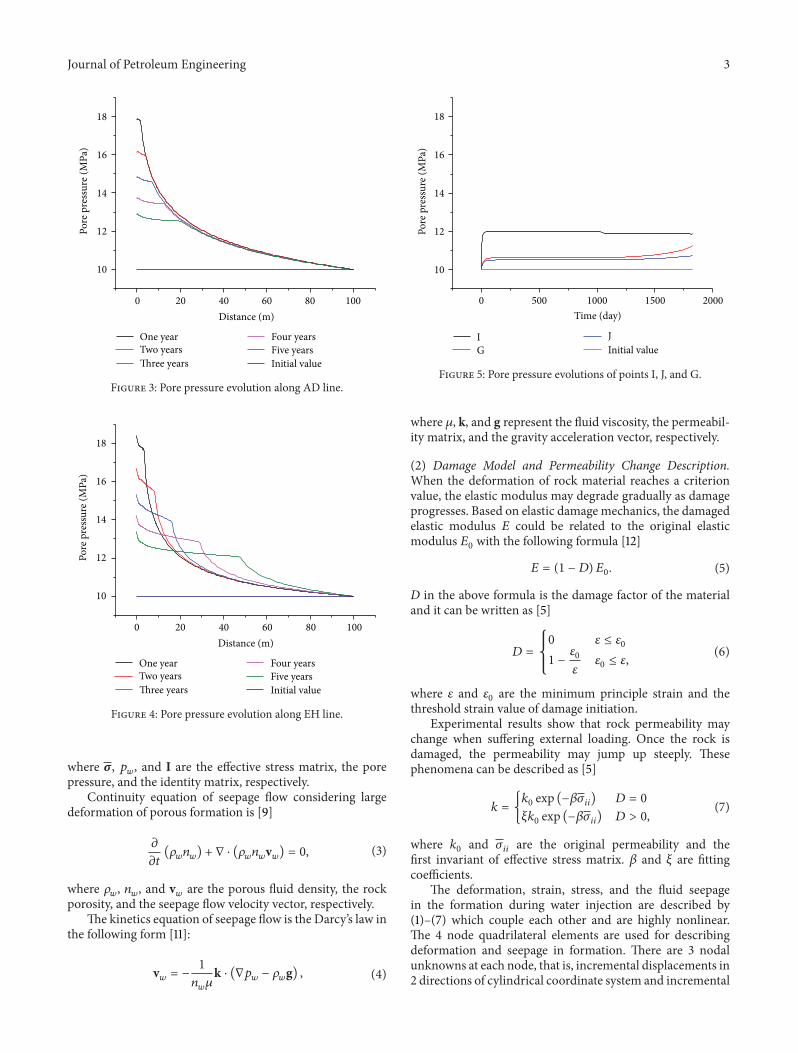
Figure 3: Pore pressure evolution along AD line.
One year
18
16
14
12
10
Two yearsThree years
Four yearsFive yearsInitial value
0 20 40 60 80 100Distance (m)
Pore
pre
ssur
e (M
Pa)
Figure 4: Pore pressure evolution along EH line.
where 𝜎, 𝑝𝑤, and I are the effective stress matrix, the pore
pressure, and the identity matrix, respectively.Continuity equation of seepage flow considering large
deformation of porous formation is [9]
𝜕
𝜕𝑡(𝜌𝑤𝑛𝑤) + ∇ ⋅ (𝜌
𝑤𝑛𝑤k𝑤) = 0, (3)
where 𝜌𝑤, 𝑛𝑤, and k
𝑤are the porous fluid density, the rock
porosity, and the seepage flow velocity vector, respectively.The kinetics equation of seepage flow is the Darcy’s law in
the following form [11]:
k𝑤= −1
𝑛𝑤𝜇k ⋅ (∇𝑝
𝑤− 𝜌𝑤g) , (4)
IG
JInitial value
0 500 1000 1500 2000Time (day)
18
16
14
12
10
Pore
pre
ssur
e (M
Pa)
Figure 5: Pore pressure evolutions of points I, J, and G.
where 𝜇, k, and g represent the fluid viscosity, the permeabil-ity matrix, and the gravity acceleration vector, respectively.
(2) Damage Model and Permeability Change Description.When the deformation of rock material reaches a criterionvalue, the elastic modulus may degrade gradually as damageprogresses. Based on elastic damage mechanics, the damagedelastic modulus 𝐸 could be related to the original elasticmodulus 𝐸
0with the following formula [12]
𝐸 = (1 − 𝐷) 𝐸0. (5)
D in the above formula is the damage factor of the materialand it can be written as [5]
𝐷 =
{
{
{
0 𝜀 ≤ 𝜀0
1 −𝜀0
𝜀𝜀0≤ 𝜀,
(6)
where 𝜀 and 𝜀0are the minimum principle strain and the
threshold strain value of damage initiation.Experimental results show that rock permeability may
change when suffering external loading. Once the rock isdamaged, the permeability may jump up steeply. Thesephenomena can be described as [5]
𝑘 = {𝑘0exp (−𝛽𝜎
𝑖𝑖) 𝐷 = 0
𝜉𝑘0exp (−𝛽𝜎
𝑖𝑖) 𝐷 > 0,
(7)
where 𝑘0and 𝜎
𝑖𝑖are the original permeability and the
first invariant of effective stress matrix. 𝛽 and 𝜉 are fittingcoefficients.
The deformation, strain, stress, and the fluid seepagein the formation during water injection are described by(1)–(7) which couple each other and are highly nonlinear.The 4 node quadrilateral elements are used for describingdeformation and seepage in formation. There are 3 nodalunknowns at each node, that is, incremental displacements in2 directions of cylindrical coordinate system and incremental

4 Journal of Petroleum Engineering
Damage factor+9𝑒 − 01
+8.25𝑒 − 01
+7.5𝑒 − 01
+6.75𝑒 − 01
+6𝑒 − 01
+5.25𝑒 − 01
+4.5𝑒 − 01
+3.75𝑒 − 01
+3𝑒 − 01
+2.25𝑒 − 01
+1.5𝑒 − 01
+7.5𝑒 − 02
+0𝑒 + 00
(a) One year
Damage factor+9𝑒 − 01
+8.25𝑒 − 01
+7.5𝑒 − 01
+6.75𝑒 − 01
+6𝑒 − 01
+5.25𝑒 − 01
+4.5𝑒 − 01
+3.75𝑒 − 01
+3𝑒 − 01
+2.25𝑒 − 01
+1.5𝑒 − 01
+7.5𝑒 − 02
+0𝑒 + 00
(b) Two years
Damage factor+9𝑒 − 01
+8.25𝑒 − 01
+7.5𝑒 − 01
+6.75𝑒 − 01
+6𝑒 − 01
+5.25𝑒 − 01
+4.5𝑒 − 01
+3.75𝑒 − 01
+3𝑒 − 01
+2.25𝑒 − 01
+1.5𝑒 − 01
+7.5𝑒 − 02
+0𝑒 + 00
(c) Five years
Figure 6: Damage factor distributions (The model is rotated by 90∘).
pore pressure. A corresponding incremental finite elementformula was derived in detail [13], and the formula shouldbe solved with the well-known Newton-Raphson iterationscheme. In order to keep the convergence of the simulation,the upper value of damage factor is set as 0.9.
3. Computational Model Description
Most of the wells (including water injection and productionwells) are perforated in the pay layer to weaken the casingbefore normal operation starts. The perforations are helicallydistributed, and usually its density is rather high (e.g. 8–16 perforations/meter). Each perforation in a set of helicallydistributed perforations may develop a damage (or fracture)zone during injecting. The configurations of the damagedzones are very different.Thedamaged zones connect together,and finally a roughly circular dish-like distributed damagedarea forms [14]. Therefore in the paper article we proposedan axial symmetrical fluid-solid coupling finite elementmodel to simulate the long-term water flooding process.Our self-developed user subroutines are incorporated intoABAQUS code to solve (1)–(7) simultaneously. This model
can essentially represent the mechanism of the process, butthe computation burden is greatly reduced compared to 3Dmodel.
The rock type of the reservoir is sandstone. The simu-lation domain is constructed of three layers: one pay layersandwiched between two barrier layers. The perforation isin the middle of pay layer, and its diameter and lengthare 8.8mm and 0.5m, respectively. The thickness of paylayer is 5m. Since the simulation domain is symmetric, thecomputational model only takes the low half of the wholemodel as shown in Figure 1.
The radius and height of the computational model areboth 100m. Fluids can flow throughout the whole simulateddomain. The diameter of wellbore is 124mm. Other basicmodel parameters are initial elastic modulus = 20GPa (forpay layer) and 25GPa (for barrier layers), Poisson’s ratio = 0.2(for pay layer) and 0.25 (for barrier layers), initial per-meability = 1mD (for pay layer) and 0.01mD (for barrierlayers), void ratio = 0.1 (for pay layer) and 0.01 (for barrierlayers), initial pore pressure = 10MPa, the water injection rate= 6.23m3/day, water injection duration = 5 years, thresholdstrain value of damage initiation = 0.0001, and fitting coeffi-cient 𝜉 = 20.

Journal of Petroleum Engineering 5
1
0.8
0.6
0.4
0.2
0
ABF
0 300 600 900 1200 1500 1800Time (day)
Dam
age f
acto
r
Figure 7: Damage factor evolutions of points A, B, and F.
One yearTwo yearsThree years
Four yearsFive years
1
Dam
age f
acto
r
0.8
0.6
0.4
0.2
0
0 5 10 15 20 25 30Length (m)
Figure 8: Damage factor evolution along AC line.
Ten points A, B, C, D, E, F, G, H, I, and J are designatedfor the following discussion. A is located at the left bound ofthe model, and the distance from A to interface is 1.25m. B,C, andD are in the same horizontal line with A.The distancesfrom B and C to A are 0.5m and 30m, respectively. D islocated at the right bound of the model. E, F, G, and H arein the same vertical line with B. The distances from F and Gto interface are 1m and 52m, respectively. E andH are locatedat the top and bottom bounds of the model, respectively. I, J,and C are in the same vertical line. I and F are in the samehorizontal line. J and G are in the same horizontal line.
0 10 20 30 40 50 60 70 80 90 100
0
One yearTwo yearsThree years
Four yearsFive years
−100
−90
−80
−70
−60
−50
−40
−30
−20
−10
Figure 9: Intersections of damaged area and undamaged area atdifferent time.
4. Results and Discussion
Figure 2 shows the pressure distributions in the model afterdifferent injection years. Figures 3 and 4 depict the porepressure evolution along AD line and EH line, respectively.The following observation can be conducted from the figures.Pore pressure increases (compared to the initial value) dueto water injection. The maximum values of pore pressuredecrease, and the influenced area enlarges during waterinjecting. The inflection points in Figures 3 and 4 arethe intersection points of damaged and undamaged areas.Figure 5 depicts the pore pressure evolution of points I, J, andG. After 5-year water injection, the maximum pore pressureis 13.8MPa, which is 38% higher than the initial value. In thearea that is 30m far away from wellbore (such as points I andG), the pressure is higher than the initial value by over 10%.Higher pressure in reservoir is maintained, and the oil couldbe swept from the reservoir and pushed towards productionwells. This is the main purpose of water flooding.
Figure 6 shows the damage factor distributions afterdifferent injection years. Figure 7 depicts the damage fac-tor evolutions of points A, B, and F. Figure 8 depicts thedamage factor distribution along AC line (the horizontalaxis represents the distance to point A). Figure 9 depictsthe intersection of damaged area and undamaged area.Obviously, the damaged zone is enlarging as water floodingproceeds. Point A is located on the wall of wellbore, wherethe compression stress is a lot higher, leading to the damagefactor that firstly reaches the maximum value. In the regionfar away from wellbore, the damage factor is comparativelysmaller.
Figure 10 presents the first invariant of effective stress dis-tribution after different injection years. It should be pointedout that the values in the figure are the increased parts causedby water injection. With careful observations of the figures

6 Journal of Petroleum Engineering
+1.34𝑒 + 07
Stress+1.787𝑒 + 07
+1.489𝑒 + 07
+1.638𝑒 + 07
+1.192𝑒 + 07
+1.043𝑒 + 07
+8.937𝑒 + 06
+5.959𝑒 + 06𝑒 + 06
+7.448𝑒 + 06
+4.47
+2.981𝑒 + 06
+2.427𝑒 + 03
+1.492𝑒 + 06
(a) One year
Stress+1.894𝑒 + 07
+1.578𝑒 + 07
+1.736𝑒 + 07
+1.262𝑒 + 07
+1.105𝑒 + 07
+9.469𝑒 + 06
+6.313𝑒 + 06
+7.891𝑒 + 06
+3.158𝑒 + 068𝑒 + 06
+4.736𝑒 + 06
+2.332𝑒 + 03
+1.5
+1.42𝑒 + 07
(b) Two years
Stress+2.035𝑒 + 07
+1.696𝑒 + 07
+1.526𝑒 + 07
+1.865𝑒 + 07
+1.357𝑒 + 07
+1.187𝑒 + 07
+1.018𝑒 + 07
+6.785𝑒 + 06
+8.4
+3.394𝑒 + 06
+1.698𝑒 + 06
8𝑒 + 06
+5.089𝑒 + 06
+2.398𝑒 + 03
(c) Five years
Figure 10: The first invariant of effective stress distribution induced by water injection (The model is rotated by 90∘).
One year
20
Two yearsThree years
Perm
eabi
lity
(mD
)
Four yearsFive years
15
10
5
0
0 5 10 15 20 25 30Length (m)
Figure 11: The permeability distribution along AC line.
we can find that the maximum values of the first invariantare 17.9MPa, 18.9MPa, and 20.4MPa at the injection point
after one, two, and five years of injection, respectively. Thishigh stress concentration results in material damage andmaycause casing failure.
Figures 11 and 12 show the permeability along AC and FGlines, respectively. It can be seen that as the distance increases,the permeability firstly increases and then drops. In the zonenear wellbore, the stress is higher and accompanyingmaterialdamage; as a result, the permeability jumps up. But in theundamaged zone, the permeability drops and the value isclose to the initial value.
5. Conclusions
An axial symmetrical fluid-solid coupling finite elementmodel is established to simulate water flooding process. Ourdeveloped user subroutines are incorporated into ABAQUScode to solve the mathematical equations.
Compared to the initial value, water flooding will causethe pore to pressure increase, and the influence area enlargesgradually. After 5-year water injection, the maximum porepressure may be 38% higher than the initial value. In the areathat is 30m far away from wellbore, the pressure is higherthan the initial value by over 10%. The purpose of waterinjection is achieved.

Journal of Petroleum Engineering 7Pe
rmea
bilit
y (m
D)
0.2
0.15
0.1
0.05
0
0 10 20 30 40 50Length (m)
One yearTwo yearsThree years
Four yearsFive years
Figure 12: The permeability distribution along FG line.
Water injection may cause the formation propertychange. As water injection proceeds, the compression stresswill redistribute and enlarge. As a result the rockmaterialmaydamage, and the damaged area enlarges during water inject-ing. In this area, the formation permeability jumps up, leadingto the pore pressure decrease. High stress concentration nearinjection point exists. Attention should be paid on the riskrelated to casing failure and/or formation fracture in designand performance of water injection.
Nomenclature
D: Damage factor, dimensionlessE: Damaged elastic modulus of the rock material, m/Lt2,
PaE0: Original elastic modulus of the rock material, m/Lt2, Pa
f : Body force vector, m/L2t2, Pa/mg: Gravity acceleration vector, L/t2, m/s2I: Identity matrix, dimensionlessk: Permeability matrix, L2, m2k0: Initial permeability, L2, m2
n𝑤: Porosity, dimensionless
p𝑤: Porous pressure, m/Lt2, pa
vw: Seepage flow velocity vector, L/t, m/s𝛽 : Fitting coefficient, dimensionless𝜀 : Minimum principle strain and the threshold value of
damage initiation, dimensionless𝜀0: Threshold value of 𝜀, dimensionless𝜇 : Fluid viscosity, m/Lt3, Pa.s𝜌𝑤: Density of porous fluid, m/L3, kg/m3𝜎: Total stress matrix, m/Lt2, Pa𝜎: Effective stress matrix, m/Lt2, Pa𝜎𝑖𝑖: First invariant of effective stress tensor, m/Lt2, Pa𝜉 : Fitting coefficient, dimensionless.
Acknowledgments
The authors highly appreciate the financial support of State863 Projects and PetroChina Innovation Foundation.
References
[1] M. Latil, Enhanced Oil Recovery, Editions Technip, Paris,France, 1980.
[2] B. A. Stenger, A. B. Al-Katheeri, H. H. Hafez, and S. H. Al-Kendi, “Short-term and long-term aspects of a water injectionstrategy,” in Proceedings of the 13th Abu Dhabi InternationalPetroleum Exhibition and Conference (ADIPEC ’08), vol. 116989,pp. 74–86, Abu Dhabi, United Arab Emirates, November 2008.
[3] E. E. Kristian, C. Jerey, I. Orkhan, N. Julian, andA. A. K. Vegard,“Improved oil recovery with water injection,” EiT-GullfaksVillage, Norwegian University of Science and Technology incooperation with Statoil ASA, 2011.
[4] J. A. Wang and H. D. Park, “Fluid permeability of sedimentaryrocks in a complete stress-strain process,” Engineering Geology,vol. 63, no. 3-4, pp. 291–300, 2002.
[5] C. A. Tang, L. G. Tham, P. K. K. Lee, T. H. Yang, and L. C.Li, “Coupled analysis of flow, stress and damage (FSD) in rockfailure,” International Journal of Rock Mechanics and MiningSciences, vol. 39, no. 4, pp. 477–489, 2002.
[6] A. S. Abou-Sayed, K. S. Zaki, G. G. Wang, and M. D. Sarfare,“Amechanistic model for formation damage and fracture prop-agation during water injection,” in Proceedings of the SPE 6thEuropean Formation Damage Conference: Delivering SustainedProduction (EFDC ’05), vol. 94606, pp. 223–230, Scheveningen,The Netherlands, May 2005.
[7] J. Rutqvist, L. Borgesson, M. Chijimatsu et al., “Modeling ofdamage, permeability changes and pressure responses duringexcavation of the TSX tunnel in granitic rock at URL, Canada,”Environmental Geology, vol. 57, no. 6, pp. 1263–1274, 2009.
[8] X. R. Ge, J. X. Ren, Y. B. Pu,W.Ma, andH. Sun,Macroscopic andMeso Laboratory Research of Rock and Soil Damage Mechanics,Scientific Press, Beijing, China, 2004.
[9] L. E. Malvern, Introduction to the Mechanics of a ContinuousMedium, Prentice-Hall, Upper Saddle River, NJ, USA, 1969.
[10] M. J. Economides and K. G. Nolte, Reservoir Stimulation, JohnWiley & Sons, New York, NY, USA, 3rd edition, 2000.
[11] M. A. Marino and J. N. Luthin, Seepage and Groundwater,Elsevier, New York, NY, USA, 1982.
[12] A. Turon, P. P. Camanho, J. Costa, and C. G. Davila, “A damagemodel for the simulation of delamination in advanced compos-ites under variable-mode loading,”Mechanics of Materials, vol.38, no. 11, pp. 1072–1089, 2006.
[13] G. M. Zhang, H. Liu, J. Zhang, H. A. Wu, and X. X. Wang,“Mathematical model and nonlinear finite element equation forreservoir fluid-solid coupling,” Rock and Soil Mechanics, vol. 31,no. 5, pp. 1657–1662, 2010 (Chinese).
[14] F. J. Biao, A study of numerical simulation on hydraulic fracturepropagation of horizontal fracture, University of Science andTechnology of China, 2010.

Submit your manuscripts athttp://www.hindawi.com
VLSI Design
Hindawi Publishing Corporationhttp://www.hindawi.com Volume 2014
International Journal of
RotatingMachinery
Hindawi Publishing Corporationhttp://www.hindawi.com Volume 2014
Hindawi Publishing Corporation http://www.hindawi.com
Journal ofEngineeringVolume 2014
Hindawi Publishing Corporationhttp://www.hindawi.com Volume 2014
Shock and Vibration
Hindawi Publishing Corporationhttp://www.hindawi.com Volume 2014
Mechanical Engineering
Advances in
Hindawi Publishing Corporationhttp://www.hindawi.com Volume 2014
Civil EngineeringAdvances in
Acoustics and VibrationAdvances in
Hindawi Publishing Corporationhttp://www.hindawi.com Volume 2014
Hindawi Publishing Corporationhttp://www.hindawi.com Volume 2014
Electrical and Computer Engineering
Journal of
Hindawi Publishing Corporationhttp://www.hindawi.com Volume 2014
Distributed Sensor Networks
International Journal of
The Scientific World JournalHindawi Publishing Corporation http://www.hindawi.com Volume 2014
SensorsJournal of
Hindawi Publishing Corporationhttp://www.hindawi.com Volume 2014
Modelling & Simulation in EngineeringHindawi Publishing Corporation http://www.hindawi.com Volume 2014
Hindawi Publishing Corporationhttp://www.hindawi.com Volume 2014
Active and Passive Electronic Components
Hindawi Publishing Corporationhttp://www.hindawi.com Volume 2014
Chemical EngineeringInternational Journal of
Control Scienceand Engineering
Journal of
Hindawi Publishing Corporationhttp://www.hindawi.com Volume 2014
Antennas andPropagation
International Journal of
Hindawi Publishing Corporationhttp://www.hindawi.com Volume 2014
Hindawi Publishing Corporationhttp://www.hindawi.com Volume 2014
Navigation and Observation
International Journal of
Advances inOptoElectronics
Hindawi Publishing Corporation http://www.hindawi.com
Volume 2014
RoboticsJournal of
Hindawi Publishing Corporationhttp://www.hindawi.com Volume 2014