Simulation of computational fluid dynamics and … · Computational fluid dynamics (CFD) is a...
8
1097 † To whom correspondence should be addressed. E-mail: [email protected] Korean J. Chem. Eng., 30(5), 1097-1104 (2013) DOI: 10.1007/s11814-013-0010-2 INVITED REVIEW PAPER Simulation of computational fluid dynamics and comparison of cephalosporin C fermentation performance with different impeller combinations Shengbing Duan* ,† , Guoqiang Yuan**, Yanli Zhao**, Weijia Ni*, Hongzhen Luo*, Zhongping Shi*, and Fan Liu* *Key Laboratory of Industrial Biotechnology, Ministry of Education, School of Biotechnology, Jiangnan University, Wuxi, Jiangsu 214122, China **CSPC Hebei Zhongrun Pharmaceutical Co., Ltd., Shijiazhuang, Hebei 050041, China (Received 4 July 2012 • accepted 23 January 2013) Abstract-Cephalosporin C (CPC) fermentation by Acremonium chrysogenum is an extremely high oxygen-consum- ing process and oxygen transfer rate in a bioreactor directly affects fermentation performance. In this study, fluid dy- namics and oxygen transfer in a 7 L bioreactor with different impellers combinations were simulated by computa- tional fluid dynamics (CFD) model. Based on the simulation results, two impeller combinations with higher oxygen transfer rate (K L a) were selected to conduct CPC fermentations, aiming at achieving high CPC concentration and low accumulation of major by-product, deacetoxycephalosporin (DAOC). It was found that an impeller combination with a higher K L a and moderate shear force is the prerequisite for efficient CPC production in a stirred bioreactor. The best impeller combination, which installed a six-bladed turbine and a four-pitched-blade turbine at bottom and upper layers but with a shortened impellers inter-distance, produced the highest CPC concentration of 35.77 g/L and lowest DAOC/ CPC ratio of 0.5%. Key words: A. chrysogenum, Antibiotic, Cephalosporin C Production, CFD, Shear Force INTRODUCTION Cephalosporin C (CPC) fermentation by filamentous Acremo- nium chrysogenum is an extremely high oxygen-consuming pro- cess. A large amount of oxygen is required for a few reactions in the main CPC synthesis route, where oxygen is used as either elec- tron acceptor or as substrate for biosynthetic oxygenases [1]. The consecutive formations of the intermediates, penicillin N and deac- etoxycephalosporin C (DAOC), as well as the relevant enzymatic catalysis, require a huge amount of oxygen [2]. Oxygen shortage leads to accumulation of the intermediate penicillin N and DAOC, which dramatically decreases CPC production [3-5]. Due to the high viscosity feature and complex rheological properties of CPC fer- mentation, oxygen supply and DO control are very difficult to deal with [6]. Several studies have been reported to the ways of enhancing effi- ciencies of oxygen utilization/supplies in CPC fermentation. Basch and Chiang found that high expression of expandase/hydroxylase gene by genetic engineering were able to significantly reduce the level of DAOC present in the broth compared to that of control strain [7]. A. chrysogenum expressing a fungi oxygen-binding heme pro- tein (Vitreoscilla hemoglobin) was able to enhance CPC produc- tion dramatically [8]. As already known, improvement of oxygen mass transfer capability is another effective method to alleviate the oxygen shortage problem in fermentation processes. However, few studies are reported on the features of oxygen transfer and rheolo- gies in CPC fermentation, and the relationship between shear force in a bioreactor and the relevant CPC productivity. In CPC produc- tion, mechanically stirred bioreactors with multiple-impellers and aeration are frequently used. Design and analysis of such kinds of bioreactor with multiple-impellers agitation and aeration are cru- cial to the achievement of CPC fermentation. For rational design of an agitation system with multiple-impellers, two important fac- tors should be considered: volumetric mass (oxygen) transfer coef- ficient (K L a) and shear force [9]. For filamentous microorganisms producing products such as CPC, the optimal impeller combina- tions selected should provide a sufficient mass transfer rate but not cause serious shear force which results in mechanical damage to cells or cell growth [10]. Several studies have demonstrated the effects of mechanical forces on the morphology of filamentous microorgan- isms and the overall fermentation productivities. Metz et al. found that the length of the mycelial particles of Penicillin chrysogenum ( Pe. chrysogenum) decreased with increasing power input per unit mass in a reactor, indicating that the increased agitation caused the hyphae to become shorter, thicker and highly branched [11]. High agitation rates reduced the agglomeration of Pe. chrysogenum hyphal elements and caused a reduction in both pellet diameters and the concentration of pellets in the work of Nielsen [12]. Smith et al. also observed a drop in penicillin productivity by Pe. chrysogenum and the reduced hyphal lengths when increasing agitation [13]. Computational fluid dynamics (CFD) is a useful tool in analysis of highly complex fluid flow in mechanically stirred reaction tanks. Using CFD tools, many preliminary investigation works regarding mass transfer and shear environment in different kinds of bioreac- tors would have been done [14-18]. In this work, the fluid dynam- ics, oxygen mass transfer coefficient, and the shear force, in a 7 L stirred bioreactor with six different impeller combinations were sim- ulated and investigated using the CFD tool Fluent®. Based on the CFD simulation results, the 7 L bioreactor installing the two impel-
Transcript of Simulation of computational fluid dynamics and … · Computational fluid dynamics (CFD) is a...
1097
†To whom correspondence should be addressed.
E-mail: [email protected]
Korean J. Chem. Eng., 30(5), 1097-1104 (2013)DOI: 10.1007/s11814-013-0010-2
INVITED REVIEW PAPER
Simulation of computational fluid dynamics and comparison of cephalosporin C
fermentation performance with different impeller combinations
Shengbing Duan*,†, Guoqiang Yuan**, Yanli Zhao**, Weijia Ni*, Hongzhen Luo*, Zhongping Shi*, and Fan Liu*
*Key Laboratory of Industrial Biotechnology, Ministry of Education, School of Biotechnology,Jiangnan University, Wuxi, Jiangsu 214122, China
**CSPC Hebei Zhongrun Pharmaceutical Co., Ltd., Shijiazhuang, Hebei 050041, China(Received 4 July 2012 • accepted 23 January 2013)
Abstract−Cephalosporin C (CPC) fermentation by Acremonium chrysogenum is an extremely high oxygen-consum-
ing process and oxygen transfer rate in a bioreactor directly affects fermentation performance. In this study, fluid dy-
namics and oxygen transfer in a 7 L bioreactor with different impellers combinations were simulated by computa-
tional fluid dynamics (CFD) model. Based on the simulation results, two impeller combinations with higher oxygen
transfer rate (KLa) were selected to conduct CPC fermentations, aiming at achieving high CPC concentration and low
accumulation of major by-product, deacetoxycephalosporin (DAOC). It was found that an impeller combination with
a higher KLa and moderate shear force is the prerequisite for efficient CPC production in a stirred bioreactor. The best
impeller combination, which installed a six-bladed turbine and a four-pitched-blade turbine at bottom and upper layers
but with a shortened impellers inter-distance, produced the highest CPC concentration of 35.77 g/L and lowest DAOC/
CPC ratio of 0.5%.
Key words: A. chrysogenum, Antibiotic, Cephalosporin C Production, CFD, Shear Force
INTRODUCTION
Cephalosporin C (CPC) fermentation by filamentous Acremo-
nium chrysogenum is an extremely high oxygen-consuming pro-
cess. A large amount of oxygen is required for a few reactions in
the main CPC synthesis route, where oxygen is used as either elec-
tron acceptor or as substrate for biosynthetic oxygenases [1]. The
consecutive formations of the intermediates, penicillin N and deac-
etoxycephalosporin C (DAOC), as well as the relevant enzymatic
catalysis, require a huge amount of oxygen [2]. Oxygen shortage
leads to accumulation of the intermediate penicillin N and DAOC,
which dramatically decreases CPC production [3-5]. Due to the high
viscosity feature and complex rheological properties of CPC fer-
mentation, oxygen supply and DO control are very difficult to deal
with [6].
Several studies have been reported to the ways of enhancing effi-
ciencies of oxygen utilization/supplies in CPC fermentation. Basch
and Chiang found that high expression of expandase/hydroxylase
gene by genetic engineering were able to significantly reduce the
level of DAOC present in the broth compared to that of control strain
[7]. A. chrysogenum expressing a fungi oxygen-binding heme pro-
tein (Vitreoscilla hemoglobin) was able to enhance CPC produc-
tion dramatically [8]. As already known, improvement of oxygen
mass transfer capability is another effective method to alleviate the
oxygen shortage problem in fermentation processes. However, few
studies are reported on the features of oxygen transfer and rheolo-
gies in CPC fermentation, and the relationship between shear force
in a bioreactor and the relevant CPC productivity. In CPC produc-
tion, mechanically stirred bioreactors with multiple-impellers and
aeration are frequently used. Design and analysis of such kinds of
bioreactor with multiple-impellers agitation and aeration are cru-
cial to the achievement of CPC fermentation. For rational design
of an agitation system with multiple-impellers, two important fac-
tors should be considered: volumetric mass (oxygen) transfer coef-
ficient (KLa) and shear force [9]. For filamentous microorganisms
producing products such as CPC, the optimal impeller combina-
tions selected should provide a sufficient mass transfer rate but not
cause serious shear force which results in mechanical damage to
cells or cell growth [10]. Several studies have demonstrated the effects
of mechanical forces on the morphology of filamentous microorgan-
isms and the overall fermentation productivities. Metz et al. found
that the length of the mycelial particles of Penicillin chrysogenum
(Pe. chrysogenum) decreased with increasing power input per unit
mass in a reactor, indicating that the increased agitation caused the
hyphae to become shorter, thicker and highly branched [11]. High
agitation rates reduced the agglomeration of Pe. chrysogenum hyphal
elements and caused a reduction in both pellet diameters and the
concentration of pellets in the work of Nielsen [12]. Smith et al.
also observed a drop in penicillin productivity by Pe. chrysogenum
and the reduced hyphal lengths when increasing agitation [13].
Computational fluid dynamics (CFD) is a useful tool in analysis
of highly complex fluid flow in mechanically stirred reaction tanks.
Using CFD tools, many preliminary investigation works regarding
mass transfer and shear environment in different kinds of bioreac-
tors would have been done [14-18]. In this work, the fluid dynam-
ics, oxygen mass transfer coefficient, and the shear force, in a 7 L
stirred bioreactor with six different impeller combinations were sim-
ulated and investigated using the CFD tool Fluent®. Based on the
CFD simulation results, the 7 L bioreactor installing the two impel-
1098 S. Duan et al.
May, 2013
ler combinations with optimal prediction in mass transfer rate, as
well as the control impellers (the standard impeller combination set
in the purchased bioreactor) was applied to implement CPC fer-
mentations. The resulting simulation results of the complex flow
field in the reactor, the physiological shapes of A. chrysogenum in
CPC fermentation obtained in the bioreactor and the relationship
between them were carefully investigated and discussed, to inter-
pret/explore the ways of CPC fermentation optimization in a well-
designed stirred bioreactor.
MATERIALS AND METHODS
1. Strain and Fermentation Media
Acremonium chrysogenum HC-3, an industrial CPC producing
strain, supplied by Hebei Zhongrun Pharmaceutical Co. Ltd. was
used in this study.
Seed medium contained (w/w): sucrose 3.5%, glucose 0.5%, corn
steep liquor 3.1%, D,L-methionine 0.05%, CaCO3 0.5%, soybean
oil 0.5%%. pH 6.5. Fermentation medium contained (w/w): corn-
starch 3.5%, dextrin 7.0%, corn steep liquor (dry weight) 5.0%, D,L-
methionine 0.6%, urea 0.3%, (NH4)2SO4 1.3%, CaCO3 1.0%, KH2PO4
0.9%, soybean oil 5.0%, α-amylase (20,000 U/mL) 0.02%, and trace
element solution. pH 5.6. Feeding media (w/w) were soybean oil
(purchased at local supermarket), 25% ammonia water and 20%
(NH4)2SO4 solution.
2. Fermentation Conditions
Seed cultures were carried out in 500 mL Erlenmeyer flasks con-
taining 50 mL seed medium. The flasks were placed on a rotary
shaking incubator at 240 rpm and 28 oC for 84 h. CPC fermentation
was implemented in a 7 L mechanically stirred fermentor (BIO-
TECH-7BG, Baoxing Co. Ltd., China) equipped with on-line DO/
pH measurement probes, with initial medium volume of 5 L and
air aeration rate of 1.2 vvm throughout the fermentations. The inoc-
ulation amount in all CPC fermentations was 15% (v/v). The fer-
mentation temperature was controlled at 28 oC in the first 50 h, then
it was shifted to 25 oC. pH was maintained at a range of 5.5-5.6 by
automatically adding either diluted H2SO4 solution or ammonia water.
The agitation initiated at 300 rpm, and it was manually increased
by an increment of 50 rpm when DO dropped down to a low level
(20%). The electronic balances (JA1102, Haikang Instrument Co.
Ltd., China) connected to an industrial computer via a multi-channels
A/D-D/A converter (PCL-812PG, Advantech Co. Ltd., Taiwan) was
used to on-line monitor soybean oil addition amounts by measur-
ing the weight losses in the feeding reservoirs. The CO2 and O2 partial
pressure in exhaust gas were on-line measured by a gas analyzer
(LKM2000A, Lokas Co. Ltd., Korea). The exhaust gas data and
DO/pH signals from the fermentor control cabinet were collected
into the industrial computer via RS232; oxygen uptake rate (OUR)
and CO2 evolution rate (CER) were then calculated on-line by the
standard calculation formula. Soybean oil feeding was with DO-Stat
based methods via the multi-channels A/D-D/A converter, with the
aid of the self-developed control programs (Visual Basic, Ver. 6.0).
3. Impeller Combinations Configuration in Bioreactor
Six different impeller combinations in the same bioreactor were
simulated and experimentally analyzed in this study. The schematic
diagrams of the impeller combinations are shown in Fig. 1. As shown
in Fig. 1, impeller combination 1 located a six-bladed disk turbine
(6-BDT) at bottom in the bioreactor and a four-pitched-blade tur-
bine (4-PBT) at the upper layer. The same combination was applied
for an impeller combination 2 except that the mounting position of
the 6-BDT moved 15 mm upward. Impeller combination 3 featured
with two 6-BDT, and impeller combination 4 had two 6-BDT located
at the top and bottom of the agitation axis and a 4-PBT mounting
at the middle. Impeller combination 5 had three 6-BDT, and impel-
ler combination 6 featured with two 6-BDT (located at the middle
and bottom) and one 4PBT (located at the top). The details of the
impeller combinations including the impeller types/outlooks and
its geometrical size, as well as the impeller’s mounting positions are
shown in Fig. 1, Table 1 and Table 2. Aeration was supplied through
a thin gas pipe. The inlet vent of the pipe was perpendicular to the
tank bottom facing downward, and it was located between the bot-
toms of the bioreactor and the agitation shaft.
4. Analytical Methods
20 mL of fermentation broth was accurately taken at each sam-
pling time. The samples were centrifuged at 8,000 rpm for 15 min.
The supernatants were collected and properly stored for CPC, and
DAOC measurements. The cell concentration was determined by
cell dry weight analysis. Each cell pellet was washed twice with
deionized water, and then dried at 105 oC until a constant weight
was obtained. After properly diluting the supernatants, CPC and
DAOC were measured by an Agilent 1200 HPLC, under the fol-
lowing conditions: reverse column ODS-C18 4.6 mm×250 mm;
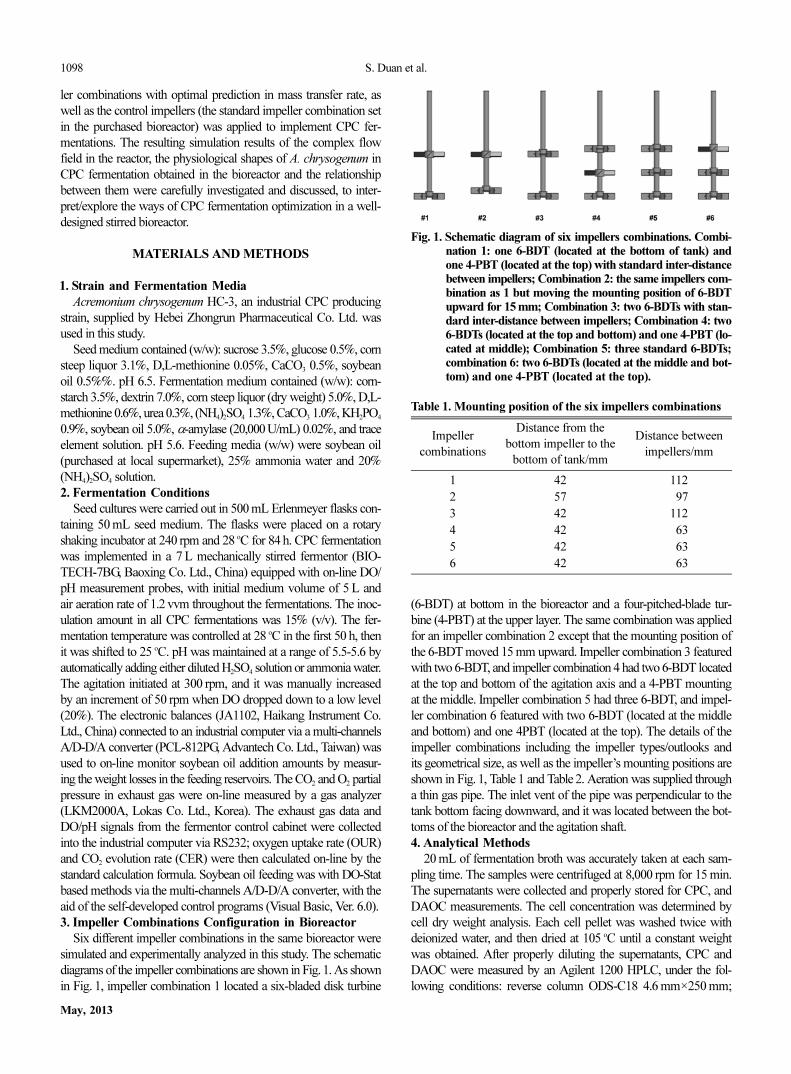
Fig. 1. Schematic diagram of six impellers combinations. Combi-nation 1: one 6-BDT (located at the bottom of tank) andone 4-PBT (located at the top) with standard inter-distancebetween impellers; Combination 2: the same impellers com-bination as 1 but moving the mounting position of 6-BDTupward for 15 mm; Combination 3: two 6-BDTs with stan-dard inter-distance between impellers; Combination 4: two6-BDTs (located at the top and bottom) and one 4-PBT (lo-cated at middle); Combination 5: three standard 6-BDTs;combination 6: two 6-BDTs (located at the middle and bot-tom) and one 4-PBT (located at the top).
Table 1. Mounting position of the six impellers combinations
Impeller
combinations
Distance from the
bottom impeller to the
bottom of tank/mm
Distance between
impellers/mm
1 42 112
2 57 097
3 42 112
4 42 063
5 42 063
6 42 063
Simulation of CFD and comparison of CPC fermentation performance with different impeller combinations 1099
Korean J. Chem. Eng.(Vol. 30, No. 5)
temperature 30 oC; flow rate 0.8 mL/min and mobile phase metha-
nol/distilled water/phosphate=15/85/0.15 (v/v); detection at 254 nm
with an UV detector. The standards of CPC and DAOC were sup-
plied by CSPC Co. Ltd. The cell morphological shapes were visu-
alized and recorded by an optical microscopy (Leica DM4000B
Microscope) equipped with a photomicrographs and Image Pro 3.0
software, by suitably diluting the samples with distilled water. Rheo-
logical properties of the broth were tested using a programmable
rotating rheometer (DV-III Ultra, Brookfield) with a Small Sample
Adapter (SSA) and proper spindle, which provided a defined geom-
etry system for accurate viscosity measurements of small sample
volumes at precise shear rates. Less than 10 mL of broth was used
for rheological test. The rheological test was done according to the
method described by Marten et al. [19], and the recorded data of shear
force and shear strain rate was correlated with power law model.
τ=Kγ n (1)
where τ, γ, K and n are shear force (Pa), shear strain rate (s−1), con-
sistency coefficient (Pa·sn) and flow index (dimensionless), respec-
tively. The correlated parameters of n and K in this study could be
formulated as n=0.75 and K=0.042 Pa·s0.75, which indicated that
the fermentation broth belongs to shear thinning fluid.
5. CFD Model Set-up
To calculate the three-dimensional velocity and shear profiles in
the bioreactor with six (6) different impeller combinations, each
worked individually, a commercial CFD software code Fluent®
(version 6.3.26, Fluent Inc., USA) was utilized to solve the Navier-
Stokes equations. A lot of researchers have used this software to
calculate flow field in stirred tanks [20,21]. GAMBIT® (version
2.3.16, Fluent Inc., USA) was used to generate mesh of the models.
Multiple reference frames (MRF) method [22] was selected to set
up the model in our case. Three or four parts of mesh were created
for each model: the outer stationary part consisting of the station-
ary bulk of the tank including the baffles and two or three sepa-
rated mesh parts containing each rotating impeller. Considering the
geometrical complexity of the impellers, the element types used in
all the three models were tetrahedral. Along with the Eulerian two-
phase model, the dispersed multiphase k-ε turbulent model was also
included to model the two phase turbulent flow in the stirred bio-
reactors. Aeration rate used was identical with that used the fer-
mentations. According to the full baffled condition which assumes
no vortex occurrence at the liquid surface, then the broth surface
was set with degassing wall boundary, which only let gas escape
from the surface and liquid bounded with no friction. Under these
conditions, we assumed that the shaft (impellers) were set as a rotat-
ing wall of 400 rpm, all the other boundaries were set with rough
wall boundaries, and the dispersed phase (gas phase) was air at 25 oC
with uniform bubble diameter of 3 mm and without break-up/coales-
cence effects. To model the shear thinning property of the broth, a
new liquid material was created in Fluent software. Viscosity of
the new material was set as mutative variable of “visEqn” depending
on the local shear strain rate in reactor using the Fluent Expression
Language. The equation defining this variable is as follows:
visEqn=Kγ n−1 (2)
where n=0.71, K=0.032 Pa·s0.71 and γ was the built-in variable in
the Fluent Solver. As the Solver could acquire the local shear strain
rate, the apparent viscosity of the broth could be determined using
the above equation. The CFD model was solved with Fluent® soft-
ware (version 6.3.26, Fluent Inc., USA) installed in a Dawning 4000A
supercomputer system (Dawning Information Industry Co. Ltd.).
Eight AMD 248 processors and about 8GB available RAM were
used to solve the CFD model. The converged steady state solution
of the simulation was assumed when all the variable residuals de-
creased to a criterion level of 10−4, and the total gas hold-up amount
in the tank reached a constant level.
6. Oxygen Mass Transfer Coefficient Model
Based on Higbie’s penetration theory, which is widely used to
describe gas-liquid transfer, and the assumption of non-stationary
diffusion of the elements in gas-liquid interface, Garcia-Ochoa and
Gomez [23] proposed a theoretical model for predicting the oxy-
gen mass transfer coefficient for shear thinning fluid as following.
(3)
where DL is the oxygen diffusivity in the liquid. K, n and ρ are the
consistency coefficient, flow index and density of the fluid, respec-
tively. ε is the local energy dissipation rate.
The specific area of bubble is determined by the following equa-
tion, where φ is the local volume fraction of the gas phase, and db is
the mean diameter of the bubbles (3 mm).
(4)
Based on this theoretical model, Garcia-Ochoa and Gomez pre-
dicted oxygen mass transfer coefficient in bioreactors with different
scale under different operating conditions successfully. Therefore,
the above two equations were used in this work to calculate the oxy-
gen mass transfer coefficient. ε and φ in this work were obtained
from the simulated results.
6. Shear Environment Calculation
Shear stress (shear force) everywhere in the fluid field can be cal-
KL =
2
π------- DL
ερ
K------⎝ ⎠⎛ ⎞
1/2 1+n( )
a =
6φ
db
------
Table 2. Main geometrical parameters of bioreactor and impellers
Bioreactor Impellers
Capacity/L 007 Six-bladed disk turbine size/mm 22×16
Filled volume/L 005 6BDT diameter/mm 80
Diameter/mm 171 Four-pitched-blade turbine size/mm 31×16
Liquid height/mm 231 4PBT diameter/mm 80
Baffle size/mm 225×13 Number of gas pipe inlet vent 17
Number of baffle 004 Gas pipe inlet vent diameter/mm 01
1100 S. Duan et al.
May, 2013
culated using Eq. (1). Based on a weighted average method embed-
ded in Fluent® software (version 2.3.16, Fluent Inc., USA), the aver-
age shear strain rate could be calculated. Then, the average shear
force was calculated by the apparent viscosity times average shear
strain rate.
RESULTS AND DISCUSSION
1. The Simulation Results of Velocity Profile under Different
Impeller Combinations
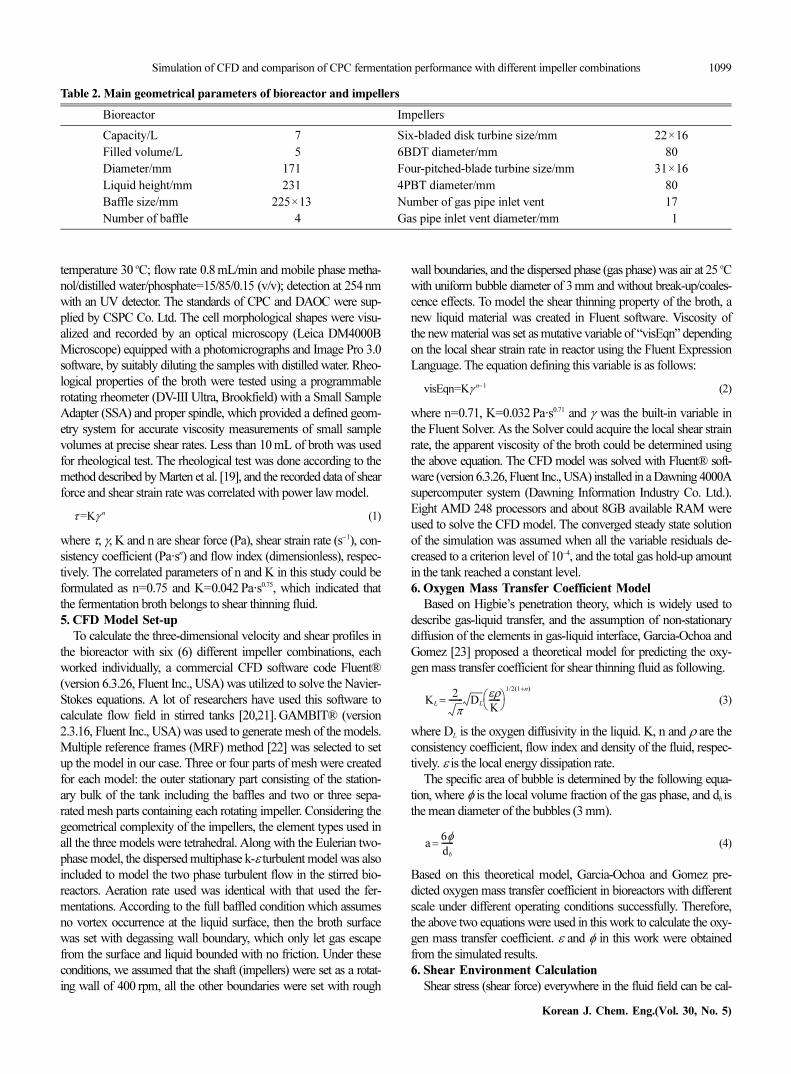
Simulation results of velocity profiles using the six impeller com-
binations (Fig. 2) indicated the flow patterns under different impel-
ler combinations. Under impeller combination 1, 2 and 3, two flow
circulations formed near the upper impeller and bottom impeller.
With impeller combination 2, the radial flow appeared in the bottom
of the reactor because the mounting position of the 6-BDT impeller
was moved upward for 15 mm (as compared with that of combi-
nation 1). However, with impeller combination 3, radial flow formed
near the upper region of the reactor. As for combination 1, no radial
flow regions were observed inside the tank. In combination 1 and 3,
the clearance between the two impellers was larger than their diam-
eter, the discharge flow patterns developed by the upper and bottom
impellers were almost independent. In contrast, a whole mixing flow
pattern was formed with the combination 2. In the reactor installing
the impellers (combination 4), two radial flow circulations formed in
the areas close to the upper and bottom impellers, while an axial
flow circulation appeared in the region nearby the middle 4-PBT
impeller. The flow pattern obtained with combination 5 was some-
what similar to that of combination 1 because the flow circulations
formed by the upper and middle impellers almost merged together,
but the flow velocity in this case was fast. The flow pattern with
impeller combination 6 was basically identical to that of using com-
bination 2, as flow circulations produced by the middle and bottom
impellers were merged to form a radial flow circulation.
The radial flow at the bottom of a bioreactor is crucial to fermen-
tation performance. The existence of the bottom radial flow would
improve the characteristics of oxygen supplies and distribution, be-
cause the breakage and dispersion of air bubbles could be enhanced,
while at the same time, the blending time and area of air in liquid
phase could be enlarged [24,25]. As shown in Fig. 2, with the im-
peller combination 1, 3 and 5, radial flows at the bottom of a stirred
tank were not formed; this fact suggested that those three combina-
tions are not appropriate for the extensive oxygen-consuming fer-
mentations such as CPC production.
In aerated fermentation broth, each flow circulation is an inde-
pendent mixing area, and oxygen transfer rate is high within a flow
circulation region. However, oxygen transfer between each indi-
vidual flow circulation regions is low. Abrardi et al. [26] and Ahmed
et al. [27] reported that the entire mixing performance of a reactor
is dominated by the flow exchange rate between the adjacent circu-
lations. By summarizing the above-mentioned results, excessive
flow circulations are harmful to CPC fermentation due to a longer
mixing/diffusing time of oxygen in a liquid medium. Impeller com-
bination 4 formed excessive/complicated flow circulations leading
to a low oxygen transfer; therefore, this impeller combination (4) is
also not suitable for CPC fermentation and it could be withdrawn
from the candidates list. At this stage, only two impeller combina-
tions, namely combination 2 and 6 are still left in the optimal impel-
lers combination category, and thus the investigation in the sequential
sections was mainly focused on these two combinations.
2. Oxygen Mass Transfer Coefficient under Different Impel-
ler Combinations
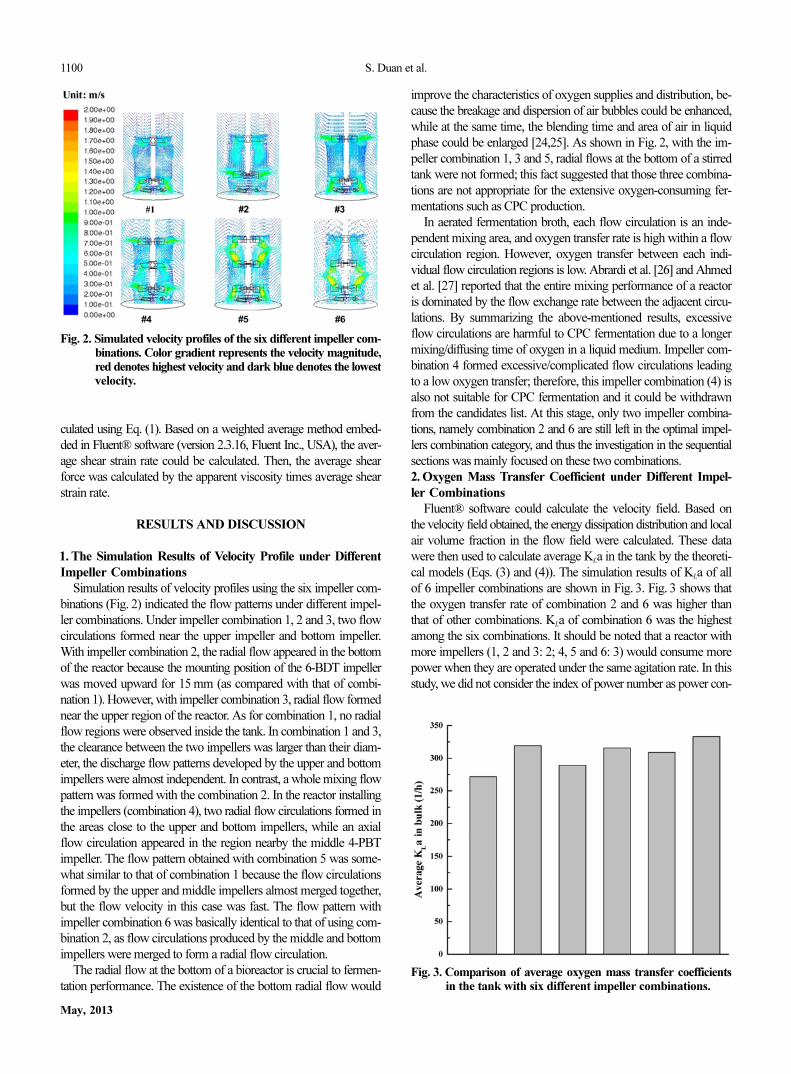
Fluent® software could calculate the velocity field. Based on
the velocity field obtained, the energy dissipation distribution and local
air volume fraction in the flow field were calculated. These data
were then used to calculate average KLa in the tank by the theoreti-
cal models (Eqs. (3) and (4)). The simulation results of KLa of all
of 6 impeller combinations are shown in Fig. 3. Fig. 3 shows that
the oxygen transfer rate of combination 2 and 6 was higher than
that of other combinations. KLa of combination 6 was the highest
among the six combinations. It should be noted that a reactor with
more impellers (1, 2 and 3: 2; 4, 5 and 6: 3) would consume more
power when they are operated under the same agitation rate. In this
study, we did not consider the index of power number as power con-
Fig. 2. Simulated velocity profiles of the six different impeller com-binations. Color gradient represents the velocity magnitude,red denotes highest velocity and dark blue denotes the lowestvelocity.
Fig. 3. Comparison of average oxygen mass transfer coefficientsin the tank with six different impeller combinations.

Simulation of CFD and comparison of CPC fermentation performance with different impeller combinations 1101
Korean J. Chem. Eng.(Vol. 30, No. 5)
sumed in a lab-scaled bioreactor is difficult to measure.
3. Shear Environment under Different Impeller Combinations
The simulation results of the shear strain rates obtained with the
six impeller combinations (Fig. 4) showed that the average shear
force in combinations of 1 and 2 was about 0.46 Pa and the lowest
among the six combinations. The average shear force in a reactor
having three impellers was higher than that when two impellers were
installed. It was observed that the maximum shear force was located
at the impeller sweeping zone, and this force was much larger than
the mean shear force in the liquid bulk. The results also showed
that same type of impeller produced similar shear force at the sweep-
ing zone. One 4-PBT impeller produced lower shear force (about
1.2 Pa) than that produced by one 6-BDT (about 1.6 Pa).
4. Fermentation Results Using Optimally Design Impellers
Combinations
From the simulation results (Figs. 2, 3 and 4), it could be con-
cluded that the highest KLa and the lowest shear force were obtained
under impeller combination 6 and combination 2, respectively. High
oxygen transfer rate reflected by a high KLa is favorable for CPC
production, while a lower shear force but with comparably high
KLa might be more promising because it supplies both higher oxy-
gen transfer and mild shear environments to CPC fermentation. Here,
as a result, we adopted combinations 2 and 6 as the optimal design
impeller combinations to conduct CPC fermentations to see their
practical and experimental effects, with combination 1 as the con-
trol or comparison base. Fermentations using combinations 1, 2 and
6 were referred as batch I, II and III, respectively, in the sequential
section.
The agitation rates plotted in Fig. 5(a) indicated that agitation
rate in batch III was much lower than that of I and II, suggesting
that impeller combination 6 could minimize the agitation required
for a normal CPC fermentation. On the other hand, as shown in Fig.
5(b), DO levels during main CPC production phase in batch II and
III were much higher than that of batch I, even though a relatively
mild agitation was applied for the former two cases. This fact dem-
onstrated that the high oxygen transfer rates using impellers combi-
nations 2 and 6 were beneficial for DO control and reducing the
fermentation cost.
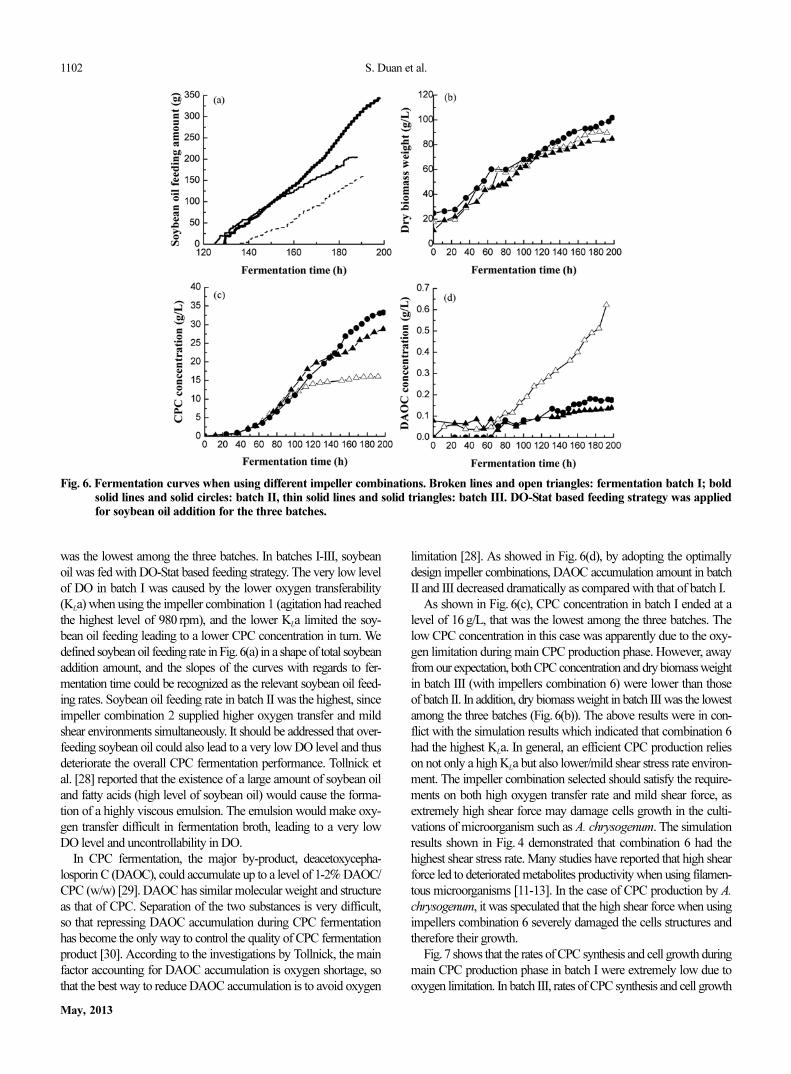
Fig. 6(a) plotted the soybean oil feeding curves in batch I, II and
III. In batch I, only about 164 g of soybean oil was added, which
Fig. 5. Time courses of agitation rate and DO in different fermen-tation batches. Broken lines: fermentation batch I, bold solidlines: batch II, thin solid lines: batch III.Fig. 4. Comparison of shear forces in the tank with the six differ-
ent impeller combinations. (a) Local average shear strainrate at each impeller sweeping zone; (b) average shear strainrate in the liquid bulk.
1102 S. Duan et al.
May, 2013
was the lowest among the three batches. In batches I-III, soybean
oil was fed with DO-Stat based feeding strategy. The very low level
of DO in batch I was caused by the lower oxygen transferability
(KLa) when using the impeller combination 1 (agitation had reached
the highest level of 980 rpm), and the lower KLa limited the soy-
bean oil feeding leading to a lower CPC concentration in turn. We
defined soybean oil feeding rate in Fig.6(a) in a shape of total soybean
addition amount, and the slopes of the curves with regards to fer-
mentation time could be recognized as the relevant soybean oil feed-
ing rates. Soybean oil feeding rate in batch II was the highest, since
impeller combination 2 supplied higher oxygen transfer and mild
shear environments simultaneously. It should be addressed that over-
feeding soybean oil could also lead to a very low DO level and thus
deteriorate the overall CPC fermentation performance. Tollnick et
al. [28] reported that the existence of a large amount of soybean oil
and fatty acids (high level of soybean oil) would cause the forma-
tion of a highly viscous emulsion. The emulsion would make oxy-
gen transfer difficult in fermentation broth, leading to a very low
DO level and uncontrollability in DO.
In CPC fermentation, the major by-product, deacetoxycepha-
losporin C (DAOC), could accumulate up to a level of 1-2% DAOC/
CPC (w/w) [29]. DAOC has similar molecular weight and structure
as that of CPC. Separation of the two substances is very difficult,
so that repressing DAOC accumulation during CPC fermentation
has become the only way to control the quality of CPC fermentation
product [30]. According to the investigations by Tollnick, the main
factor accounting for DAOC accumulation is oxygen shortage, so
that the best way to reduce DAOC accumulation is to avoid oxygen
limitation [28]. As showed in Fig. 6(d), by adopting the optimally
design impeller combinations, DAOC accumulation amount in batch
II and III decreased dramatically as compared with that of batch I.
As shown in Fig. 6(c), CPC concentration in batch I ended at a
level of 16 g/L, that was the lowest among the three batches. The
low CPC concentration in this case was apparently due to the oxy-
gen limitation during main CPC production phase. However, away
from our expectation, both CPC concentration and dry biomass weight
in batch III (with impellers combination 6) were lower than those
of batch II. In addition, dry biomass weight in batch III was the lowest
among the three batches (Fig. 6(b)). The above results were in con-
flict with the simulation results which indicated that combination 6
had the highest KLa. In general, an efficient CPC production relies
on not only a high KLa but also lower/mild shear stress rate environ-
ment. The impeller combination selected should satisfy the require-
ments on both high oxygen transfer rate and mild shear force, as
extremely high shear force may damage cells growth in the culti-
vations of microorganism such as A. chrysogenum. The simulation
results shown in Fig. 4 demonstrated that combination 6 had the
highest shear stress rate. Many studies have reported that high shear
force led to deteriorated metabolites productivity when using filamen-
tous microorganisms [11-13]. In the case of CPC production by A.
chrysogenum, it was speculated that the high shear force when using
impellers combination 6 severely damaged the cells structures and
therefore their growth.
Fig. 7 shows that the rates of CPC synthesis and cell growth during
main CPC production phase in batch I were extremely low due to
oxygen limitation. In batch III, rates of CPC synthesis and cell growth
Fig. 6. Fermentation curves when using different impeller combinations. Broken lines and open triangles: fermentation batch I; boldsolid lines and solid circles: batch II, thin solid lines and solid triangles: batch III. DO-Stat based feeding strategy was appliedfor soybean oil addition for the three batches.
Simulation of CFD and comparison of CPC fermentation performance with different impeller combinations 1103
Korean J. Chem. Eng.(Vol. 30, No. 5)
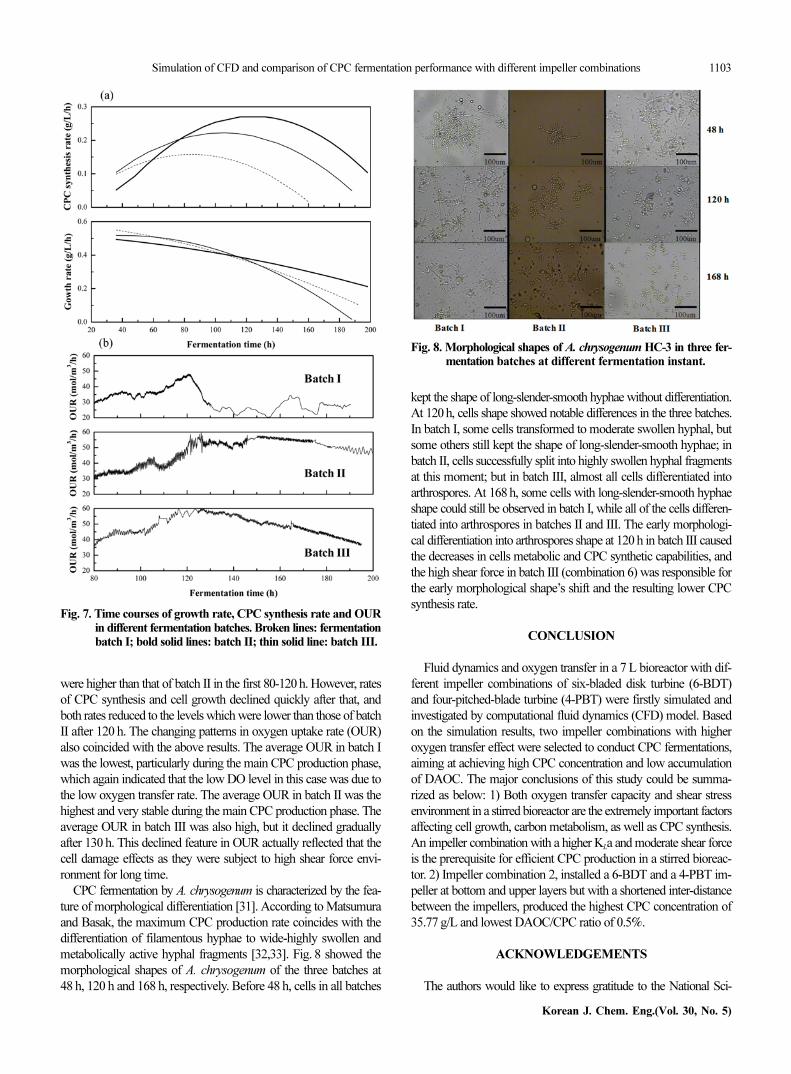
were higher than that of batch II in the first 80-120 h. However, rates
of CPC synthesis and cell growth declined quickly after that, and
both rates reduced to the levels which were lower than those of batch
II after 120 h. The changing patterns in oxygen uptake rate (OUR)
also coincided with the above results. The average OUR in batch I
was the lowest, particularly during the main CPC production phase,
which again indicated that the low DO level in this case was due to
the low oxygen transfer rate. The average OUR in batch II was the
highest and very stable during the main CPC production phase. The
average OUR in batch III was also high, but it declined gradually
after 130 h. This declined feature in OUR actually reflected that the
cell damage effects as they were subject to high shear force envi-
ronment for long time.
CPC fermentation by A. chrysogenum is characterized by the fea-
ture of morphological differentiation [31]. According to Matsumura
and Basak, the maximum CPC production rate coincides with the
differentiation of filamentous hyphae to wide-highly swollen and
metabolically active hyphal fragments [32,33]. Fig. 8 showed the
morphological shapes of A. chrysogenum of the three batches at
48 h, 120 h and 168 h, respectively. Before 48 h, cells in all batches
kept the shape of long-slender-smooth hyphae without differentiation.
At 120 h, cells shape showed notable differences in the three batches.
In batch I, some cells transformed to moderate swollen hyphal, but
some others still kept the shape of long-slender-smooth hyphae; in
batch II, cells successfully split into highly swollen hyphal fragments
at this moment; but in batch III, almost all cells differentiated into
arthrospores. At 168 h, some cells with long-slender-smooth hyphae
shape could still be observed in batch I, while all of the cells differen-
tiated into arthrospores in batches II and III. The early morphologi-
cal differentiation into arthrospores shape at 120 h in batch III caused
the decreases in cells metabolic and CPC synthetic capabilities, and
the high shear force in batch III (combination 6) was responsible for
the early morphological shape’s shift and the resulting lower CPC
synthesis rate.
CONCLUSION
Fluid dynamics and oxygen transfer in a 7 L bioreactor with dif-
ferent impeller combinations of six-bladed disk turbine (6-BDT)
and four-pitched-blade turbine (4-PBT) were firstly simulated and
investigated by computational fluid dynamics (CFD) model. Based
on the simulation results, two impeller combinations with higher
oxygen transfer effect were selected to conduct CPC fermentations,
aiming at achieving high CPC concentration and low accumulation
of DAOC. The major conclusions of this study could be summa-
rized as below: 1) Both oxygen transfer capacity and shear stress
environment in a stirred bioreactor are the extremely important factors
affecting cell growth, carbon metabolism, as well as CPC synthesis.
An impeller combination with a higher KLa and moderate shear force
is the prerequisite for efficient CPC production in a stirred bioreac-
tor. 2) Impeller combination 2, installed a 6-BDT and a 4-PBT im-
peller at bottom and upper layers but with a shortened inter-distance
between the impellers, produced the highest CPC concentration of
35.77 g/L and lowest DAOC/CPC ratio of 0.5%.
ACKNOWLEDGEMENTS
The authors would like to express gratitude to the National Sci-
Fig. 8. Morphological shapes of A. chrysogenum HC-3 in three fer-mentation batches at different fermentation instant.
Fig. 7. Time courses of growth rate, CPC synthesis rate and OURin different fermentation batches. Broken lines: fermentationbatch I; bold solid lines: batch II; thin solid line: batch III.

1104 S. Duan et al.
May, 2013
ence & Technology Supporting Program (2007BAI26B02) and Major
State Basic Research Development Program (2007CB714303), of
China for the financial assistance.
REFERENCES
1. J. Kozma and L. Karaffa, J. Biotechnol., 48, 59 (1996).
2. P. Hilgendorf, H. Diekmann, V. Heiser and M. Thoma, Appl. Micro-
biol. Biotechnol., 27, 247 (1987).
3. M. J. Rollins, S. E. Jensen, S. Wolfe and D. W. Westlake, Enzyme
Microb. Technol., 12, 40 (1990).
4. W. Zhou, K. Holzhauer-Rieger, M. Dors and K. Schugerl, Enzyme
Microbiol. Technol., 14, 848 (1992).
5. A. Yang, H. L. Dong and G. Liu, J. Ind. Microbiol. Biotechnol., 39,
269 (2012).
6. P. Mishra, P. Srivastava and S. Kundu, World J. Microbiol. Biotech-
nol., 21, 525 (2005).
7. J. Basch and S. J. Chiang, J. Ind. Microbiol. Biotechnol., 20, 344
(1998).
8. J. A. DeMondena, S. Gutiérrez, J. Velasco, F. J. Fernández, R. A.
Fachini, J. L. Galazzo, D. E. Hughes and J. F. Martin, Biotechnol.,
11, 926 (1993).
9. A. W. Nienow, Appl. Mech. Rev., 51, 3 (1998).
10. M. Papagianni, Biotechnol. Adv., 22, 189 (2004).
11. B. Metz, E. W. deBruijn and J. C. van Suijdam, Biotechnol. Bioeng.,
23, 149 (1981).
12. J. Nielsen, C. L. Johansen, M. Jacobsen, P. Krabben and J. Villad-
sen, Biotechnol. Prog., 11, 93 (1995).
13. J. J. Smith, M. D. Lilly and R. I. Fox, Biotechnol. Bioeng., 35, 11
(1990).
14. M. Rahimi, A. Kakehani and A. A. Alsairafi, Korean J. Chem. Eng.,
27, 1150 (2010).
15. K. M. Dhanasekharan, J. Sanyal, A. Jain and A. Haidari, Chem. Eng.
Sci., 60, 213 (2005).
16. M. T. Raimondi, M. Moretti, M. Cioffi, C. Giordano, F. Boschetti,
K. Lagana and R. Pietrabissa, Biorheology, 43, 215 (2006).
17. V. Santos-Moreau, L. Brunet-Errard and M. Rolland, Chem. Eng.
Sci., 207, 596 (2012).
18. K. A. Williams, S. Saini and T. M. Wick, Biotechnol. Prog., 18, 951
(2002).
19. M. R. Marten, K. S. Wenger and S. A. Khan, Rheology mixing time,
and regime analysis for a production-scale Aspergillus oryzae fer-
mentation, in, A. W. Nienow (Ed.), Bioreactor and Bioprocess Fluid
Dynamics, BHR Group, Edinburgh (1997).
20. B. H. Um and T. R. Hanley, Korean J. Chem. Eng., 25, 1094 (2008).
21. V. V. Ranade, J. R. Bourne and J. B. Joshi, Chem. Eng. Sci., 46, 1883
(1991).
22. J. Y. Xia, S. J. Wang, S. L. Zhang and J. J. Zhong, Biochem. Eng.
J., 38, 406 (2007).
23. F. F. Garcia-Ochoa and E. Gomez, Chem. Eng. Sci., 59, 2489 (2004).
24. J. Y. Xia, S. J. Wang, S. L. Liang and J. J. Zhong, Biochem. Eng. J.,
38, 406 (2008).
25. T. Kumaresan and J. B. Joshi, Chem. Eng. J., 115, 173 (2006).
26. V. Abrardi, G. Rovero, G. Baldi, S. Sicardi and R. Conti, Chem. Eng.
Res. Des., 68, 516 (1990).
27. S. U. Ahmed, P. Ranganathan, A. Pandey and S. Sivaraman, J. Bio-
sci. Bioeng., 6, 588 (2010).
28. C. Tollnick, G. Seidel, M. Beyer and K. Schgüerl, Adv. Biochem.
Eng. Biotechnol., 86, 1 (2004).
29. S. J. Chiang, J. Ind. Microbiol. Biotechnol., 31, 99 (2004).
30. R. P. Elander, Appl. Microbiol. Technol., 61, 385 (2003).
31. J. H. Kim, J. S. Lim, C. H. Kim and S. W. Kim, Lett. Appl. Micro-
biol., 40, 307 (2005).
32. M. Matsumura, T. Imanaka, T. Yoshida and H. Taguchi, J. Ferment.
Technol., 58, 197 (1980).
33. S. Basak, A. Velayudhan and M. R. Ladisch, Biotechnol. Prog., 11,
626 (1995).