Simulation of CO Exsolution for Enhanced Oil Recovery and ...
32
Simulation of CO 2 Exsolution for Enhanced Oil Recovery and CO 2 Storage By Scott McLaughlin S TANFORD C ENTER FOR C ARBON S TORAGE A NNUAL M EETING M AY 11, 2016
Transcript of Simulation of CO Exsolution for Enhanced Oil Recovery and ...

Simulation of CO2 Exsolution for Enhanced Oil Recovery and CO2 Storage
By Scott McLaughlin
S TAN F O R D C EN TER F O R C AR BO N S TO R A G E A N N U AL
M EET I N G
M AY 11 , 2 0 1 6

Contents
Background – Laboratory work
Exsolution at the pore and core scales
Experimental oil recovery with CO2 exsolution
Reservoir Simulation of CO2 Exsolution
TOUGH2 two-phase simulations
Eclipse three-phase simulations
Conclusions
2
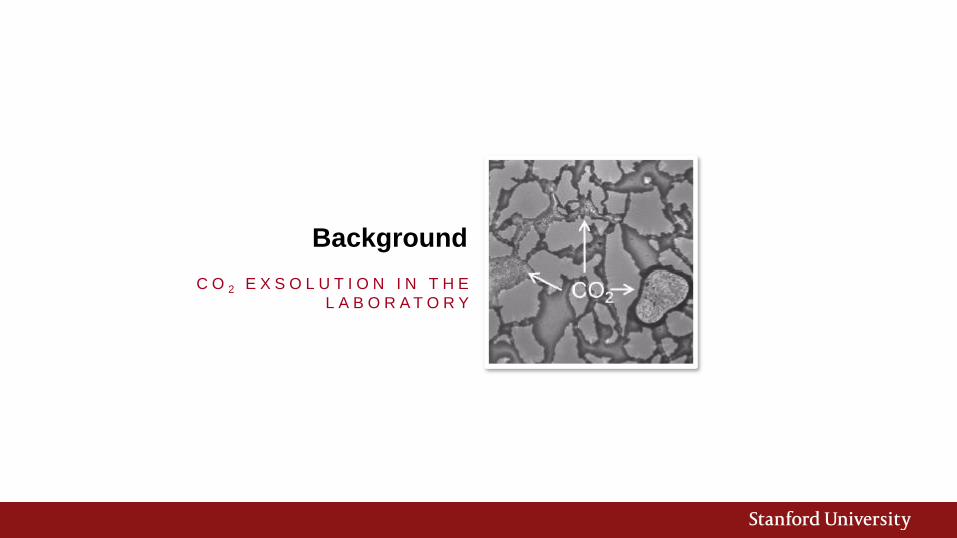
Background
C O 2 E X S O L U T I O N I N T H E
L A B O R A T O R Y

4
Background – CO2 Exsolution
Mobility Control
Carbonated brine injection followed by CO2 liberation through
depressurization under immiscible conditions
Provides mobility control from strong capillary trapping and relatively
small length of connected gas phase that could improve efficiency of
water flooding
Other Benefits
CO2 sequestration
Viscosity reduction
4[Zuo 2013]

5
Mobility Control Alters Water Flow Paths and Enhances Recovery
[Zuo 2014]
Flow path WaterCO2Oil
5

6
Low Relative Permeability of Exsolved CO2-Water System
Berea Sandstone Mt. Simon Sandstone
[Zuo 2014] 6

7
Improvement in Recovery Factors in Cores from Carbonated Brine Injection with CO2 Exsolution
[Zuo 2014][Alizadeh 2014]
7
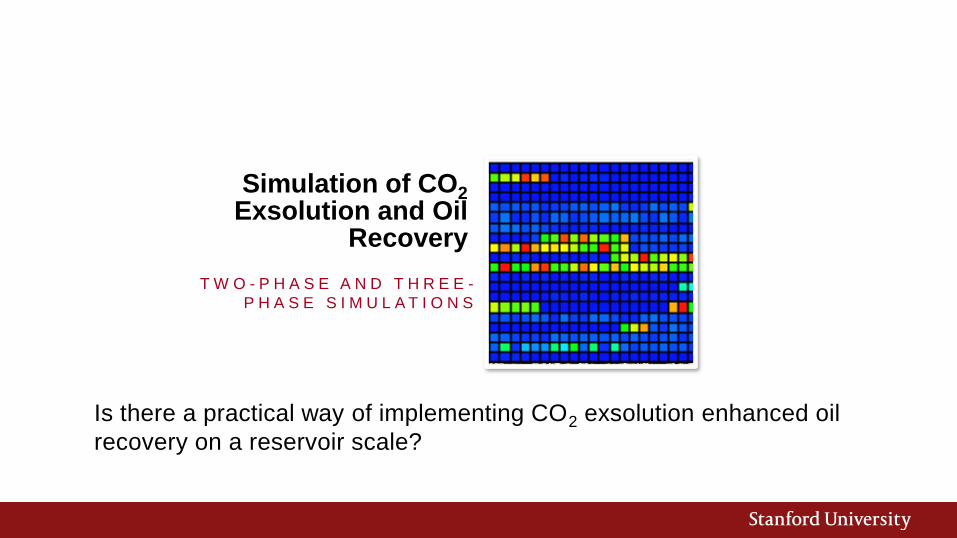
Simulation of CO2Exsolution and Oil
Recovery
T W O - P H A S E A N D T H R E E -
P H A S E S I M U L A T I O N S
Is there a practical way of implementing CO2 exsolution enhanced oil
recovery on a reservoir scale?

Questions to Answer Using Reservoir Scale Simulations
Two-phase Flow Simulation
What are the time and spatial scales for which we can exsolve CO2
through depressurization at the reservoir scale?
Three-phase Flow Simulation
How does carbonated water injection and CO2 exsolution affect oil
recovery?
What are the primary mechanisms affecting recovery enhancement?
Does the importance of mobility control depend on oil properties?
9

10
Simulation Model for Two-Phase Flow
TOUGH2 two-phase flow
2D homogenous cross-
section model with log-
spaced grid in x-direction
Initially brine that is
saturated with CO2
ECO2N EOS (water,
NaCl, CO2)
Relative permeability by
van Genuchten-Maulem
model fit for exsolution1000m
50m
Gas Saturation
Producer
10

11
Two-Phase Flow Results
Need confined reservoir or
confining well pattern to
achieve depressurization
throughout reservoir
CO2 exsolution achieved
throughout 1km confined
reservoir
Production rate limited by
clogging effect
Increasing
Production
Increasing
Production
11
Questions to Answer Using Reservoir Scale Simulations
Two-phase Flow Simulation
What are the time and spatial scales for which we can exsolve CO2
through depressurization at the reservoir scale?
Three-phase Flow Simulation
How does carbonated water injection and CO2 exsolution affect oil
recovery?
What are the primary mechanisms affecting recovery enhancement?
Does the importance of mobility control depend on oil properties?
12

Simulation Model for Three-phase Flow
ECLIPSE CO2SOL
2D heterogenous model
200x1x20 grid cells (1524 meters by 7.6 meters by 15 meters)
Initially fully oil saturated with connate water
Isothermal at 65C, initial pressure 100 bar
Injector Producer
13

Binned Groups for Capillary Heterogeneity
0
0.2
0.4
0.6
0.8
1
0.001 0.01 0.1 1 10 100 1000
Cu
mu
lati
ve F
req
uen
cy
Permeabiity (md)
Permeability CFD - 2001 SPE Comparative Solution Project
1.E-02
1.E-01
1.E+00
1.E+01
1.E+02
1.E+03
1.E+04
1.E+05
1.E+06
0 0.2 0.4 0.6 0.8 1
Pc (
Bar
)
Sw
Brine/CO2 Capillary Pressure (Berea Sandstone)
Group 1
Group 2
Group 3
Group 4
Group 5
1 2 3 4 5
𝑃𝑐 = 𝑃𝑒𝑆𝑤 − 𝑆𝑤𝑖
1 − 𝑆𝑤𝑖
−1λ
𝑃𝑒 = 𝑃𝑒𝑟𝑒𝑓𝑘𝑟𝑒𝑓𝑘
14

Exsolution Relative Permeability
Two-phase relative permeabilities
from experimental data for exsolved
CO2-water
Baker method to generate 3-phase
Kri =Sj− Sjc Krij + Sk− Skc Krik
Sj− Sjc + (Sk− Skc)
0
0.2
0.4
0.6
0.8
1
0 0.2 0.4 0.6 0.8 1
Kr
Sw
Krwo (Sw)
Krw
Kro
0
0.2
0.4
0.6
0.8
1
0 0.2 0.4 0.6 0.8 1
Kr
Sw
Krwg (Sw)
Krw
Krg
0
0.2
0.4
0.6
0.8
1
0 0.2 0.4 0.6 0.8 1
Kr
So
Krog (So)
Kro
Krg
15

Four Cases and Production Strategy
Four different oil types ranging from heavy to light oil
Production Strategy:
1) Primary Recovery
2) Water Flood
3) Carbonated Water Flood
4) Depressurization and Carbonated Water Flood
CaseAPI
GravityDensity (kg/m3)
Viscosity (cP) MW
Pc (bar) Tc (K) ω
1 10 980 1000 405 15.2 933 0.9
2 20 915 165 320 16.5 844 0.7
3 30 859 27 242 18.6 756 0.6
4 40 809 4.5 192 20.7 700 0.5
16

Case 2: API 20 CO2 Exsolution Enhanced Oil Recovery
Step 1: Primary Recovery – 0.002 Recovery Factor
Step 2: Water Flood (0.4 PVI) – 0.22 Recovery Factor
Oil Saturation Water Saturation
Oil Saturation Water Saturation
17

Case 2: API 20 CO2 Exsolution Enhanced Oil Recovery
Step 3: Carbonated Water Flood (1 PVI) – 0.34 Recovery Factor, 0.91 WCT
Step 4: Depressurization and Carbonated Water Flood (1 PVI) – 0.49 RF, 0.82 WCT
Water SaturationOil Saturation
Oil Saturation Gas Saturation
18

0
0.1
0.2
0.3
0.4
0.5
0.6
0 0.5 1 1.5 2 2.5
Re
co
ve
ry F
acto
r
PVI
Recovery Factor vs Pore Volume Injected for API 20 Oil
Water Flood
Case 2: Recovery Factor is Highest by Exsolution
Water
Flood
19

0
0.1
0.2
0.3
0.4
0.5
0.6
0 0.5 1 1.5 2 2.5
Re
co
ve
ry F
acto
r
PVI
Recovery Factor vs Pore Volume Injected for API 20 Oil
Carbonated Water Flood
Water Flood
Case 2: Recovery Factor is Highest by Exsolution
Water
Flood
Carbonated
Water Flood
20

0
0.1
0.2
0.3
0.4
0.5
0.6
0 0.5 1 1.5 2 2.5
Re
co
ve
ry F
acto
r
PVI
Recovery Factor vs Pore Volume Injected for API 20 Oil
Exsolution
Carbonated Water Flood
Water Flood
Case 2: Recovery Factor is Highest by Exsolution
Water
Flood
Carbonated
Water FloodPressure Drop
21

Questions to Answer Using Reservoir Scale Simulations
Two-phase Flow Simulation
What are the time and spatial scales for which we can exsolve CO2
through depressurization at the reservoir scale?
Three-phase Flow Simulation
How does carbonated water injection and CO2 exsolution affect oil
recovery?
What are the primary mechanisms affecting recovery enhancement?
Does the importance of mobility control depend on oil properties?
20

0
0.1
0.2
0.3
0.4
0.5
0.6
0 0.5 1 1.5 2 2.5
Re
co
ve
ry F
acto
r
PVI
Recovery Factor vs Pore Volume Injected for API 20 Oil
Exsolution
Brooks-Corey
Carbonated Water Flood
Water Flood
Case 2: Recovery Improvement Partly Due to Mobility Control and Partly Due to Viscosity Reduction
Water
Flood
Carbonated
Water Flood Pressure Drop
21

Questions to Answer Using Reservoir Scale Simulations
Two-phase Flow Simulation
What are the time and spatial scales for which we can exsolve CO2
through depressurization at the reservoir scale?
Three-phase Flow Simulation
How does carbonated water injection and CO2 exsolution affect oil
recovery?
What are the primary mechanisms affecting recovery enhancement?
Does the importance of mobility control depend on oil properties?
22

Mobility Control Mechanism More Important for Recovery of Heavier Oil
0
0.1
0.2
0.3
0.4
0.5
0.6
0.7
0.8
0.9
1
0 0.5 1 1.5 2 2.5
Rec
ove
ry F
acto
r
PVI
Recovery Factor vs Pore Volumes Injected for Different Oils
Brooks-Corey
Exsolution
API 40
WaterFlood
Carbonated Water Flood
Pressure Drop
API 30
API 10
API 20
23

Conclusions
Exsolution of CO2 by depressurization achievable with confining well
pattern or confined reservoir
24

Conclusions
Exsolution of CO2 by depressurization achievable with confining well
pattern or confined reservoir
Carbonated water injection leads to enhancement in oil recovery
24

Conclusions
Exsolution of CO2 by depressurization achievable with confining well
pattern or confined reservoir
Carbonated water injection leads to enhancement in oil recovery
For intermediate to heavy oils mobility control of wetting phase by
exsolved CO2 provides significant improvement in oil recovery
24

Questions?

Solubility of CO2 in Water and API 20 Oil with Pressure
0
0.02
0.04
0.06
0.08
0.1
0.12
0.14
0.16
0.18
0.2
0 20 40 60 80 100 120 140 160
kg/k
g
Pressure (Bar)
Phase Behavior of CO2 in Water and Oil with Pressure
Mass fraction CO2 in Water
Mass fraction CO2 in Oil
Initial
Condition
Final
Condition

Location of Exsolved CO2
0.00
0.05
0.10
0.15
0.20
0.25
0.30
0.35
0.40
0.45
1.00E-031.00E-021.00E-011.00E+001.00E+011.00E+021.00E+03
Gas S
atu
ration
Permeability (md)
API 40 Gas Saturation vs Permeability
0.00
0.05
0.10
0.15
0.20
0.25
0.30
0.35
0.40
0.45
0.50
1.00E-03 1.00E-02 1.00E-01 1.00E+00 1.00E+01 1.00E+02 1.00E+03
Gas S
atu
ration
Permeability (md)
API 20 Gas Saturation vs Permeability

Simulate Immiscible Recovery for Light to Heavy Oils
Evaluated recovery for a variety
of oils with different viscosities
and densities
Correlations used to obtain
realistic values for oil properties
[Verma 2015]1
10
100
1000
10000
100000
0 10 20 30 40 50
Vis
cosi
ty (
cp)
API Gravity
Viscosity vs API Gravity of Crude Oils
Heavy
Light
Initial ConditionAPI 10
API 20
API 30
API 40