Simulation - Guru Mahesh
11
International Journal of Mechanical and Production Engineering Research and Development (IJMPERD ) ISSN 2249-6890 Vol. 2 Issue 2 June 2012 68-78 © TJPRC Pvt. Ltd., SIMULATION OF THE CRACK PROPAGATION USING FRACTURE MECHANICS TECHNIQUES IN TITANIUM-BASED ALLOY SKIN G. GURUMAHESH 1 & Y. SURESH BABU 2 1,2 Rajiv Gandhi Memorial College of Engineering And Technology, Nandyal, A.P, India. ABSTRACT The focus of this project is to investigate how a crack propagates and grows in a typical Ti-6Al-4V material plate. By using the finite element method software (ANSYS13) were used to simulate crack growth and to compute the stresses and the s tress-intensity factor. A specific plate design was s elected and a corner crack was inves tigated. This configuration was used since the eng ineers often detect this type of crack in plates. The Von Mises stress near the crack tip is compared against the yield strength of the mate rial. The Mode I stres s-intensity factor is compa red agains t the material’s f racture toughness. The results show that the plate can tolerate small cracks in the structure. The fatigue strength of the structure is recommended to be assessed in the future. KEYWORDS: Fracture Mechanics, Alloy Skin, Titanium. INTRODUCTION/LITERATURE REVIEW Airliners progressively more demand for high performance and fuel-efficient aircraftsdue to the increasing gasoline price. In order tomeet the market needs, original equipment manufacturers are developing smaller and lighter aircraft engines. Industry analysts are expecting the engine components in the next decades to be very space efficient. As a result, light but high strength materials are very valuable and competitively sourced to reduce weight and cost in manufacturing aircraft engine. Aero engine designers design component in various shapes and sizes for mounting bleed air ducting, starter air duct, fuel lines and hydraulic lines to the engine core. One can find more than one hundred mounting points in an engine. Many of the ducting supports ha ve the shapes of L, T and Z (multiple bends) to accommodate multiple tubes in the tight space found in an aircraft engin e. In general, the plate thickness ranges from .125 to .500 inch because the plate not only must be thin to reduce weight and cost, but also must be functional and serve its purposes in the extreme environment, e.g. Extremely high temperature, combination of vibration load, bending moment and maneuver load. Any crack found in a plate may cause the ducting to become unstable during a mission, and thus induce high cycle fatigue load on the overall major structures and shorten the structures lif e. From the economic standpoint, it is a cost saving strategy to replace brackets before they are completely damaged due to replacing broken machine plate components mitigates the risk of damaging other major components, such as the ducting, which are more costly to replace. Besides, replac ing a bracket before it completely breaks can avoid many engineering catastrophes an d save many lives. On the other hand, knowing the fatigue life of a
-
Upload
global-marketin8184 -
Category
Documents
-
view
222 -
download
0
Transcript of Simulation - Guru Mahesh

7/31/2019 Simulation - Guru Mahesh
http://slidepdf.com/reader/full/simulation-guru-mahesh 1/11
International Journal of Mechanical and Production
Engineering Research and Development (IJMPERD )
ISSN 2249-6890
Vol. 2 Issue 2 June 2012 68-78
© TJPRC Pvt. Ltd.,
SIMULATION OF THE CRACK PROPAGATION USING FRACTURE
MECHANICS TECHNIQUES IN TITANIUM-BASED ALLOY SKIN
G. GURUMAHESH1 & Y. SURESH BABU2
1,2 Rajiv Gandhi Memorial College of Engineering And Technology, Nandyal, A.P, India.
ABSTRACT
The focus of this project is to investigate how a crack propagates and grows in a typical Ti-6Al-4V
material plate. By using the finite element method software (ANSYS13) were used to simulate crack
growth and to compute the stresses and the stress-intensity factor. A specific plate design was selected
and a corner crack was investigated. This configuration was used since the engineers often detect this
type of crack in plates. The Von Mises stress near the crack tip is compared against the yield strength of
the material. The Mode I stress-intensity factor is compared against the material’s fracture toughness.
The results show that the plate can tolerate small cracks in the structure. The fatigue strength of the
structure is recommended to be assessed in the future.
KEYWORDS: Fracture Mechanics, Alloy Skin, Titanium.
INTRODUCTION/LITERATURE REVIEW
Airliners progressively more demand for high performance and fuel-efficient aircraftsdue to the
increasing gasoline price. In order tomeet the market needs, original equipment manufacturers are
developing smaller and lighter aircraft engines. Industry analysts are expecting the engine
components in the next decades to be very space efficient. As a result, light but high strength
materials are very valuable and competitively sourced to reduce weight and cost in manufacturing
aircraft engine.
Aero engine designers design component in various shapes and sizes for mounting bleed air ducting,
starter air duct, fuel lines and hydraulic lines to the engine core. One can find more than one hundred
mounting points in an engine. Many of the ducting supports have the shapes of L, T and Z (multiple
bends) to accommodate multiple tubes in the tight space found in an aircraft engine. In general, the platethickness ranges from .125 to .500 inch because the plate not only must be thin to reduce weight and
cost, but also must be functional and serve its purposes in the extreme environment, e.g. Extremely high
temperature, combination of vibration load, bending moment and maneuver load. Any crack found
in a plate may cause the ducting to become unstable during a mission, and thus induce high cycle fatigue
load on the overall major structures and shorten the structures life. From the economic standpoint, it is a
cost saving strategy to replace brackets before they are completely damaged due to replacing broken
machine plate components mitigates the risk of damaging other major components, such as the ducting,
which are more costly to replace. Besides, replacing a bracket before it completely breaks can avoid
many engineering catastrophes and save many lives. On the other hand, knowing the fatigue life of a

7/31/2019 Simulation - Guru Mahesh
http://slidepdf.com/reader/full/simulation-guru-mahesh 2/11

7/31/2019 Simulation - Guru Mahesh
http://slidepdf.com/reader/full/simulation-guru-mahesh 3/11
G. Gurumahesh & Y. Suresh Babu 70
intensity factors and compare it against material toughness to determine the influence of the crack on the
plate.
METHODOLOGY
Engineers strive to optimize part geometry by designing the thinnest possible components
because this approach not only reduce engine weight but also reduce the risk of brittle structure often
found in bulk materials. Being able to determine the rate of crack growth, an engineer can schedule
inspection accordingly and repair or replace the part before failure happens. Being able to predict the
path of a crack helps a designer to incorporate adequate geometric tolerance in structural design to
increase the part life. The methodology used to investigate the mechanics of crack propagation consists
of the following steps:
• Model creation
• Elastic stress analysis of the UNcracked body
• Flaw implementation
• Crack propagation
• Elastic stress analysis of the cracked body
• Calculation of stress intensity factor
• Interpretation of results
MODEL AND MATERIAL PROPERTIES
Model is having with the dimensions of 100 mm in height, 200 mm in width,and 10 mm in
thickness. In addition, the boundary condition chosen by Thomas for his optimum plate research was
applied to the plate in this study. At the base of the plate, one end is clamped in all degree of freedom,
while the other end is a slider. The plate is pulled downward and top of the section.

7/31/2019 Simulation - Guru Mahesh
http://slidepdf.com/reader/full/simulation-guru-mahesh 4/11
Simulation of the Crack Propagation using Fracture Mechanics
Techniques in Titanium-Based Alloy Skin
71
Among all the titanium based alloys, according to Immarigeon et al [3], Ti-6Al-4V is by far the most
widely used, accounting for almost half of all titanium used in aircraft because the material can increase
the strength+to+weight ratio in structures and provide heat resistance with weight savings. However, the
significant weight savings permitted by these titanium application developments generate specificdrawbacks that need particular technological developments. Among the most important concerns are
brittle inclusions, which are difficult to detect by non-destructive testing, can initiate cracks and
produce early failure of the structures [2]. Materials imperfections due to manufacturing process, for
example, voids and impurities can develop flaws that may cause the material to become weak. For those
reasons, the material chosen in this study is Titanium+6Al+4V and the properties are summarized in
Table 1.
Table 1 : Material properties of Titanium-6-Al-4V
Material Properties Comments
Density 4.43gm/cc
Tensile strength, ultimate 1170 Mpa
Tensile strength, yield 1100Mpa
Elongation at break 10.0%
Modulus of elasticity 114 Gpa Average of tension and compression
Compressive yield strength 1070 Mpa
Notched tensile strength 1550 mpa Kt(stress concentration factor)=6.7
Poission’s ratio 0.33
Fatigue strength @no.of cycles 1.00e+7 Kt(stress concentration factor)=3.3
160 Mpa
@no.of cycles 1.00e+7 Un notched
700 Mpa
Fracture toughness 43.0Mpa-m1/2
Shear modulas 44.0 Gpa
Shear strength 760Mpa Ultimate shear strength
a) Infinite plate with centre through crack under tension

7/31/2019 Simulation - Guru Mahesh
http://slidepdf.com/reader/full/simulation-guru-mahesh 5/11
G. Gurumahesh & Y. Suresh Babu 72
The concept of stress intensity factor plays a central role in fracture mechanics. We now refer to
Tada [19] to present some classical examples of cracked geometries - represented in Figure 3 - for which
the stress intensity factor has been computed or approximated explicitly. It is assumed that crack
propagation may not occur, i.e., the problem is static.
b) Semi-Infinite plate with a center through crack under tension
Figure 3
The stress intensity values for these geometries are as follows, where the letters a) - d) used to
identify the formulas are in correspondence with those of the pictures in figure 3
a) KI=σ√(∏a): ------------- (1)
b) b) KI=1.1215σ√(∏a) ------------ (2)
c) KI=σ√ (∏a) (1-0.025(a/b) 2+0.06(a/b) 4) √ (sec (∏a/2b)) ------------ (3)
7/31/2019 Simulation - Guru Mahesh
http://slidepdf.com/reader/full/simulation-guru-mahesh 6/11
Simulation of the Crack Propagation using Fracture Mechanics
Techniques in Titanium-Based Alloy Skin
73
d) KI=σ√ (∏a) √ ((2b/ ∏a) tan (∏a/2b)) 0.75+2.02(a/b) +
0.37(1-sin(∏a/2b)3)/cos(∏a/2b)) ----------- (4)
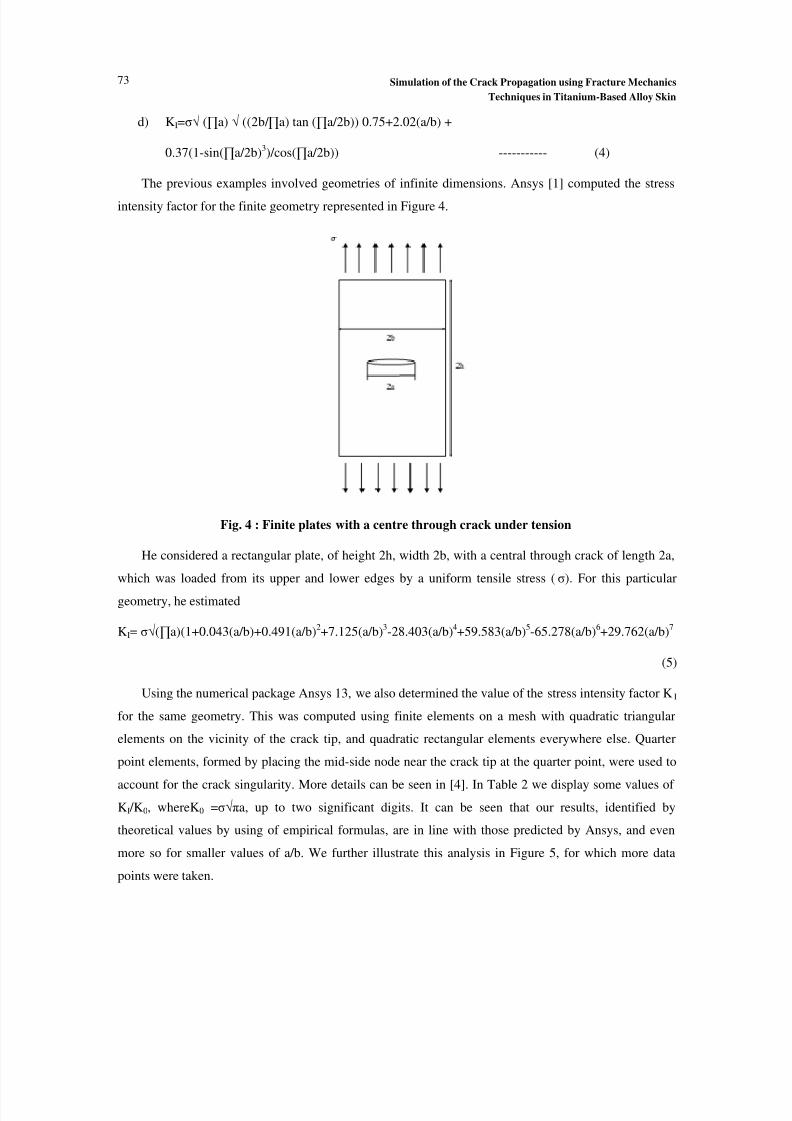
The previous examples involved geometries of infinite dimensions. Ansys [1] computed the stress
intensity factor for the finite geometry represented in Figure 4.
Fig. 4 : Finite plates with a centre through crack under tension
He considered a rectangular plate, of height 2h, width 2b, with a central through crack of length 2a,
which was loaded from its upper and lower edges by a uniform tensile stress (σ). For this particular
geometry, he estimated
KI= σ√(∏a)(1+0.043(a/b)+0.491(a/b)2+7.125(a/b)3-28.403(a/b)4+59.583(a/b)5-65.278(a/b)6+29.762(a/b)7
(5)
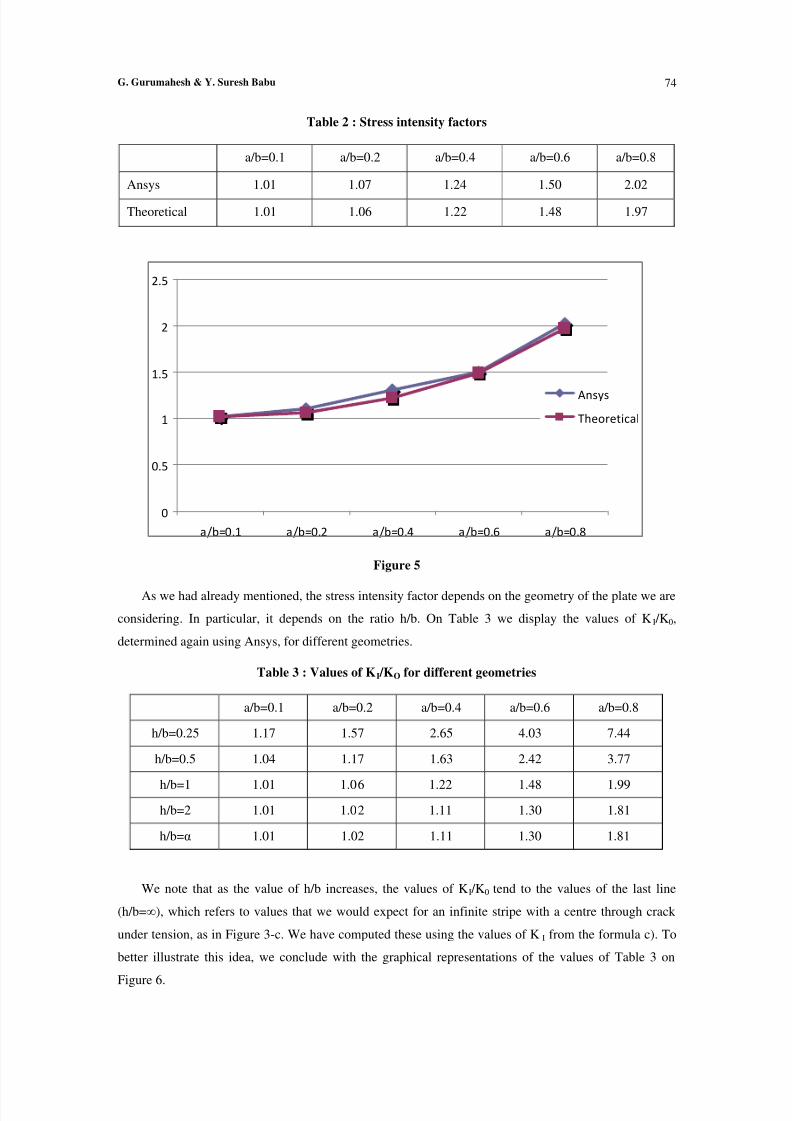
Using the numerical package Ansys 13, we also determined the value of the stress intensity factor KI
for the same geometry. This was computed using finite elements on a mesh with quadratic triangular
elements on the vicinity of the crack tip, and quadratic rectangular elements everywhere else. Quarter
point elements, formed by placing the mid-side node near the crack tip at the quarter point, were used to
account for the crack singularity. More details can be seen in [4]. In Table 2 we display some values of
KI /K0, whereK0 =σ√πa, up to two significant digits. It can be seen that our results, identified by
theoretical values by using of empirical formulas, are in line with those predicted by Ansys, and even
more so for smaller values of a/b. We further illustrate this analysis in Figure 5, for which more data
points were taken.
7/31/2019 Simulation - Guru Mahesh
http://slidepdf.com/reader/full/simulation-guru-mahesh 7/11
G. Gurumahesh & Y. Suresh Babu 74
Table 2 : Stress intensity factors
a/b=0.1 a/b=0.2 a/b=0.4 a/b=0.6 a/b=0.8
Ansys 1.01 1.07 1.24 1.50 2.02
Theoretical 1.01 1.06 1.22 1.48 1.97
0
0.5
1
1.5
2
2.5
a/b=0.1 a/b=0.2 a/b=0.4 a/b=0.6 a/b=0.8
Ansys
Theoretical
Figure 5
As we had already mentioned, the stress intensity factor depends on the geometry of the plate we are
considering. In particular, it depends on the ratio h/b. On Table 3 we display the values of K I /K0,
determined again using Ansys, for different geometries.
Table 3 : Values of KI /KO for different geometries
a/b=0.1 a/b=0.2 a/b=0.4 a/b=0.6 a/b=0.8
h/b=0.25 1.17 1.57 2.65 4.03 7.44
h/b=0.5 1.04 1.17 1.63 2.42 3.77
h/b=1 1.01 1.06 1.22 1.48 1.99
h/b=2 1.01 1.02 1.11 1.30 1.81
h/b=α 1.01 1.02 1.11 1.30 1.81
We note that as the value of h/b increases, the values of KI /K0 tend to the values of the last line
(h/b=∞), which refers to values that we would expect for an infinite stripe with a centre through crack
under tension, as in Figure 3-c. We have computed these using the values of K I from the formula c). To
better illustrate this idea, we conclude with the graphical representations of the values of Table 3 on
Figure 6.

7/31/2019 Simulation - Guru Mahesh
http://slidepdf.com/reader/full/simulation-guru-mahesh 8/11
Simulation of the Crack Propagation using Fracture Mechanics
Techniques in Titanium-Based Alloy Skin
75
0
1
2
3
4
5
6
7
8
a/b=0.1 a/b=0.2 a/b=0.4 a/b=0.6 a/b=0.8
h/b=0.25
h/b=0.5
h/b=1
h/b=2
h/b=α
Figure 6
SIMULATION OF CRACK GROWTH
A static fracture analysis was performed, where the goal was merely to compute the stress intensity
factors. Now, we are ready for a quasi-static analysis, which means we now look into the actual
propagation of the crack. We observe that this is not a dynamic analysis in the sense that dynamic effects
such as wave propagation are not taken into account.
The thing we have to do is to follow the position of the crack tip, as the propagation occurs. We use
a step by step process. For that, we consider an increment a, which is the distance between two
consecutive points of the crack tip. Once a has been chosen, a possible algorithm will be as follows.
Given: a step size a, the initial crack tip coordinates x(l)
tip for l = 0.
1- Increment l;
2- Compute the values of the stress intensity factors, KI and KII;
3- Determine the angle of propagation θp(K)using equation
4- Update the crack tip coordinates.
5- Back to step 1.
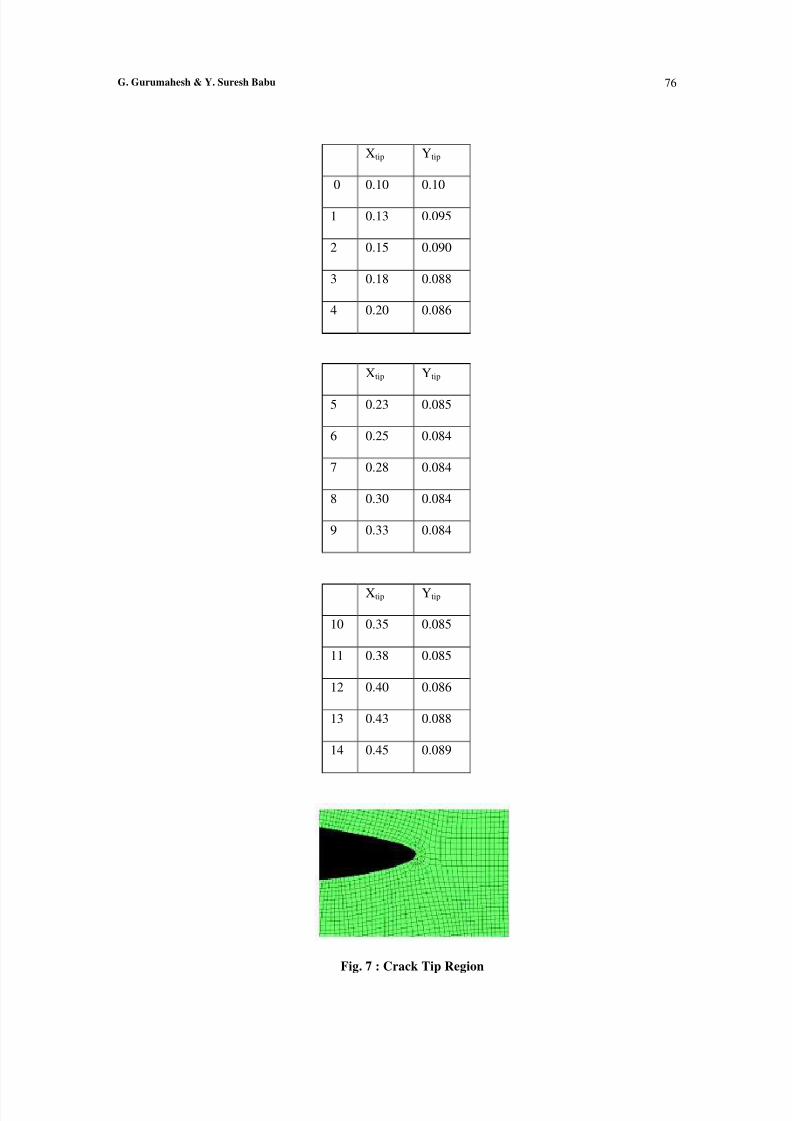
We use Ansys and Mat lab to implement this algorithm with a= 0.025.We thus obtain a set of
consecutive crack tip coordinates, as displayed in Table 4. These constitute a discrete approximation for
the crack path.
7/31/2019 Simulation - Guru Mahesh
http://slidepdf.com/reader/full/simulation-guru-mahesh 9/11
G. Gurumahesh & Y. Suresh Babu 76
Xtip Ytip
0 0.10 0.10
1 0.13 0.095
2 0.15 0.090
3 0.18 0.088
4 0.20 0.086
Xtip Ytip
5 0.23 0.085
6 0.25 0.084
7 0.28 0.084
8 0.30 0.084
9 0.33 0.084
Xtip Ytip
10 0.35 0.085
11 0.38 0.085
12 0.40 0.086
13 0.43 0.088
14 0.45 0.089
Fig. 7 : Crack Tip Region

7/31/2019 Simulation - Guru Mahesh
http://slidepdf.com/reader/full/simulation-guru-mahesh 10/11
Simulation of the Crack Propagation using Fracture Mechanics
Techniques in Titanium-Based Alloy Skin
77
Initial crack crack path n=6
Crack path n=15
Figure 8
Finally Figure 10 represents the deformed state of the plate for the initial crack, and again after 7 and
15 steps.
a) Initial crack b) crack path n=6 c) Crack path n=15
From these figures it seems that there is a tendency for the crack propagation to occur mainly in
modeI, during continued fracture. This agrees with the predictions of [6, 9].
7/31/2019 Simulation - Guru Mahesh
http://slidepdf.com/reader/full/simulation-guru-mahesh 11/11
G. Gurumahesh & Y. Suresh Babu 78
REFERENCES
[1] M. H. Aliabadi and M. H. L´opez.Database of stress intensity factors.Computational Mechanics
Publications, 1996.
[2] S. N. Atluri. A path independent integrals in finite elasticity and inelas-ticity with body forces,
inertia and arbitrary crack-face conditions.Eng.Fract. Mech, 16:341-364, 1982.
[3] M. F. Ashby and D. R. Jones.Engineering materials 1, an introduction to their properties and
applications, Butterworth Heinemann, 1996.
[4] R. S. Barsoum. Triangular quarter-point elements as elastic and perfectly-plastic crack tip
elements.Int. J. for Num. Meth.in Eng.,11:85-98, 1977.
[5] D. Broek.Elementary engineering fracture mechanics. Kluwer Academic Publishers, Dordrecht,
1986.
[6] G. P. Cherepanov.Mechanics of Brittle Fracture.MacGraw-Hill, New York 1979.
[7] L. B. Freund.Dynamic Fracture Mechanics.Cambridge University Press, 1990.
[8] A. A. Griffith. The phenomena of rupture and flows in solids.Phil. Trans.Roy. Soc. London,
A221:163-197, 1921.
[9] D. Hegen.An Element-free Galerkin Method for Crack Propagation in Brittle Materials. PhD
thesis, Eindhoven University of Technology, 1997.
[10] C. E. Inglis. Stresses in a plate due to the presence of cracks and sharp corners.Proc.Inst. Naval
Architects, 60, 1913.
[11] G. R. Irwin. Analysis of stresses and strains near the end of a crack transversing a plate. Trans.
A.S.M.E., J. Applied Mechanics, 361-364,1957.
[12] G. R. Irwin. Fracture.Encyclopedia of Physics (Handbuch der Physic),Vol IV, Springer, Berlin,
1958.
[13] G. R. Irwin. Fracture.Encyclopedia of Physics (Handbuch der Physic)”,Vol VI, Fl¨ugge (Ed.),
Springer Verlag, Berlin 551-590, 1958.