Simulating Systems in Ground Vehicle Design -...
29
Simulating Systems in Ground Vehicle Design Frederick J. Ross Director, Ground Transportation
Transcript of Simulating Systems in Ground Vehicle Design -...

Simulating Systems in Ground Vehicle Design
Frederick J. RossDirector, Ground Transportation

Simulating Systems– How does this apply to ground transportation?– How CAD/PLMXML are key links to simulating systems.– How simulation has matured over time to enable simulation of systems.
Vehicle Roadmap Simulation– Simulation growth with the vehicle chassis teams have grown over time from
simple front end air flow, to complex drive conditions
Powertrain Roadmap of Simulation– Simulation growth impact on virtual Powertrain simulation
Agenda

What is meant by simulating systems?– Operating systems under various real-world
tasks through simulation– Example of different systems
• Vehicle Chassis• Powertrain• HVAC• Exhaust• Transmission
Simulating Systems
– Interdisciplinary field of engineering• 1D System Tool Analysis• Structural Studies• Multi-body: Ride/Handling• Fluid Dynamics
– Vehicle Chassis Systems– Powertrain Systems
– Complex interaction among multiple variables/physics within a system
• Water/Air interaction• Fluid/solid interaction• Flow/Thermal/Stress simulations
– Deals with work processes, optimization, risk management
Why are we seeing increase of users simulating systems?– Parts can be optimized early on in the concept phase where
previously expensive prototypes needed to be built.

Impact of Simulation on Vehicle Design
J G F E D C B AH
Today:
Data Freeze
Hardware Phase
Assessment Vehicle Functions
Dig. Ph. Digital PhaseDigital Prototypes
Simulation
Series
Digital Phase Digital Phase Hardware Phase Hardware Phase
Series
Hardware Hardware Phase Hardware Phase
Simulation
Previous:
Simulation
Hardware Phase Hardware Phase
Digital prototypes have allowed decrease in hardware phase. That reduces turn-around time, and the expensive build/test of the hardware prototype.Efficiency: Virtual Data Freeze allows for digital evaluation to be made
Digital prototypes have allowed decrease in hardware phase. That reduces turn-around time, and the expensive build/test of the hardware prototype.
*Exert from 2005 presentation from Walter Bauer on Virtual Product Development process at Daimler AG.

Simulation using the Digital Prototype
Durability(BiW)
Crash
NVH
Ride/Handling
HVAC/Thermal Comfort
Durability Chassis
Aerodynamics
Climate Control
HeatProtection
Manufacturing PowertrainTransmission
Digital Prototype becomes enabler for advance simulation– Simulation for more advance
analysis then just component design– Simulation includes multi-physics.– Simulation can involve motion as
needed as well. Whatever best helps engineer design their product efficiently.
– In the past, these would not have been possible until hardware of the vehicle has been produced.

Generation of a Digital Prototype
Data Freeze defines digital prototype– As with a real prototype, design teams work
together to meet a goal for the design freeze.– Review board checks, to make sure all
components are fitted together and data pool is complete.
Data Filter: Filters data for simulation– Data needed for simulation is filtered from the
overall data pool, and provided for the virtual simulation.
• Key component for data transfer
– Example of data filters:• Red Cedars Heeds • Custom tool designed to pull data together.
– OpenRoad
• CAD plugin can help provide data filter
– PLM (product lifecycle management) tools enable communication between different tools.
Analysis Response– Feeds back into the data pool for design
improvement.
0
500
1000
1500
2000
2500
3000
0 0,1 0,2 0,3 0,4 0,5 0,6 0,7 0,8
Deflection speed vDam
ping
forc
e F
Grade 1
Grade 2
Geometrical Data Functional Data

Vehicle Thermal Management Roadmap
1 2 3 4 5 6 7
Front End Air Flow• Top Tank Temperature
Prediction• Turn‐Around: 1 Day
1
Local Component Temperature• 30‐60 Solids• Local to a component• 2‐3 Weeks
2
Total Vehicle Simulation• Using existing sub‐models• 2 Week Assembly
4
Underbody Temperature• ~ 100 Solids• Includes Exhaust System, hangers,
engine mounts, heat shields• 3‐4 Weeks
3Power Train Cooling• Full Engine CHT model• Induction System• Exhaust System• Oil Flow• 4‐6 Weeks
5
Full Vehicle Thermal Management• Conduction/Radiation using
Radtherm• Includes Drive Cycle Simulation • 5‐6 Weeks Modeling time?
6
Full Vehicle Thermal Management• Co‐Simulation from STAR‐
CCM+ to STAR‐CCM+• 4000 Solid Components• Includes Drive Cycle
Simulation via Ports• 6‐7 Weeks Modeling Time
7
8
GUM: Grand Unified Model• Complete vehicle simulation
• 4000+ Solid Components• Cabin Thermal Comfort• Vehicle Aerodynamics• HVAC Simulation• Electronics Cooling
• Co‐Simulation STAR‐CCM+ to STAR‐CCM+
8
Note: Times are estimated on past projects. Actual times depend on CADComplexity
Incr
ease
d R
OI

Front End Air Flow/Aerodynamics: 1 Day Turn-Around
Challenge: Data FilteringLarge CAD database needs to be quickly moved from 1000’s of CAD parts to few boundaries needed for CFD.
Solution:OpenRoad• Provides part filtering with link to
boundary setup for the simulation.• Forms template for the full
simulation process including dual stream heat exchangers.
Impact:• Enables users to quickly predict
drag and/or front end air flow.• Enabler for more complex studies
such as component temperature prediction, soiling, aero-acoustics
• Runs fully in batch: good for optimization with Heeds
1
0
500
1000
1500
2000
2500
3000
0 0,1 0,2 0,3 0,4 0,5 0,6 0,7 0,8
Deflection speed vDam
ping
forc
e F
Grade 1
Grade 2
Geometrical Data Functional Data

OpenRoad Data Processing
Data Filtering• Typical path comes from:
1. Vismockup with PlmXML & JtOpen
2. ANSA• Some pre-processing may be
necessary• Heat exchanger cores: set
upstream/downstream interfaces
• Fan Interfaces• Close large wholes
Functional Data:• Vehicle Speed.• Heat Exchangers
• Porous Media• Heat Rejection• Secondary Fluid Stream
• Fan RPM• Wall TemperatureDirectly entered in OpenRoad
1
VisMockupPlmxmlJtOpen
STAR-CCM+ Surface Repair
ANSA Organizatio
n/Repair
Nastran Export
Functional Data

Vehicle Aerodynamics OptimizationAutomation and Robustness Enable Optimization
Challenge:Current design loops for shape optimizations allow significant improvement in drag. Turn-around needs to be quick.
Solution:Shape optimization using CFD provides quick alternatively to determine shape sensitivity enabling drag reduction during vehicle design cycle.Sherpa enables user to find optimum design with fewer evaluations.
Impact:Provides fast, robust turn-around for design optimization

Vehicle Optimization
Typical Methods1. CAD Parameterization2. Surface morphing
Methodology:• Vehicle is broken down to sub-system• Surface repair phase only affects creation
of data not in CAD.• Heeds can drive change in CAD to feed
new information to OpenRoad• Full model is rebuilt with each design step
Alternative:Simulation file can be used for the baseline.Can use Optimate or Heeds to modify part.
VisMockupPlmxmlJtOpen
STAR-CCM+ Surface Repair
ANSA Organizatio
n/Repair
Nastran Export
1 2

Vehicle Aerodynamics OptimizationAdjoint Solver
Challenge:Running design optimization can require evaluation of a lot of different design variables which drive high computational resources for early design studies
Solution:Adjoint solver allows many design variables to be evaluated on a single solution. By hooking adjoint with Heeds, a range of design parameters can quickly be achieved.
Impact:Reduces computation cost for key drag reduction locations

Local Component Temperature:Brake Cooling
Modeling Brake Cooling• Coupling between separate
Star-CCM+ analyses• Moving Reference Frame (MRF)
to capture the influence of rotating components on fluid motion
• Mixed Free and Forced Convection Flows with Radiation
• Detailed component temperatures and flow visualization
• Ability to analyze a variety of braking scenarios of varying durations
2

Underbody Thermal Management
STAR-CCM+ Enables Full Automation• Clients are minimizing turn-
around to go straight from CAD to results.
• Relies on surface wrapping for providing clean closed surfaces
• Includes heat exchanger models• May include secondary stream for
top tank temperature• Preparation work primarily done
in CAD.• Minimize user interaction to clean
up surfaces from CAD since focus on design teams that are not experts with the CFD tool.
Good example of automatic procedure can be seen with the OpenRoad App.
3
Solid Components

Drive Cycle Simulation
ChallengeOften, the means of failure of an engine or component occurs from operators drive cycle. As a vehicle travels in stop/go traffic, the heat load builds up and can cause overheating or more severe thermal loading issues. This can be costly to fix once the design has been finalized.
Solution Use virtual vehicle to simulate different drive cycles critical for performance. Drive cycles are simulated using a solid model to model transient thermal environment, coupled to different steady state vehicle operating conditions which make up the complete drive cycle.
ImpactThermal loading caused by critical drive cycles can now be simulated on a virtual vehicle. This identifies heating issues prior to having initial prototype. This reduces design time, and costs of prototype testing.
responsefrom event Unsteady
Uphill Drive

Averaged cell voltage, ΔUmax=80mV
16
Extending Simulation to Hybrids/Electrical:Lithium Ion Battery thermal management
Challenge: Ensure sufficient cooling for set of lithium ion cells electrically loaded
Courtesy of ASCS Validation, Stuttgart, Germany
Temperature plots for two cells of the stack , ΔTmax=2°CHeat transported by coolant
Solution: Coupled electrochemical-thermal performance for complete battery system simulated with STAR-CCM+; excellent correlation with test data
Impact: Able to use 1 simulation tool to accurately predict battery cooling system performance; avoid overheating

GUM: Grand Unified Model8
Grand Unified Model– Presented at SAE 2012:
• SAE 2012-01-0635
– Used for final vehicle testing– Combines:
• Aerodynamics• Vehicle Thermal Management• Passenger Thermal Comfort• DeIce/Defog
Complete flow circuit of air from exterior to outlets in the trunk.

Powertrain Simulation Roadmap
Component Analysis• Port Flow• Coolant Flow• Intake/Exhaust Manifold flow
1Transient Behavior• Couple Simulation to 1D Code• Look at EGR mixing• Exhaust manifold temperatures
2
System Analysis• Coolant Filling• Crank Case Ventilation• Oil Circuits• Turbo Charger
3
Environment Evaluation• Dynamometer Testing• Engine in Vehicle• Drive Cycle Simulation
4
Incr
ease
d R
OI
Complexity
Validate
Troubleshoot
Predict
Automate
Optimize
Component Analysis System Analysis

19
PowerTrain: Simulating Systems
ChallengeEngines that pass the dynamometer still fail when installed into the vehicle. Once vehicle design has been finalized, it can be costly to adjust cooling to the engine. At early design stages, it is important to determine possible thermal issues.
Solution Use existing geometry of the engine in dynamometer and place engine in vehicle.Includes:
• Cooling Air Flow• Air Induction System• Coolant Flow Network• Oil Flow
Impact• Reduce prototype of engine/vehicle
construction.• Reduce time to find out thermal failures.• Reduce cost • Reduce time to production.• Improve information on failure cause.

Powertrain Data Processing
Direct CAD Reader• Interfaces defined in CAD brought
over to STAR-CCM+• Fluid extraction used to separate
interior air/coolant/oil circuits• Enables conformal interfaces with
polyhedral cellsFunctional Data:
• Cycle average tool to extract cylinder data from ICE simulation
• 1D tool used to specify boundary conditions during transient
• Co-simulation used to pass data between fluid and solid networks
• Enables coupling to steady state fluid with transient thermal if needed.
• Material properties linked in from outside spread sheets?
Optimization• Baseline Simulation file built• CAD parameters can be exposed
in STAR-CCM+
Direct CAD Reader
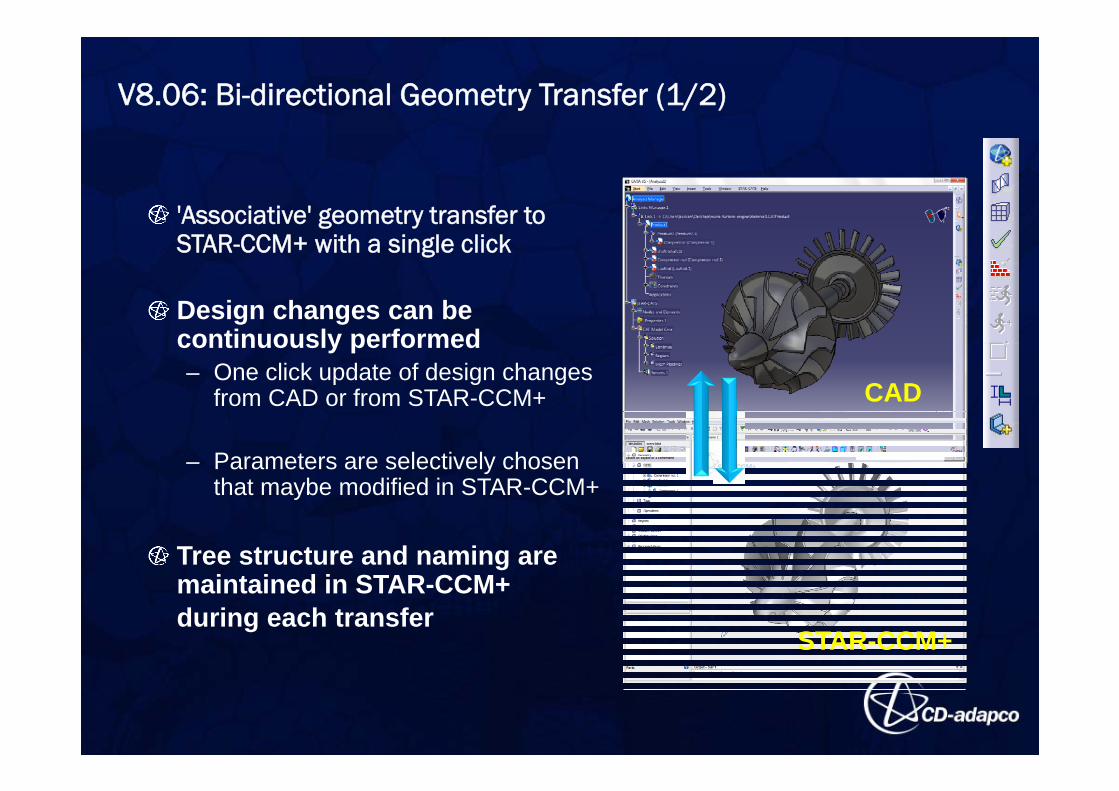
'Associative' geometry transfer to STAR-CCM+ with a single click
Design changes can be continuously performed– One click update of design changes
from CAD or from STAR-CCM+
– Parameters are selectively chosen that maybe modified in STAR-CCM+
Tree structure and naming are maintained in STAR-CCM+ during each transfer
V8.06: Bi-directional Geometry Transfer (1/2)
CAD
STAR-CCM+
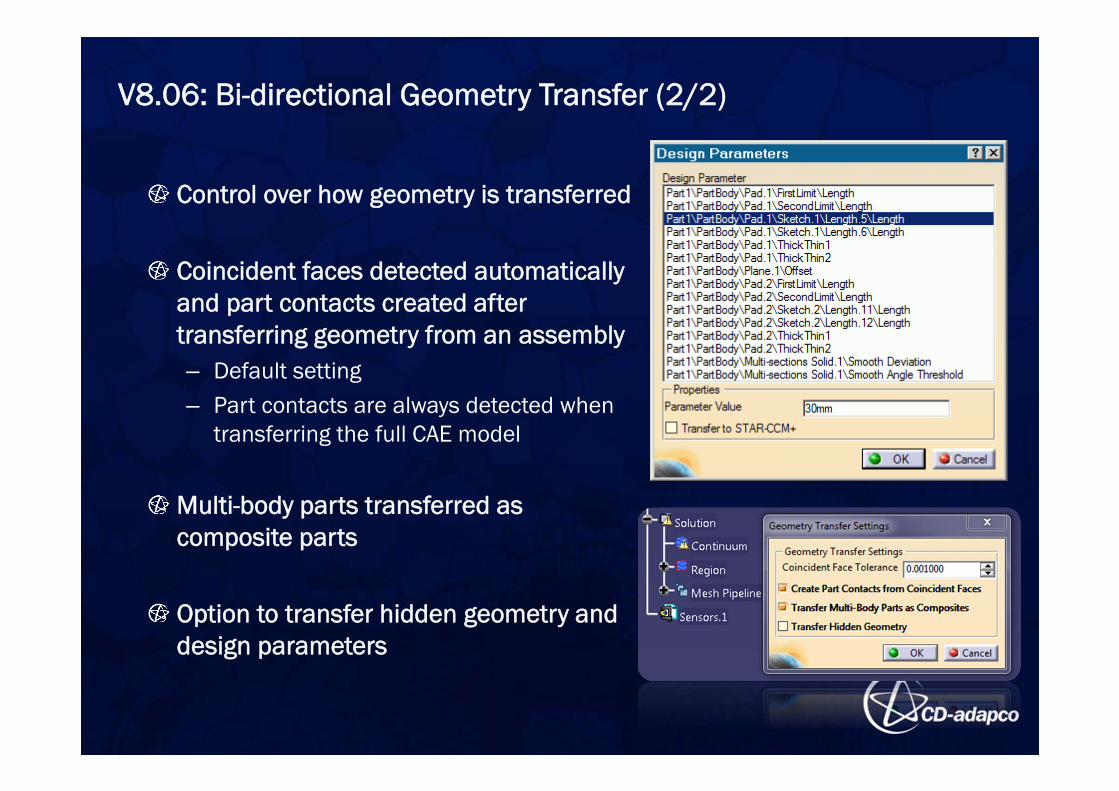
Control over how geometry is transferred
Coincident faces detected automatically and part contacts created after transferring geometry from an assembly– Default setting– Part contacts are always detected when
transferring the full CAE model
Multi-body parts transferred as composite parts
Option to transfer hidden geometry and design parameters
V8.06: Bi-directional Geometry Transfer (2/2)
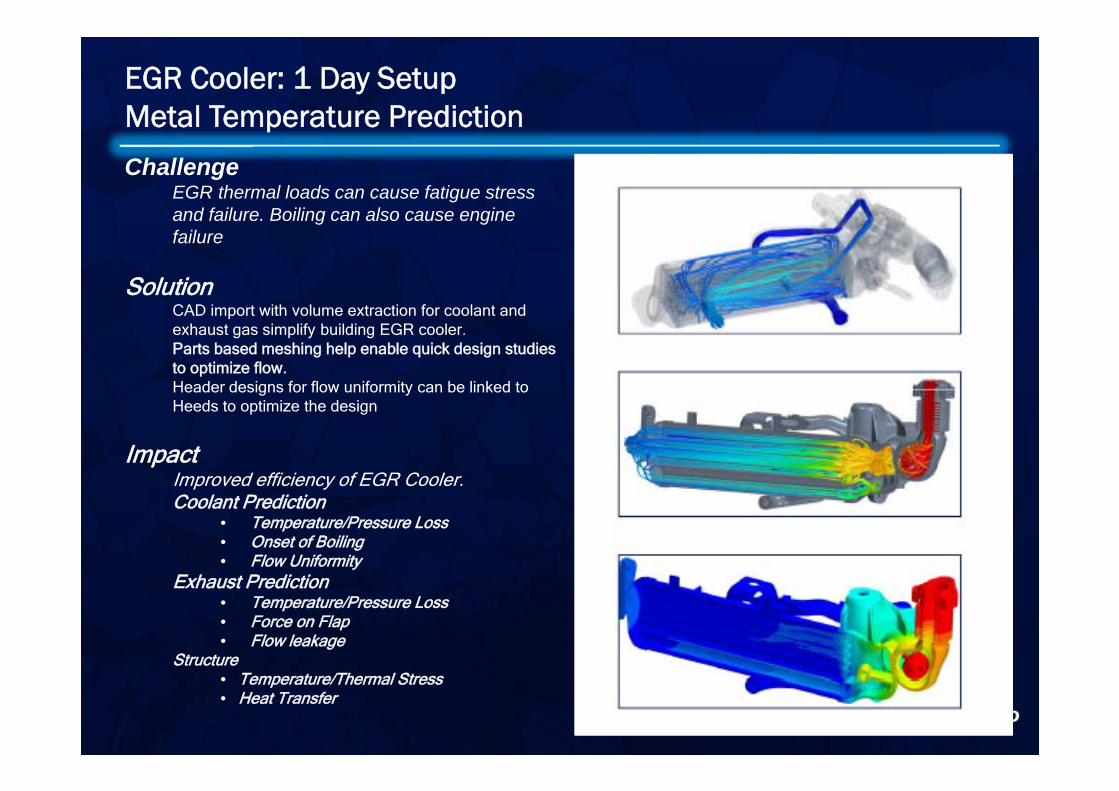
EGR Cooler: 1 Day Setup Metal Temperature Prediction
ChallengeEGR thermal loads can cause fatigue stress and failure. Boiling can also cause engine failure
Solution CAD import with volume extraction for coolant and exhaust gas simplify building EGR cooler.Parts based meshing help enable quick design studies to optimize flow.Header designs for flow uniformity can be linked to Heeds to optimize the design
ImpactImproved efficiency of EGR Cooler.Coolant Prediction
• Temperature/Pressure Loss• Onset of Boiling• Flow Uniformity
Exhaust Prediction• Temperature/Pressure Loss• Force on Flap• Flow leakage
Structure• Temperature/Thermal Stress• Heat Transfer

24
Coolant Jacket AnalysisAutomation/Optimization
ChallengeCoolant flow through the engine is critical for cooling of the head and block. CFD is a standard tool to help optimize the flow path. The challenge is how to optimize the coolant path quickly and efficiently.
Solution • Direct CAD import, volume extraction
makes it easy to extract coolant passage.• Custom tool helps automate process from
CAD to PowerPoint report.• Optimate can be used to automate gasket
sizes to maximize cooling efficiency• 5 Man Hours• 300 Designs Evaluated
Impact• Automation helps reduce dependency/skill
of the engineer and enables the engineer to concentrate on the engine design.
• Heat transfer coefficients can be quickly generated and mapped to FEA model.
Left BankRight Bank

Intake Port Flow AnalysisAutomated Virtual Port Flow Tool
ChallengeCombustion efficiency depends a lot on the intake air flow, tumble, and swirl to get complete, and fast burn. CFD has proven to be a valuable tool to optimize port flow. Engineer needs quick design studies to evaluate flow efficiency at different valve lifts.
Solution • Automated tool has been built and designed.• Port Flow optimization. • Follows work from established best practices.• Pass data to other software/databases without
manual interactions.
Impact• Reduce errors in simulation.• Leverage product expertise without needing
software expertise.• Leverage the expertise of analysis to the
experts.
Return to a focus on Design as opposed to Analysis!

26
Transmissions: Splash lubrication simulation using CFD
ChallengeProvide adequate lubrication and cooling of important components, such as bearings, gear contacts, clutches, synchronizers, etc, while working with minimum losses in the transmission.
Solution Transmission housing plays major role in guiding flow to critical areas. Simulating the splash lubrication with CFD provides visual showing the motion of the oil. The housing can then be modified to bring oil to critical locations.
ImpactImproved reliability of the transmission as well as fuel consumption by minimizing the losses in the engine.
27
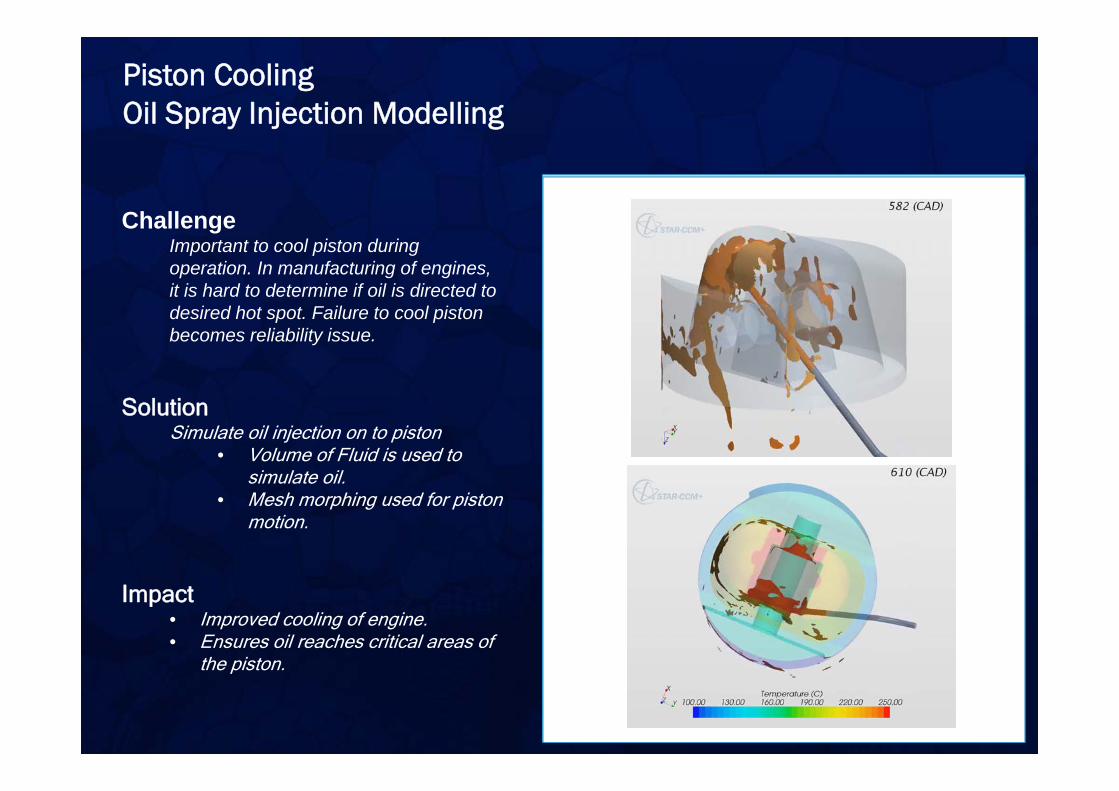
Piston CoolingOil Spray Injection Modelling
ChallengeImportant to cool piston during operation. In manufacturing of engines, it is hard to determine if oil is directed to desired hot spot. Failure to cool piston becomes reliability issue.
Solution Simulate oil injection on to piston
• Volume of Fluid is used to simulate oil.
• Mesh morphing used for piston motion.
Impact• Improved cooling of engine.• Ensures oil reaches critical areas of
the piston.

System Simulation is impacting design– Reduce turn-around time in design– Reduce costs from reducing number of
prototypesSimulation is expanding– Users are looking at replacing more expensive
tests with simulation– As capability grows and mature in simulation
tools, so does the demand on extending the features.
Design Exploration Growing– With increased automation provided by the
STAR-CCM+ suite, optimization expanding to provide engineers with best design, in the shortest design cycle.
Summary

Thank You!