Simulated Rotor Test Apparatus Dynamic Characteristics n ...
26
0_ NASA Technical Memorandum 102870 Simulated Rotor Test Apparatus Dynamic Characteristics _n the 80- by 120-Foot Wind Tunnel M. S. Hoque, R. L. Peterson, and T. A. Graham (NASA-I"_'-IO2_70) 3IHULAT_D RPTOR TEST APPARATUS L,YNA_IC CHARACTERISTICS IN T_iE 80- bY 120-FOOT WIND TUHNCL (NASA) 23 p CSCL OIC G3/05 N91-1_147 November 1990 N/LRA National Aeronautics and Space Administration https://ntrs.nasa.gov/search.jsp?R=19910005834 2020-03-19T19:18:24+00:00Z
Transcript of Simulated Rotor Test Apparatus Dynamic Characteristics n ...

0_NASA Technical Memorandum 102870
Simulated Rotor Test ApparatusDynamic Characteristics _n the80- by 120-Foot Wind Tunnel
M. S. Hoque, R. L. Peterson, and T. A. Graham
(NASA-I"_'-IO2_70) 3IHULAT_D RPTOR TEST
APPARATUS L,YNA_IC CHARACTERISTICS IN T_iE 80-
bY 120-FOOT WIND TUHNCL (NASA) 23 p
CSCL OIC
G3/05
N91-1_147
November 1990
N/LRANational Aeronautics and
Space Administration
https://ntrs.nasa.gov/search.jsp?R=19910005834 2020-03-19T19:18:24+00:00Z

NASA Technical Memorandum 102870
Simulated Rotor Test ApparatusDynamic Characteristics in the80- by 120-Foot Wind TunnelM. S. Hoque, Sterling Federal Systems, Palo Alto, CaliforniaR. L. Peterson and T. A. Graham, Ames Research Center, Moffett Field, California
November 1990
NationalAeronauticsandSpace Adminis_'ation
Ames Research CenterMoffett Field, California 94035-1000

SIMULATED ROTOR TEST APPARATUS DYNAMIC CHARACTERISTICS IN THE
80- BY 120-FOOT WIND TUNNEL
M. S. Hoque
Sterling Federal Systems, Inc.
R. L. Peterson and T. A. Graham
NASA Ames Research Center
SUMMARY
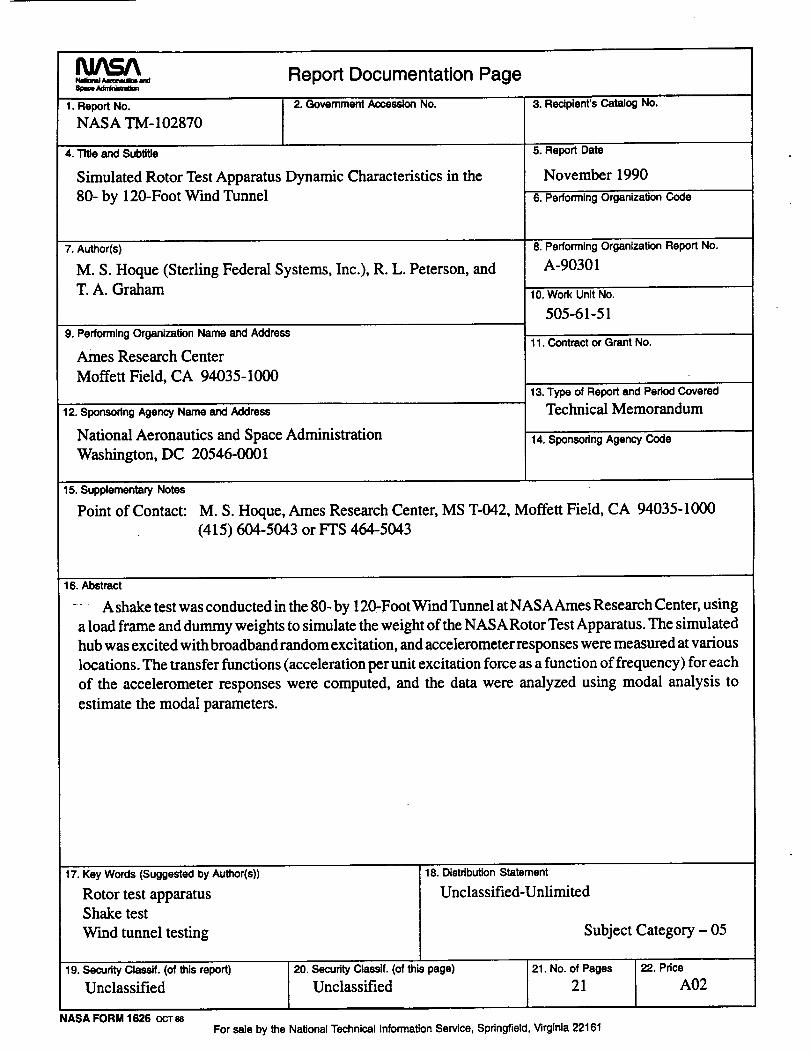
A shake test was conducted in the 80- by 120-Foot Wind Tunnel at NASA Ames Research
Center, using a load frame and dummy weights to simulate the weight of the NASA Rotor Test
Apparatus. The simulated hub was excited with broadband random excitation, and accelerometer
responses were measured at various locations. The transfer functions (acceleration per unit excitation
force as a function of frequency) for each of the accelerometer responses were computed, and the
data were analyzed using modal analysis to estimate the modal parameters.
INTRODUCTION
A shake test in the 80- by 120-Foot Wind Tunnel was conducted to determine the modal
parameters---natural frequency, modal mass and damping----of a typical helicopter rotor set-up con-
sisting of tunnel balance, turntable, struts and model (simulated by a load frame carrying dummy
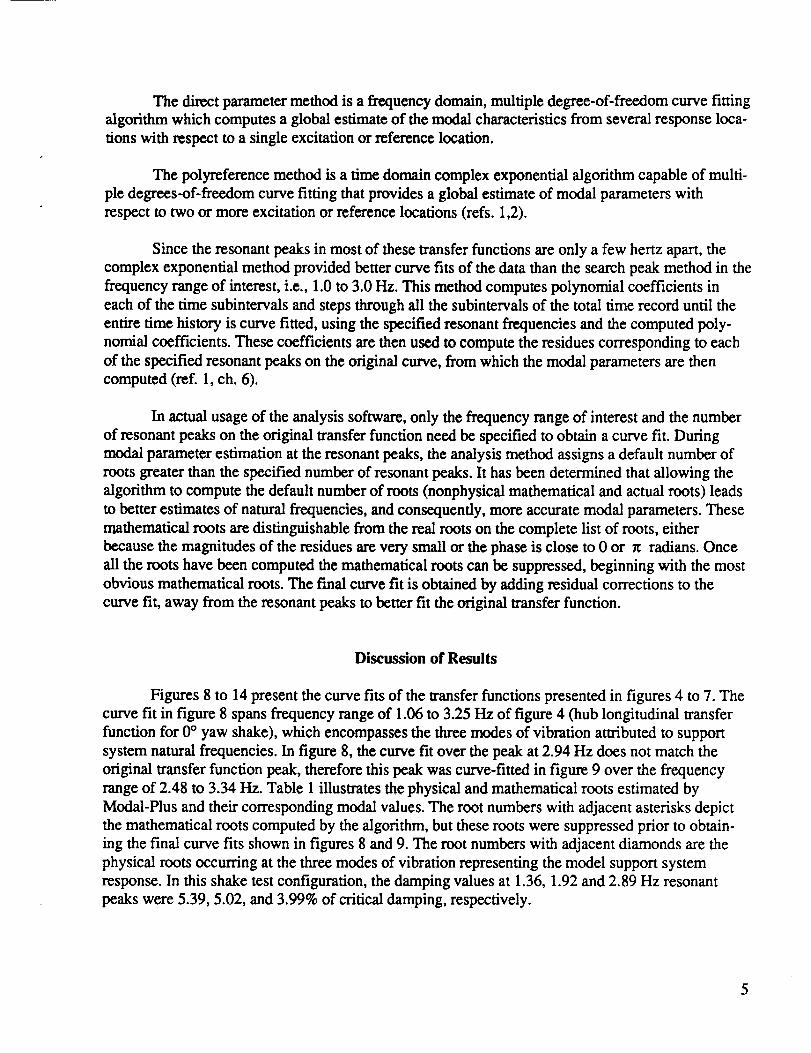
weights), as shown in figures 1(a) and 2. The primary objective of the shake test was to determine
the amount of support system modal damping in this wind tunnel configuration for performing a
rotor test using the Ames Rotor Test Apparatus (RTA) from the standpoint of potential ground reso-
nance instability. If the damping coefficients of the resonant modes are below the analytically deter-
mined minimum values needed to ensure dynamic stability, then balance snubbers will be engaged to
eliminate the balance mode thus increasing the stiffness of the system. An increase in the overall
system stiffness implies an increase in natural frequency, which results in increased critical damping
values at the remaining modes of vibration.
The location of the RTA rotor hub was simulated by structural beams without modeling of
the hub or the blade mass, because this preliminary shake test was conducted to determine only the
support system dynamic characteristics.The rotor-off hub accelerometer responses were measured in
the longitudinal direction, i.e., longitudinal in-plane acceleration of the hub to the longitudinal in-
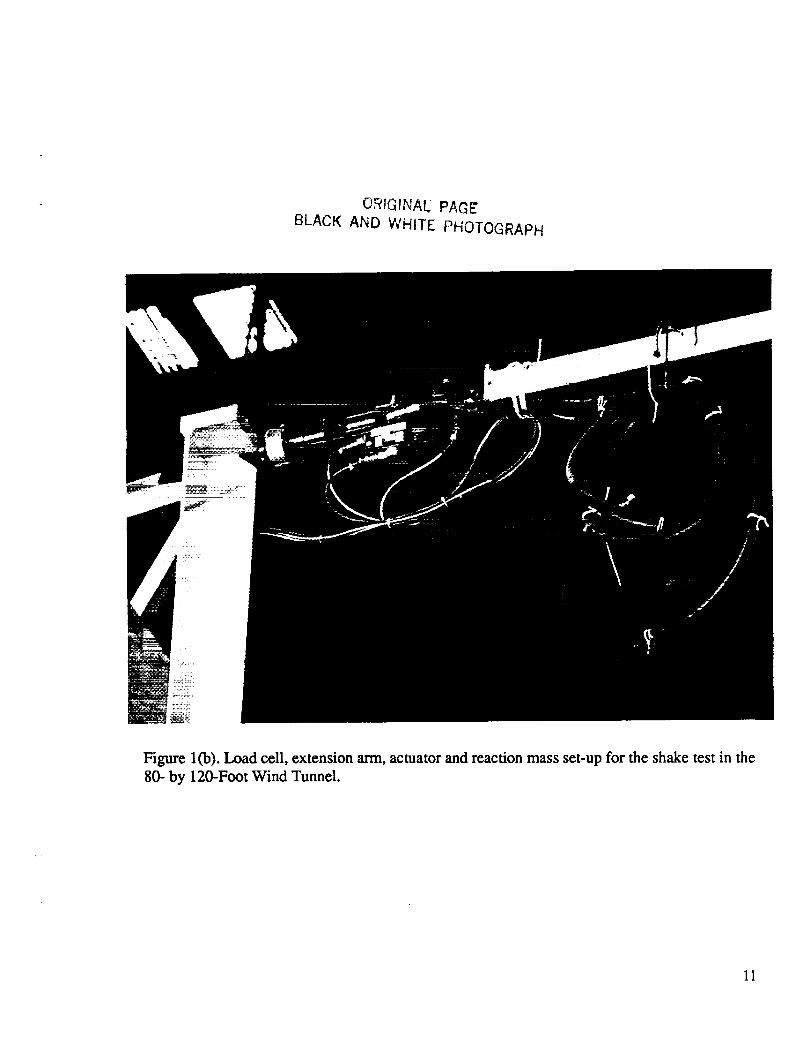
plane applied force, and likewise in the lateral direction. The shake tests were performed parallel and
perpendicular to the wind directions, i.e., at 0 ° and +90 ° yaw with respect to the wind tunnel flow
direction, as shown in figures 3(a) and 3(b). For this study, longitudinal and lateral directions are
defined relative to the load frame and model support system and therefore the model is re-oriented
relative to the wind direction when the model is yawed.
The model was shaken at +90 ° yaw to determine the dynamic characteristics of this setup as
a plausible hover test configuration to alleviate the rotor/wake interaction problem, which may alter
rotor hover performance ff the wake is not blown away. It was conceived that the RTA could be set
at an angle of attack of +30 ° (nose up) and yawed to +90 ° position (figs. 3(a) and 3(b)) to remedy the
rotor/wake interaction problem, thus discharging the rotor downwash out through the 80- by 120-
Foot Wind Tunnel doors. To achieve these configurations, the RTA might be installed on a different
set of struts.
The distance between the strut tip attachment points and the hub, and the strut lengths
between this simulated model setup and the actual RTA configuration may not be identical. This
would necessitate a separate shake test for each RTA configuration, since dynamic characteristics are
dependent on the strut configuration and model mass.
TEST SYSTEM DESCRIPTION
Model
The model consisted of a 4,500.1b load frame, using dummy weights to simulate the RTA
weight (29,200 lb). The load frame was mounted on a combination of 40- by 80-Foot (15-ft struts
and 6-in. strut tips) and 80- by 120.Foot Wind Tunnel struts (21-ft), which positioned the model strut
attachment points 36.5 ft above the tunnel floor. For all the shake test configurations, the tunnel bal-
ance and T-frame were not restricted from motion in any direction.
Test Apparatus
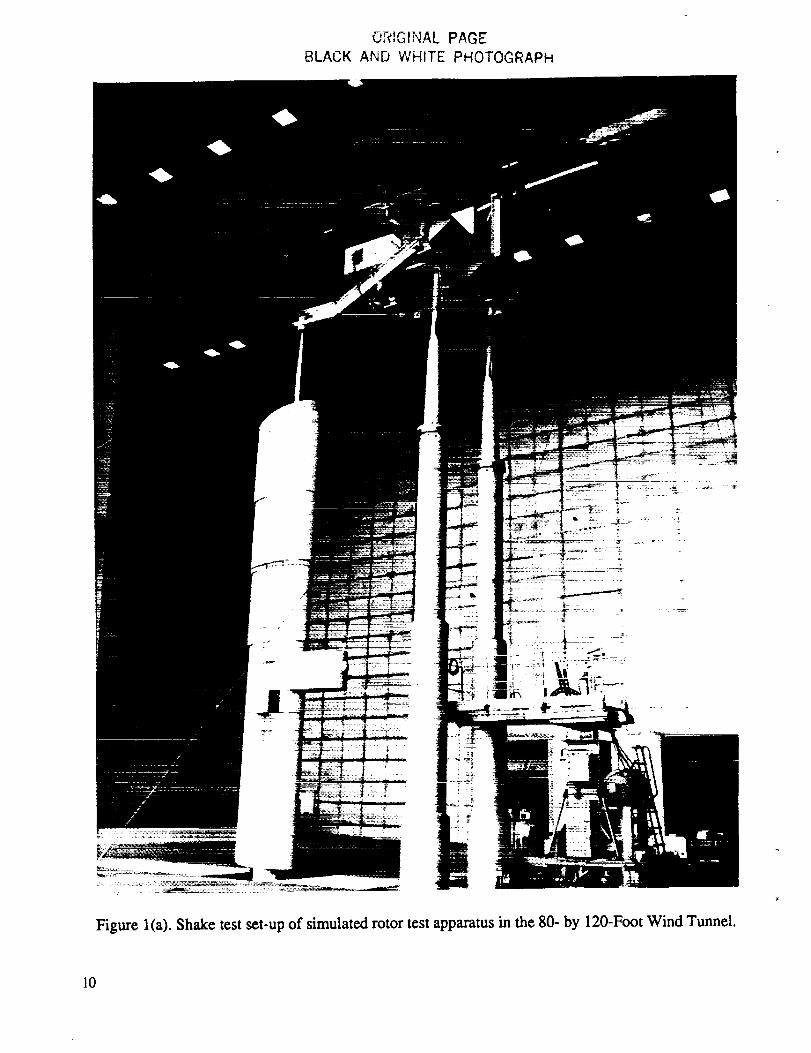
A hydraulic actuator was used to excite the model and the support system at the simulated
hub position as shown in figure l(b). One end of the hydraulic actuator was attached to a 5-ft-longextension arm. The other end of the actuator was attached to the dummy hub, approximately 45 ft
above the tunnel floor (8.5 ft above the strut tips). The extension arm was attached to an 11,600-1b
reaction mass hung from a gantry crane, as shown in figures 1(a), 1(b) and 2. The shaker was aligned
with respect to the extension arm, which was in turn aligned parallel to each of the shake directions
(longitudinal or lateral, 0 ° or +90 ° yaw; see figs. 3(a) and 3(b)) to minimize excitation of modes in
directions orthogonal to the shake direction. After achieving rough alignment of the actuator and the
extension arm using the gantry crane, finer alignment was achieved by applying tension to the guywires attached between the reaction mass and tunnel floor. The guy wires also restrained swinging of
the reaction mass during actuator excitation.
A load cell located between the hydraulic actuator and the hub measured the applied force.
Accelerometers were mounted on various locations on the model/load frameand the balance
T-frame in the longitudinal and lateral directions with respect to the coordinate system shown in fig-
ures 3(a) and 3(b). These accelerometer mounting locations were selected in order to provide large
acceleration response to provide more information on the yaw modes of the model, balance frame,
and the response of the load frame relative to the balance frame. These accelerometers were placed
2
at the following locations, as shown in figure 2: 1) at the midpoint of the front struts on the T-frame
(baseline), 2) at the midpoint of the T-frame between the front and the tail struts, 3) behind the tail
strut on the T-frame, and 4) at the interconnection between the 40- by 80-Foot and the 80- by 120-
Foot Wind Tunnel struts (see fig. 2).
Data Acquisition System
Transfer function data were acquired and stored on a 16-channel GenRad Model 2515
Computer-Aided Test System. It is a portable digital signal processing system for general purpose
data acquisition and analysis. The data acquisition system is capable of analyzing data in the fre-
quency range from DC to 25.6 KHz AC signal with alias protection on all channels.
Test Procedures
The GenRad acquisition mode was set to acquire data in the frequency range of 0 to 32 Hz to
identify ground resonance, and up to 4/rev vibration modes of a typical four-bladed rotor system.
The test conditions for lateral and longitudinal shake tests at 0 ° and +90 ° yaw, shown in fig-
ure 3(a) and 3(b), were as follows:
. Random excitation, bandwidth 0 - 32 Hz, nominal force (half peak-to-peak) = 5:400 Ib,
50 data averages, balance T-frame accelerometers (roving accelerometers) at baseline
location (see fig. 2),
, Random excitation, bandwidth 0 - 16 Hz, nominal force (half peak-to-peak) = +400 lb,
50 data averages, roving accelerometers at baseline location (see fig. 2). Following the previ-
ous data acquisition procedure it was deemed unnecessary to acquire data on 0 to 32 Hz
bandwidth, since there were no distinguishable support system natural frequencies in the 16to 32 Hz bandwidth.
o Random excitation, bandwidth 0 - 16 Hz, nominal force (half peak-to-peak) = +400 lb,
200 data averages, roving accelerometers at baseline location (see fig. 2),
, Random excitation, bandwidth 0 - 16 Hz, nominal force (half peak-to-peak) = +400 lb,
50 data averages, roving accelerometers at the middle of the balance T-frame (see fig. 2),
, Random excitation, bandwidth 0 - 16 Hz, nominal force (half peak-to-peak) = 5:400 lb,
50 data averages, roving accelerometers on the T-frame behind the tail strut (see fig. 2),
° Random excitation, bandwidth 0 - 16 Hz, nominal force (half peak-to-peak) = +400 lb,
50 data averages, roving accelerometers on the left strut at the interconnection between
40- by 80-/80- by 120-Foot Wind Tunnel struts (see fig. 2),

, Random excitation, bandwidth 0 - 16 Hz, nominal force (half peak-to-peak) = +400 lb,
50 data averages, roving accelerometers on the right strut at the intercormection between
40- by 80-/80- by 120-Foot Wind Tunnel struts (see fig. 2).
TEST RESULTS
Data
Figures 4 to 7 present the hub response transfer functions for the four configurations tested.
The shake directions are defined with respect to the coordinate system shown in figures 3(a)
and 3(b). In figure 4 (longitudinal shake at 0 ° yaw) resonant peaks in the longitudinal response direc-
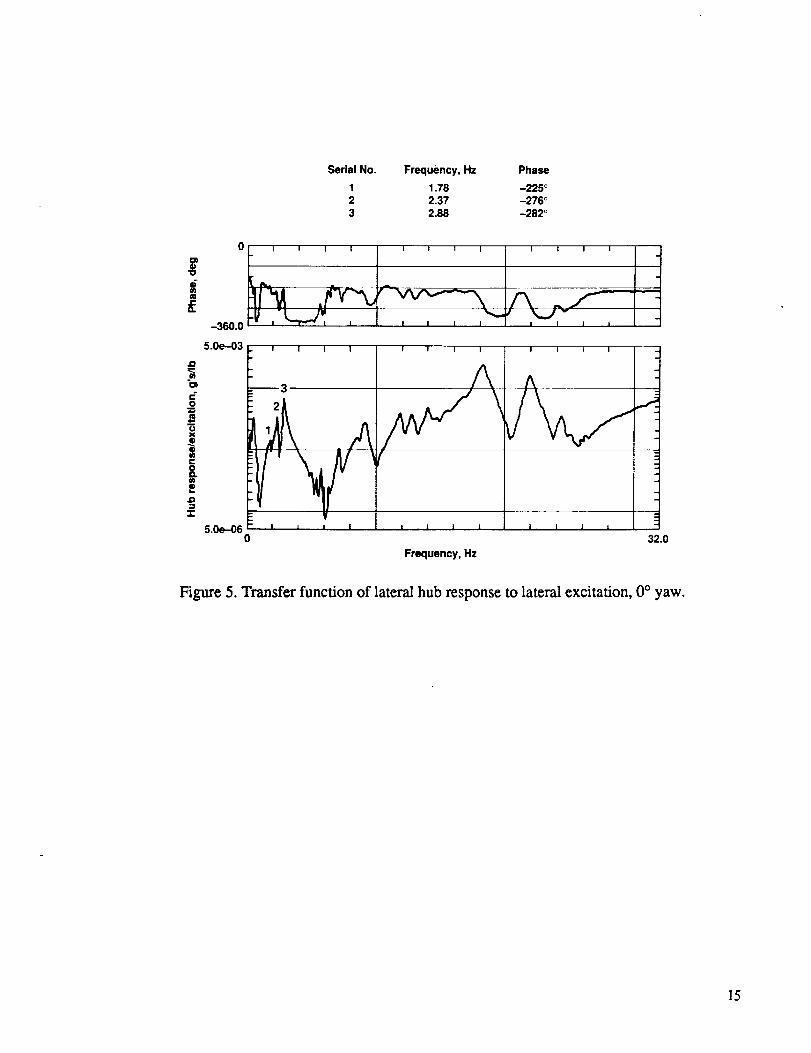
tion occur at 1.35, 1.92, 2.89, 6.70, 7.50, and 11.00 Hz. Remnant peaks shown in figure 5 (lateral
shake at 0 ° yaw) occur at 1.78, 2.37, 2.87, 6.60, 8.50, and 12.00 Hz. The natural frequencies in fig-
me 6 (longitudinal shake at +90 ° yaw) occur at 1.47, 2.15, 2.94, 5.50, 6.30, and 9.20 Hz. In figure 7
(lateral shake at +90 ° yaw) the resonant peaks occur at 1.50, 2.28, 2.77, 5.70, 7.20, 8.50, and
9.10 Hz.
The first three modes in each of the transfer functions were identified as support system
structural modes, which were determined by comparing the magnitudes and phases between the hub
accelerometers with those at other locations. In the absence of sufficient fixed system damping,
coupling between the rotor and the model support system could cause potentially hazardous ground
resonance.
The frequencies above 5 Hz could have been caused by the flexibility of the simulated hub
and the rocking motion of the concrete blocks supported by the model load frame to simulate the
RTA weight. The influence of these high frequency large amplitude vibrations on the lower fre-
quency responses cannot be overlooked because they influence the transfer function curve fits of the
latter as will be discussed later.
Analysis Techniques
The data were analyzed using the SDRC Modal Plus software package (ref. 1). Modal Plus
provides four methods to determine the modal parameters from frequency response functions. The
four methods are search peak, complex exponential, direct parameter and polyreference methods.
The search peak method computes a good estimate of the modal parameters and fits a smooth
curve over the transfer function using these estimated modal parameters, provided the resonant peaks
are well defined (i.e., at least 2 Hz apart and can be modeled as second-order single degree-of-
freedom systems).
For resonant peaks that are close to each other, the complex exponential method, a time
domain algorithm, computes a better estimate of modal parameters at the resonant peaks of the trans-
fer function.
4
The directparameter method isa frequency domain, multipledegree-of-freedomcurve fitting
algorithmwhich computes a globalestimateof the modal characteristicsfrom severalresponse loca-
tionswith respecttoa singleexcitationor referencelocation.
The polyreferencemethod isa time domain complex exponentialalgorithmcapable of multi-
ple degrees-of-freedomcurve fittingthatprovidesa globalestimateof modal paramcters with
respecttotwo or more excitationor referencelocations(rcfs.1,2).
Since the remnant Peaks inmost of thesetransferfunctionsare only a few hertzapart,the
complex exponentialmethod provided bettercurve fitsof thedatathan the searchPeak method inthe
frequency range of interest,i.e.,1.0to 3.0Hz. This method computes polynomial coefficientsin
each of the time subintervalsand stepsthrough allthe subintervalsof thetotaltime recorduntilthe
entiretime historyiscurve fitted,usingthe specifiedresonantfrequenciesand thecomputed poly-
nomial coefficients.These coefficientsare thenused tocompute the residuescorresponding toeach
of the specified resonant peaks on the original curve, from which the modal parameters are then
computed (ref. 1, ch. 6).
In actual usage of the analysis software, only the frequency range of interest and the number
of resonant Peaks on the original transfer function need be specified to obtain a curve fit. During
modal parameter estimation at the resonant peaks, the analysis method assigns a default number of
roots greater than the specified number of resonant peaks. It has been determined that allowing the
algorithm to compute the default number of roots (nonphysical mathematical and actual roots) leads
to better estimates of natural frequencies, and consequently, more accurate modal parameters. These
mathematical roots are distinguishable from the real roots on the complete list of roots, either
because the magnitudes of the residues are very small or the phase is close to 0 or _r radians. Once
all the roots have been computed the mathematical roots can be suppressed, beginning with the most
obvious mathematical roots. The final curve fit is obtained by adding residual corrections to the
curve fit, away from the resonant peaks to better fit the original transfer function.
Discussion of Results
Figures 8 to 14 present the curve fits of the transfer functions presented in figures 4 to 7. The
curve fit in figure 8 spans frequency range of 1.06 to 3.25 Hz of figure 4 (hub longitudinal transfer
function for 0 ° yaw shake), which encompasses the three modes of vibration attributed to support
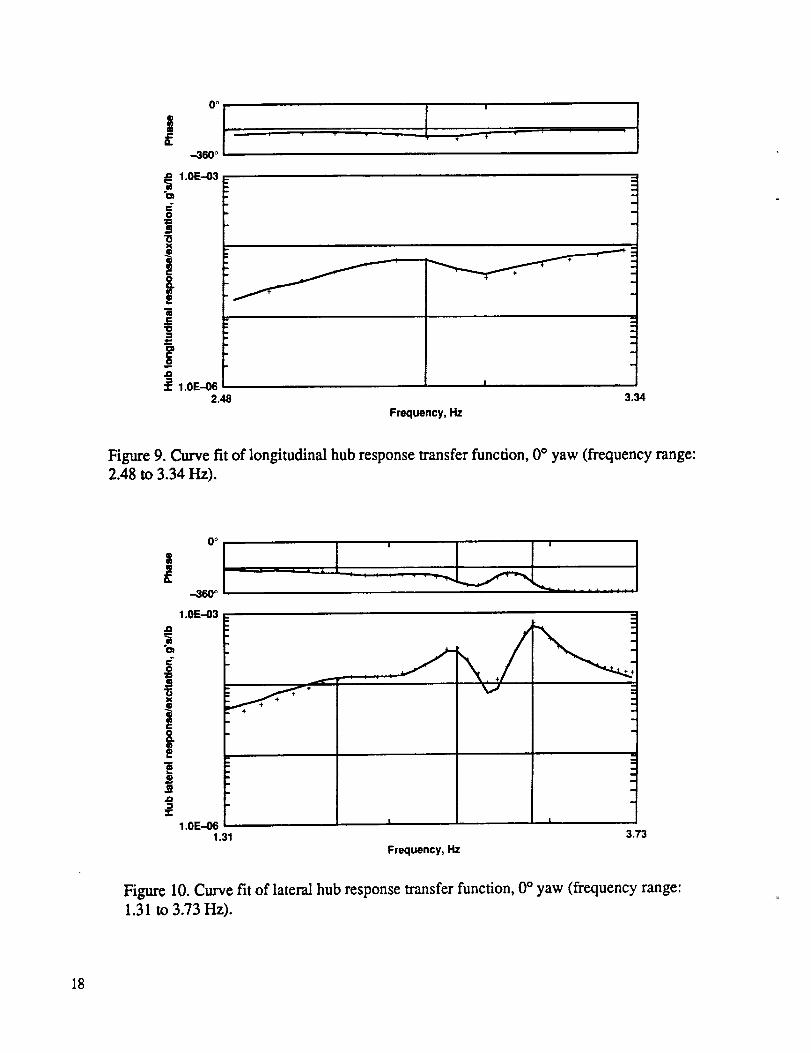
system natural frequencies. In figure 8, the curve fit over the peak at 2.94 Hz does not match the
original transfer function peak, therefore this Peak was curve-fitted in figure 9 over the frequency
range of 2.48 to 3.34 Hz. Table 1 illustrates the physical and mathematical roots estimated by
Modal-Plus and their corresponding modal values. 'The root numbers with adjacent asterisks depict
the mathematical roots computed by the algorithm, but these roots were suppressed prior to obtain-
ing the final curve fits shown in figures 8 and 9. The root numbers with adjacent diamonds are the
physical roots occurring at the three modes of vibration representing the model support system
response. In this shake test configuration, the damping values at 1.36, 1.92 and 2.89 Hz resonant
peaks were 5.39, 5.02, and 3.99% of critical damping, respectively.
5

The plot in figure 10 is a curve fit of figure 5 (hub lateral transfer function for 0 ° yaw shake)
over the frequency range of 1.31 to 3.73 Hz. The balance lateral mode at 1.77 Hz is almost unde-
tectable and seems highly damped due to its low response level. One reason could be that the mode
was not excited with sufficient energy using a broadband random excitation method of shaking. The
damping values in this test configuration at 1.78, 2.37, and 2.87 Hz modes were 12.66, 3.87, and
2.61% of critical damping, respectively.
Figure 11 presents the curve fit of the transfer function data shown in figure 6 (hub longitudi-
nal transfer function for +90 ° yaw shake) only over the frequency range of 1.09 to 2.60 Hz, because
a good curve fit could not be obtained through the last response peak at 2.89 Hz. Figure 12 repre-
sents the curve fit of the original transfer function over the last resonance peak at 2.89 Hz, which
consists of two very closely located response peaks at 2.88 and 2.93 Hz. These modes essentially
correspond to the same yaw mode of the balance or load frame yaw mode. The slight difference in
the natural frequencies may be due to small structural stiffness asymmetry either at the hub or the
model support system in the longitudinal and lateral directions. The estimated damping at 1.47, 2.15,
and 2.94 Hz modes were 3.46, 8.54, and 1.69 % of critical damping, respectively.
Figure 13 shows the transfer function curve-fit of figure 7 (hub lateral transfer function for
+90 ° yaw shake) over the entire frequency range covering all three resonant peaks of interest. The
curve fit matches the original transfer function better at frequencies above 2.00 Hz than at lower val-
ues. This discrepancy was also noticed in the curve fit over the third resonant peak in figure 8. It may
again be due to greater curve-fit weighting distribution over the higher frequencies than at lower fre-
quencies. The occurrences of hlgh frequencies were attributed to the rocking/impacting motion of the
dummy weights or load frame structural flexibility at the hub. Figure 14 represents the transfer func-
tion curve-fit of figure 7 (hub lateral transfer function for 90 ° yaw) only over the f'trst resonant peak
in the frequency range of 1.12 to 1.76 Hz. This curve fit seems to provide a better estimate of the
damping ratio at this mode than the value of modal p_eters obtained from the curve fit in fig-
ure 13. The damping values at 1.50, 2.28, and 2.77 Hz modes were computed to be 6.02, 2.38, and
1.94% critical damping, respectively.
TABULATED MODAL PARAMETERS
Table 2 gives a composite listing of the modal parameters in physical units corresponding to
the physical modes of vibration of the model support system structure. Some of the modal masses
have very large values--and one explanation is that the modal mass is a function of the transfer
function value at the resonant peak. If the transfer function values at the peak are small, then the
modal masses tend to be very large.
CONCLUSION
The shake test revealed all the low frequency modes of vibration of the wind tunnel model
support system for the simulated RTA mounted in the NASA Ames 80- by 120-Foot Wind Tunnel.
6

From thereduceddata it has been determined that there is at least 1.7 % critical damping in all the
modes of vibration.
REFERENCES
°
2.
User's Manual for MODAL-PLUS 9.0. General Electric CAE International, 1985.
Reference Manual for MODAL-PLUS 9.0. General Electric CAE International, 1985.
7

Table 1 - Estimate of roots for hub longitudinal response at 0 ° yaw
Roots
1"
2O
3O
4*
Frequency, Hz
1.07
1.35,, T
1.92J.r
1.38
Critical damping ratio
0.097
0.055
0.052
0.641
Residue, $'s/lb
6.37E-06
8.80E-05
1.00E-04
2.77E-04
Phase, rad
0.00
1.88
1.43
0.00
5* 1.95 0.073 4.32E-06 --0.714
6* 2.61 0.031 2.36E-06 0.06
70 2.89 0.038 3.30E-05 1.23
3.42
8* 2.95 0.040 5.49E-07
9* 3.31 0.011 1.79E-06
0.243 3.62E-0410"
-1.99
0.00
-3.142
* - mathematical roots
0 - actual roots
8

m
_,O oo
_ c; o c; d d d
_ ._ o_o _o
oo
•_ _ _%
N
"_ "_ o _ o
0
I I I !
9
ORIGINALPAGEBLACK AND WHITE PHOTOGRAPH
Figure l(a). Shake test set-up of simulated rotor test apparatus in the 80- by 120-Foot Wind Tunnel.
10
ORiGiNAL PAGE
BLACK AND WHITE PHOTOGRAPH
Figure l(b). Load cell, extension arm, actuator and reaction mass set-up for the shake test in the
80- by 120-Foot Wind Tunnel.
11

Hub lateral and longitudinalaccelerometers
Load frame
Lateral and longitudinal accels
40- by 80-11 tunnel 15-11 struts
Flow direction
Reaction mass
Hydraulic actuator
Dummy weights
Lateral and longitudinal sccelerometers
6-in. strut tips
Load frame tail lateral and
longitudinal accelerometers
80- by 120-11 tunnel 21-11 struts,
Baseline lateral and longitudinalroving
Interconnection between
40- by 80-11 tunnel and80- by 120-11 tunnelmain struts
Balance T-frame
195-1n.
Mid-turntable lateral and
longitudinal accelerometers
Aft turntable lateral and longitudinalsccelerometers
Figure 2. Shake test set-up of Simulated Rotor Test Apparatus (RTA) in the 80- by 120-Foot Wind
Tunnel.
12
Flow direction
1<
Y
T
Lateral shake
XJ Longitudinal shake
_/ Turntable
Figure 3(a). Longitudinal and lateral 0 ° yaw shake configuration.
Y
TFlow direction
l>
X
Lateral shake
Longitudinal shake
Figure 3(b). Longitudinal and lateral +90 ° yaw shake configuration.
13

g,"0
fi
0
u>to
e-
t,E
Serial No. Frequency, Hz Phase
1 1.38 -219 °2 1.94 -297 °3 2.89 -213 °
0 I I | | | I I | I I I I
-360.0
5.0e-03
j u|
_J
I I I
,2//"AA.
I! I I
| I I I ! I I I
=5.0e-06 z , t , I I I A |
0 32.0
Frequency, Hz
Figure 4. Transfer function of longitudinal hub response to longitudinal excitation, 0 ° yaw.
14
"0
COJ=O.
J_
r-04-,
CJx
Im
on
.j-
Serial No. Frequency, Hz Phase
1 1.78 -225 °2 2.37 -276 °3 2.88 -282 °
0 I I I I I ! I I I I I !
-360.0
5.0e-03 I I I I
: 3
5.0e-06 i J , i0
I I I I ! I I I
I 1I I I I I |
32.0
Frequency, Hz
Figure 5. Transfer function of lateral hub response to lateral excitation, 0 ° yaw.
15

Serial No. Frequency, Hz Phase
1 1.44 -227 °2 2.19 -311 °3 2.94 -272 °
i i I I i i i i I I
I l l I
1
I I 1 1
! I 1 I
I I I ,
Frequency, Hz
16.0
Figure 6. Transfer function of longitudinal hub response to longitudinal excitation, 90 ° yaw.
16

Serial No. Frequency, Hz Phase
1 1.49 -236 °2 2.28 -265 °3 2.78 -293 °
0 _ ! I I I I I I I
-r-vy .... /,.,,--360.0-' , , ' ,_'_",_'-"_, , , ,
i "
i -1.0e-06 l i J , , 1 l J J
0
Frequency, Hz
I I l I
I 1 I I
I I I I
16.0
Figure 7. Transfer function of lateral hub response to lateral excitation, 90 ° yaw.
0 o
if)o
t-O
0X0
Ee,
c-
O
! !
SJ 1,.
,, ÷÷_,-,4_-,'r_*''_360 °
1.0E-03 :
"1
1.0E-06 i ,1.06 3.34
Frequency, Hz
Figure 8. Curve fit of longitudinal hub response transfer function, 0 ° yaw (frequency range:
1.06 to 3.34 Hz).
17
0 o
I l Ii " ! !
-360 o
1.0E-03
2.48 3.34
Frequency, Hz
Figure 9. Curve fit of longitudinal hub response transfer function, 0 ° yaw (frequency range:
2.48 to 3.34 Hz).
n
,.Jr-
1.0E-06 l1.31
Frequency, Hz
L73
Figure 10, Curve fit of lateral hub response transfer function, 0 ° yaw (frequency range:
1.3 i to 3.73 Hz).
18

8m
g:O
_nU
||
"O
l=
_oe_
"r"
0 o
5.0E-04
I
5.0E-07 n1.09 2.60
Frequency, Hz
Figure 11. Curve fit of longitudinal hub response transfer function, 90 ° yaw (frequency range:1.09 to 2.60 Hz).
0 o !
8
"o
e
(.1
f-
t-
=3u
a,-
_o
3:
t
-360 °
5.0E-04 :
: +
5.0E--072.53
+ )" "1" ÷ + _ "t +
+ ++ +
+
+ + ÷
Frequency, Hz
+
=
3.15
Figure 12. Curve fit of longitudinal hub response transfer function, 90 ° yaw (frequency range:
2.53 to 3.15 Hz).
19

im
i
.O,,n
t-
an
IZo
UNO
g18
0 o -- ! !
460 °
1.0E_3
.... I il _!':;.,rr._t.._
2.0E-051.14 3.32
Frequency, Hz
Figure 13. Curve fit of lateral hub response transfer function, 90 ° yaw (frequency range:
1.14 to 3.32 Hz).
0 o
' Ii-n
--360 °
t-O
ux
¢
&om
_m.D
• , i i i i! I
1.0E_3
2.0E-061.761.12
Frequency, Hz
Figure 14. Curve fit of lateral hub response u-ansfer function, 90 ° yaw (frequency range:
1.12 to 1.76 Hz)
20
Report Documentation PageNallemlm aed
1. Report No.
NASA TM-102870
4. Title and Subtitle
2. Government Accession No. 3. Rectpient's Catalog No.
5. Report Date
Simulated Rotor Test Apparatus Dynamic Characteristics in the
80- by 120-Foot Wind Tunnel
7. Author(s)
M. S. Hoque (Sterling Federal Systems, Inc.), R. L. Peterson, and
T. A. Graham
9. Performing Organization Name and Address
Ames Research Center
Moffett Field, CA 94035-1000
12. Sponsoring Agency Name and Address
National Aeronautics and Space Administration
Washington, DC 20546-0001
November 1990
6. Performing Organization Code
8. Performing Organization Report No.
A-90301
10. Work Unit No.
505-61-51
11. Contract or Grant No.
13. Type of Report and Period Covered
Technical Memorandum
14. Sponsoring Agency Code
15. Supplementary Notes
Point of Contact: M. S. Hoque, Ames Research Center, MS T-042, Moffett Field, CA 94035-1000
(415) 604-5043 or FTS 464-5043
16. Abstract
- Ashake test was conducted in the 80- by 120-Foot WindTunnel at NASAAmes Research Center, using
a load frame and dummy weights to simulate the weight of the NASARotor Test Apparatus. The simulated
hub was excited with broadband random excitation, and accelerometer responses were measured at various
locations. The transfer functions (acceleration per unit excitation force as a function of frequency) for each
of the accelerometer responses were computed, and the data were analyzed using modal analysis to
estimate the modal parameters.
17. Key Words (Suggested by Author(s))
Rotor test apparatusShake test
Wind tunnel testing
18. Distribution Statement
Unclassified-Unlimited
Subject Category - 05
19. Security Classif. (of this report)
Unclassified
20. Secudty Classif. (of this page)
Unclassified
21. No. of Pages
21
22. Pdce
A02
NASA FORM 1626 OCT=For sale by the National Technical Information Service, Springfield, Virginia 22161