Spit Tobacco Spit Tobacco Resisting Pressure to use Tobacco.
Upload
branden-thorntonCategory
view
218download
1
SimSmoke Model for Pricing Policies and Control of Tobacco in Europe
David Levy, Ph.D.Pacific Institute for Research and Evaluation, University of Baltimore
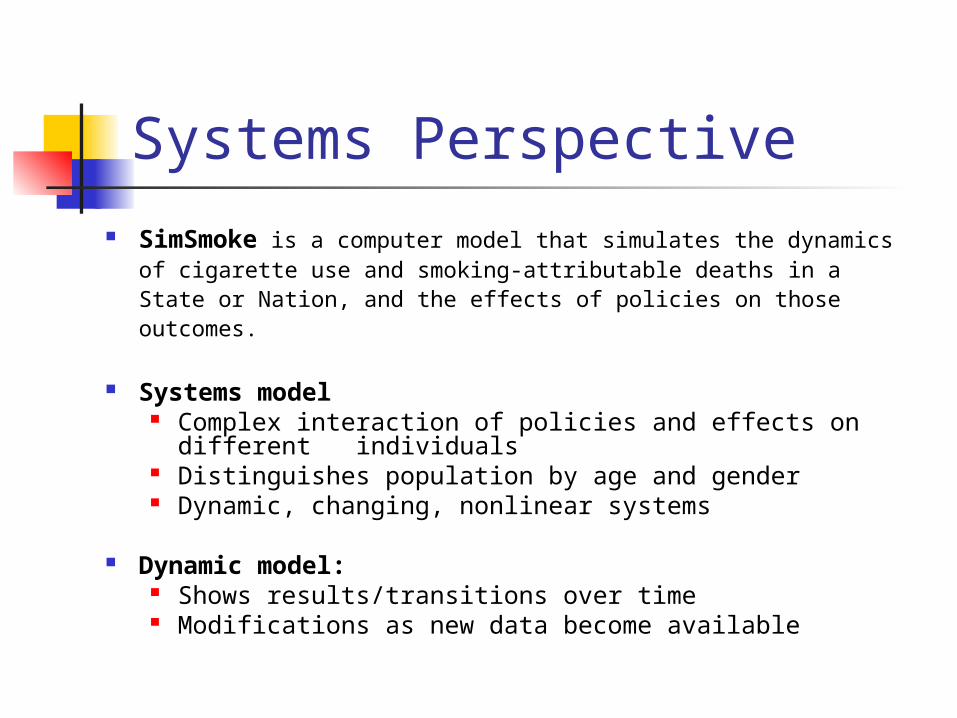
Systems Perspective SimSmoke is a computer model that simulates the
dynamics of cigarette use and smoking-attributable deaths in a State or Nation, and the effects of policies on those outcomes.
Systems model Complex interaction of policies and effects on different individuals
Distinguishes population by age and gender Dynamic, changing, nonlinear systems
Dynamic model: Shows results/transitions over time Modifications as new data become available

Model Setup
Excel model: Easily modifiable and transferable. Based on previously developed C++ model.
Transparent and easily adaptable by user
Easily Downloaded
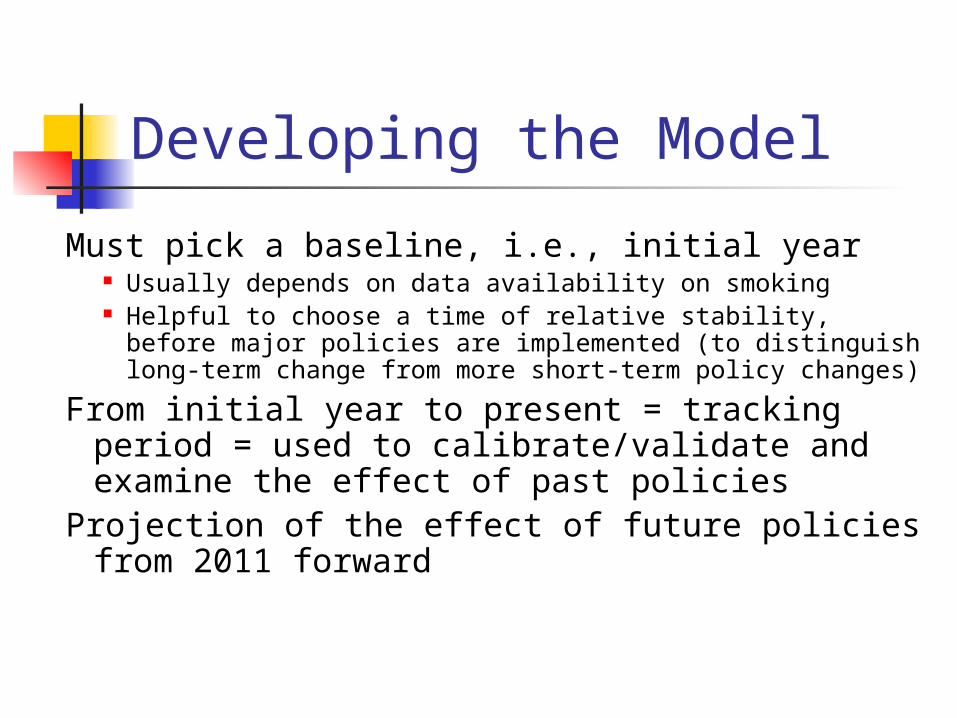
Developing the Model
Must pick a baseline, i.e., initial year Usually depends on data availability on smoking Helpful to choose a time of relative stability, before major policies are implemented (to distinguish long-term change from more short-term policy changes)
From initial year to present = tracking period = used to calibrate/validate and examine the effect of past policies
Projection of the effect of future policies from 2011 forward

Basic Structure of Model
Population model begins with initial year population and moves through time with births and deaths (Markov model)
Smoking model distinguishes population in never smokers, smokers, and ex-smokers and moves through time with initiation, cessation and relapse (Markov model)
Smoking-attributable deaths depend on smoking rates and RRs
Policy modules- one for each policy with independent effects on smoking rates

Smoking Model:Evolution of Smokers
Population
Never Smoker
Ever Smoker* Current
Smoker**
Ex-Smoker
InitiationInitiation Not quitNot quit
RelapseRelapse
Cessation Cessation (quit)(quit)
Not initiateNot initiate
* Usually as smoked 100 cigarettes lifetime ** usually as smoked some or all days

Smoking-Attributable Deaths
Smoking attributable deaths = (Smoker death rate –never smoker death rate) * # Smokers + years quit (Ex -smoker death rate –never smoker death rate) * # Ex-smokers
Summed over ages and by gender
Total DeathsDeaths
Attributable to Smoking
Death Death rates by rates by smoking smoking
statusstatusRelative Relative risksrisks
% % smokers smokers and ex-and ex-
smokerssmokers

Policy Effect SizesPolicy Effect Sizes In percentage terms relative to smoking rate (1+PR),
PR = percent reduction Based on studies
Initial impact on cessation through prevalence (1+PR). Maintained through initiation rates (1+PR) and increased through cessation rates (1-PR)
Less known about these effects
Effects may differ by age or gender
Effects depend on the way in which policy is implemented: level, coverage, degree of enforcement, publicity, etc.- newly incorporated enforcement and information issues

We use MPOWER Policies
Taxes –as a percent of retail prices, effects depend on size of tax increase and initial price. through elasticities (uses constant elasticities, vary by age, but not gender), no effect yet on smuggling. Goal= specific ad valorem and excise tax at 70% of price
Smoke-Free Air Laws depend on: Where applied:
Worksites (3 levels) Restaurants and bars Other public places
Enforcement now has a stronger role

MPOWER policies (cont)
Advertising Bans: depends on how widely applied (including marketing-4 categories) and enforcement
Health Warnings: depends on size, state-ments and how graphic by category (3)
Organized Tobacco Control Campaigns (plan, personnel and expenditures), Unlike MPOWER, incorporates media campaigns and local organization
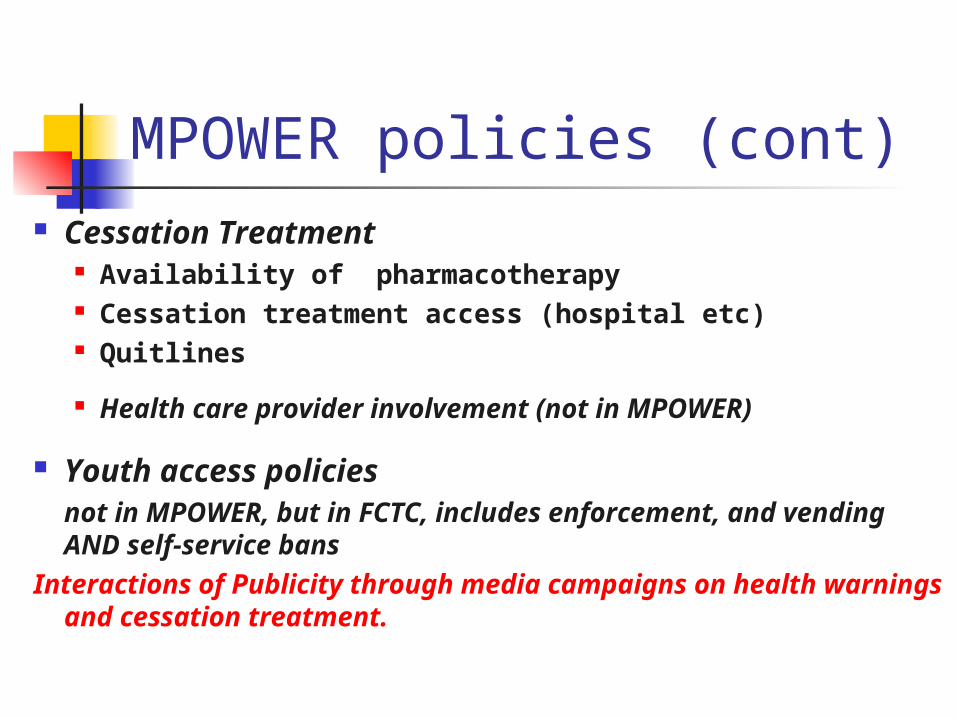
MPOWER policies (cont) Cessation Treatment
Availability of pharmacotherapy Cessation treatment access (hospital etc) Quitlines
Health care provider involvement (not in MPOWER)
Youth access policies not in MPOWER, but in FCTC, includes enforcement, and vending AND self-service bans
Interactions of Publicity through media campaigns on health warnings and cessation treatment.

Price Effects and Issues
Target tax rate: Include value added like MPOWER? Prefer combination of ad valorem and excise as a percent of price.
Target = 70%?
Transform elasticities into prevalence effects (also can effect quantity).
May be lower in recent years, due to tax avoidance (more border crossing, internet) as taxes increase
Can also affect quantity
No interaction with other policies.

Models developed for eleven nations
The following have data back long enough to validate and with varying degrees of tobacco control Czech Republic France Germany Great Britain Ireland Netherlands

France Model: Structure
Starts in 2000= large survey, before major policy changes
Smoking prevalence data from the French Health Barometer 2000- included 13 685 people aged 12-75
Since 2000, relatively high tax rate, smoke-free air laws (2004), increased marketing restrictions and stronger health warnings (2002), some increase in tobacco control spending and cessation treatment policies since 1998, but both are still not at high levels.
Validated the model against data from the 2005 French Barometer. Relative to 2000 Barometer, adult smoking prevalence fell by 8.2% while the model predicts an 8.1% relative decline, but showed more variation by gender. 2008 should be available soon

Smoking prevalence over time, French males


Ireland Model: Structure
Model begins in 1998, smoking prevalence from Survey of Lifestyles Attitudes and Nutrition (SLAN). a nationally representative, stratified random sample. The survey was conducted in 1998, 2002 and 2007
Some large recent tax/price increases. Tax now Some large recent tax/price increases. Tax now 80% of price if including VAT, but less 80% of price if including VAT, but less otherwise. Smoke-free air laws since 2004, otherwise. Smoke-free air laws since 2004, increased advertising and marketing restrictions increased advertising and marketing restrictions and stronger health warnings since 2002. Some and stronger health warnings since 2002. Some increase in tobacco control spending and increase in tobacco control spending and cessation treatment policies since 1998, but both cessation treatment policies since 1998, but both are still not at high levels. are still not at high levels.
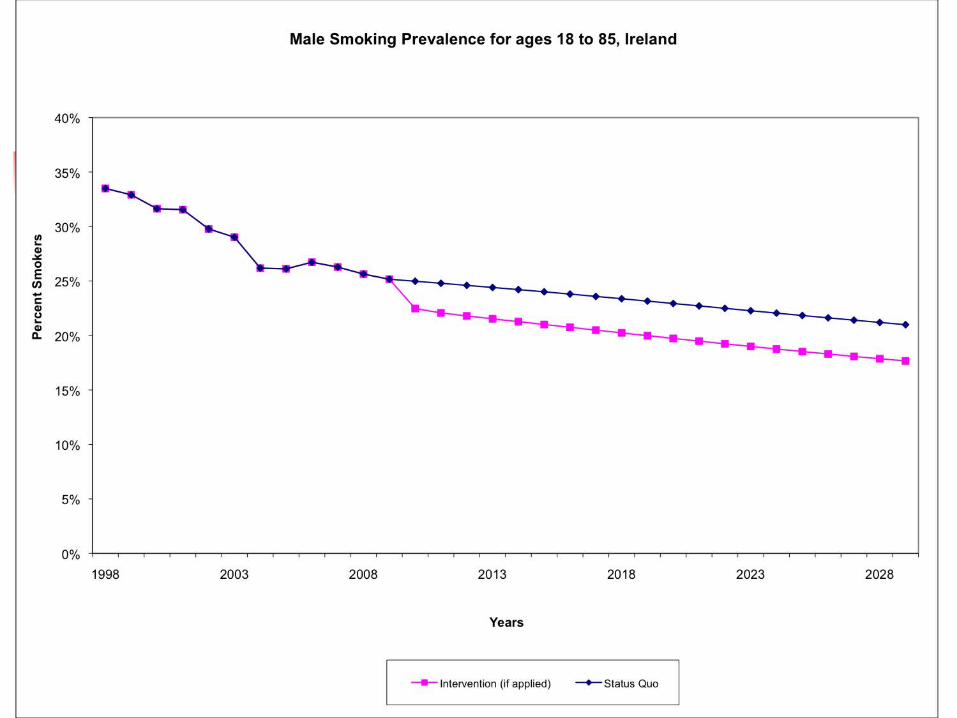

Ireland: Preliminary Results
Model suggest large declines in prevalence between 1998 and 2006, more than actually occur, mainly due to large price increase. Some indication in of a decline in SLAN, but appears to less than predicted by the model (less in other data-Ireland OTC data from 2003-2008)
Cessation rates may be too high (only available for 2007)
Other factors: smuggling, income effects

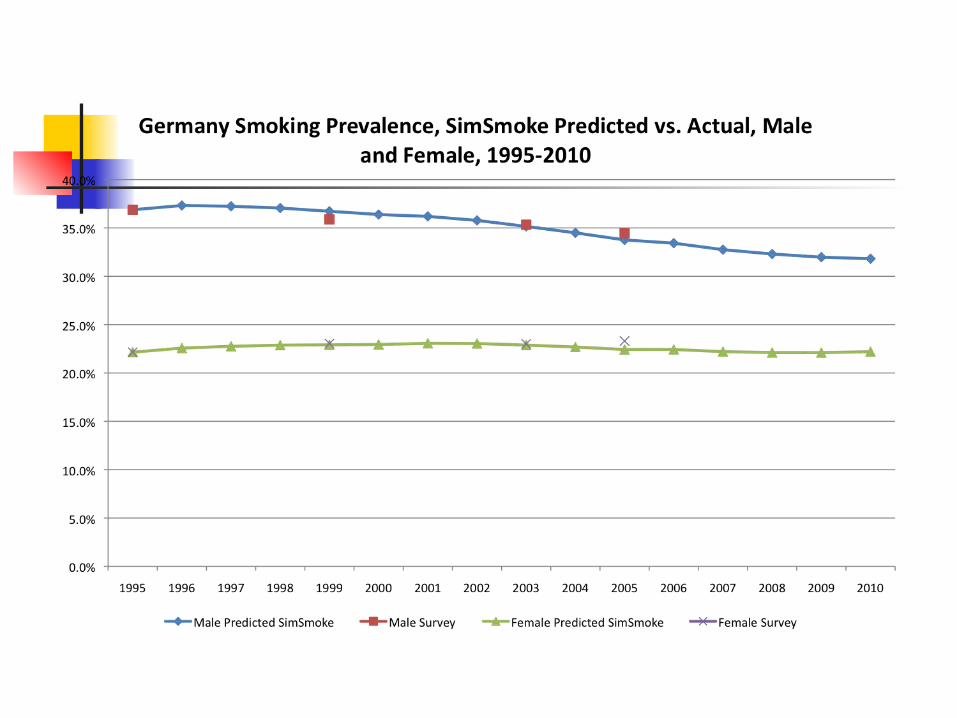
Germany Begin the model in 1995, track to 2010
Includes East and West Germany Has had several tax increases in around 2003-2004, some mass media (minor) and some tightening of advertising restrictions (minor) and enlarging of health warnings
Generally considered a country with lax tobacco control

Czech Republic
Model begins in 2002 Has had several tax increases in around , some mass media (minor) and some enlarging of health warnings, little else
Generally considered a country with lax tobacco control
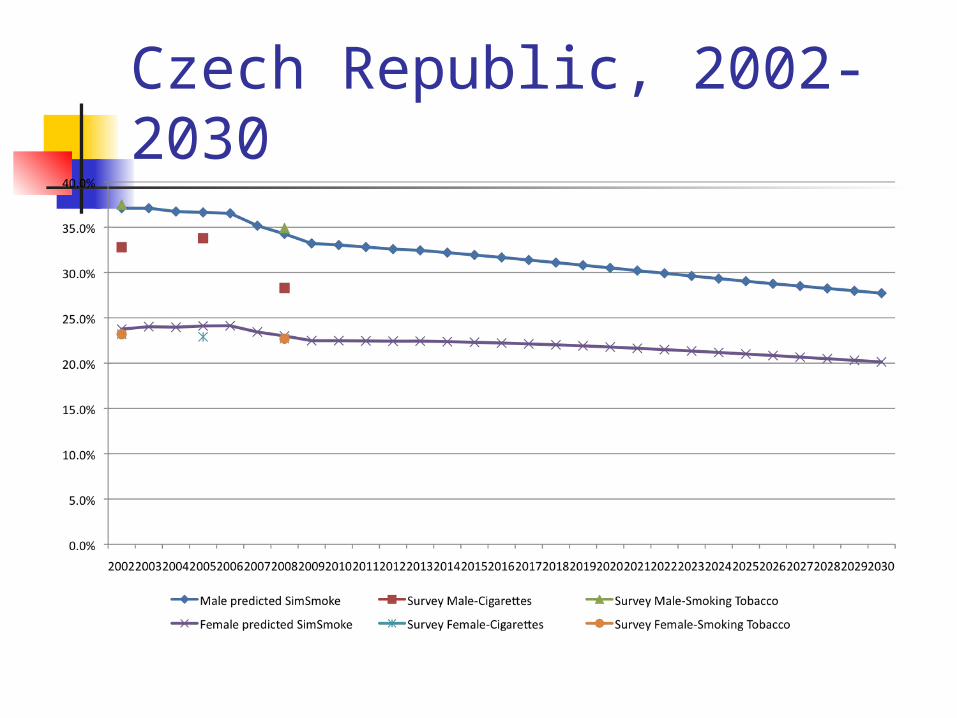
Czech Republic, 2002-2030
Netherlands Model begins in 1996 Since 2000, there have been two tax increases, stronger health warning and advertising restrictions, media campaigns, and quitlines, as well as attempts an greater cessation treatment
Considered relatively active tobacco control for EU nations
Will be meeting with staff there


Great Britain• Includes England, Wales and Scotland.• Begins in 1998 before reforms• Since 1998, has increased slightly taxes on cigarettes, implemented stronger health warnings, clean air laws and advertising restrictions, media campaigns, and, most notably, implemented a comprehensive and well-publicized cessation treatment program
• Considered probably the most active tobacco control of EU nations


Summary of Results Summary of Results
• Models to date predict fairly wellModels to date predict fairly well
• Learning process about the effects of Learning process about the effects of policies, but results seem to indicate policies, but results seem to indicate that strong comprehensive policies are that strong comprehensive policies are needed. The GB case provides the needed. The GB case provides the shining example of the potential shining example of the potential effect.effect.
• Countries without tobacco control Countries without tobacco control experiencing little change in smoking experiencing little change in smoking prevalence. prevalence.
• Generally, better data is needed on Generally, better data is needed on cessation ratescessation rates
• Awaiting results of the PPACTE Awaiting results of the PPACTE analysis to incorporate into the model.analysis to incorporate into the model.
Other countries developed but not validated Poland –history of TC- may extend Russian Federation- minimal TC Turkey- recent TC, some validation Ukraine- recent TC Albania –recent history of TC, some interesting smuggling issues

Sweden model in progress
Will include Snus, and combination of snus and cigarettes= 3 separate groups
Relative mortality risks = will use my work, ok?
Strong TC policies for cigarettes, but mostly in the past and little towards Snus Only policy effects for Snus, price from PPACTE Sweden studies
Other tobacco control policies? Substitutes or complements?
Other issues to be considered?
Other models
Finland- active TC Italy – recent TC- direct collaboration
Spain? Other?

Issues Smuggling adjustment yet to be determined. May include
price of neighboring country and allow substitution, subject to enforcement. However, lack of studies
Quantity smoked Data often not available at the disaggregated level, could examine overall consumption
Which measure, often not available for someday smokers, which an increasing proportion of smokers
Less knowledge about effects
Total smoking-attributable deaths only health outcome Have had problems getting data by type (heart, COPD and cancers)
Assumptions about risks more problematic

• JUSTIFY through forecasting the future dynamics of tobacco use and
problems, effects of past policies, and the potential effect of
future policies
• UNDERSTAND the complex network of policies affecting
surrounding tobacco use and problems.
• PLANNING:
• Estimate the likely impact of alternative interventions in specific
situations and on specific populations.
• Assess and rank strategies for reaching goals prior to commitment
of resources.
• Develop more systematic surveillance and evaluation network
Policymakers can use SimSmoke to:Summary