SIMS ANALYSIS CHEAT SHEET - Zendesk · 1 SIMS ANALYSIS CHEAT SHEET PURPOSE ... Partners (IPs),...
22
1 SIMS ANALYSIS CHEAT SHEET PURPOSE This document accompanies the SIMS Country Profile and can be used by OU staff to undertake more targeted analysis depending on needs and priorities. The document provides step-by-step instruction to manipulate the SIMS dashboard, and analyze SIMS data by Sub-National Units (SNUs), Implementing Partners (IPs), Implementing Mechanisms (IPs), and triangulate SIMS and MER data. ANALYSIS RESOURCES The following resources are required to perform the analyses described in this document: SIMS Dashboard of Operating Unit (OU) for the most recent quarter. List of priority SNUs, IMs or IPs from COP that the OU team would like to assess. MER data from DATIM for the most recent quarter. Access to Excel version 2007 or later. For additional information on data sources and SIMS programmatic details, refer to your OU specific file and the SIMS Implementation Guide.
Transcript of SIMS ANALYSIS CHEAT SHEET - Zendesk · 1 SIMS ANALYSIS CHEAT SHEET PURPOSE ... Partners (IPs),...
1
SIMS ANALYSIS CHEAT SHEET
PURPOSE This document accompanies the SIMS Country Profile and can be used by OU staff to undertake more targeted analysis depending on needs and priorities. The document provides step-by-step instruction to manipulate the SIMS dashboard, and analyze SIMS data by Sub-National Units (SNUs), Implementing Partners (IPs), Implementing Mechanisms (IPs), and triangulate SIMS and MER data.
ANALYSIS RESOURCES The following resources are required to perform the analyses described in this document:
SIMS Dashboard of Operating Unit (OU) for the most recent quarter.
List of priority SNUs, IMs or IPs from COP that the OU team would like to assess.
MER data from DATIM for the most recent quarter.
Access to Excel version 2007 or later. For additional information on data sources and SIMS programmatic details, refer to your OU specific file and the SIMS Implementation Guide.
2
TYPES OF SIMS ANALYSIS PURPOSE ....................................................................................................................................................... 1
ANALYSIS RESOURCES ................................................................................................................................... 1
TYPES OF SIMS ANALYSIS .............................................................................................................................. 2
1.0 SIMS Dashboard Navigation .................................................................................................................... 3
1.1 How to Navigate the Dashboard? ....................................................................................................... 3
1.2 How to Filter Using Slicers in the Dashboard? .................................................................................... 3
1.3 How to Filter by Using Pivot Tables in the Dashboard? ...................................................................... 5
1.4 How to filter data not displayed in the Dashboard? ........................................................................... 7
1.5 How to change and move fields in PivotCharts? ................................................................................ 9
2.0 ANALYSIS OF SIMS ASSESSMENTS ........................................................................................................ 11
2.1 How to analyze your SIMS data by Scores and SNU? ....................................................................... 11
2.2 How are partners preforming across sites? ...................................................................................... 13
2.3 How many sites did not meet the 25/50 Rule during their initial assessment? ............................... 14
2.4 How many sites received a follow-up assessment? ......................................................................... 16
2.5 Which sites did not improve? ........................................................................................................... 17
2.8 Are there any CEEs that are consistently poorly rated at a site? Across multiple sites?.................. 18
3.0 DATA TRIANGULATION BETWEEN SIMS AND MER ............................................................................... 20
3
1.0 SIMS Dashboard Navigation
1.1 How to Navigate the Dashboard?
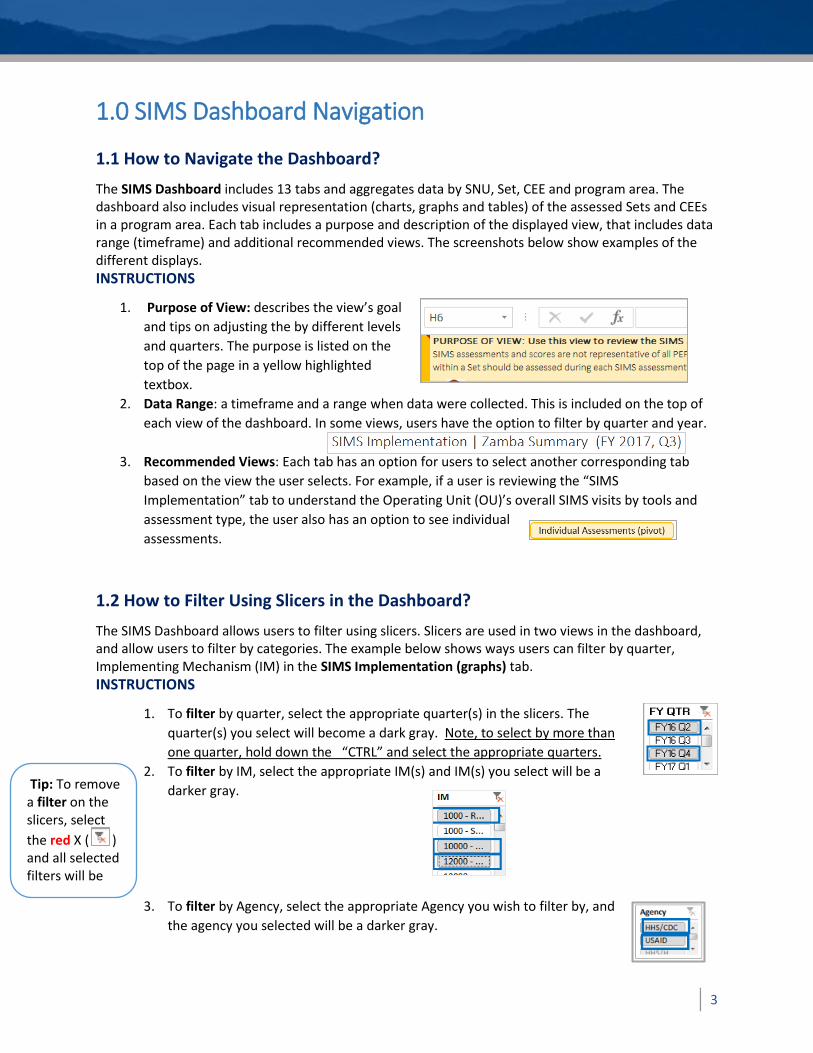
The SIMS Dashboard includes 13 tabs and aggregates data by SNU, Set, CEE and program area. The dashboard also includes visual representation (charts, graphs and tables) of the assessed Sets and CEEs in a program area. Each tab includes a purpose and description of the displayed view, that includes data range (timeframe) and additional recommended views. The screenshots below show examples of the different displays. INSTRUCTIONS
1. Purpose of View: describes the view’s goal
and tips on adjusting the by different levels
and quarters. The purpose is listed on the
top of the page in a yellow highlighted
textbox.
2. Data Range: a timeframe and a range when data were collected. This is included on the top of
each view of the dashboard. In some views, users have the option to filter by quarter and year.
3. Recommended Views: Each tab has an option for users to select another corresponding tab
based on the view the user selects. For example, if a user is reviewing the “SIMS
Implementation” tab to understand the Operating Unit (OU)’s overall SIMS visits by tools and
assessment type, the user also has an option to see individual
assessments.
1.2 How to Filter Using Slicers in the Dashboard?
The SIMS Dashboard allows users to filter using slicers. Slicers are used in two views in the dashboard, and allow users to filter by categories. The example below shows ways users can filter by quarter, Implementing Mechanism (IM) in the SIMS Implementation (graphs) tab. INSTRUCTIONS
1. To filter by quarter, select the appropriate quarter(s) in the slicers. The
quarter(s) you select will become a dark gray. Note, to select by more than
one quarter, hold down the “CTRL” and select the appropriate quarters.
2. To filter by IM, select the appropriate IM(s) and IM(s) you select will be a
darker gray.
3. To filter by Agency, select the appropriate Agency you wish to filter by, and
the agency you selected will be a darker gray.
Tip: To remove a filter on the slicers, select
the red X ( ) and all selected filters will be removed
4
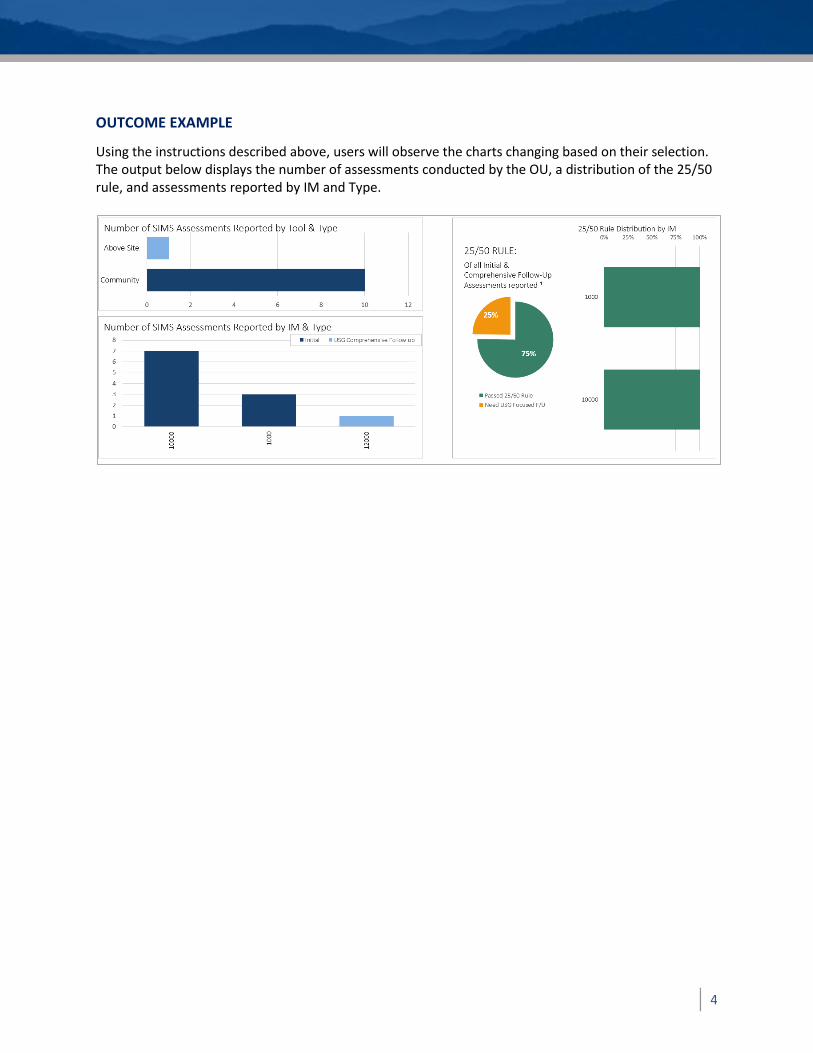
OUTCOME EXAMPLE
Using the instructions described above, users will observe the charts changing based on their selection. The output below displays the number of assessments conducted by the OU, a distribution of the 25/50 rule, and assessments reported by IM and Type.
5
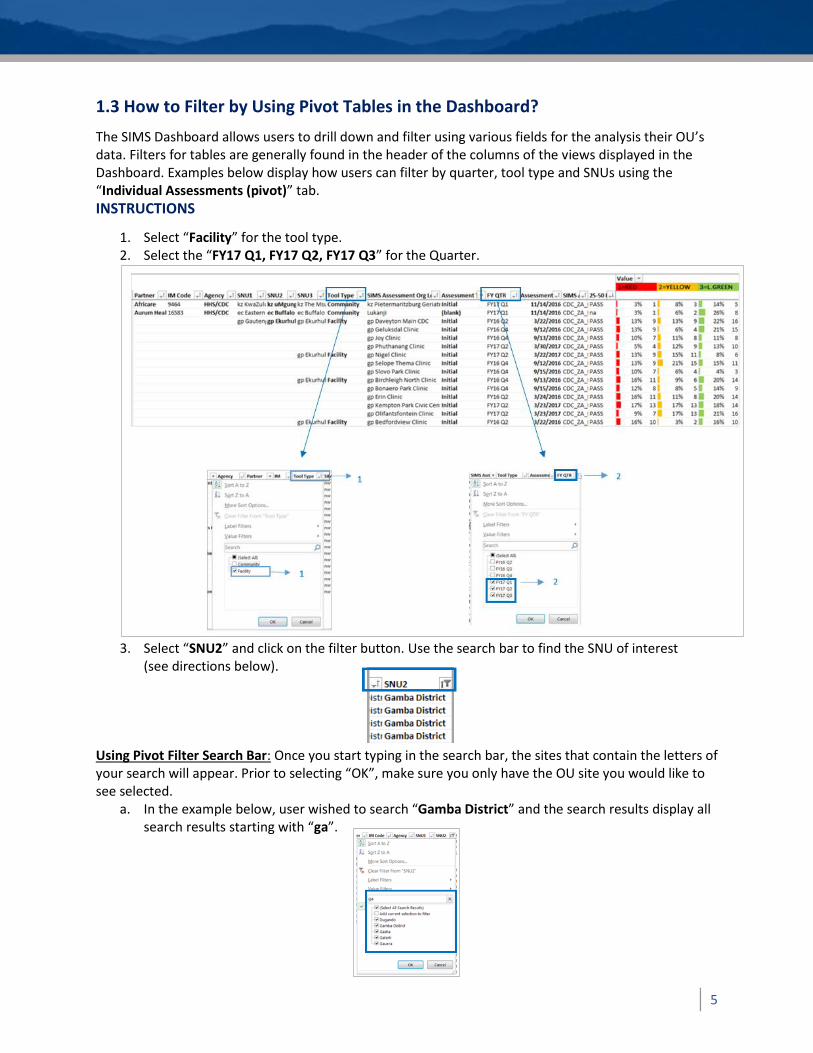
1.3 How to Filter by Using Pivot Tables in the Dashboard?
The SIMS Dashboard allows users to drill down and filter using various fields for the analysis their OU’s data. Filters for tables are generally found in the header of the columns of the views displayed in the Dashboard. Examples below display how users can filter by quarter, tool type and SNUs using the “Individual Assessments (pivot)” tab. INSTRUCTIONS
1. Select “Facility” for the tool type. 2. Select the “FY17 Q1, FY17 Q2, FY17 Q3” for the Quarter.
3. Select “SNU2” and click on the filter button. Use the search bar to find the SNU of interest
(see directions below).
Using Pivot Filter Search Bar: Once you start typing in the search bar, the sites that contain the letters of your search will appear. Prior to selecting “OK”, make sure you only have the OU site you would like to see selected.
a. In the example below, user wished to search “Gamba District” and the search results display all search results starting with “ga”.
6
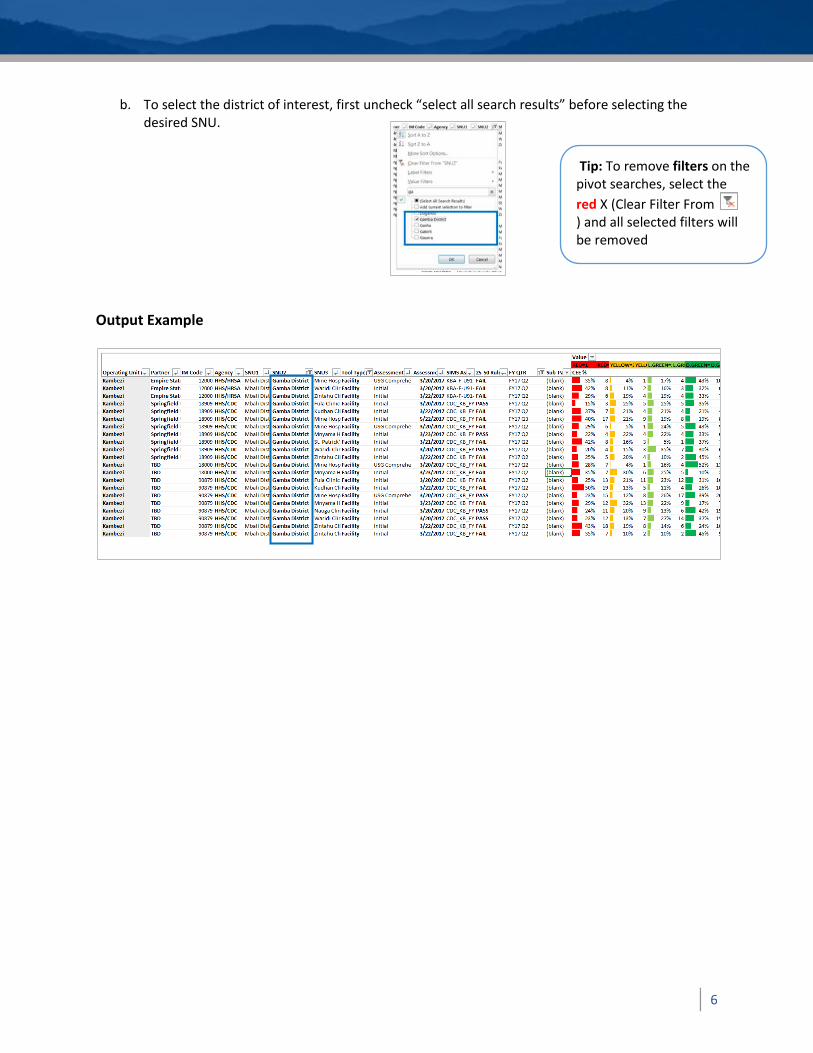
b. To select the district of interest, first uncheck “select all search results” before selecting the desired SNU.
Output Example
Tip: To remove filters on the pivot searches, select the
red X (Clear Filter From ) and all selected filters will be removed
7
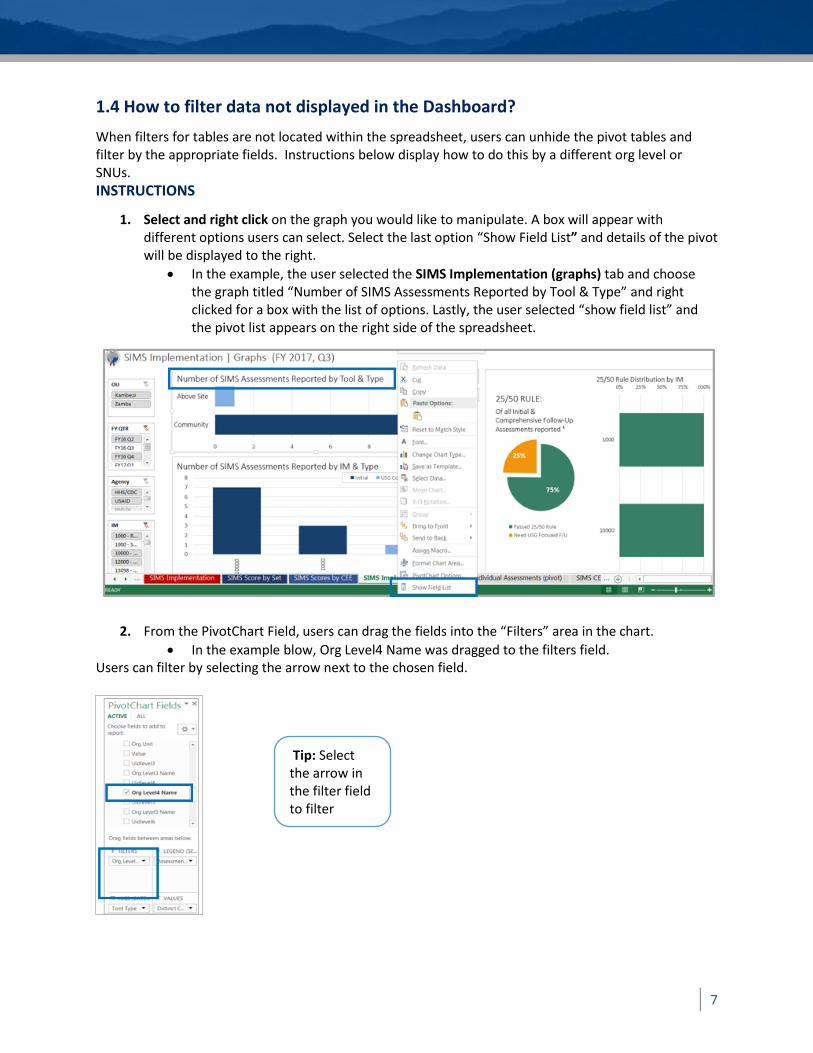
1.4 How to filter data not displayed in the Dashboard?
When filters for tables are not located within the spreadsheet, users can unhide the pivot tables and filter by the appropriate fields. Instructions below display how to do this by a different org level or SNUs. INSTRUCTIONS
1. Select and right click on the graph you would like to manipulate. A box will appear with different options users can select. Select the last option “Show Field List” and details of the pivot will be displayed to the right.
In the example, the user selected the SIMS Implementation (graphs) tab and choose the graph titled “Number of SIMS Assessments Reported by Tool & Type” and right clicked for a box with the list of options. Lastly, the user selected “show field list” and the pivot list appears on the right side of the spreadsheet.
2. From the PivotChart Field, users can drag the fields into the “Filters” area in the chart.
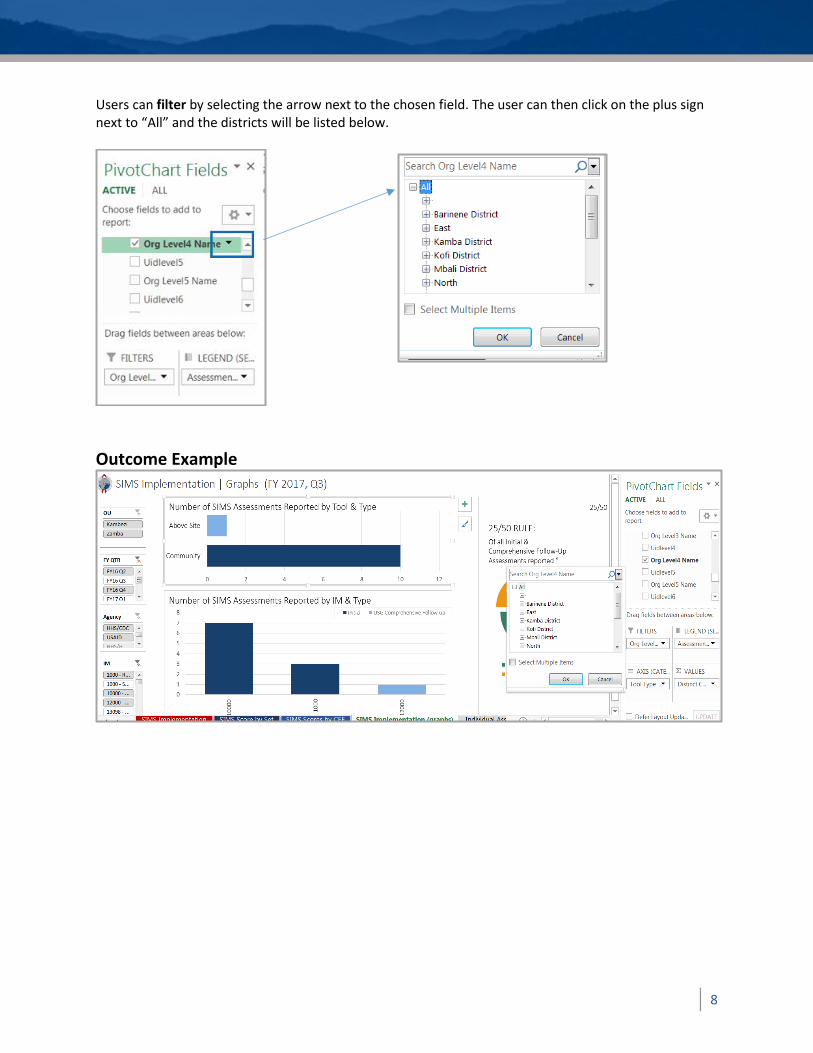
In the example blow, Org Level4 Name was dragged to the filters field. Users can filter by selecting the arrow next to the chosen field.
Tip: Select the arrow in the filter field to filter
8
Users can filter by selecting the arrow next to the chosen field. The user can then click on the plus sign next to “All” and the districts will be listed below.
Outcome Example
9
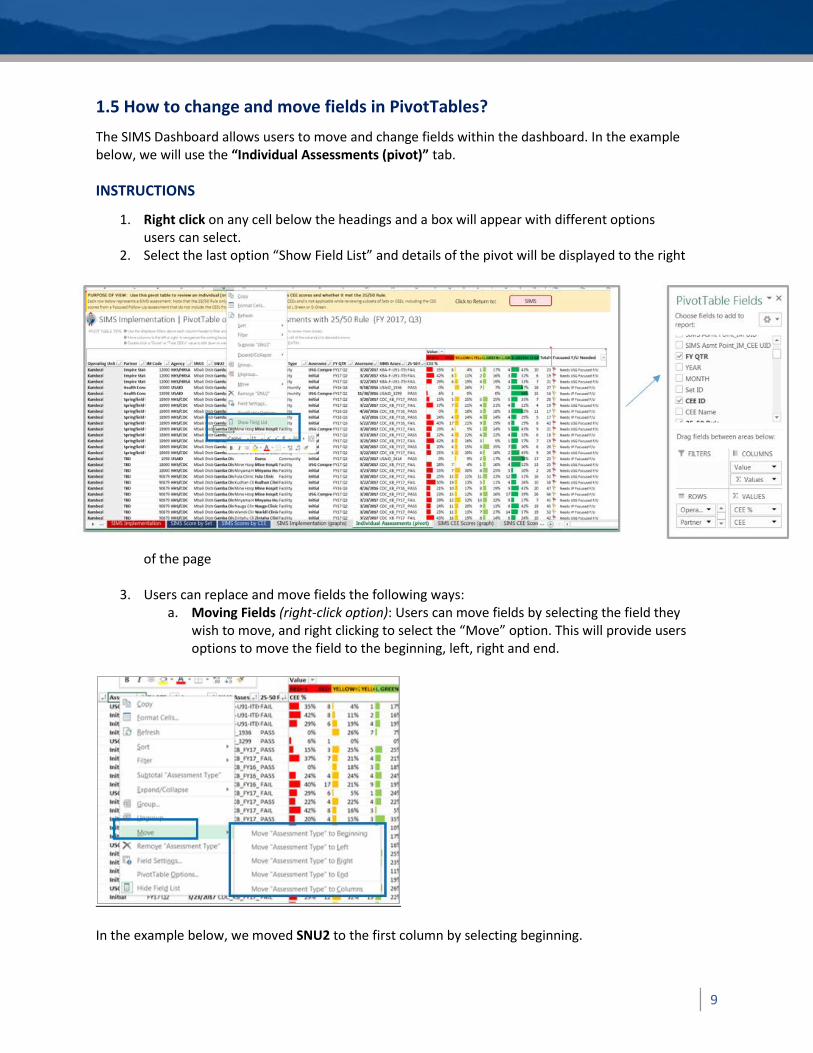
1.5 How to change and move fields in PivotTables?
The SIMS Dashboard allows users to move and change fields within the dashboard. In the example below, we will use the “Individual Assessments (pivot)” tab. INSTRUCTIONS
1. Right click on any cell below the headings and a box will appear with different options users can select.
2. Select the last option “Show Field List” and details of the pivot will be displayed to the right
of the page
3. Users can replace and move fields the following ways: a. Moving Fields (right-click option): Users can move fields by selecting the field they
wish to move, and right clicking to select the “Move” option. This will provide users options to move the field to the beginning, left, right and end.
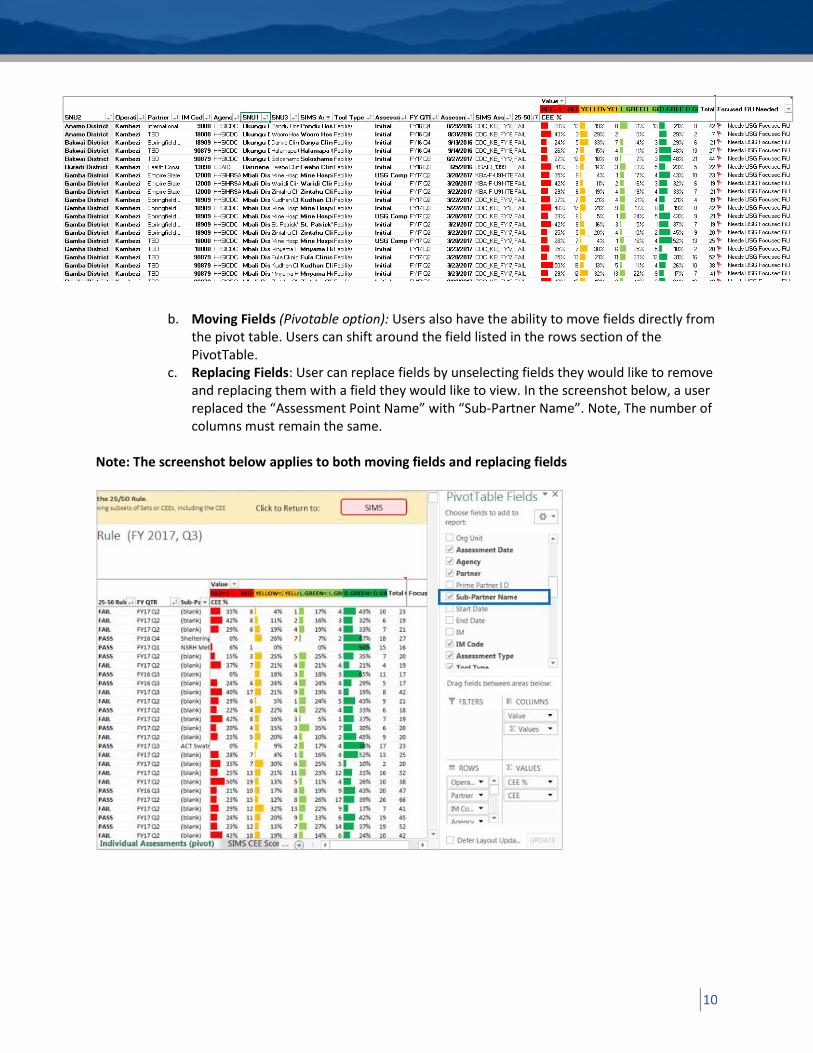
In the example below, we moved SNU2 to the first column by selecting beginning.
10
b. Moving Fields (Pivotable option): Users also have the ability to move fields directly from
the pivot table. Users can shift around the field listed in the rows section of the PivotTable.
c. Replacing Fields: User can replace fields by unselecting fields they would like to remove and replacing them with a field they would like to view. In the screenshot below, a user replaced the “Assessment Point Name” with “Sub-Partner Name”. Note, The number of columns must remain the same.
Note: The screenshot below applies to both moving fields and replacing fields
11
2.0 ANALYSIS OF SIMS ASSESSMENTS
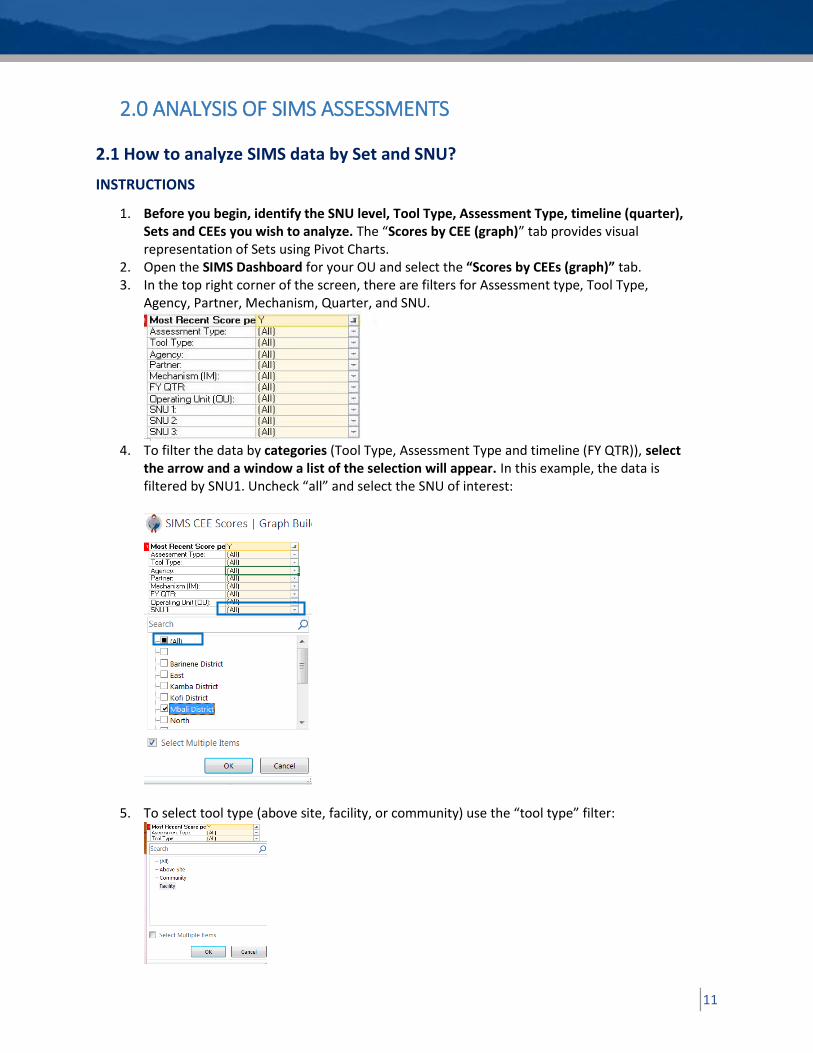
2.1 How to analyze SIMS data by Set and SNU?
INSTRUCTIONS
1. Before you begin, identify the SNU level, Tool Type, Assessment Type, timeline (quarter), Sets and CEEs you wish to analyze. The “Scores by CEE (graph)” tab provides visual representation of Sets using Pivot Charts.
2. Open the SIMS Dashboard for your OU and select the “Scores by CEEs (graph)” tab. 3. In the top right corner of the screen, there are filters for Assessment type, Tool Type,
Agency, Partner, Mechanism, Quarter, and SNU.
4. To filter the data by categories (Tool Type, Assessment Type and timeline (FY QTR)), select
the arrow and a window a list of the selection will appear. In this example, the data is filtered by SNU1. Uncheck “all” and select the SNU of interest:
5. To select tool type (above site, facility, or community) use the “tool type” filter:
12
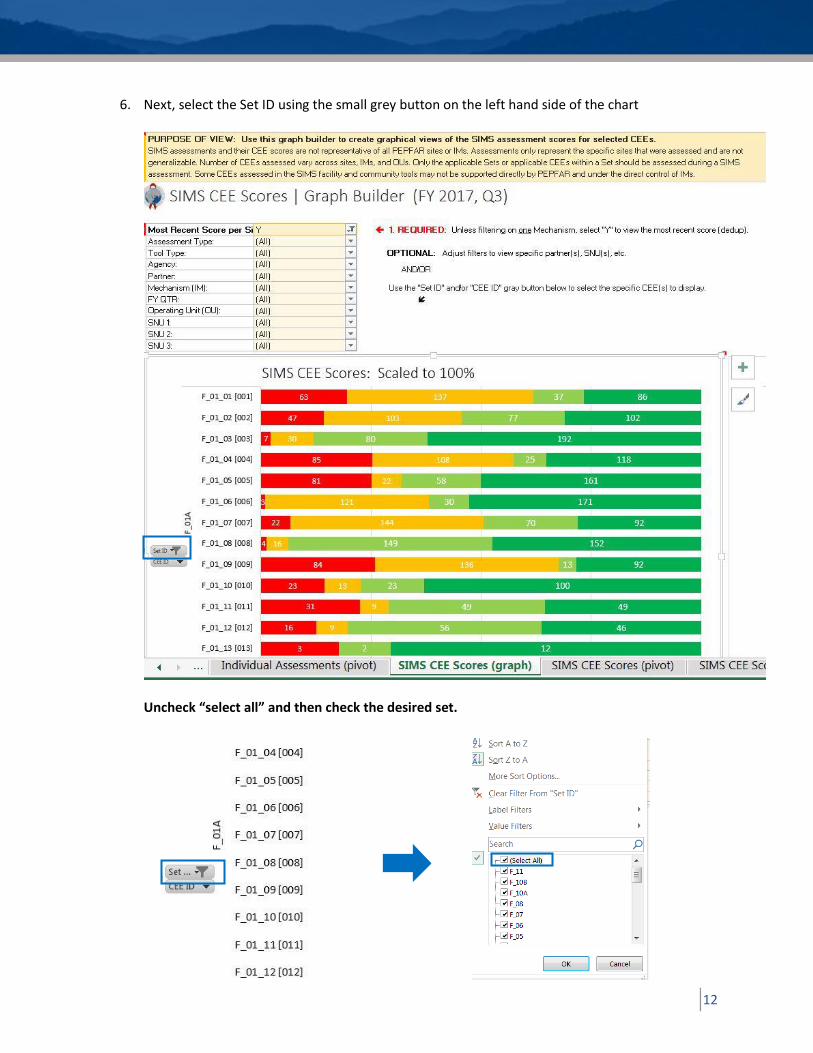
6. Next, select the Set ID using the small grey button on the left hand side of the chart
Uncheck “select all” and then check the desired set.
13
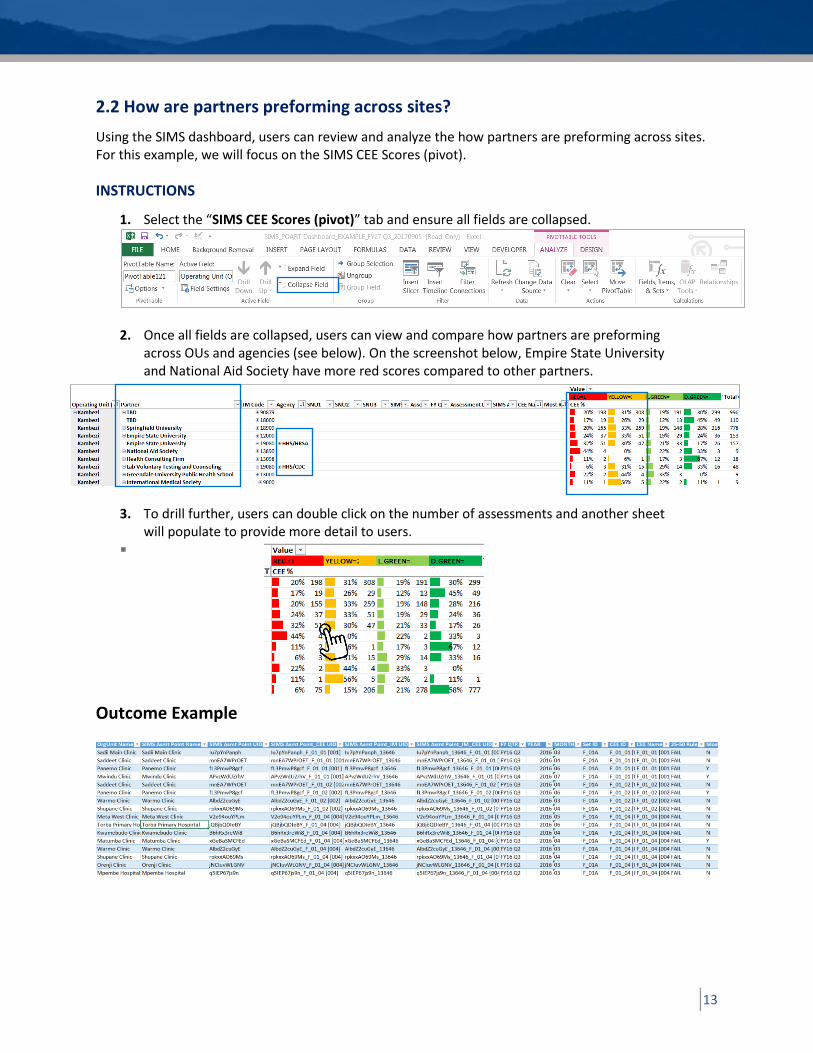
2.2 How are partners preforming across sites?
Using the SIMS dashboard, users can review and analyze the how partners are preforming across sites. For this example, we will focus on the SIMS CEE Scores (pivot). INSTRUCTIONS
1. Select the “SIMS CEE Scores (pivot)” tab and ensure all fields are collapsed.
2. Once all fields are collapsed, users can view and compare how partners are preforming across OUs and agencies (see below). On the screenshot below, Empire State University and National Aid Society have more red scores compared to other partners.
3. To drill further, users can double click on the number of assessments and another sheet
will populate to provide more detail to users.
Outcome Example
14
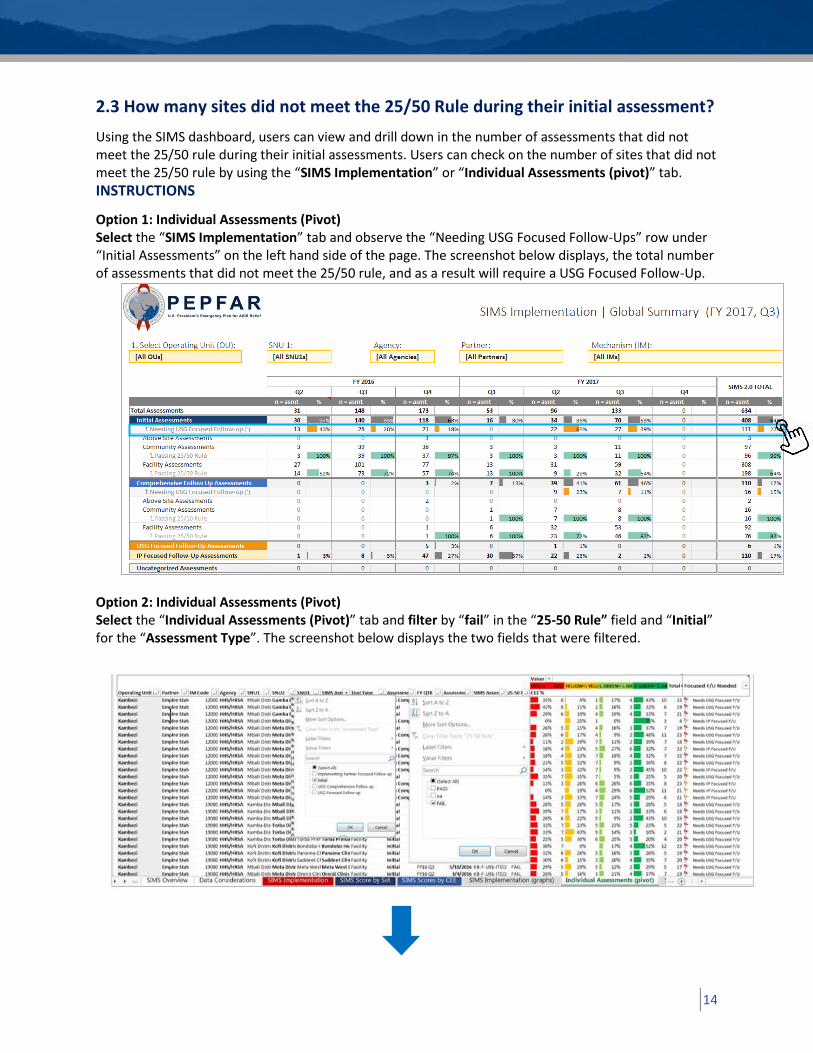
2.3 How many sites did not meet the 25/50 Rule during their initial assessment?
Using the SIMS dashboard, users can view and drill down in the number of assessments that did not meet the 25/50 rule during their initial assessments. Users can check on the number of sites that did not meet the 25/50 rule by using the “SIMS Implementation” or “Individual Assessments (pivot)” tab. INSTRUCTIONS
Option 1: Individual Assessments (Pivot) Select the “SIMS Implementation” tab and observe the “Needing USG Focused Follow-Ups” row under “Initial Assessments” on the left hand side of the page. The screenshot below displays, the total number of assessments that did not meet the 25/50 rule, and as a result will require a USG Focused Follow-Up.
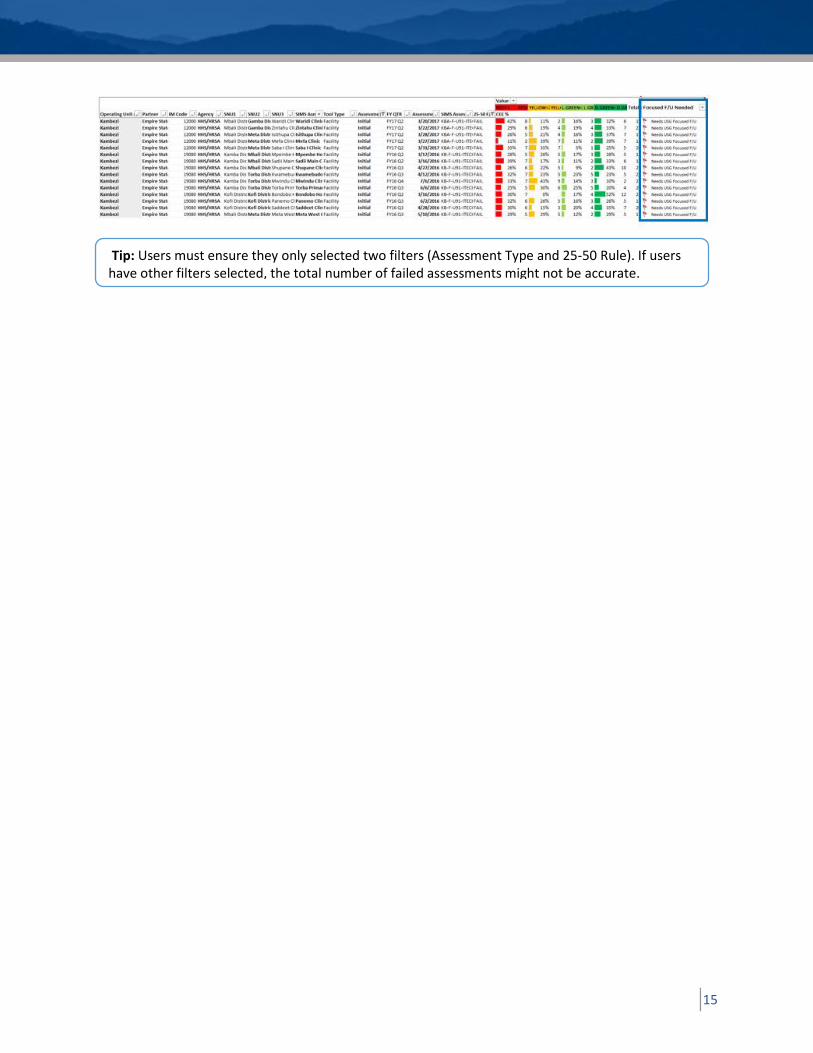
Option 2: Individual Assessments (Pivot) Select the “Individual Assessments (Pivot)” tab and filter by “fail” in the “25-50 Rule” field and “Initial” for the “Assessment Type”. The screenshot below displays the two fields that were filtered.
15
Tip: Users must ensure they only selected two filters (Assessment Type and 25-50 Rule). If users have other filters selected, the total number of failed assessments might not be accurate.
16
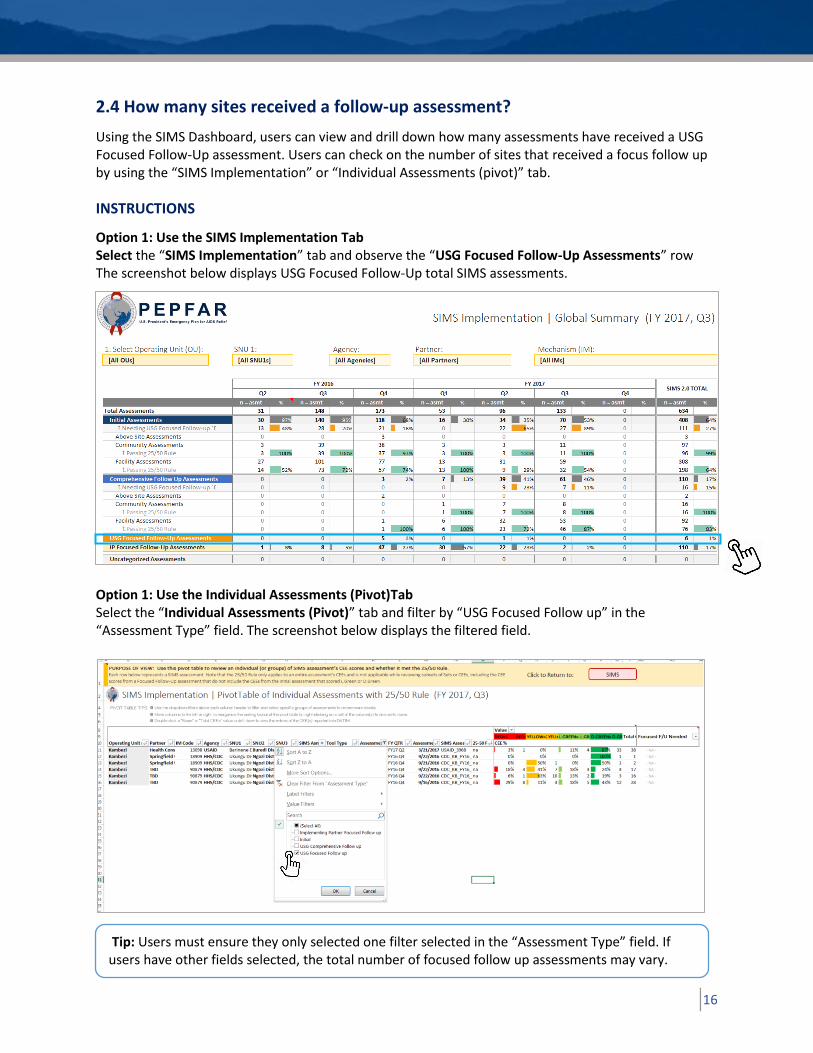
2.4 How many sites received a follow-up assessment?
Using the SIMS Dashboard, users can view and drill down how many assessments have received a USG Focused Follow-Up assessment. Users can check on the number of sites that received a focus follow up by using the “SIMS Implementation” or “Individual Assessments (pivot)” tab. INSTRUCTIONS
Option 1: Use the SIMS Implementation Tab Select the “SIMS Implementation” tab and observe the “USG Focused Follow-Up Assessments” row The screenshot below displays USG Focused Follow-Up total SIMS assessments.
Option 1: Use the Individual Assessments (Pivot)Tab Select the “Individual Assessments (Pivot)” tab and filter by “USG Focused Follow up” in the “Assessment Type” field. The screenshot below displays the filtered field.
Tip: Users must ensure they only selected one filter selected in the “Assessment Type” field. If users have other fields selected, the total number of focused follow up assessments may vary.
17
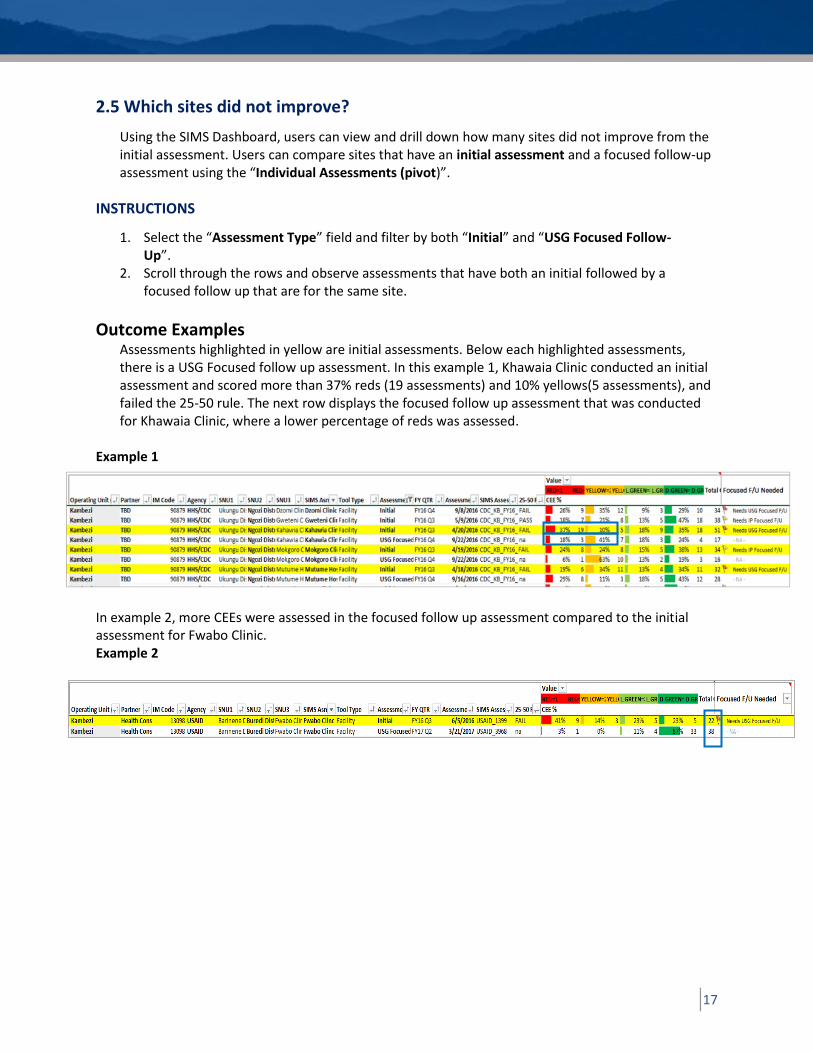
2.5 Which sites did not improve?
Using the SIMS Dashboard, users can view and drill down how many sites did not improve from the initial assessment. Users can compare sites that have an initial assessment and a focused follow-up assessment using the “Individual Assessments (pivot)”.
INSTRUCTIONS
1. Select the “Assessment Type” field and filter by both “Initial” and “USG Focused Follow-Up”.
2. Scroll through the rows and observe assessments that have both an initial followed by a focused follow up that are for the same site.
Outcome Examples Assessments highlighted in yellow are initial assessments. Below each highlighted assessments, there is a USG Focused follow up assessment. In this example 1, Khawaia Clinic conducted an initial assessment and scored more than 37% reds (19 assessments) and 10% yellows(5 assessments), and failed the 25-50 rule. The next row displays the focused follow up assessment that was conducted for Khawaia Clinic, where a lower percentage of reds was assessed.
Example 1
In example 2, more CEEs were assessed in the focused follow up assessment compared to the initial assessment for Fwabo Clinic. Example 2
18
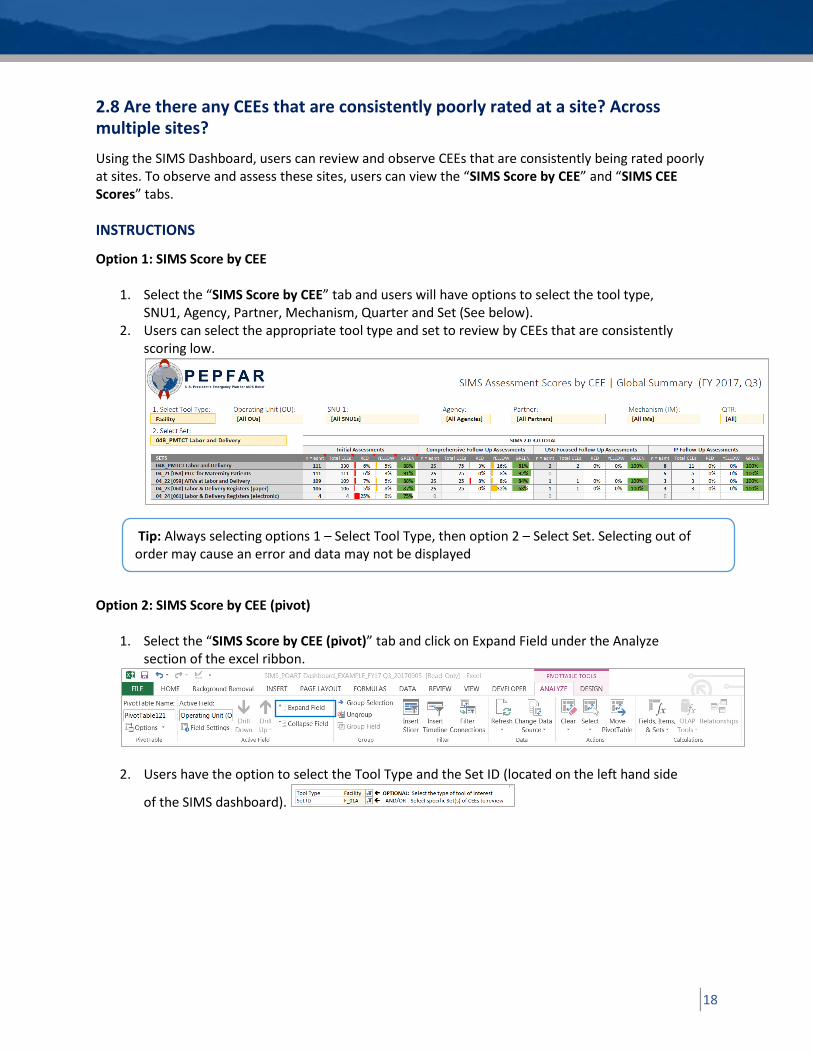
2.8 Are there any CEEs that are consistently poorly rated at a site? Across multiple sites?
Using the SIMS Dashboard, users can review and observe CEEs that are consistently being rated poorly at sites. To observe and assess these sites, users can view the “SIMS Score by CEE” and “SIMS CEE Scores” tabs.
INSTRUCTIONS
Option 1: SIMS Score by CEE
1. Select the “SIMS Score by CEE” tab and users will have options to select the tool type, SNU1, Agency, Partner, Mechanism, Quarter and Set (See below).
2. Users can select the appropriate tool type and set to review by CEEs that are consistently scoring low.
Option 2: SIMS Score by CEE (pivot)
1. Select the “SIMS Score by CEE (pivot)” tab and click on Expand Field under the Analyze
section of the excel ribbon.
2. Users have the option to select the Tool Type and the Set ID (located on the left hand side
of the SIMS dashboard).
Tip: Always selecting options 1 – Select Tool Type, then option 2 – Select Set. Selecting out of order may cause an error and data may not be displayed
19
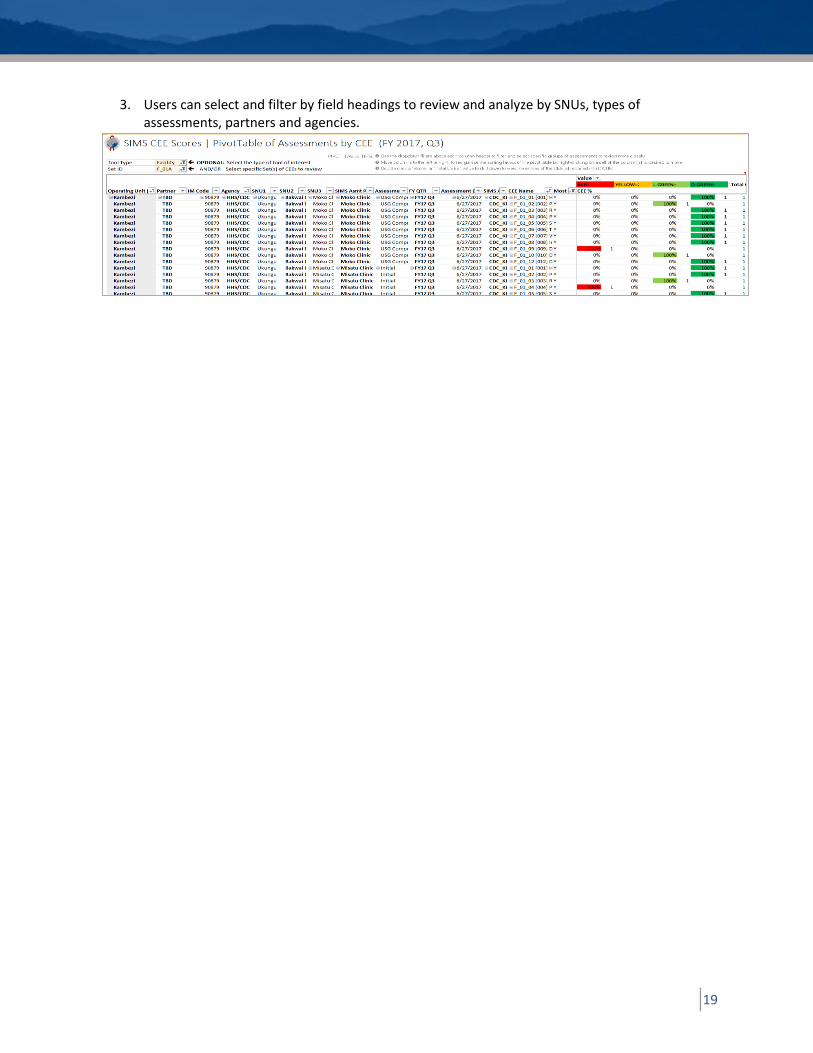
3. Users can select and filter by field headings to review and analyze by SNUs, types of assessments, partners and agencies.
20
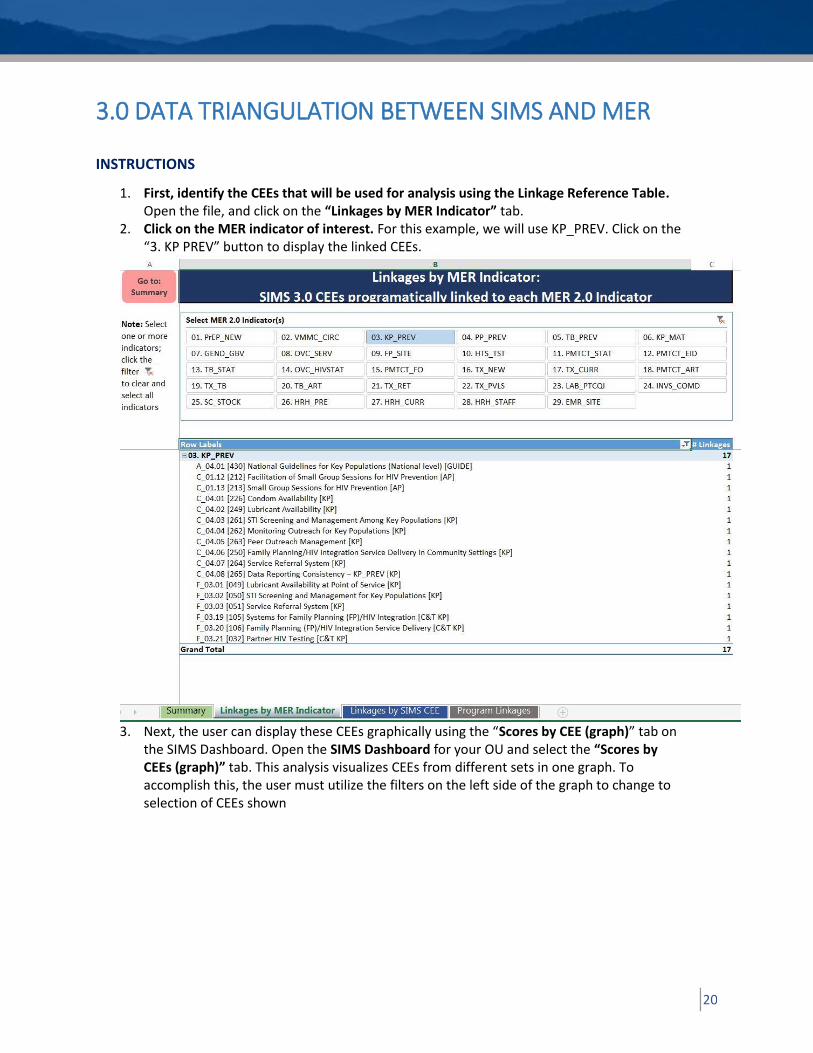
3.0 DATA TRIANGULATION BETWEEN SIMS AND MER
INSTRUCTIONS
1. First, identify the CEEs that will be used for analysis using the Linkage Reference Table. Open the file, and click on the “Linkages by MER Indicator” tab.
2. Click on the MER indicator of interest. For this example, we will use KP_PREV. Click on the “3. KP PREV” button to display the linked CEEs.
3. Next, the user can display these CEEs graphically using the “Scores by CEE (graph)” tab on
the SIMS Dashboard. Open the SIMS Dashboard for your OU and select the “Scores by CEEs (graph)” tab. This analysis visualizes CEEs from different sets in one graph. To accomplish this, the user must utilize the filters on the left side of the graph to change to selection of CEEs shown
21
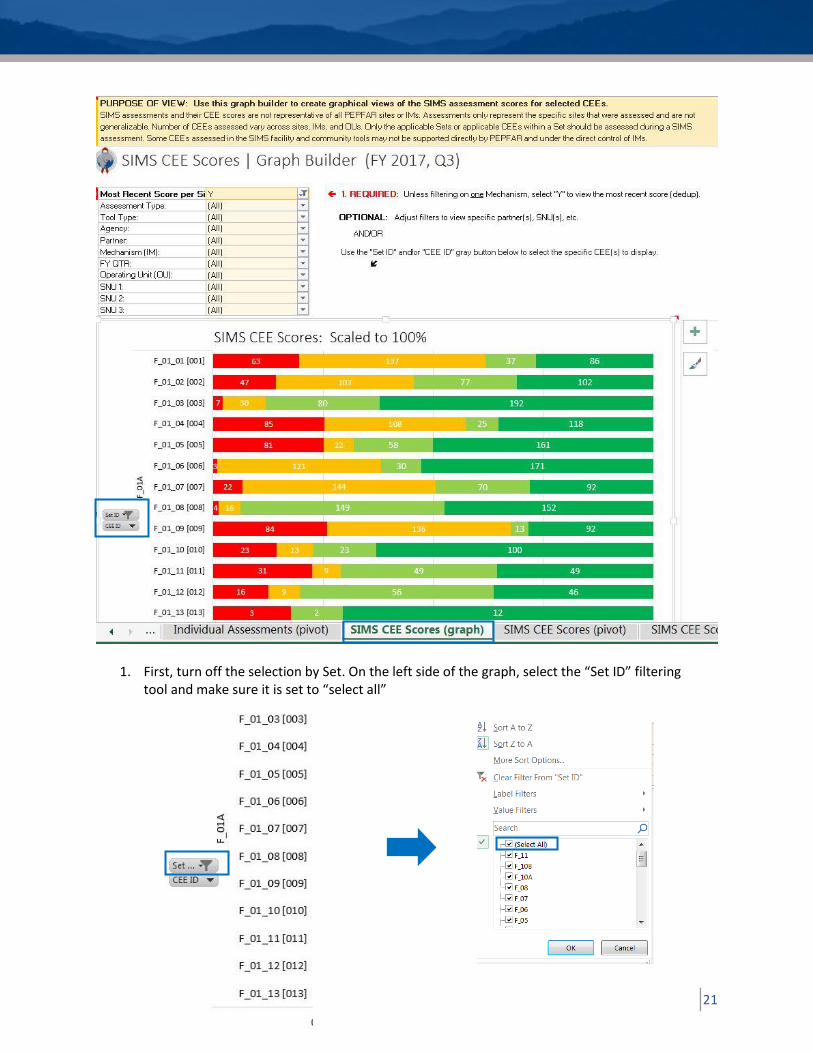
1. First, turn off the selection by Set. On the left side of the graph, select the “Set ID” filtering tool and make sure it is set to “select all”
22
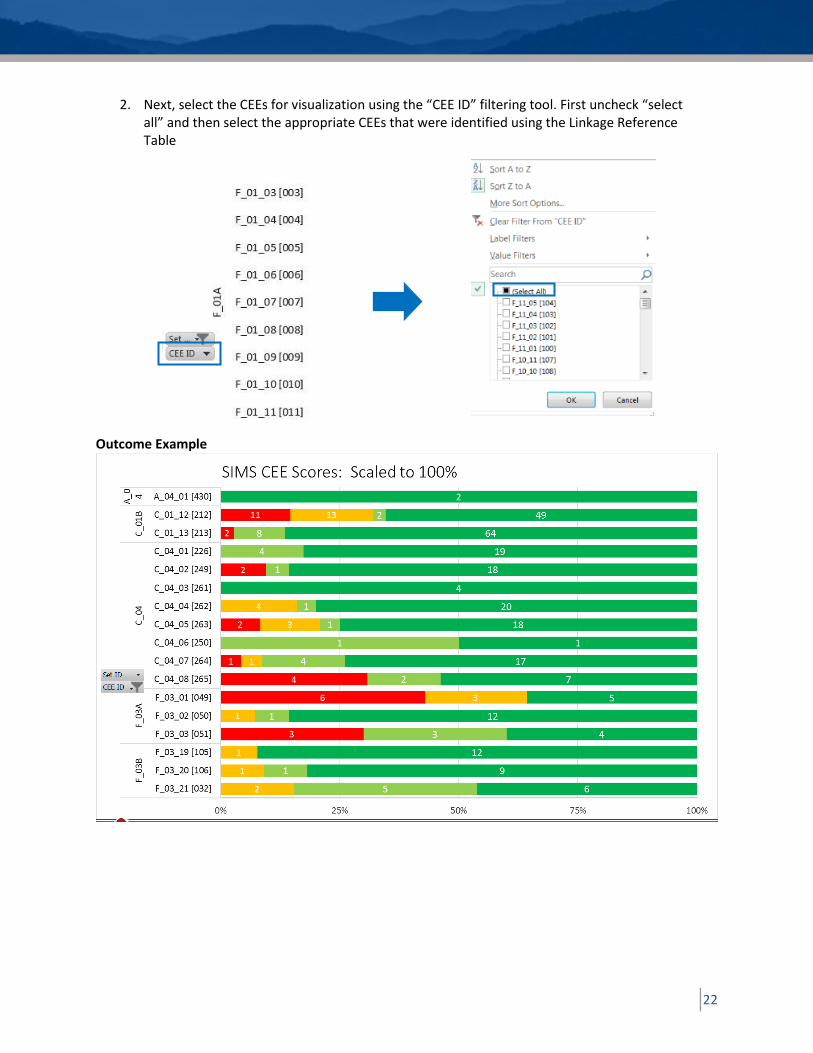
2. Next, select the CEEs for visualization using the “CEE ID” filtering tool. First uncheck “select all” and then select the appropriate CEEs that were identified using the Linkage Reference Table
Outcome Example