1 SIMS 247: Information Visualization and Presentation Marti Hearst Feb 18, 2004.
date post
19-Dec-2015Category
view
218download
3
SIMS 247SIMS 247Information Visualization Information Visualization
and Presentation and Presentation
Prof. Marti HearstProf. Marti Hearst
September 14, 2000September 14, 2000
Schedule for Next Few WeeksSchedule for Next Few Weeks• TodayToday
– Critique assignment assigned– Visualization as Rearranging
• Sept 19Sept 19– Matt Ward on multi-attribute visualization, Xmdv tools
• Sept 21 Sept 21 – Al Inselberg on parallel coordinates– EDA assignment assigned (2 weeks to do it)
• Sept 26Sept 26– Text visualization lecture
• Sept 28Sept 28– Anna Wichansky on database visualization
• Oct 3Oct 3– Warren Sack on visualizing conversations; Rachna Dhamija on
visualization for security

Visual IllusionsVisual Illusions
• People don’t perceive length, area, angle, brightness they way they “should”.
• Some illusions have been reclassified as systematic perceptual errors– e.g., brightness contrasts (grey square on
white background vs. on black background)– partly due to increase in our understanding of
the relevant parts of the visual system
• Nevertheless, the visual system does some really unexpected things.

Illusions of Linear ExtentIllusions of Linear Extent
• Mueller-Lyon (off by 25-30%)Mueller-Lyon (off by 25-30%)
• Horizontal-VerticalHorizontal-Vertical
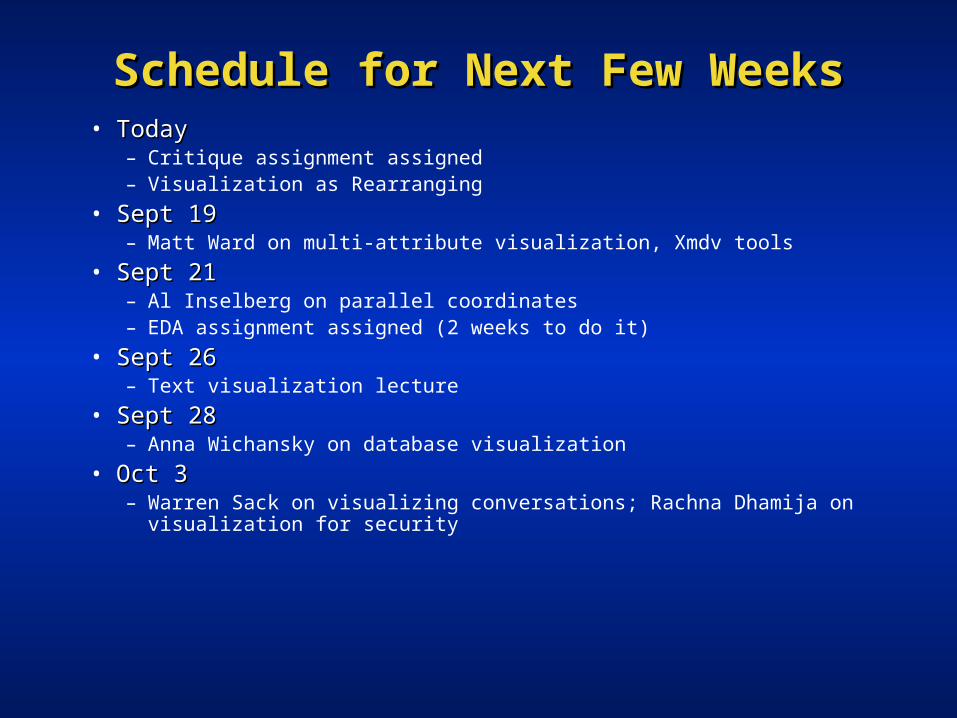
Illusions of AreaIllusions of Area
• Delboeuf IllusionDelboeuf Illusion
• Height of 4-story building overestimated Height of 4-story building overestimated by approximately 25%by approximately 25%

What are good guidelines for Infoviz?What are good guidelines for Infoviz?
• Use graphics appropriatelyUse graphics appropriately– Don’t use images gratuitously– Don’t lie with graphics!
• Link to original data
– Don’t conflate area with other information • E.g., use area in map to imply amount
• Make it interactive (feedback)Make it interactive (feedback)– Brushing and linking– Multiple views– Overview + details
• Match mental modelsMatch mental models

Rearranging TechniquesRearranging Techniques
• Ask what-if questions spontaneously Ask what-if questions spontaneously while working through a problemwhile working through a problem
• Control the exploration of subsets of Control the exploration of subsets of data from different viewpointsdata from different viewpoints
(Following slides from (Following slides from Information Information VisualizationVisualization by Robert Spence) by Robert Spence)
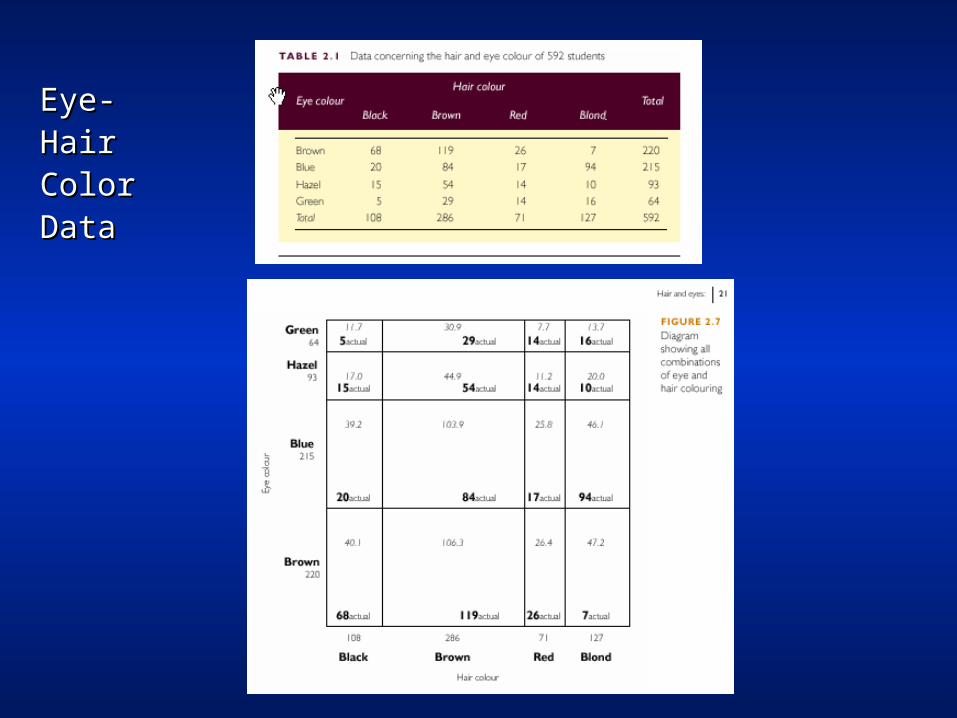
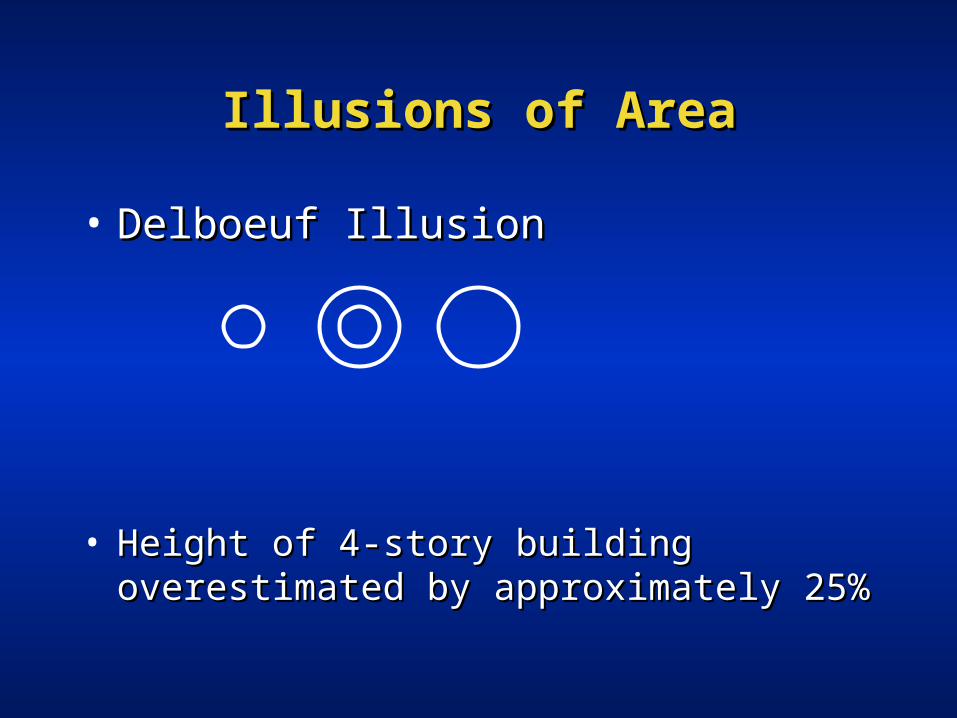
Eye-Eye-Hair Hair Color Color DataData

Eye-Eye-Hair Hair Color Color DataData

Eye-Eye-Hair Hair Color Color DataData

Eye-Eye-Hair Hair Color Color DataData

TitanicTitanicDataData

TableLensTableLens
• Visualizing a very large Visualizing a very large spreadsheetspreadsheet
• Dynamic rearrangement allows for Dynamic rearrangement allows for insightsinsights
• Nice use of focus+contextNice use of focus+context• (watch video)(watch video)

Brushing and LinkingBrushing and Linking
• More interactive techniquesMore interactive techniques– Highlighting– Brushing and Linking
• Example systemsExample systems– Graham Will’s EDV system– Ahlberg & Sheiderman’s IVEE
(Spotfire)

BrushingBrushing
• An interactive techniqueAn interactive technique– select a subset of points– see the role played by this subset of
points in one or more other views
• At least two things must be At least two things must be linkedlinked together to allow for brushingtogether to allow for brushing

Highlighting (Focusing)Highlighting (Focusing)Focus user attention on a subset of Focus user attention on a subset of the data within one graph the data within one graph (from Wills (from Wills 95)95)
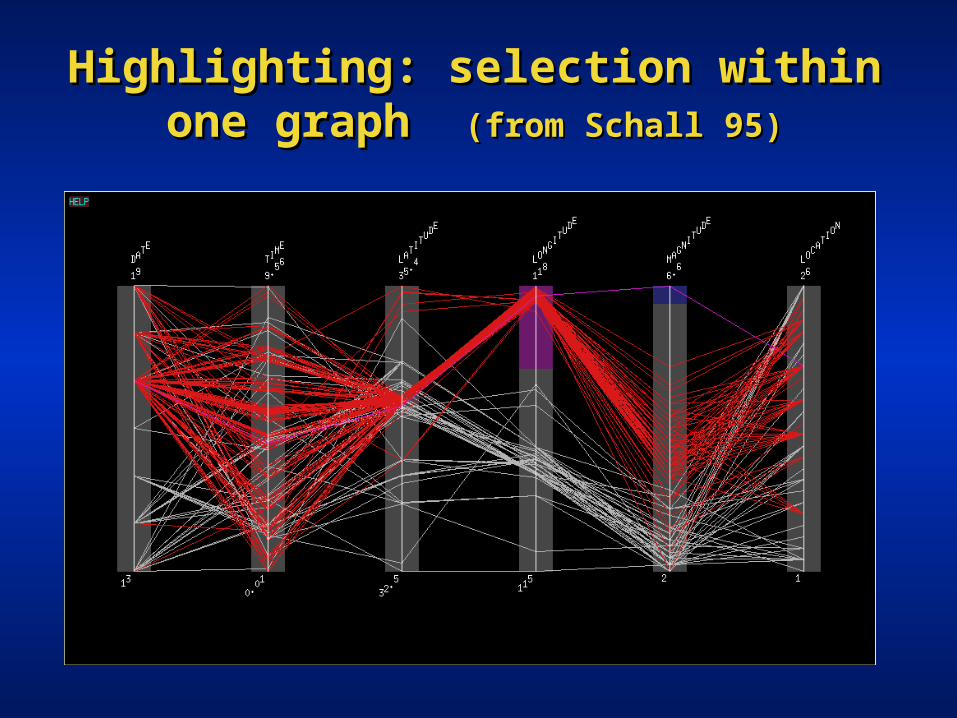
Highlighting: selection within one graph Highlighting: selection within one graph (from Schall 95)(from Schall 95)

Link similar types of graphs:Link similar types of graphs:Brushing a Scatterplot MatrixBrushing a Scatterplot Matrix
(Figure from Tweedie et al. 96; (Figure from Tweedie et al. 96; See also Cleveland & McGill 84, 88)See also Cleveland & McGill 84, 88)

Link different types of graphs:Link different types of graphs:Scatterplots and histograms and bars Scatterplots and histograms and bars
(from Wills 95)(from Wills 95)

Baseball data:Baseball data:Scatterplots and histograms and barsScatterplots and histograms and bars
(from Wills 95)(from Wills 95)
select highsalaries
avg careerHRs vs avg career hits(batting ability)
avg assists vsavg putouts (fielding ability)
how longin majors
distributionof positionsplayed

What was learned from interaction What was learned from interaction with this baseball data?with this baseball data?
– Seems impossible to earn a high salary in the first three years
– High salaried players have a bimodal distribution (peaking around 7 & 13 yrs)
– Hits/Year a better indicator of salary than HR/Year
– High paid outlier with low HR and medium hits/year. Reason: person is player-coach
– There seem to be two differentiated groups in the put-outs/assists category (but not correlated with salary) Why?

Linking types of assist behavior to Linking types of assist behavior to position played position played (from Wills 95)(from Wills 95)