Simple and Sensitive High Performance Liquid ... · Simple and Sensitive High Performance Liquid...
15
Iranian Journal of Pharmaceutical Sciences 2016: 12 (2): 21-32 www.ijps.ir Original Article Simple and Sensitive High Performance Liquid Chromatographic (HPLC) Method for the Determination of the Apigenin from Dried Powder of Cosmos Bipinnatus, Apium Graveolens and Petroselinum Crispum Ali Sharafi a, b , Hamidreza Kheiri-Manjili b , Soroush Bijani a , Alireza Ahmadnia a , Hossein Danafar c, d* a Zanjan Pharmaceutical Research Center, School of Pharmacy, Zanjan University of Medical Sciences, Zanjan, Iran b Pharmaceutical Biotechnology Department, Zanjan University of Medical Sciences, Zanjan, Iran c Zanjan Pharmaceutical Nanotechnology Research Center, Zanjan University of Medical Sciences, Zanjan, Iran d Department of Medicinal Chemistry, School of Pharmacy, Zanjan University of Medical Sciences, Postal code 45139-56184, Zanjan, Iran Abstract Apigenin is best known as an irreversible inhibitor of monoamine oxidase (MAO), an intracellular enzyme associated with the outer membrane of mitochondria. The purpose of this study is to establish a reliable and quick method for the assignment of apigenin in Cosmos bipinnatus, Apium graveolens, and Petroselinum crispum by HPLC. A rapid and sensitive HPLC method has been developed for determination of apigenin. Mobile phase was composed water-acetonitrile (55:45 v/v) with a flow rate of 1 ml/min and the eluted peaks were detected by a UV detector set at wavelength of 340 nm. The method was validated in the range of apigenin concentrations from 0.01 to 500 μg/ml and the limits of detection (LOD) and quantitation (LOQ) of the method were 0.005 and 0.01 μg/ml, respectively. The average recovery throughout the linear concentration range was 97.28 percent and the averages for within-run and between-run accuracy values were 99.32 and 96.79 respectively. The method is quick, simple, sensitive, and precise for the screen, assignment, and evaluation of apigenin in plants by HPLC. Keywords: Apigenin, HPLC, Cosmos bipinnatus, Apium graveolens and Petroselinum crispum
-
Upload
truongkhue -
Category
Documents
-
view
229 -
download
1
Transcript of Simple and Sensitive High Performance Liquid ... · Simple and Sensitive High Performance Liquid...

Iranian Journal of Pharmaceutical Sciences 2016: 12 (2): 21-32
www.ijps.ir
Original Article
Simple and Sensitive High Performance Liquid Chromatographic (HPLC)
Method for the Determination of the Apigenin from Dried Powder of
Cosmos Bipinnatus, Apium Graveolens and Petroselinum Crispum
Ali Sharafia, b, Hamidreza Kheiri-Manjilib, Soroush Bijania, Alireza Ahmadniaa, Hossein Danafarc, d*
a Zanjan Pharmaceutical Research Center, School of Pharmacy, Zanjan University of Medical
Sciences, Zanjan, Iran
b Pharmaceutical Biotechnology Department, Zanjan University of Medical Sciences, Zanjan, Iran
c Zanjan Pharmaceutical Nanotechnology Research Center, Zanjan University of Medical Sciences,
Zanjan, Iran
d Department of Medicinal Chemistry, School of Pharmacy, Zanjan University of Medical Sciences,
Postal code 45139-56184, Zanjan, Iran
Abstract
Apigenin is best known as an irreversible inhibitor of monoamine oxidase (MAO), an intracellular
enzyme associated with the outer membrane of mitochondria. The purpose of this study is to establish a
reliable and quick method for the assignment of apigenin in Cosmos bipinnatus, Apium graveolens, and
Petroselinum crispum by HPLC. A rapid and sensitive HPLC method has been developed for
determination of apigenin. Mobile phase was composed water-acetonitrile (55:45 v/v) with a flow rate of 1
ml/min and the eluted peaks were detected by a UV detector set at wavelength of 340 nm. The method was
validated in the range of apigenin concentrations from 0.01 to 500 µg/ml and the limits of detection (LOD) and
quantitation (LOQ) of the method were 0.005 and 0.01 µg/ml, respectively. The average recovery throughout
the linear concentration range was 97.28 percent and the averages for within-run and between-run accuracy
values were 99.32 and 96.79 respectively. The method is quick, simple, sensitive, and precise for the screen,
assignment, and evaluation of apigenin in plants by HPLC.
Keywords: Apigenin, HPLC, Cosmos bipinnatus, Apium graveolens and Petroselinum crispum

Sharifi A, et al / IJPS 2016; 12 (2):21-32
20
1. Introduction
Natural plant compounds are used in
treating various diseases [1-5]. Apigenin
[figure 1] is a 4, 5, 7 trihydroxy flavone,
belonging to a less toxic and non-mutagenic
flavones subclass of flavonoids. It is derived
from the Cosmos bipinnatus and many other
plants. It has a variety of pharmacological
activities, including antioxidant [6], anti-tumor
[7], anti-inflammatory [8], ant-bacterial [9]
anti-proliferative, [10] oxygenase inhibitor
[11], and induced apoptosis[12]. The monomer
apigenin is fit in to a pharmacophore model for
ligands binding to the GABAA receptor
benzodiazepine site [13]. It also act as
inhibitors of IL-4synthesis and CD40 ligand
expression by basophils[14]. It has protective
effect on radiation-induced chromosomal
damage in human lymphocytes [15-17].
Apigenin is one of the very important
secondary metabolite produced by C.
bipinnatus. C. bipinnatus has been used in a
traditional herbal remedy for various diseases
such as jaundice, intermittent fever, and anti-
inflammatory activity [18, 19] reported
antioxidative and antigenotoxic activity of
extracts from C. bipinnatus. They suggested
that it has significant antioxidant activity and
protective effect against oxidative DNA
damage [20]. The chemical composition of
essential oils of C. bipinnatus and its
antibacterial activity have been revealed [21].
Suggested that the hepatoprotective activity of
apigenin is due to its antioxidant properties,
acting as scavengers reported that a
sesquiterpene lactone isolated from the roots
of C. bipinnatus demonstrates an anti-
inflammatory effect [22]. It exhibits anti-
mutagenic, anti-inflammatory, antiviral, and
purgative effects [22, 23] reporting that it can
be a very useful anticancer apigenin candidate
for chemotherapy and cancer prevention [24]
[25]. In another study, Anti-proliferative
effects of apigenin on human breast cancer cell
lines have been demonstrated. It strongly
inhibited tumor cell invasion in estrogen-
insensitive breast tumor cell line [26],
reporting that apigenin inhibited the growth of
human cervical carcinoma HeLa cells through
an apoptotic pathway. HPLC methods for the
detection of apigenin from rat apigenin and
mouse tissues have been reported in literature
[27, 28]. Also, reverse phase HPLC method
for the determination and quantitation of
apigenin in human urine after oral
administration of tablet of Chrysanthemum
moriflum extract [29] and simultaneous
determination of apigenin with other
flavonoids from alcoholic extract of Pigeonpea
[Cajanuscajan(L.) Millsp.] leaves are reported
in literature [30]. The determination and
quantitation of apigenin from dried root
powder of Gmelina arborea L. has been
Corresponding Author: Hossein Danafar, Zanjan
Pharmaceutical Nanotechnology Research Center,
Zanjan University of Medical Sciences, Department of
Medicinal Chemistry, School of Pharmacy, Zanjan
University of Medical Sciences, Zanjan, Iran
Tel: +98-24-3347-3638
E-Mail: [email protected]
Cite this article as: Sharifi A, Kheiri-Manjili H, Bijani S, Ahmadnia A, Danafar H, Simple and Sensitive High
Performance Liquid Chromatographic (HPLC) Method
for the Determination of the Apigenin from Dried
Powder of Cosmos Bipinnatus, Apium Graveolens and
Petroselinum Crispum.Iranian Journal of Pharmaceutical
Sciences, 2016, 12 (2): 21-32.
Determination of Apigenin in dried powder of plants
20
reported. In the present study, we describe a
simple, selective, and stable method using high
performance liquid chromatography (HPLC)
for the determination of apigenin in Cosmos
bipinnatus, Apium graveolens, and
Petroselinum crispum.
2. Materials and Methods
2.1. Materials
Apigenin standard (99.9% purity) was
provided from Sigma- Aldrich (Aldrich
Division; Steinheim, Germany) company.
Cosmos bipinnatus, Apium graveolens, and
Petroselinum crispum were collected from
herbarium of Zanjan University of Medical
Sciences.
2.2. Instrument and HPLC Method
The HPLC system to include of pump
(WATER, USA), wavelength UV detector
(WATER, model Breeze), USA) used at a
wavelength of 340 nm with the outputs to
record and analyze using with a software
(Breeze, USA). The apigenin analization was
performed using a C8 analytical column (250
mm*4.6mm, particle size 5µm; Perfectsill,
MZ-Analysentechnik, Germany) equipped by
a guard column of the same packing. The
mobile phase composed of water-acetonitrile
(55:45 v/v) with a flow rate of 1 ml/min.
Sample injection to system (20µl) was made
by a loop injector (Rheodyne7725i, Cotati,
CA, USA).
2.3. Plant Material
Cosmos bipinnatus, Apium graveolens, and
Petroselinum crispum were collected as wild
plant, from Zanjan, Iran. A herbarium plants
were prepared in duplicate and was
authenticated from school of pharmacy,
Zanjan University. The plant material was
thoroughly washed to remove dust particles.
The plant was separated and then air dried.
Immediately after drying, plants were
powdered using an electric mixer-grinder and
sieved through a BSS mesh no. 85 sieve. The
sieved powder was used for the present
research work.
2.4. Preparation of Stock Solutions and
Working Solutions
Stock solutions of apigenin was prepared in
HPLC grade methanol at concentrations of
1mg/ml and were stored at 4 ◦C. Working
solutions of apigenin were prepared daily in
HPLC grade methanol by appropriate dilution
at 0.01, 0.1, 5.0, 12.5, , 25.0, 50.0, 100, and
500µg/ml and an aliquot of 20 µl was injected
into the HPLC system.
2.5. Preparation of sample solution
2.5.1. Extraction and Isolation
The 8.45 g of Cosmos bipinnatus were
washed well to remove the dust, dried at room
O
OOH
HO
OH
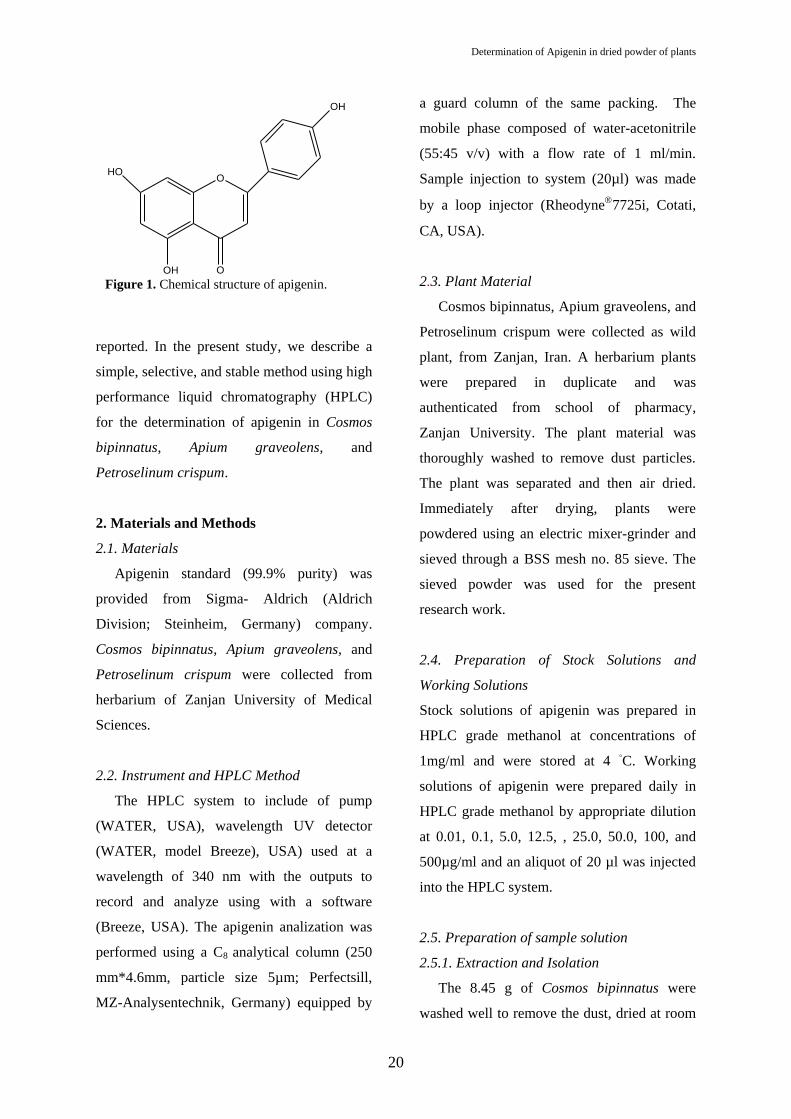
Figure 1. Chemical structure of apigenin.

Sharifi A, et al / IJPS 2016; 12 (2):21-32
21
temperature and were extracted with 1000 ml
ethanol. The above procedures were repeated
three times and the extracts obtained from
extractions were combined. The extracts were
filtered and allowed to stand for 72 h in
Refrigerator and then concentrated under
reduced pressure. The yield of apigenin was
measured by HPLC [31]. The above
procedures were repeated for extraction of
apigenin from Apium graveolens and
Petroselinum crispum.
2.6. Standard Curves
Proper volume of one of the above-
mentioned working solutions to produce the
standard curve point's equivalent to 0.01, 0.1,
5.0, 12.5, 25.0, 50.0, 100, and 500µg/ml of
apigenin and each sample was processed as
described. Finally, the nominal known
concentrations were plotted against the
corresponding peak areas to construct the
standard curve.
2.6.1 Preparation of Quality Control Samples
Quality control samples were prepared
daily by spiking different samples with proper
volume of the corresponding standard solution
to produce a final concentration equivalent to
low level (0.01µg/ml), middle level(25.0
µg/ml), and high level (500.0 µg/ml) of
apigenin. The following procedures were the
same as described above.
2.7. Method Validation
The method was validated for selectivity,
linearity, accuracy, precision, recovery,
stability, detection limit, and quantitation limit
according to the principles of the FDA
industry guidance [31-33].
2.7.1. Assay Specificity
To evaluate the matrix effect on the
ionization of analytes, five different
concentration levels of apigenin (0.01,0.1, 5.0,
12.5, , 25.0, 50.0, 100, and 500µg/ml) were
prepared as five sample series using five
different lots of the apigenin and the samples
were processed, as described, and injected to
HPLC. The same concentrations were
prepared in mobile phase and analyzed for
apigenin concentration using the same
procedure. A comparison of the matrix effects
of the two variants was made as an indicator of
the method specificity.
2.7.2. Linearity
Standard curves of ten concentrations of
apigenin ranged 0.01–500.0 µg/ml were
assayed. Blank samples were analyzed to
ensure the lack of interferences but not used to
construct the calibration function. The limit of
detection (LOD) was estimated from the
signal-to- noise ratio. This parameter was
defined as the lowest concentration level
resulting in a peak area of three times the
baseline noise. The limit of quantification
(LOQ) was defined as the lowest concentration
level that provided a peak area with a signal-
to- noise ratio higher than 5, with precision (%
CV) within ± 20% and accuracy (% recovery)
between 80% and 120%.

Determination of Apigenin in dried powder of plants
22
2.7.3. Precision and Accuracy
2.7.3.1. Within-Run Variations
In one run, three samples with
concentrations of 0.01, 25, and 500µg/ml
(from high, middle, and low regions of the
standard curve) were prepared in triplicate and
analyzed by developed HPLC method. Then,
the coefficient of variations (CV %) of the
corresponding determined concentrations were
calculated in each case.
2.7.3.2. Between-Run Variations
On three different runs, samples from
upper, intermediate, and lower concentration
regions used for construction of standard curve
(the same as within-run variations test) were
prepared and analyzed by HPLC method.
Then, the corresponding CV% values were
calculated.
2.7.3.3. Repeatability Test
To test the method repeatability, six
independent samples with an apigenin
concentration of 25 µg/ml were prepared as
described. A single injection of each
preparation was made to HPLC and the %RSD
between the results was determined as the
repeatability of the method.
2.7.4. Extraction Recovery
Three samples with concentrations of 0.01,
25, and 500µg/ml (from high, middle, and low
regions of the standard curve) were prepared
in triplicate and analyzed by developed HPLC
method. Then, the ratio of the recorded peak
heights to the peak heights resulted from the
direct injection of the aqueous solutions of
apigenin with the same concentrations were
determined as percentage in each case.
2.7.5. Intermediate Precision
On a different day to that of the
repeatability study, a second analyst executed
analysis of a further six samples prepared as
described in repeatability test procedure. The
analysis was carried out using fresh reagents
and a different HPLC column. The % RSD
between six measurements was determined
along with the % RSD between the total of 12
measurements from the repeatability and
intermediate precision tests.
2.7.6. Reproducibility
Mean results for the same sample analysis
between our laboratory and two different test
facilities were obtained and the % difference
between content measurements was calculated
using the equation:
[(highest value lowest value) /mean value]
100.
2.7.7. Stability
2.7.7.1. Freeze and Thaw Stability
Three concentration levels of QC samples
were stored at the storage temperature (−20
◦C) for 24 h and thawed unassisted at room
temperature. When completely thawed, the
samples were refrozen for 24 h under the same
conditions. The freeze-thaw cycle were
repeated twice, then the samples were tested
after three freeze (−20 ◦C)-thaw (room
temperature).

Sharifi A, et al / IJPS 2016; 12 (2):21-32
23
2.7.7.2. Short-term temperature stability
Three concentration levels of QC apigenin
samples were kept at room temperature for a
period that exceeded the routine preparation
time of samples (around 6 h).
2.7.7.3. Long-Term Stability
Three concentration levels of QC samples
kept at low temperature (−20 ◦C) were studied
for a period of 4 weeks.
2.7.7.4. Post-Preparative Stability
The auto sampler stability was conducted
reanalyzing extracted QC samples kept under
the auto sampler conditions (4 ◦C) for 12 h.
2.7.8. Robustness
The robustness of the method was
determined to assess the effect of small but
deliberate variation of the chromatographic
conditions on the determination of apigenin.
Robustness was determined by changing the
mobile phase flow rate to 0.75 and 1.25 mL
min−1
.
3. Results and Discussion
3.1. Method Development
Considering the complex biological matrix
of the samples to be analyzed and the nature of
the method to be used for apigenin assay, the
method development efforts were made in two
different areas of sample preparation and
analyte separation which are discussed in
detail in the following sections: Typical
chromatograms produced from the developed
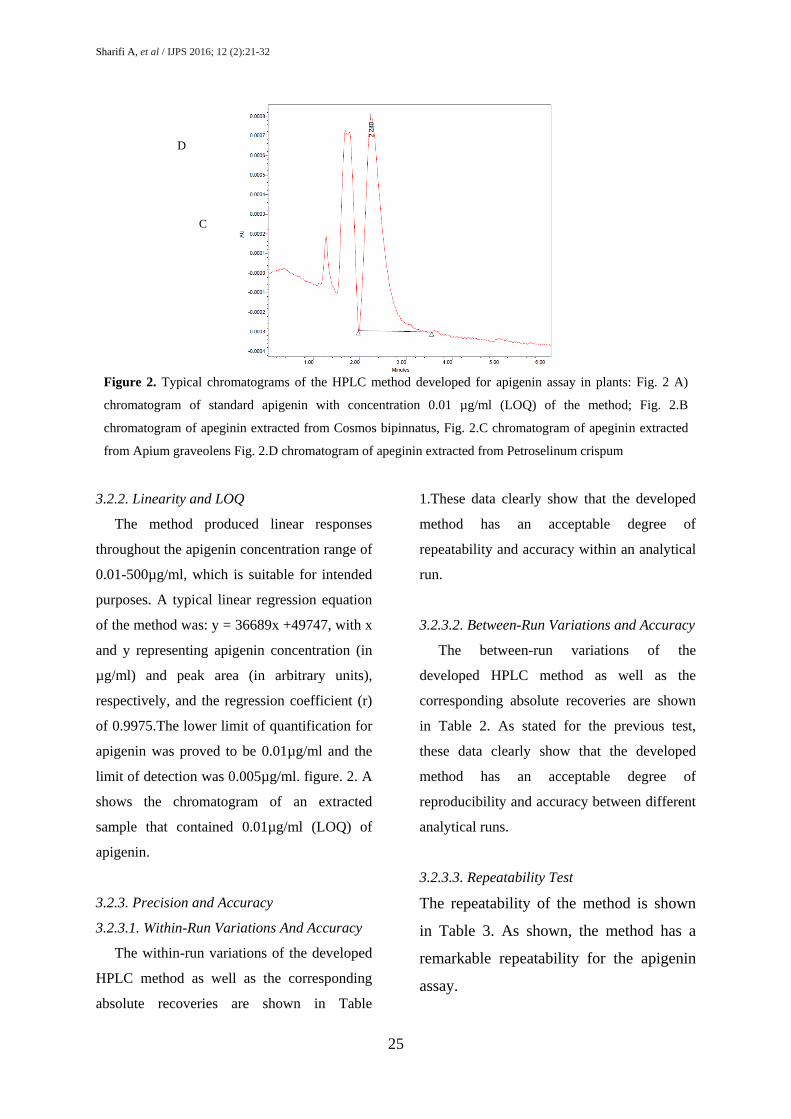
method are shown in figure 2. The retention
time of apigenin was 2.18 min. per sample, no
interferences of the analyte were observed.
3.2. Method Validation
3.2.1. Assay Specificity
As it is clearly evident from the typical
chromatograms of the developed method
shown in figure 2, there are no discernible
interferences between the matrix factors and
the analyte. This, in turn, ensures obtaining
Table 1.Within–run variations and accuracy of the HPLC method for quantitation of apigenin (n=3).
Mean
(SD)
Accuracy CV% Mean
(SD)
Measured
Concentration
(µg/ml)
Sample
Number
Nominal Added
Concentration
(µg/ml)
95.54
(1.37)
95.23
94.36
97.05
5.9 0.0103
(0.0006)
0.011
0.0099
0.010
1
2
3
0.01
97.12
(1.84)
99.24
95.89
96.23
2.24 25.63
(0.57)
25.8
26.1
24.99
1
2
3
25
99.23
(0.70)
100.02
99.02
98.65
0.18 500.33
(0.93)
499.46
501.32
500.23
1
2
3
500

Determination of Apigenin in dried powder of plants
24
reliable results from the method for
determination of concentrations of apigenin.
Sharifi A, et al / IJPS 2016; 12 (2):21-32
25
3.2.2. Linearity and LOQ
The method produced linear responses
throughout the apigenin concentration range of
0.01-500µg/ml, which is suitable for intended
purposes. A typical linear regression equation
of the method was: y = 36689x +49747, with x
and y representing apigenin concentration (in
µg/ml) and peak area (in arbitrary units),
respectively, and the regression coefficient (r)
of 0.9975.The lower limit of quantification for
apigenin was proved to be 0.01µg/ml and the
limit of detection was 0.005µg/ml. figure. 2. A
shows the chromatogram of an extracted
sample that contained 0.01µg/ml (LOQ) of
apigenin.
3.2.3. Precision and Accuracy
3.2.3.1. Within-Run Variations And Accuracy
The within-run variations of the developed
HPLC method as well as the corresponding
absolute recoveries are shown in Table
1.These data clearly show that the developed
method has an acceptable degree of
repeatability and accuracy within an analytical
run.
3.2.3.2. Between-Run Variations and Accuracy
The between-run variations of the
developed HPLC method as well as the
corresponding absolute recoveries are shown
in Table 2. As stated for the previous test,
these data clearly show that the developed
method has an acceptable degree of
reproducibility and accuracy between different
analytical runs.
3.2.3.3. Repeatability Test
The repeatability of the method is shown
in Table 3. As shown, the method has a
remarkable repeatability for the apigenin
assay.
Figure 2. Typical chromatograms of the HPLC method developed for apigenin assay in plants: Fig. 2 A)
chromatogram of standard apigenin with concentration 0.01 µg/ml (LOQ) of the method; Fig. 2.B
chromatogram of apeginin extracted from Cosmos bipinnatus, Fig. 2.C chromatogram of apeginin extracted
from Apium graveolens Fig. 2.D chromatogram of apeginin extracted from Petroselinum crispum
A
B
C
D

Determination of Apigenin in dried powder of plants
26
Table 2. Between–run variations and accuracy of the HPLC method for quantitation of apigenin (n=3).
Mean
(SD)
Accuracy CV% Mean
(SD)
Measured
Concentration
(µg/ml)
Run
Number
Nominal Added
Concentration
(µg/ml)
99.23
(1.62)
97.90
98.78
101.02
3.76 0.01006
(0.0003)
0.0098
0.0105
0.0099
1
2
3
0.01
98.79
(2.34)
96.55
101.23
98.59
2.24 25.58
(0.58)
24.98
25.65
26.12
1
2
3
25
99.63
(1.25)
101.02
99.32
98.56
0.11 499.72
(0.56)
499.08
499.97
500.12
1
2
3
500
Table 3. Repeatability of the test results for spiked apigenin containing 25 µg mL-1 apigenin.
Sample Peak area Mean(SD) CV% Retention
time (min)
Mean (SD) CV %
1 5099782 5100465(1042) 0.026 2.18 2.18(0.014) 0.64
2 5099687 2.17
3 5099932 2.19
4 5102312 2.16
5 5101110 2.20
6 5099967 2.18
Table 4. Relative recovery of apigenin by the HPLC method (N=3).
Mean
(SD)
Recovery (%) Sample
Number
Nominal Added
Concentration
(µg/ml)
98.77
(3.41)
95.21
102.01
99.11
1
2
3
0.01
96.62
(4.30)
96.18
101.14
92.56
1
2
3
25
99.21
(4.22)
101.25
102.04
94.36
1
2
3
500
Sharifi A, et al / IJPS 2016; 12 (2):21-32
27
3.2.4. Relative Recovery (Matrix Effect)
The extraction recovery determined for
apigenin was shown to be consistent, precise
and reproducible. Data were shown below in
Table 4.These data indicate that there is no
significant matrix effect on the outputs of the
assay method.
3.2.5. Intermediate Precision
The results of the intermediate precision
test are shown in Table 5. As indicated, the
developed method shows an acceptable
intermediate precision for apigenin assay.
3.2.6. Reproducibility
The highest test result of the spiked
apigenin with 25µg mL-1 apigenin
was5099876 and the lowest value
was5099021with the mean value of 5099296.
Therefore, the % difference was 0.016% which
means a high reproducibility for the method.
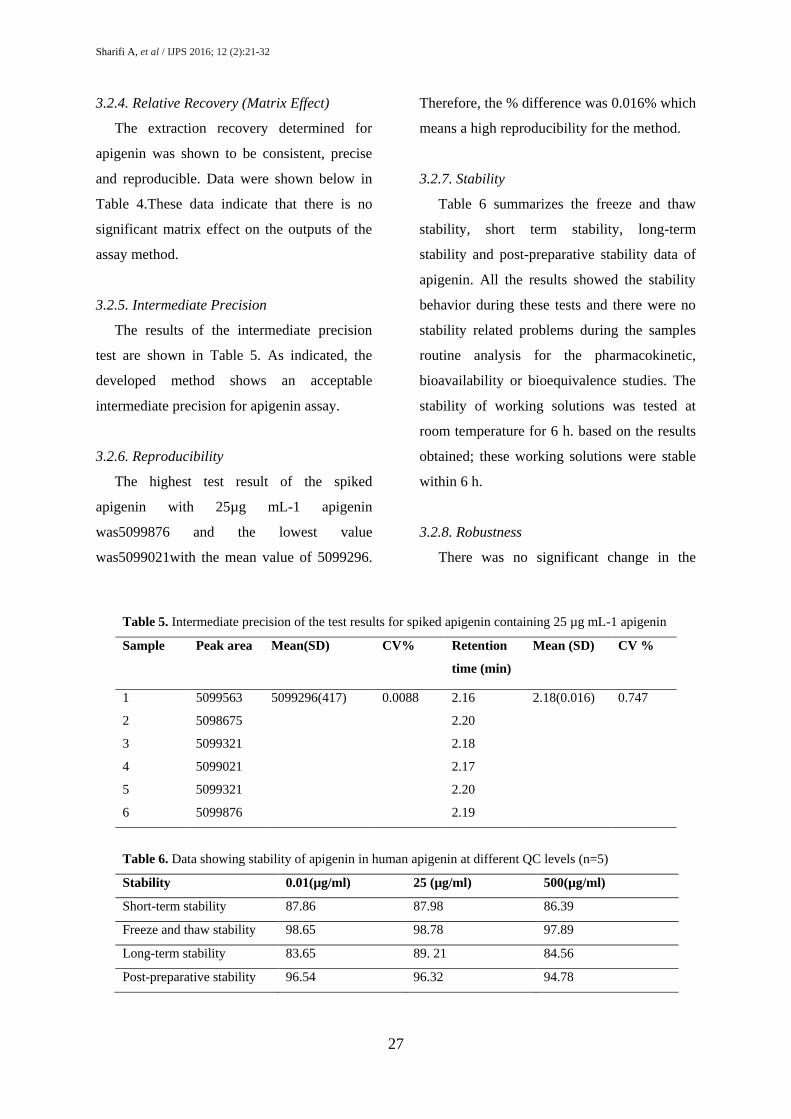
3.2.7. Stability
Table 6 summarizes the freeze and thaw
stability, short term stability, long-term
stability and post-preparative stability data of
apigenin. All the results showed the stability
behavior during these tests and there were no
stability related problems during the samples
routine analysis for the pharmacokinetic,
bioavailability or bioequivalence studies. The
stability of working solutions was tested at
room temperature for 6 h. based on the results
obtained; these working solutions were stable
within 6 h.
3.2.8. Robustness
There was no significant change in the
Table 5. Intermediate precision of the test results for spiked apigenin containing 25 µg mL-1 apigenin
Sample Peak area Mean(SD) CV% Retention
time (min)
Mean (SD) CV %
1 5099563 5099296(417) 0.0088 2.16 2.18(0.016) 0.747
2 5098675 2.20
3 5099321 2.18
4 5099021 2.17
5 5099321 2.20
6 5099876 2.19
Table 6. Data showing stability of apigenin in human apigenin at different QC levels (n=5)
Stability 0.01(µg/ml) 25 (µg/ml) 500(µg/ml)
Short-term stability 87.86 87.98 86.39
Freeze and thaw stability 98.65 98.78 97.89
Long-term stability 83.65 89. 21 84.56
Post-preparative stability 96.54 96.32 94.78

Determination of Apigenin in dried powder of plants
28
retention time of apigenin when the flow rate
of the mobile phase was changed. The low
values of the RSD, shown in Table 7, indicated
the robustness of the method.
3.3 Effects of extraction solvent
For finding an effective solvent for the
extraction of apigenin various solvents were
tested. The use of ethanol produced the highest
yield of extract apigenin 30.49 mg from 8.45
g, 4.37 mg from 8.45 g, and 2.855 mg from
4.65 g of dry C. bipinnatus, Apium graveolens,
and Petroselinum crispum plants respectively.
While yields of extract from acetone,
methanol, contain apigenin 11mg, 2.2 mg and
0.7mg, respectively from C. bipinnatus, Apium
graveolens and Petroselinum crispum plants
respectively. Figure 2.B chromatogram shows
apeginin extracted from Cosmos bipinnatus
and also figure 2.C shows chromatogram of
apeginin extracted from Apium graveolens
figure 2.D chromatogram of apeginin extracted
from Petroselinum crispum. These results
revealed as the first report. In our experiments,
ethanol was used due to high yield and the
lower toxicity of ethanol compared to the other
solvents tested in this study. The extraction
recovery determined for apigenin from plants
is shown in Table 8.
3.3.1. Effects of extraction temperature and
time
The extractions were carried out at various
temperatures under the conditions described in
Section 2.2.4. The recovery yield of extract
and the apigenin content generally increased
with an increase in extraction temperature up
to 80°C and these results are probably due to a
higher solubility and diffusivity of solute in
liquidate higher temperature. Since the
increase in the extraction yield was very large
from 70–90°C, extraction temperatures. So,
80°C was considered optimal temperature for
achieving a high recovery yield of extract
containing apigenin. Using the optimal
extraction conditions selected in sections
Table 7. Results from testing of the robustness of the method by changing the mobile phase flow rate. (The
concentration of the solution analysed was 25 μg mL−1)
Flow rate (ml/min) Mean area (SD)
N=3
Mean tR(SD)
N=3
CV %
0.75 5098675 (417) 2.19 (0.015) 0.0082
1 5099563 (564) 2.18 (0.016) 0.011
1.25 5097865 (467) 2.20 (0.017) 0.0092
Table 8. The extraction recovery determined for apigenin from plants
Plants Weight of plants(mg) Weight of apigenin(mg) Recovery (%)
C. bipinnatus, 8450 30.49 0.36
Apium graveolens 8450 4.37 0.051
Petroselinum crispum 4650 2.855 0.061

Sharifi A, et al / IJPS 2016; 12 (2):21-32
29
extractions were conducted for various
extraction time lengths. The extract recovery
yield appeared to increase by increasing
extraction time up to 6h, but the further
extending of extraction time did not result in
an increase of extract recovery yield.
4. Conclusion
This study demonstrates to an effective
process for separating and fractionating of
apigenin. Optimal conditions for the recovery
high content of apigenin were determined to
be extraction with ethanol at 80 C for 6 h,
followed by fraction at ion with ethanol.
Apigenin was obtained in crystal form with
over purity through relatively low cost
sequential processes only requiring water,
ethanol. This economically feasible process
can be readily applied in those industries
demanding high purity apigenin, with high
value due to its various biological and
physiological activities. It was concluded that
a simple and sensitive HPLC methods has
developed and validated by using C8 column.
Statistical analysis of the results shows that all
the proposed procedures have good
precision and accuracy shown in table. The
procedure will successfully apply to the
determination of the studied compound in
pharmaceutical formulation without any
interference from the additives and
endogenous substances. This method offers
several advantages such as a rapid and simple
extraction scheme and a short
chromatographic run time the method suitable
for applicable to pharmacokinetic and
pharmacodynamics studies and for routine
applications in the quality control
laboratories because of the simplicity,
economic, accuracy, sensitivity and
reproducibility.
Acknowledgement
The authors would like to thank the
authority of the Faculty of Pharmacy, Zanjan
University of Medical Sciences, for their
support.
References
[1] Manjili H.K, Sharafi A, Danafar H, Hosseini M,
Ramazani A, Ghasemi M.H. 2016. Poly
(caprolactone)–poly (ethylene glycol)–poly
(caprolactone)(PCL–PEG–PCL) nanoparticles: a
valuable and efficient system for in vitro and in vivo
delivery of curcumin. RSC Advances. (2016) 6:
14403-14415.
[2] Danafar H, Sharafi A, Kheiri Manjili H, Andalib
S. Sulforaphane delivery using mPEG–PCL co-
polymer nanoparticles to breast cancer cells.
Pharmaceutical development and technology. (2016)
1-10.
[3] Porbarkhordari E, Foladsaz K, Hoseini S.H,
Danafar H, Kheiri Manjili H.R. Ramazani A. The
Hypoglycemic Effects of an Ethanol Extract of
Peganum harmala in Streptozotocin-Induced Diabetic
Rats. Iranian Journal of Pharmaceutical Sciences.
(2014) 10: 47-54.
[4] Škerget M, Kotnik P. Hadolin M, Hraš A.R.
Phenols, proanthocyanidins, flavones and flavonols in
some plant materials and their antioxidant activities.
Food chemistry. (2005) 89: 191-198.
[5] Danafar H, Hamidi M. Liquid chromatography–
tandem mass spectrometry (LC-MS) method for the
assignment of enalapril and enalaprilat in human
plasma. Pharm Biomed Res. (2015) 1: 47-58
[6] Hougee S, Sanders A, Faber J. Decreased pro-
inflammatory cytokine production by LPS-stimulated
PBMC upon in vitro incubation with the flavonoids
Determination of Apigenin in dried powder of plants
30
apigenin, luteolin or chrysin, due to selective
elimination of monocytes/macrophages. Biochemical
pharmacology . (2005) 69: 241-248.
[7] Kim D.-I, Kim C.-H. Regulation of IGF-I
production and proliferation of human leiomyomal
smooth muscle cells by Scutellaria barbata D. Don in
vitro: isolation of flavonoids of apigenin and luteolin
as acting compounds. Toxicology and applied
pharmacology. (2005) 205: 213-224.
[8] Martini N, Katerere D, Eloff J. Biological activity
of five antibacterial flavonoids from Combretum
erythrophyllum (Combretaceae). Journal of
ethnopharmacology (2004) 93: 207-212.
[9] Danafar H, Hamidi, M. A quick and sensitive
liquid chromatography–tandem mass spectrometry
(LC-MS) method for the determination of enalapril
and enalaprilat in human plasma: Application to a
Bioequivalence Study. Iranian journal of
pharmaceutical sciences. (2014) 10(3): 21-34.
[10] Danafar H, Hamidi M.LC-MS Method for
Studying the Pharmacokinetics and Bioequivalence of
Clonidine Hydrochloride in Healthy Male Volunteers.
Avicenna J Med Biotech (2016) 8(2): 91-98
[11] Wang C.-L, Li H.-Q, Trifluoromethylation of
flavonoids and anti-tumor activity of the
trifluoromethylated flavonoid derivatives. Bioorganic
& medicinal chemistry letters (2005)15: 4456-4458.
[12] Abate A, Yang G, Wong R.J.. Apigenin
decreases hemin-mediated heme oxygenase-1
induction. Free Radical Biology and Medicine (2005)
39: 711-718.
[13] Choi E.J, Kim G.-H. Apigenin induces apoptosis
through a mitochondria/caspase-pathway in human
breast cancer MDA-MB-453 cells. Journal of clinical
biochemistry and nutrition (2009) 44: 260-265.
[14] Danafar H, Hamidi M. A Rapid and Sensitive
LC–MS Method for Determination of ezetimibe
Concentration in Human Plasma: Application to a
Bioequivalence Study. Chromatographia (2013) 76:
1667-1675.
[15] Hirano T, Higa S, Arimitsu J. Luteolin J. a
flavonoid, inhibits AP-1 activation by basophils.
Biochemical and biophysical research
communications ( 2006) 340: 1-7.
[16] Hougee S, Sanders A. Decreased pro-
inflammatory cytokine production by LPS-stimulated
PBMC upon in vitro incubation with the flavonoids
apigenin, luteolin or chrysin, due to selective
elimination of monocytes/macrophages. Biochemical
pharmacology (2005) 69: 241-248.
[17] Danafar H, Hamidi M. Pharmacokinetics and
Bioequivalence Study of Amlodipine and Atorvastatin
in Healthy Male Volunteers by LC-MS.
Pharmaceutical Sciences (2015) 21: 167-174
[18] Jang I.-C, Park J.-H, Park E. Antioxidative and
antigenotoxic activity of extracts from cosmos
(Cosmos bipinnatus) flowers. Plant foods for human
nutrition (2008) 63: 205-210.
[19] Khan T.H, Sultana S. Apigenin induces apoptosis
in Hep G2 cells: possible role of TNF-α and IFN-γ.
Toxicology (2006) 217: 206-212.
[20] Danafar H, Hamidi M. Simple and sensitive high
performance liquid chromatographic method for the
simultaneous quantitation of the phenylalanine in
human plasma. Pharm Biomed Res (2015) 1: 12-20
[21] Kim, D.-I., Lee, T.-K., Lim, I.-S. Regulation of
IGF-I production and proliferation of human
leiomyomal smooth muscle cells by Scutellaria
barbata D. Don in vitro: isolation of flavonoids of
apigenin and luteolin as acting compounds.
Toxicology and applied pharmacology (2005) 205:
213-224.
[22] Kuo M.-L, Lee K.-C, Lin J.-K. Genotoxicities of
nitropyrenes and their modulation by apigenin, tannic
acid, ellagic acid and indole-3-carbinol in the
Salmonella and CHO systems. Mutation
Research/Fundamental and Molecular Mechanisms of
Mutagenesis (1992) 270: 87-95.
[23] Li L.-P, Jiang H.-D. Determination and assay
validation of luteolin and apigenin in human urine
after oral administration of tablet of Chrysanthemum
morifolium extract by HPLC. Journal of
pharmaceutical and biomedical analysis (2006) 41:
261-265.

Sharifi A, et al / IJPS 2016; 12 (2):21-32
31
[24] Martini N, Katerere D, Eloff J. Biological
activity of five antibacterial flavonoids from
Combretum erythrophyllum (Combretaceae). Journal
of ethnopharmacology (2004) 93: 207-212.
[25] Rithidech K.N, Tungjai M, Whorton E.B.
Protective effect of apigenin on radiation-induced
chromosomal damage in human lymphocytes.
Mutation Research/Genetic Toxicology and
Environmental Mutagenesis (2005) 585: 96-104.
[26] Danafar H, Hamidi M. Simple and Sensitive
High-Performance Liquid Chromatography (HPLC)
Method with UV Detection for Mycophenolic Acid
Assay in Human Plasma. Application to a
Bioequivalence Study. Adv Pharm Bull (2015) 5:
563-568.
[27] Sohn S.-H, Yun B.-S, Kim S.-Y. Anti-
inflammatory activity of the active components from
the roots of Cosmos bipinnatus in lipopolysaccharide-
stimulated RAW 264.7 macrophages. Natural product
research (2013) 27: 1037-1040.
[28] Danafar H. Method validation of colonidine in
human plasma by LC-MS. Pharm Biomed Res (2015)
1(4): 48-58
[29] Svenningsen A.B, Madsen K.D, Liljefors T.
Biflavones from Rhus species with affinity for the
GABA A/benzodiazepine receptor. Journal of
ethnopharmacology (2006) 103: 276-280.
[30] Wang C.-L, Li H.-Q, Meng W.-D.
Trifluoromethylation of flavonoids and anti-tumor
activity of the trifluoromethylated flavonoid
derivatives. Bioorganic & medicinal chemistry letters
(2005) 15: 4456-4458.
[31] Danafar H. A quick and easy high performance
liquid chromatography method for evaluation of
cefixime in human plasma. Pharm Biomed Res (2015)
1: 29-39.
[32] Danafar H, Hamidi M. Pharmacokinetics and
Bioequivalence of Methotrexate in Human Plasma
Studied by Liquid Chromatography-Mass
Spectrometry (LC-MS). Jundishapur J Nat Pharm
Prod. 11(2):e36758.
[33] Danafar H. Simple and sensitive high
performance liquid chromatographic (HPLC) method
for the determination of the selegiline in human
plasma. Cogent Medicine 2016 3: 1179244.

ONLINE SUBMISSION
www.ijps.ir