SIM Stock Presentation: Information Technology20Sector_AU15.pdf · Chromecast, and Nexus devices;...
38
SIM Stock Presentation: Information Technology Presenters: Krisztina Nadasdy, Yvonne Qi, Randy Oenardi Raharjo, David Robinson, Tony Cui
Transcript of SIM Stock Presentation: Information Technology20Sector_AU15.pdf · Chromecast, and Nexus devices;...

SIM Stock Presentation: Information Technology
Presenters: Krisztina Nadasdy, Yvonne Qi, Randy Oenardi Raharjo, David Robinson, Tony Cui

2
Sector & Portfolio Overview
Stock Discussion
Recommendation
Appendix
Stock Presentation: Information Technology
AGENDA

3
Stock Presentation: Information Technology
Sector & Portfolio Overview

4
Stock Presentation: Information Technology
Consumer Discretion
ary13%
Consumer Staples
10%
Energy7%
Financials16%
Health Care13%
Industrials10%
Info Tech21%
Materials3%
Telecom2%
Utilities2%
Cash3%
Dividend Receivables
0%
SIM PORTFOLIO WEIGHTS
Info Tech21%
Financials16%
Health Care15%
Consumer Discretion
ary13%
Industrials10%
Consumer Staples
10%
Energy7%
Utilities3%
Materials3%
Telecom2%
S&P 500 SECTOR WEIGHTS

5
Activision Blizzard, Inc.
Apple, Inc.
EMC Corp.
Google, Inc.
Micron Technology, Inc.
Vantiv, Inc.
Stock Presentation: Information Technology
Information Technology Stocks in SIM Portfolio:
6
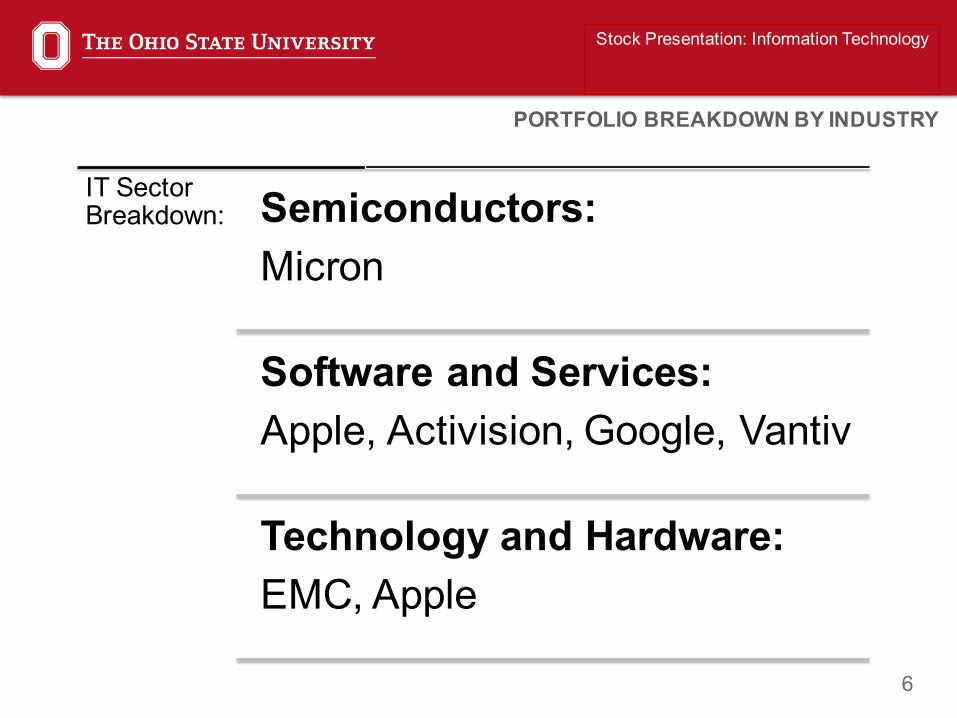
IT Sector Breakdown: Semiconductors:
Micron
Software and Services:Apple, Activision, Google, Vantiv
Technology and Hardware:EMC, Apple
Stock Presentation: Information Technology
PORTFOLIO BREAKDOWN BY INDUSTRY
7
Stock Presentation: Information Technology
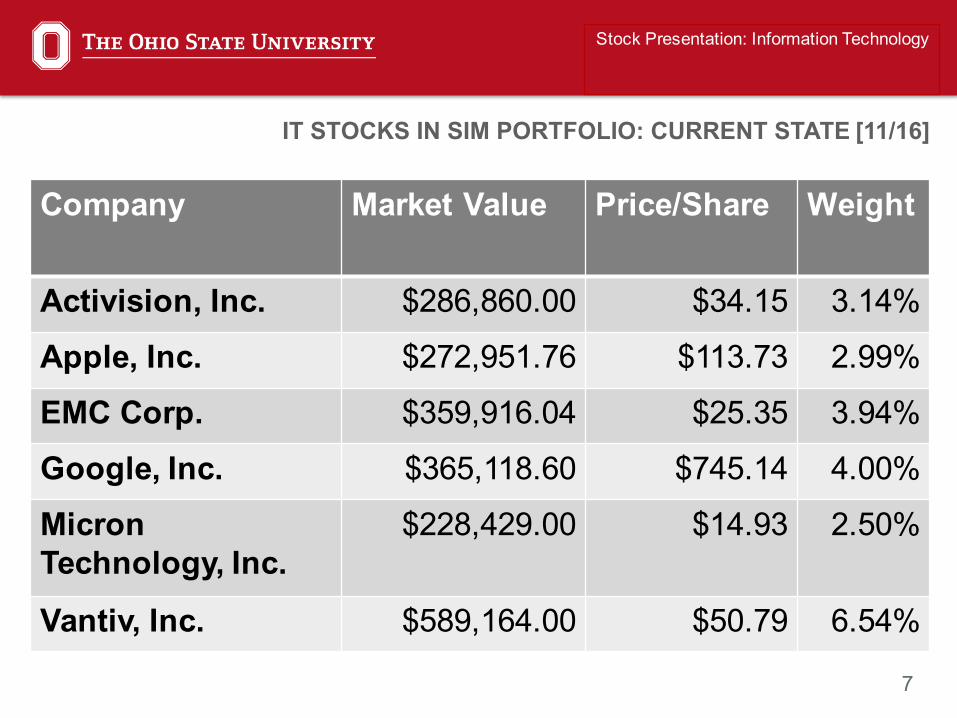
Company Market Value Price/Share Weight
Activision, Inc. $286,860.00 $34.15 3.14%
Apple, Inc. $272,951.76 $113.73 2.99%
EMC Corp. $359,916.04 $25.35 3.94%
Google, Inc. $365,118.60 $745.14 4.00%
Micron Technology, Inc.
$228,429.00 $14.93 2.50%
Vantiv, Inc. $589,164.00 $50.79 6.54%
IT STOCKS IN SIM PORTFOLIO: CURRENT STATE [11/16]

8
Stock Presentation: Information Technology
SECTOR RECOMMENDATIONS:
• Sector as whole: overweight relative to the S&P 500
• Preferred Industry within Info-Tech Sector: Software and Services
• Risks: Possible second “Internet Bubble”, Cyclical Industry – Short Life Cycle, Price Competition

9
Stock Presentation: Information Technology
STOCK RECOMMENDATIONS
Stock Decision CurrentWeight
Proposed Weight
Change
AAPL HOLD 2.99% 2.99% 0
EMC HOLD 3.94% 3.94% 0
ATVI BUY 3.14% 4.64% + 150 bp
VNTV SELL 6.54% 4.54% - 200 bp
GOOGL HOLD 4.00% 4.00% 0
MU HOLD 2.50% 2.50% 0

10
Stock Presentation: Information Technology
Stock Discussion
11
Stock Presentation: Information Technology
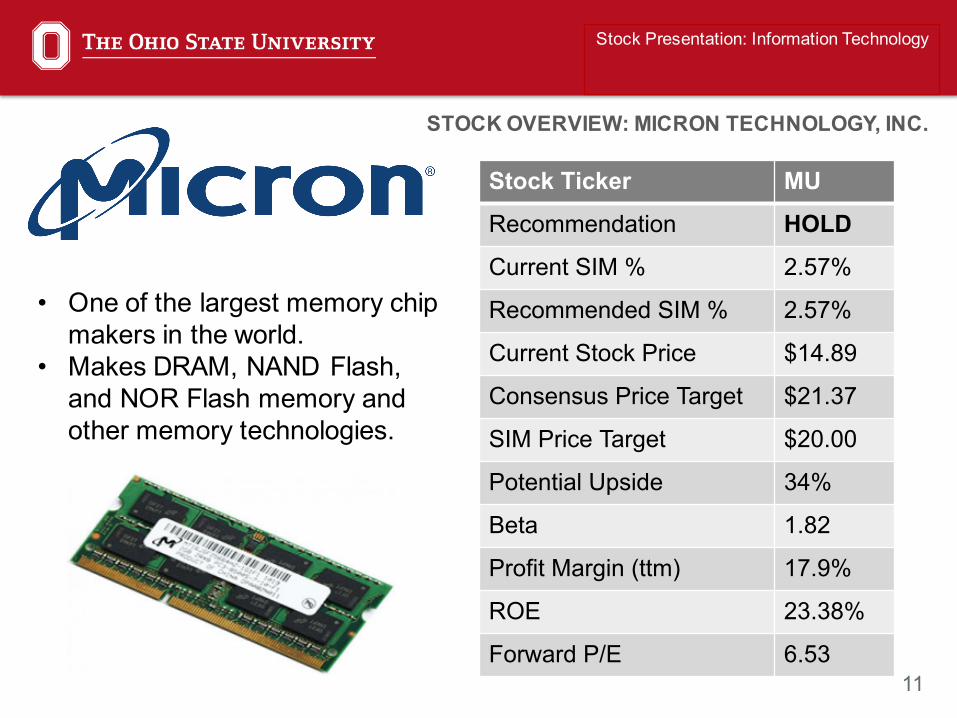
STOCK OVERVIEW: MICRON TECHNOLOGY, INC.
• One of the largest memory chip makers in the world.
• Makes DRAM, NAND Flash, and NOR Flash memory and other memory technologies.
Stock Ticker MU
Recommendation HOLD
Current SIM % 2.57%
Recommended SIM % 2.57%
Current Stock Price $14.89
Consensus Price Target $21.37
SIM Price Target $20.00
Potential Upside 34%
Beta 1.82
Profit Margin (ttm) 17.9%
ROE 23.38%
Forward P/E 6.53
12
Stock Presentation: Information Technology
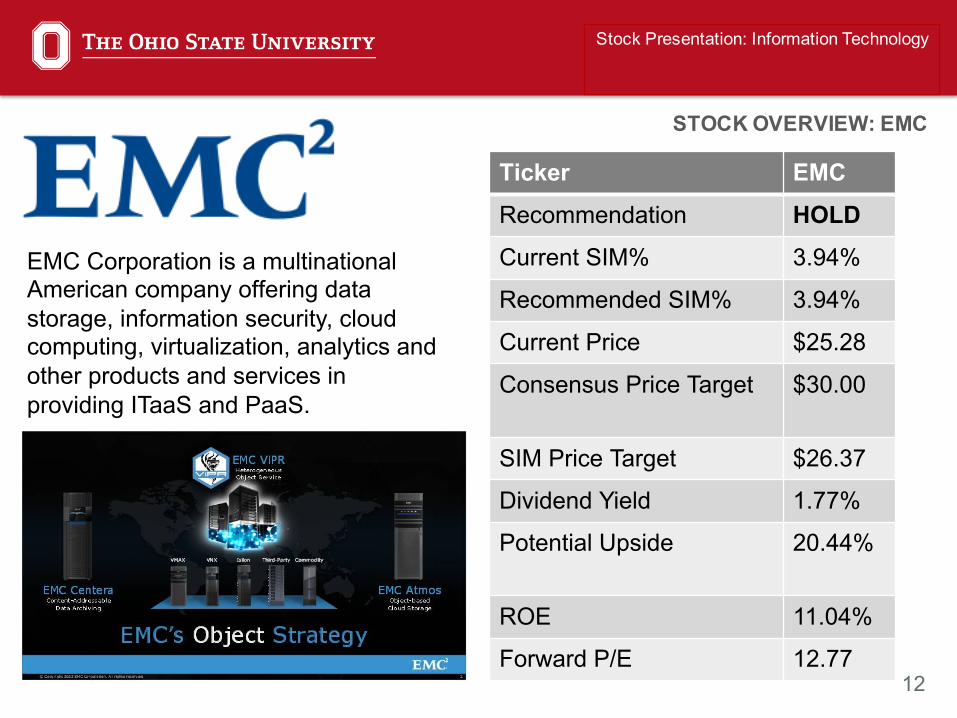
STOCK OVERVIEW: EMC
Ticker EMCRecommendation HOLDCurrent SIM% 3.94%
Recommended SIM% 3.94%
Current Price $25.28
Consensus Price Target $30.00
SIM Price Target $26.37
Dividend Yield 1.77%
Potential Upside 20.44%
ROE 11.04%
Forward P/E 12.77
EMC Corporation is a multinational American company offering data storage, information security, cloud computing, virtualization, analytics and other products and services in providing ITaaS and PaaS.
13
Stock Presentation: Information Technology
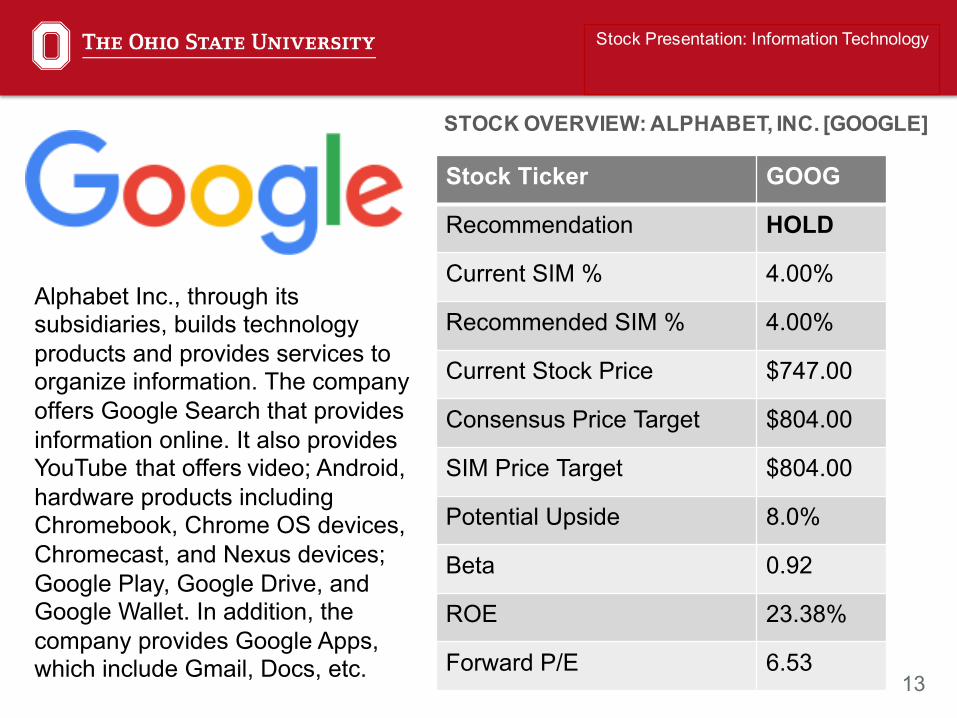
STOCK OVERVIEW: ALPHABET, INC. [GOOGLE]
Stock Ticker GOOG
Recommendation HOLD
Current SIM % 4.00%
Recommended SIM % 4.00%
Current Stock Price $747.00
Consensus Price Target $804.00
SIM Price Target $804.00
Potential Upside 8.0%
Beta 0.92
ROE 23.38%
Forward P/E 6.53
Alphabet Inc., through its subsidiaries, builds technology products and provides services to organize information. The company offers Google Search that provides information online. It also provides YouTube that offers video; Android, hardware products including Chromebook, Chrome OS devices, Chromecast, and Nexus devices; Google Play, Google Drive, and Google Wallet. In addition, the company provides Google Apps, which include Gmail, Docs, etc.

14
Stock Presentation: Information Technology
STOCK OVERVIEW: VANTIV
Ticker VNTVRecommendation SELLCurrent SIM% 6.54%
Recommended SIM% 4.54%
Current Price $51.23
Consensus Price Target $55.05
SIM Price Target $54.51
Dividend Yield 0.00%
Potential Upside 5.9%
ROE 19.02%
Forward P/E 19.70
Vantiv, Inc. is an “integrated payment processor” - it enables merchants and financial institutions to accept and process card and electronic payments. In addition to payment processing, the company offers data security services, financing services, gift and prepaid services, and compliance services.

15
Stock Presentation: Information Technology
STOCK OVERVIEW: VANTIV
$20.00
$25.00
$30.00
$35.00
$40.00
$45.00
$50.00
$55.00
LastPrice
Date
12 Month Stock Price Vantiv

16
Stock Presentation: Information Technology
VANTIV LAST PRICE AND E-COMMERCE QUARTERLY
17
Stock Presentation: Information Technology
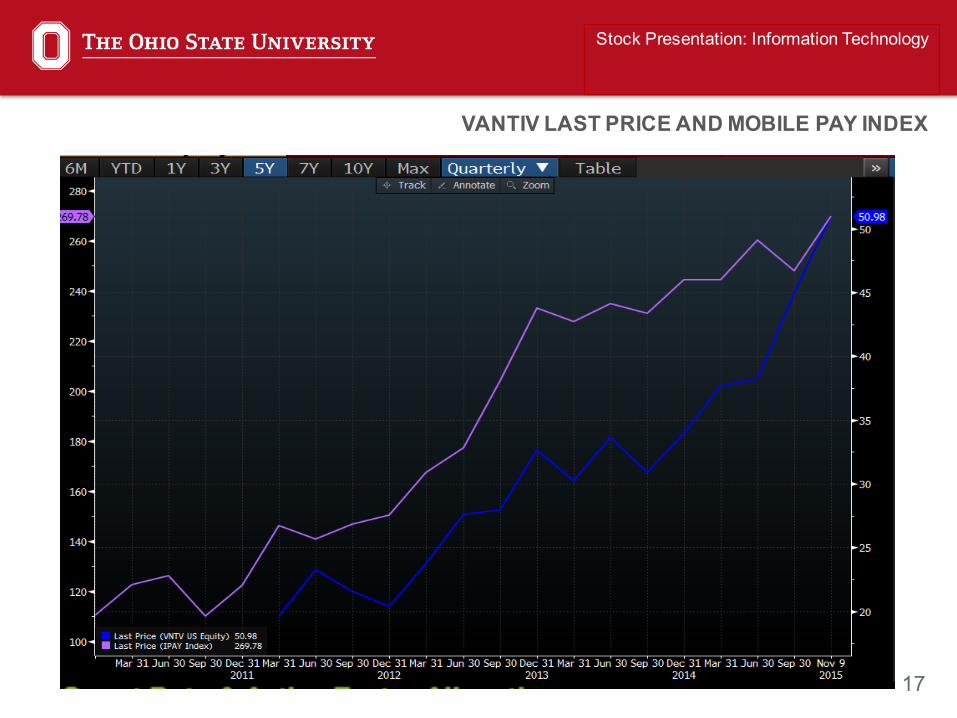
VANTIV LAST PRICE AND MOBILE PAY INDEX

18
Stock Presentation: Information Technology
VANTIV AND CREDIT CARD COMPANIES

19
Stock Presentation: Information Technology
VALUATION & FINANCIAL MULTIPLES: VANTIV AND PEER COMPANIES
Ticker Mkt Cap P/E P/S P/B P/CF EV/EBITDA ROE
Average 30.36B 31.54 4.53 6.30 15.02 12.78 19.02%
VNTV 9.48B 47.02 2.43 10.59 11.61 16.98 19.03%
Change -20.88 +15.5 -2.1 +4.29 -3.4 +4.2 0
Insights:• Some multiples indicate that the stock is overpriced [P/E, P/B,
EV/EBITDA]• Others indicate that it is a good investment [P/S, P/CF]

20
Stock Presentation: Information Technology
Risks of Holding Vantiv
• Acquisition Risk• Short History• Data Security• Price War• Quickly Changing Industry with a
complex set of stakeholders• Regulations
VANTIV: RISKS
21
Stock Presentation: Information Technology
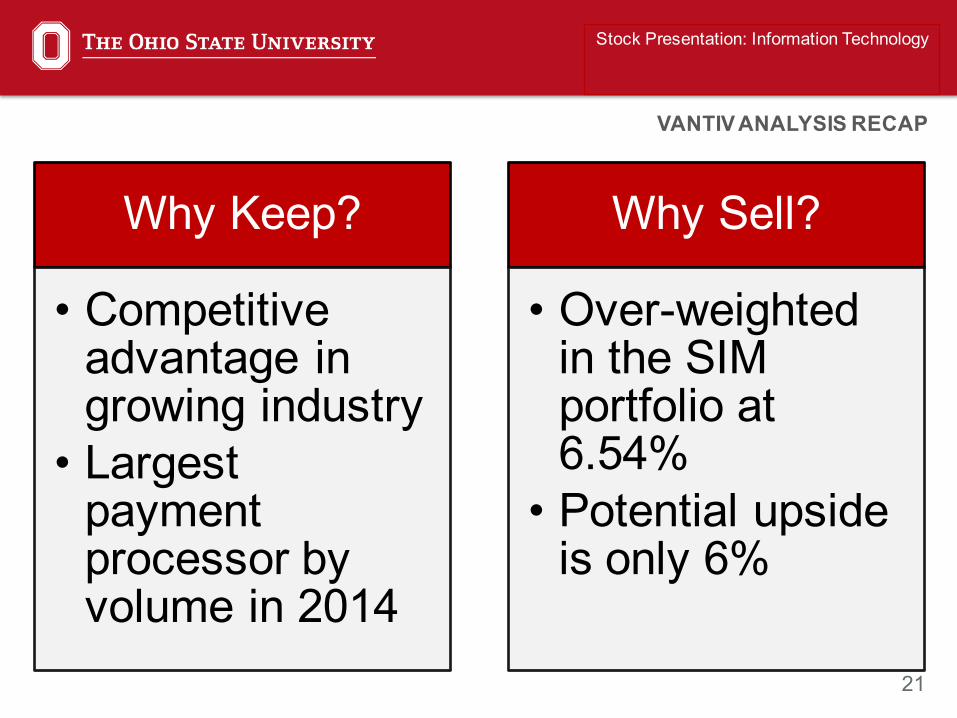
VANTIV ANALYSIS RECAP
Why Keep?
• Competitive advantage in growing industry
• Largest payment processor by volume in 2014
Why Sell?
• Over-weighted in the SIM portfolio at 6.54%
• Potential upside is only 6%

22
Ticker ATVI
Recommendation BUY
Current SIM% 3.14%
Recommended SIM% 4.64%
Current Price $34.95
Consensus Price Target $41.50
SIM Price Target $39.00
Dividend Yield 0.82%
Potential Upside 12.41%
ROE 14.63%
Forward P/E 22.80
Activision Blizzard, Inc. is a leading global developer and publisher of interactive entertainment for prior generation and next-generation consoles, PCs, and mobile devices.

23
12 Month Price Movement
24
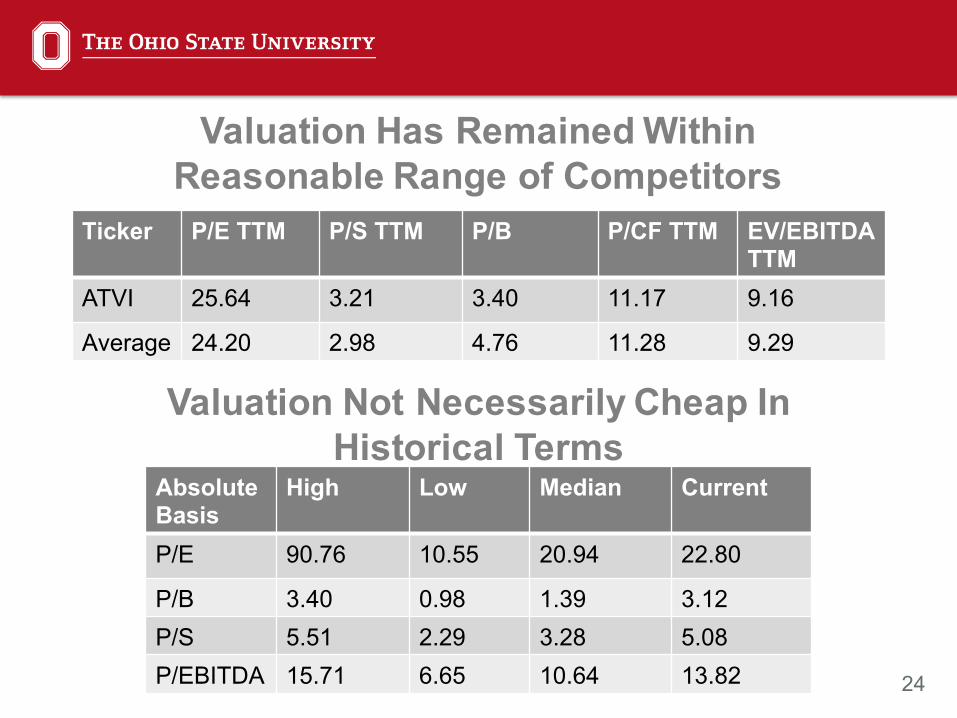
Valuation Has Remained Within Reasonable Range of Competitors
Valuation Not Necessarily Cheap In Historical Terms
Ticker P/E TTM P/S TTM P/B P/CF TTM EV/EBITDATTM
ATVI 25.64 3.21 3.40 11.17 9.16
Average 24.20 2.98 4.76 11.28 9.29
Absolute Basis
High Low Median Current
P/E 90.76 10.55 20.94 22.80
P/B 3.40 0.98 1.39 3.12P/S 5.51 2.29 3.28 5.08P/EBITDA 15.71 6.65 10.64 13.82

25
Sustained Competitive Advantages:1. Exceptional Leadership2. Intellectual Property3. SizePrimary Risks:1. Foreign Exchange Exposure (50% of
sales)2. Hit-Driven Industry3. Changes In Tax Legislation
Stock Presentation: Information Technology
ACTIVISION: COMPETITIVE LANDSCAPE

26
Leadership• CEO and President Bobby Kotick and Chairman Brian Kelly
have run the company for the last 20 years• $100 invested in ATVI in 1995 would have returned $4,400
today (more than nine times the S&P 500 return)• Long-term focus, customer oriented

27
Intellectual PropertyThe Hits Keep Coming
Destiny launched in Q3 2014• By Q3 2015 over 25 million active monthly players• Gamers spend an average of three hours a day online
Call of Duty: Black Ops III released Q3 2015• Generated $550 million in sales in three days• Beat the box office record of Jurassic World• 75 million hours played online in first three days of
launch
28
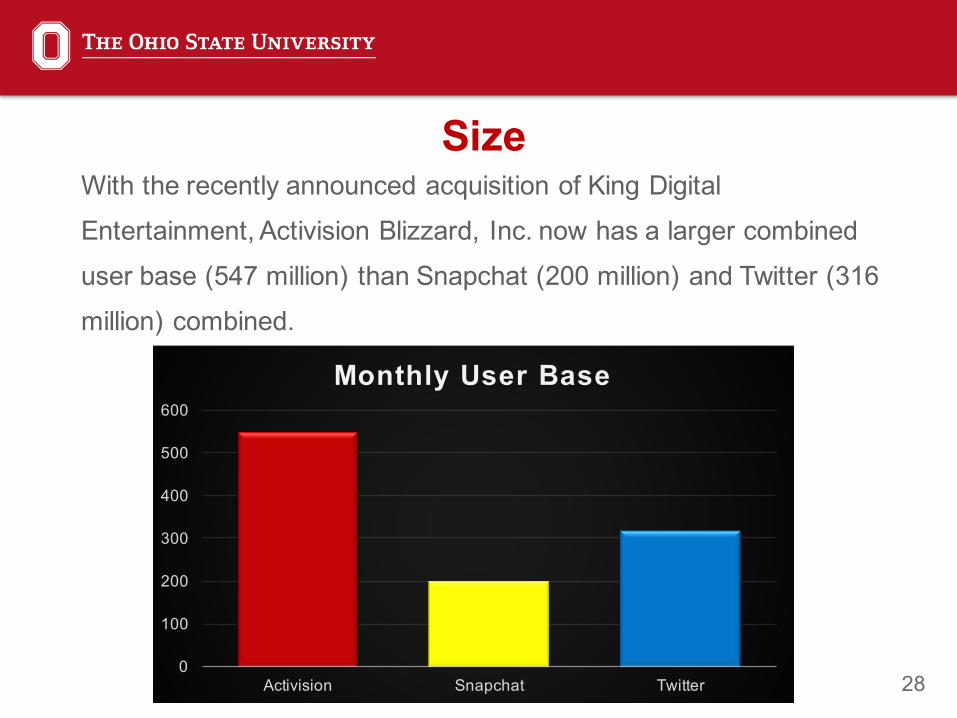
SizeWith the recently announced acquisition of King Digital Entertainment, Activision Blizzard, Inc. now has a larger combined user base (547 million) than Snapchat (200 million) and Twitter (316 million) combined.
0
100
200
300
400
500
600
Activision Snapchat Twitter
Monthly User Base

29
Recent News Indicates Continuation In Upward Trend
E-Sports Division• $465 million market by 2017
• 205 million viewers/participants in e-sports events in 2014
King Digital Entertainment Acquisition• $5.9 billion price tag, below King’s IPO price
• Major addition to rapidly expanding mobile gaming market
• Mobile to reach $55 billion sales by 2019 (Console and PC = E $57 billion)
Activision Blizzard Studios• TV series and movies based on award-winning franchises like Call of Duty,
Skylanders, and World of Warcraft

30
Sector Presentation: Information Technology
Recommendation

31
RECOMMENDATION RECAP
Stock Current Price
SIM Target Price
Consensus Target
Potential Upside/Downside
Recommendation
AAPL $114.23 N/A $146.95 28.6% HOLD
EMC $25.31 $26.37 $30.00 20.44% HOLD
ATVI $36.07 $39.00 $41.50 12.41% BUY
VNTV $51.55 $54.51 $55.05 6.00% SELL
GOOGL $752.26 $803.75 $826.85 8.00% HOLD
MU $15.65 $20.00 $21.37 34.00% HOLD

32
Stock Presentation: Information Technology
APPENDIX

33
Stock Presentation: Information Technology
MICRON: DCF VALUATIONAnalyst: Yihuang Qi Terminal Discount Rate = 11.0%2015/11/6 Terminal FCF Growth = 2.0%(in millions)Year 2015E 2016E 2017E 2018E 2019E 2020E 2021E 2022E 2023E 2024E 2025ERevenue 16,137 15,920 17,193 17,365 17,539 18,065 18,607 19,165 19,549 19,940 20,338 % Grow th -1% 8% 1% 1% 3% 3% 3% 2% 2% 2%
Operating Income 2,743 2,229 2,751 2,605 2,631 2,710 2,791 2,875 2,932 2,991 3,051 Operating Margin 17% 14% 16% 15% 15% 15% 15% 15% 15% 15% 15%
Interest Expense (335) (159) (172) (174) (175) (181) (186) (192) (195) (199) (203) Interest % of Sales -2% -1% -1% -1% -1% -1% -1% -1% -1% -1% -1%
Taxes (120) (103) (103) (170) (123) (152) (156) (161) (164) (167) (171) Tax Rate -5% -5% -4% -7% -5% -6% -6% -6% -6% -6% -6%
Equity method investees 474 395 569 435 415 425 420 422 421 422 421 Net Income 2,762 2,361 3,045 2,695 2,747 2,802 2,868 2,944 2,994 3,046 3,098 % Grow th -14.5% 29.0% -11.5% 1.9% 2.0% 2.4% 2.6% 1.7% 1.7% 1.7%
Add Depreciation/Amort 3,400 3,354 3,586 3,473 3,508 3,613 3,721 3,833 3,910 3,988 4,068 % of Sales 21% 21% 21% 20% 20% 20% 20% 20% 20% 20% 20%
Plus/(minus) Changes WC -376 200 -536 -521 -702 -903 -930 -958 -782 -798 -814 % of Sales -2% 1% -3% -3% -4% -5% -5% -5% -4% -4% -4%
Subtract Cap Ex -3,212 -3,168 -3,387 -3,473 -3,508 -3,613 -3,721 -3,833 -3,910 -3,988 -4,068 Capex % of sales -20% -20% -20% -20% -20% -20% -20% -20% -20% -20% -20%
Free Cash Flow 2,574 2,747 2,707 2,175 2,046 1,899 1,938 1,986 2,212 2,248 2,284 % Grow th 7% -1% -20% -6% -7% 2% 2% 11% 2% 2%
NPV of Cash Flows 14,366 61%NPV of terminal value 9,117 39% Terminal Value 25,888 Projected Equity Value 23,483 100%Free Cash Flow Yield 13.37% Free Cash Yield 8.82%
Current P/E 7.0 8.2 6.3 Terminal P/E 8.4 Projected P/E 8.5 9.9 7.7 Current EV/EBITDA 3.6 3.9 3.5 Terminal EV/EBITDA 4.0 Projected EV/EBITDA 4.3 4.7 4.1
Shares Outstanding 1,170
Current Price 16.45$ Implied equity value/share 20.07$ 0% 1% 2% 3% 4%Upside/(Downside) to DCF 22.0% 9% 22.56 23.81 25.42 27.56 30.55
10% 20.35 21.27 22.42 23.89 25.87 Debt 7,551 11% 18.53 19.22 20.07 21.13 22.49 Cash 4,860 12% 17.01 17.55 18.19 18.97 19.95 Cash/share 4.15 13% 15.73 16.15 16.64 17.23 17.95
Terminal FCF Growth =
Terminal Discount Rate =
34
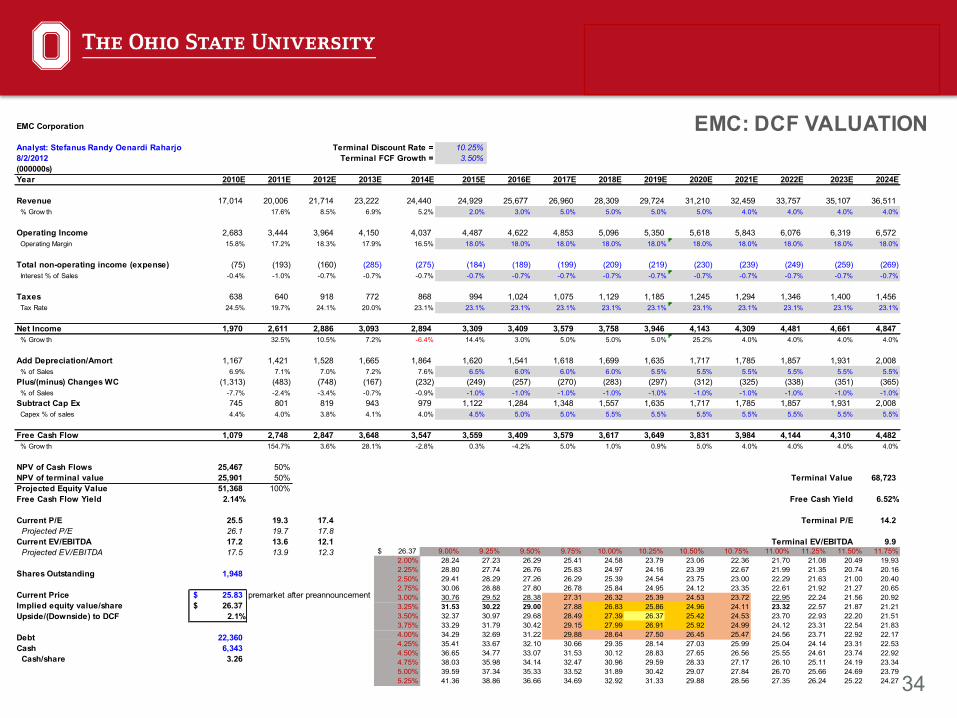
EMC: DCF VALUATIONEMC Corporation
Analyst: Stefanus Randy Oenardi Raharjo Terminal Discount Rate = 10.25%8/2/2012 Terminal FCF Growth = 3.50%(000000s)Year 2010E 2011E 2012E 2013E 2014E 2015E 2016E 2017E 2018E 2019E 2020E 2021E 2022E 2023E 2024E
Revenue 17,014 20,006 21,714 23,222 24,440 24,929 25,677 26,960 28,309 29,724 31,210 32,459 33,757 35,107 36,511 % Grow th 17.6% 8.5% 6.9% 5.2% 2.0% 3.0% 5.0% 5.0% 5.0% 5.0% 4.0% 4.0% 4.0% 4.0%
Operating Income 2,683 3,444 3,964 4,150 4,037 4,487 4,622 4,853 5,096 5,350 5,618 5,843 6,076 6,319 6,572 Operating Margin 15.8% 17.2% 18.3% 17.9% 16.5% 18.0% 18.0% 18.0% 18.0% 18.0% 18.0% 18.0% 18.0% 18.0% 18.0%
Total non-operating income (expense) (75) (193) (160) (285) (275) (184) (189) (199) (209) (219) (230) (239) (249) (259) (269) Interest % of Sales -0.4% -1.0% -0.7% -0.7% -0.7% -0.7% -0.7% -0.7% -0.7% -0.7% -0.7% -0.7% -0.7% -0.7% -0.7%
Taxes 638 640 918 772 868 994 1,024 1,075 1,129 1,185 1,245 1,294 1,346 1,400 1,456 Tax Rate 24.5% 19.7% 24.1% 20.0% 23.1% 23.1% 23.1% 23.1% 23.1% 23.1% 23.1% 23.1% 23.1% 23.1% 23.1%
Net Income 1,970 2,611 2,886 3,093 2,894 3,309 3,409 3,579 3,758 3,946 4,143 4,309 4,481 4,661 4,847 % Grow th 32.5% 10.5% 7.2% -6.4% 14.4% 3.0% 5.0% 5.0% 5.0% 25.2% 4.0% 4.0% 4.0% 4.0%
Add Depreciation/Amort 1,167 1,421 1,528 1,665 1,864 1,620 1,541 1,618 1,699 1,635 1,717 1,785 1,857 1,931 2,008 % of Sales 6.9% 7.1% 7.0% 7.2% 7.6% 6.5% 6.0% 6.0% 6.0% 5.5% 5.5% 5.5% 5.5% 5.5% 5.5%Plus/(minus) Changes WC (1,313) (483) (748) (167) (232) (249) (257) (270) (283) (297) (312) (325) (338) (351) (365) % of Sales -7.7% -2.4% -3.4% -0.7% -0.9% -1.0% -1.0% -1.0% -1.0% -1.0% -1.0% -1.0% -1.0% -1.0% -1.0%Subtract Cap Ex 745 801 819 943 979 1,122 1,284 1,348 1,557 1,635 1,717 1,785 1,857 1,931 2,008 Capex % of sales 4.4% 4.0% 3.8% 4.1% 4.0% 4.5% 5.0% 5.0% 5.5% 5.5% 5.5% 5.5% 5.5% 5.5% 5.5%
Free Cash Flow 1,079 2,748 2,847 3,648 3,547 3,559 3,409 3,579 3,617 3,649 3,831 3,984 4,144 4,310 4,482 % Grow th 154.7% 3.6% 28.1% -2.8% 0.3% -4.2% 5.0% 1.0% 0.9% 5.0% 4.0% 4.0% 4.0% 4.0%
NPV of Cash Flows 25,467 50%NPV of terminal value 25,901 50% Terminal Value 68,723 Projected Equity Value 51,368 100%Free Cash Flow Yield 2.14% Free Cash Yield 6.52%
Current P/E 25.5 19.3 17.4 Terminal P/E 14.2 Projected P/E 26.1 19.7 17.8 Current EV/EBITDA 17.2 13.6 12.1 Terminal EV/EBITDA 9.9 Projected EV/EBITDA 17.5 13.9 12.3
Shares Outstanding 1,948
Current Price 25.83$ premarket after preannouncementImplied equity value/share 26.37$ Upside/(Downside) to DCF 2.1%
Debt 22,360 Cash 6,343 Cash/share 3.26
26.37$ 9.00% 9.25% 9.50% 9.75% 10.00% 10.25% 10.50% 10.75% 11.00% 11.25% 11.50% 11.75%2.00% 28.24 27.23 26.29 25.41 24.58 23.79 23.06 22.36 21.70 21.08 20.49 19.932.25% 28.80 27.74 26.76 25.83 24.97 24.16 23.39 22.67 21.99 21.35 20.74 20.162.50% 29.41 28.29 27.26 26.29 25.39 24.54 23.75 23.00 22.29 21.63 21.00 20.402.75% 30.06 28.88 27.80 26.78 25.84 24.95 24.12 23.35 22.61 21.92 21.27 20.653.00% 30.76 29.52 28.38 27.31 26.32 25.39 24.53 23.72 22.95 22.24 21.56 20.923.25% 31.53 30.22 29.00 27.88 26.83 25.86 24.96 24.11 23.32 22.57 21.87 21.213.50% 32.37 30.97 29.68 28.49 27.39 26.37 25.42 24.53 23.70 22.93 22.20 21.513.75% 33.29 31.79 30.42 29.15 27.99 26.91 25.92 24.99 24.12 23.31 22.54 21.834.00% 34.29 32.69 31.22 29.88 28.64 27.50 26.45 25.47 24.56 23.71 22.92 22.174.25% 35.41 33.67 32.10 30.66 29.35 28.14 27.03 25.99 25.04 24.14 23.31 22.534.50% 36.65 34.77 33.07 31.53 30.12 28.83 27.65 26.56 25.55 24.61 23.74 22.924.75% 38.03 35.98 34.14 32.47 30.96 29.59 28.33 27.17 26.10 25.11 24.19 23.345.00% 39.59 37.34 35.33 33.52 31.89 30.42 29.07 27.84 26.70 25.66 24.69 23.795.25% 41.36 38.86 36.66 34.69 32.92 31.33 29.88 28.56 27.35 26.24 25.22 24.275.50% 43.38 40.59 38.15 35.99 34.06 32.33 30.77 29.36 28.06 26.88 25.79 24.795.75% 45.70 42.57 39.84 37.45 35.34 33.45 31.76 30.23 28.84 27.58 26.42 25.366.00% 48.42 44.85 41.78 39.11 36.77 34.70 32.85 31.20 29.70 28.34 27.10 25.976.25% 51.63 47.51 44.02 41.01 38.40 36.11 34.08 32.27 30.65 29.18 27.85 26.64

35
GOOGLE: DCF VALUATIONGoog leIn Million
Terminal Discount Rate = 11.0%Terminal FCF Growth = 5.0%
MillionsYear 2015E 2016E 2017E 2018E 2019E 2020E 2021E 2022E 2023E 2024E 2025E
Revenue 79,201 95,833 116,917 136,793 157,312 179,335 200,855 220,941 238,616 252,933 265,580 % Growth 21.0% 22.0% 17.0% 15.0% 14.0% 12.0% 10.0% 8.0% 6.0% 5.0%
Operating Income 20,617 26,642 31,382 35,566 40,901 46,627 52,222 55,235 59,654 63,233 69,051 Operating Margin 26.0% 27.8% 26.8% 26.0% 26.0% 26.0% 26.0% 25.0% 25.0% 25.0% 26.0%
Interest Income - - - - - - - - - - - Interest % of Sales 0.0% 0.0% 0.0% 0.0% 0.0% 0.0% 0.0% 0.0% 0.0% 0.0% 0.0%
Taxes 4,123 5,328 6,276 7,113 8,180 9,325 10,444 11,047 11,931 12,647 13,810 Tax Rate 20.0% 20.0% 20.0% 20.0% 20.0% 20.0% 20.0% 20.0% 20.0% 20.0% 20.0%
Net Income 16,493 21,313 25,105 28,453 32,721 37,302 41,778 44,188 47,723 50,587 55,241 % Growth 29.2% 17.8% 13.3% 15.0% 14.0% 12.0% 5.8% 8.0% 6.0% 9.2%
Add Depreciation/ Amort 4,752 5,750 7,015 10,943 14,158 17,934 20,086 24,304 26,248 30,352 34,525 % of Sales 6.0% 7.0% 8.0% 8.0% 9.0% 10.0% 10.0% 11.0% 11.0% 12.0% 13.0%Plus/ (minus) Chang es WC 2,841 2,927 3,711 3,420 3,933 4,483 5,021 5,524 5,965 6,323 6,639 % of Sales 3.6% 3.1% 3.2% 2.5% 2.5% 2.5% 2.5% 2.5% 2.5% 2.5% 2.5%Subtract Cap Ex 15,840 20,125 25,722 30,094 29,889 32,280 34,145 35,351 35,792 35,411 34,525 Capex % of sales 20.0% 21.0% 22.0% 22.0% 19.0% 18.0% 17.0% 16.0% 15.0% 14.0% 13.0%
Free Cash Flow 8,247 9,866 10,109 12,722 20,922 27,438 32,739 38,665 44,144 51,851 61,880 % Growth 19.6% 2.5% 25.8% 54.5% 31.1% 19.3% 18.1% 14.2% 17.5% 19.3%
NPV of Cash Flows 153,806 29% Terminal Value 1,082,902 NPV of terminal value 381,381 71%Firm Value 535,187 100%Less Debt 5,200 Plus Cash 68,000 Free Cash Yield 5.71%Equity Value 597,987
Terminal P/ E 19.6 Current P/ E 33,020.0 25,552.4 21,692.9 Projected P/ E 36,256.5 28,056.9 23,819.1 Terminal EV/ EBITDA 10.5 Current EV/ EBITDA 21,467.8 16,813.2 14,183.7 Projected EV/ EBITDA 23,571.9 18,461.1 15,573.9
Diluted Shares Outstanding 744,000
Current Price 732.00US$ 11/ 6/ 2015Implied equity value/ share 803.75US$ Upside/ (Downside) to DCF 9.8%
Debt 5.2 in BillionCash 68 in BillionCash/ share 13.02 in Billion
####### $539,683 $568,088 $597,987 $627,887 $659,281 $692,2459% $725.38 $689.11 $689.11 $723.57 $797.73 $923.4810% $833.44 $791.77 $791.77 $831.35 $916.57 $1,061.0411% $957.59 $909.71 $909.71 $955.20 $1,053.10 $1,219.1012% $1,100.24 $1,045.22 $1,045.22 $1,097.49 $1,209.98 $1,400.7013% $1,264.13 $1,200.93 $1,200.93 $1,260.97 $1,390.22 $1,609.36
14% $1,452.44 $1,379.82 $1,379.82 $1,448.81 $1,597.32 $1,849.09
Equity Value
Wei
ghte
d A
vera
ge C
ost
of
Capi
tal

36
Stock Presentation: Information Technology
VANTIV: DCF VALUATION
NPV[projectedequity] 10,956,609.54$
SharesOutstanding(D) 201,000 FreeCashYield 3.33% Cash 411,586.00$DCFTargetPrice 54.51$ TerminalP/E 28.37 Debt 5,035,487.00$
CurrentPrice 46.12$ TerminalEV/EBITDA 18.31
SensitivityAnalysis WACC54.51$ 7.0% 7.5% 8.0% 8.5% 9.0% 9.5% 10.0%3.5% 60.88$ 53.26$ 47.33$ 42.58$ 38.69$ 35.45$ 32.70$
TerminalGrowthRate 4.0% 68.39$ 58.66$ 51.36$ 45.67$ 41.12$ 37.39$ 34.28$4.5% 78.91$ 65.87$ 56.54$ 49.54$ 44.09$ 39.72$ 36.14$5.0% 94.69$ 75.96$ 63.45$ 54.51$ 47.80$ 42.57$ 38.38$5.5% 120.99$ 91.09$ 73.13$ 61.14$ 52.57$ 46.13$ 41.12$6.0% 173.59$ 116.30$ 87.64$ 70.42$ 58.93$ 50.71$ 44.53$6.5% 331.39$ 166.74$ 111.83$ 84.34$ 67.83$ 56.81$ 48.93$
(inthousands)YEAR 2014 2015 2016 2017 2018 2019 2020 2021 2022 2023 2024REVENUE 2,577,203.00$ 3,015,327.51$ 3,467,626.64$ 3,918,418.10$ 4,310,259.91$ 4,698,183.30$ 5,121,019.80$ 5,530,701.38$ 5,917,850.48$ 6,332,100.01$ 6,712,026.01$
%Growth 22% 17% 15% 13% 10% 9% 9% 8% 7% 7% 6%
OPERATINGINCOME 314,691.00$ 487,318.53$ 560,416.31$ 633,270.43$ 646,538.99$ 704,727.50$ 768,152.97$ 829,605.21$ 887,677.57$ 949,815.00$ 1,006,803.90$OperatingMargin 12% 16% 16% 16%
INTERESTEXPENSE 79,701.00$ 58,391.67$ 58,391.67$ 58,391.67$ 86,205.20$ 93,963.67$ 102,420.40$ 110,614.03$ 118,357.01$ 126,642.00$ 134,240.52$%ofRevenue 3% 2% 2% 1%
NON-OPINC.EXPENSE (177.00)$ 9,655.50$ 9,655.50$ 9,655.50$ 9,655.50$ 9,655.50$ 9,655.50$ 9,655.50$ 9,655.50$ 9,655.50$ 9,655.50$
TAXEXPENSE 66,177.00$ 119,648.14$ 140,508.18$ 161,298.67$ 157,147.95$ 171,539.25$ 187,225.77$ 202,424.27$ 216,786.84$ 232,154.80$ 246,249.41$
[NetIncome] 168,990.00$ 299,623.22$ 351,860.97$ 403,924.59$ 393,530.34$ 429,569.08$ 468,851.30$ 506,911.41$ 542,878.22$ 581,362.70$ 616,658.47$LESS:NItoNCI 43,698.00$ 59,924.64$ 52,779.15$ 40,392.46$ 19,676.52$ 12,887.07$ 14,065.54$ 10,138.23$ 5,428.78$ 5,813.63$ -$
%NItoNCI 26% 20% 15% 10% 5% 3% 3% 2% 1% 1% 0%
NETINCOME(ATV) 125,292.00$ 239,698.58$ 299,081.82$ 363,532.13$ 373,853.82$ 416,682.00$ 454,785.76$ 496,773.19$ 537,449.44$ 575,549.07$ 616,658.47$%Growth -6.20% 91.31% 24.77% 21.55% 2.84% 11.46% 9.14% 9.23% 8.19% 7.09% 7.14%
DEPR.&AMORT 275,069.00$ 241,226.20$ 277,410.13$ 313,473.45$ 301,718.19$ 281,891.00$ 307,261.19$ 276,535.07$ 295,892.52$ 253,284.00$ 201,360.78$%ofRevenues 7% 6% 6% 5% 5% 4% 3%
CAPEX 103,179.00$ 120,613.10$ 138,705.07$ 156,736.72$ 172,410.40$ 187,927.33$ 153,630.59$ 165,921.04$ 177,535.51$ 189,963.00$ 201,360.78$%ofRevenues 4% 4% 4% 4% 4% 4% 3% 3% 3% 3% 3%
CHANGEINWC (69,090.00)$ (22,343.62)$ (49,536.99)$ (49,371.87)$ (43,102.60)$ (32,887.28)$ (25,605.10)$ (27,653.51)$ (29,589.25)$ (31,660.50)$ (33,560.13)$%ofRevenues 2.68% 0.74% 1.43% 1.26% 1.0% 0.7% 0.5% 0.5% 0.5% 0.5% 0.5%
FREECASHFLOW(FCF) 228,092.00$ 337,968.06$ 388,249.90$ 470,896.99$ 460,059.02$ 477,758.39$ 582,811.26$ 579,733.71$ 626,217.19$ 607,209.57$ 583,098.34$%Growth 14% 48% 15% 21% -2% 4% 22% -1% 8% -3% -4%
TerminalValue 17,492,950.19$TotalFCF 337,968.06$ 388,249.90$ 470,896.99$ 460,059.02$ 477,758.39$ 582,811.26$ 579,733.71$ 626,217.19$ 607,209.57$ 18,076,048.53$
ACTUAL PROJECTED
37
Stock Presentation: Information Technology
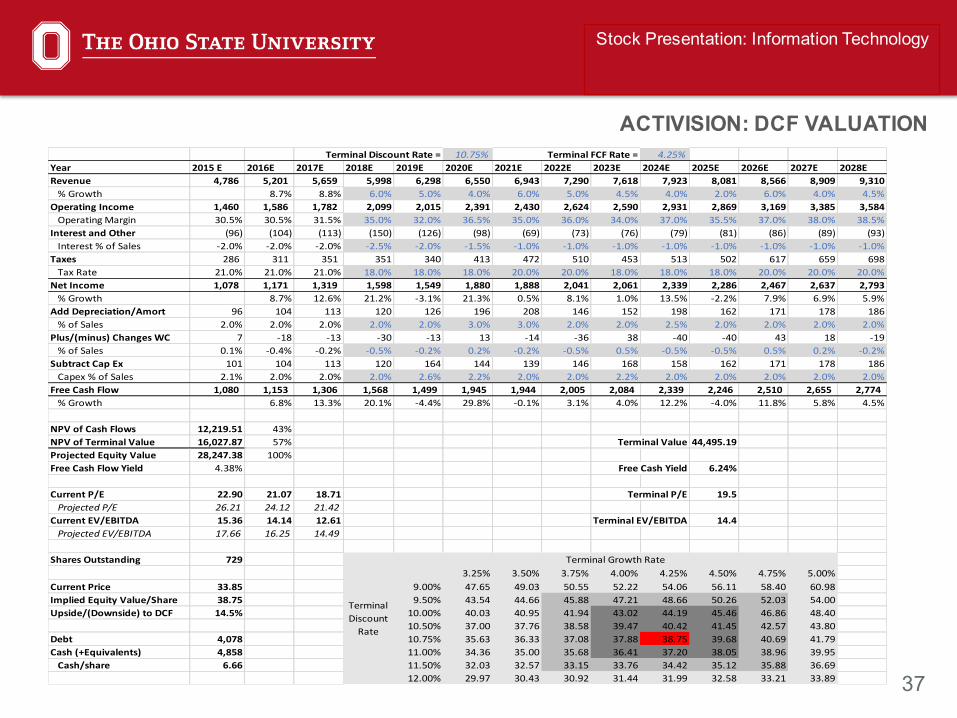
ACTIVISION: DCF VALUATION10.75% 4.25%
Year 2015E 2016E 2017E 2018E 2019E 2020E 2021E 2022E 2023E 2024E 2025E 2026E 2027E 2028ERevenue 4,786 5,201 5,659 5,998 6,298 6,550 6,943 7,290 7,618 7,923 8,081 8,566 8,909 9,310%Growth 8.7% 8.8% 6.0% 5.0% 4.0% 6.0% 5.0% 4.5% 4.0% 2.0% 6.0% 4.0% 4.5%OperatingIncome 1,460 1,586 1,782 2,099 2,015 2,391 2,430 2,624 2,590 2,931 2,869 3,169 3,385 3,584OperatingMargin 30.5% 30.5% 31.5% 35.0% 32.0% 36.5% 35.0% 36.0% 34.0% 37.0% 35.5% 37.0% 38.0% 38.5%InterestandOther (96) (104) (113) (150) (126) (98) (69) (73) (76) (79) (81) (86) (89) (93)Interest%ofSales -2.0% -2.0% -2.0% -2.5% -2.0% -1.5% -1.0% -1.0% -1.0% -1.0% -1.0% -1.0% -1.0% -1.0%Taxes 286 311 351 351 340 413 472 510 453 513 502 617 659 698TaxRate 21.0% 21.0% 21.0% 18.0% 18.0% 18.0% 20.0% 20.0% 18.0% 18.0% 18.0% 20.0% 20.0% 20.0%NetIncome 1,078 1,171 1,319 1,598 1,549 1,880 1,888 2,041 2,061 2,339 2,286 2,467 2,637 2,793%Growth 8.7% 12.6% 21.2% -3.1% 21.3% 0.5% 8.1% 1.0% 13.5% -2.2% 7.9% 6.9% 5.9%AddDepreciation/Amort 96 104 113 120 126 196 208 146 152 198 162 171 178 186%ofSales 2.0% 2.0% 2.0% 2.0% 2.0% 3.0% 3.0% 2.0% 2.0% 2.5% 2.0% 2.0% 2.0% 2.0%Plus/(minus)ChangesWC 7 -18 -13 -30 -13 13 -14 -36 38 -40 -40 43 18 -19%ofSales 0.1% -0.4% -0.2% -0.5% -0.2% 0.2% -0.2% -0.5% 0.5% -0.5% -0.5% 0.5% 0.2% -0.2%SubtractCapEx 101 104 113 120 164 144 139 146 168 158 162 171 178 186Capex%ofSales 2.1% 2.0% 2.0% 2.0% 2.6% 2.2% 2.0% 2.0% 2.2% 2.0% 2.0% 2.0% 2.0% 2.0%FreeCashFlow 1,080 1,153 1,306 1,568 1,499 1,945 1,944 2,005 2,084 2,339 2,246 2,510 2,655 2,774%Growth 6.8% 13.3% 20.1% -4.4% 29.8% -0.1% 3.1% 4.0% 12.2% -4.0% 11.8% 5.8% 4.5%
NPVofCashFlows 12,219.51 43%NPVofTerminalValue 16,027.87 57% 44,495.19ProjectedEquityValue 28,247.38 100%FreeCashFlowYield 4.38% 6.24%
CurrentP/E 22.90 21.07 18.71 19.5ProjectedP/E 26.21 24.12 21.42CurrentEV/EBITDA 15.36 14.14 12.61 14.4ProjectedEV/EBITDA 17.66 16.25 14.49
SharesOutstanding 72938.75 3.25% 3.50% 3.75% 4.00% 4.25% 4.50% 4.75% 5.00%
CurrentPrice 33.85 9.00% 47.65 49.03 50.55 52.22 54.06 56.11 58.40 60.98ImpliedEquityValue/Share 38.75 9.50% 43.54 44.66 45.88 47.21 48.66 50.26 52.03 54.00Upside/(Downside)toDCF 14.5% 10.00% 40.03 40.95 41.94 43.02 44.19 45.46 46.86 48.40
10.50% 37.00 37.76 38.58 39.47 40.42 41.45 42.57 43.80Debt 4,078 10.75% 35.63 36.33 37.08 37.88 38.75 39.68 40.69 41.79Cash(+Equivalents) 4,858 11.00% 34.36 35.00 35.68 36.41 37.20 38.05 38.96 39.95Cash/share 6.66 11.50% 32.03 32.57 33.15 33.76 34.42 35.12 35.88 36.69
12.00% 29.97 30.43 30.92 31.44 31.99 32.58 33.21 33.89
TerminalGrowthRate
TerminalDiscountRate
TerminalEV/EBITDA
TerminalDiscountRate= TerminalFCFRate=
TerminalValue
FreeCashYield
TerminalP/E

38
Sector Presentation: Information Technology
QUESTIONS?