Siltflux Workshop 1: Assessment of the impact of cattle access points on aquatic biota
25
Assessment of the impact of cattle access points on aquatic biota
-
Upload
environmental-protection-agency-ireland -
Category
Environment
-
view
33 -
download
2
Transcript of Siltflux Workshop 1: Assessment of the impact of cattle access points on aquatic biota

Assessment of the impact of cattle access points on aquatic biota

o Introduction
o Impacts of cattle access and grazing
o Aims
o Site Selection
o Methods
o Data analysis
o Results
o Concluding comments
o Future work
Outline

Introduction
o Agriculture accounts for 67% of total land use (4.5 million hectares) in the republic of Ireland (DAFM 2013)
o Of this agricultural land within the Republic of Ireland, c. 81% (3.67 million hectares) is devoted to grass
o Economic importance
o EU Water Framework Directive (Directive 2000/60/EC) o Achieve or maintain ‘good’ ecological status by 2015
o Agri-environmental (AE) schemes
o Common Agricultural Policy (CAP)
o Key policy mechanisms protecting ecosystems and conserving
natural resources (Finn & Ó hUallacháin, 2011).
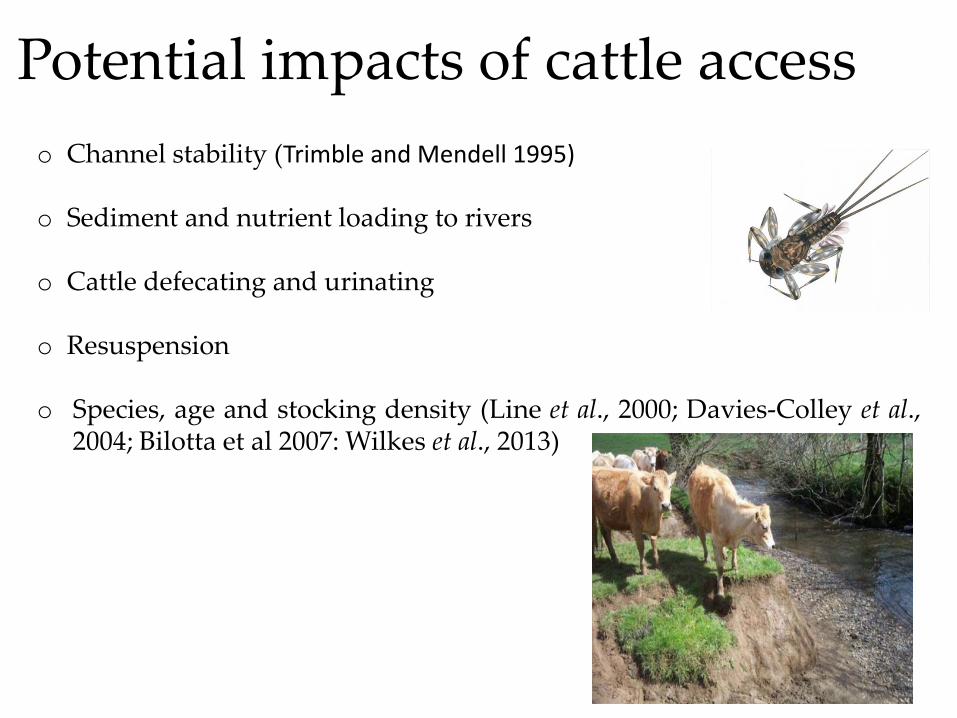
Potential impacts of cattle access
o Channel stability (Trimble and Mendell 1995) o Sediment and nutrient loading to rivers o Cattle defecating and urinating o Resuspension
o Species, age and stocking density (Line et al., 2000; Davies-Colley et al.,
2004; Bilotta et al 2007: Wilkes et al., 2013)
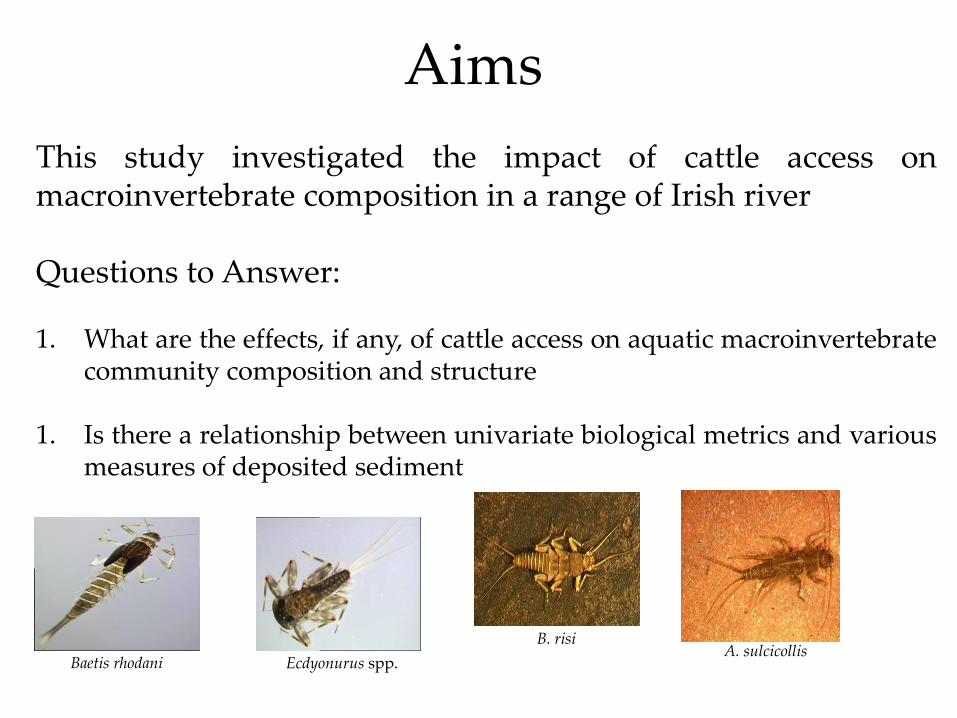
Aims
This study investigated the impact of cattle access on macroinvertebrate composition in a range of Irish river Questions to Answer: 1. What are the effects, if any, of cattle access on aquatic macroinvertebrate
community composition and structure 1. Is there a relationship between univariate biological metrics and various
measures of deposited sediment
Ecdyonurus spp. Baetis rhodani
B. risi A. sulcicollis

o Desk top study o Numerous site visits
Site selection

Selection of site visit photographs
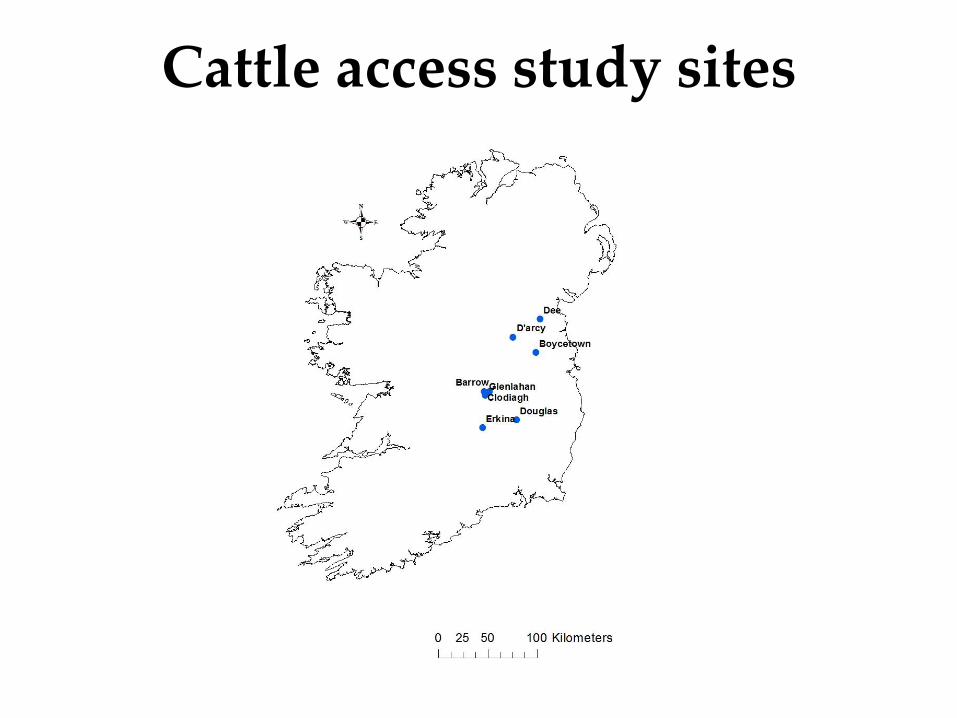
Cattle access study sites

Cattle access
point
Direction of flow
Downstream sampling location
Upstream sampling location
Riffle c. 5-7 x channel
width
Riffle c.5-7 x channel
width
Schematic showing control, upstream and downstream sampling locations
o Sampling locations c. 5-7 times channel width of each stream
o Spring & Autumn 2013 (patch & reach scale)
Six replicate surber samples Two habitats (mid channel &margin) Upstream and downstream locations
o Autumn 2013
Additional control location on four sites
o 432 Surber samples
Methods
Control sampling location
Riffle c. 5-7 x channel
width

Methods (cont’d.)
o Three methods of measuring deposited sediment Estimation of % sediment surface cover
Resuspensable sediment (g/m-2) Turbidity (NTU)
o Sediment chemistry o Water chemistry- base and high flow (ongoing)
Data Analysis o PERMANOVA analysis (across all sites) o Mann Whitney U test (individual rivers) o Generalized linear mixed models (GLMM)

Results – control/upstream mid-channels
0
2
4
6
8
10
12
14
16
Me
an t
axo
n r
ich
ne
ss Control
Upstream
0
50
100
150
200
250
300
350
400
Me
an t
axo
n a
bu
nd
ance
Control
Upstream
0
10
20
30
40
50
60
Clodiagh Erkina D'arcy's Glenlahan
Me
an %
EP
T ab
un
dan
ce
0
10
20
30
40
50
60
70
Clodiagh Erkina D'arcy's Glenlahan
Me
an %
EPT
rich
ne
ss
Mean (+/- standard error) taxon abundance, taxon richness, %EPT abundance and %EPT richness in four rivers at control and upstream sampling locations in Autumn: EPT = Ephemeroptera, Plecoptera and Trichoptera

Results -PERMANOVA analysis
Interactions Taxon
abundance
Taxon
richness
%EPT
abundance
%EPT
richness % E % P %T BMWP
Time X Site (status) X
location x habitat ns ns ns ns ns 0.0002 ns ns
Time X Site (status) X
location 0.003 ns ns ns 0.0006 ns ns ns
Time X Site (status) X
habitat 0.001 ns 0.0032 ns 0.0064 0.0068 ns ns
Time X site (status) 0.0002 0.0002 0.002 0.0002 0.0002 0.0106 0.0002 0.0002
Site (status) X
location 0.0002 0.0002 0.009 0.0002 0.0012 ns ns 0.002
Site (status) X habitat 0.0002 ns ns ns ns ns ns ns
Time = season; site = river; status = good and moderate water quality; location = upstream and downstream; habitat = mid channel and margin. EPT = Ephemeroptera, Plecoptera and Trichoptera, BMWP = Biological Monitoring Working Party : P<0.01.

Results – spring/autumn margins
0
50
100
150
200
250
300Sp
rin
g
Au
tum
n
Spri
ng
Au
tum
n
Spri
ng
Au
tum
n
Spri
ng
Au
tum
n
Spri
ng
Au
tum
n
Spri
ng
Au
tum
n
Spri
ng
Au
tum
n
Spri
ng
Au
tum
n
Douglas Erkina D'arcys Boycetown Glenlahan Barrow Clodiagh Dee
Taxo
n a
bu
nd
ance
Upstream
Downstream

0
50
100
150
200
250
300
350
400
450
Spri
ng
Au
tum
n
Spri
ng
Au
tum
n
Spri
ng
Au
tum
n
Spri
ng
Au
tum
n
Spri
ng
Au
tum
n
Spri
ng
Au
tum
n
Spri
ng
Au
tum
n
Spri
ng
Au
tum
n
Douglas Erkina D'arcys Boycetown Glenlahan Barrow Clodiagh Dee
Taxo
n a
bu
nd
ance
upstreamdownstream
Results – spring/autumn mid channels

0
50
100
150
200
250
300
350
400
Taxo
n a
bu
nd
ance
UpstreamDownstream
**
*
**
**
*
**
Mean (+/- standard error) macroinvertebrate taxon abundance and taxon richness for the Barrow, Clodiagh and Dee rivers at upstream and downstream locations across two sampling season . *p<0.05; **p<0.01
0
5
10
15
20
25
30
35
40
Spring Autumn Spring Autumn Spring Autumn
Barrow Clodiagh Dee
Taxo
n r
ich
ne
ss
** **
**
** **
Results – spring & autumn mid-channels

0
10
20
30
40
50
60
70
80
90
% E
PT
abu
nd
ance
Upstream
Downstream
*
*
*
0
10
20
30
40
50
60
70
Spring Autumn Spring Autumn Spring Autumn
Barrow Clodiagh Dee
% E
PT
rich
ne
ss
* *
**
Mean (+/- standard error) macroinvertebrate %EPT abundance and %EPT richness for the Barrow, Clodiagh and Dee rivers at upstream and downstream locations across two sampling season . *p<0.05; **p<0.01
Results – spring & autumn mid-channels

0
10
20
30
40
50
60
70
80
Spring Autumn Spring Autumn Spring Autumn
Barrow Clodiagh Dee
BM
WP
Upstream
Downstream
**
**
**
** *
Mean (+/- standard error) macroinvertebrate Biological Monitoring Working Party (BMWP) for the Barrow, Clodiagh and Dee rivers at upstream and downstream locations across two sampling season (spring and autumn). *p<0.05; **p<0.01
Results – spring & autumn mid-channels

Results Measures of deposited sediment
0
100
200
300
400
500
Spri
ng
Au
tum
n
Spri
ng
Au
tum
n
Spri
ng
Au
tum
n
Spri
ng
Au
tum
n
Spri
ng
Au
tum
n
Spri
ng
Au
tum
n
Spri
ng
Au
tum
n
Spri
ng
Au
tum
n
Douglas Erkina D'arcys Boycetown Glenlahan Barrow Clodiagh Dee
Sites
Re
sup
en
dab
le s
ed
ime
nt
(g/m
-2)
0
10
20
30
40
50
60
70
80
90%
se
dim
en
t su
rfac
e c
ove
r UpstreamDownstream

Results Sediment chemistry
0
0.5
1
1.5
2
Upstream Downstream
Tota
l Kje
ldah
l Nit
roge
n
(mgN
/g)
0
0.1
0.2
0.3
0.4
0.5
Upstream DownstreamTP
(m
g P/
g)
0
1
2
3
4
5
6
Upstream Downstream
Org
anic
mat
ter
(%)
River/site
TN (mg N/g) TP (mg P/g) Organic matter (%)
u/s d/s u/s d/s u/s d/s
Barrow 0.260 0.313 0.080 0.100 1.0 1.2
Clodiagh 0.190 0.160 0.080 0.103 1.0 1.2
Dee 0.530 0.730 0.520 0.370 2.4 2.7
Across all sites
Sediment chemistry for Barrow, Clodiagh and Dee

Barrow Clodiagh Dee
% surface cover
Increase Decrease Increase
% Organic matter Increase Increase Increase
TN Increase Decrease Increase
TP Increase Increase Decrease
Taxon abundance Decrease Decrease Increase
Taxon richness Decrease Not significant Increase
% EPT abundance Decrease Increase Increase
% EPT richness Decrease Increase Increase
BMWP Decrease Not significant Increase
Summary: Autumn samples (d/s effects)

Results – Relationship between metrics & measures deposited sediment
Preliminary work o Generalized linear mixed models (GLMM)
o Initial results indicate a significant negative relationship between
% EPT richness and % sediment surface cover
o Modelling is ongoing….

Concluding comments o Impacts are site specific o Barrow, Clodiagh and Dee: significant differences in spring and autumn samples for taxon
abundance and richness, % EPT abundance and richness and BMWP
o Clearer impact on rivers which have good status above cattle access points
Measure of deposited sediment: a number of sites showing increased sediment surface cover downstream
Sediment Chemistry: Barrow, Clodiagh and Dee downstream increases in organic matter
Relationship between metrics and measures of deposited sediment: significant negative
relationship between % EPT richness and % sediment surface cover .. Modelling ongoing
Complex effects of cattle access which needs to further assessment

Future work o Monitor sites in real time (e.g turbidity) during period of high usage
(Summer)
o Examine impact of multiple access points
o Measure downstream extent of impact o Examine influence of species, age, stocking density and time spent in
stream
o Measure levels of E. coli and other pathogens o Assess benefits of exclusion measures

Any questions

References
o DAFM 2013. Fact Sheet on Irish Agriculture – October (2013) Department of Agriculture, Food and the Marine
o Davies-Colley, R.J., Nagels, J.W., Smith, R.A., Young, R.G. & Phillips, C.J. (2004) Water quality impact of a dairy cow herd crossing a stream. New Zealand Journal of Marine and Freshwater Research, 38, 569-576
o Finn, J.A., and Ó hUallacháin, D. (2012) A review of evidence on the environmental impact of the Rural Environment Protection Scheme (REPS). Biology and Environment, Vol 112b, 11-35
o Larsen, S. Vaughan, I. P. and Ormerod, S. J. 2009. Scale-dependent effects of fine sediments on temperate headwater invertebrates. Freshwater Biology. 54, 203-219
o Line, D.E., Harman, W.A., Jennings, G.D., Thompson, E.J. & Osmond, D.L. (2000) Nonpoint-source pollutant load reductions associated with livestock exclusion. Journal of Environmental Quality, 29, 1882-1890
o Trimble, S. W. and Mendel, A. C. (1995) The cow as a geomorphic agent – a critical review. Geomorphology, 13, 233-253. o Wilkes., G., Brassard, J., Edge, T.A., Gannon, V., Jokinen, C.C., Jones, T.H., Neumann, N.,
Pintar, K.D.M., Ruecker, N., Schmidt, P.J., Sunohara, M., Topp, E. & Lapen, D.R. (2013) Bacteria, viruses, and parasites in an intermittent stream protected from and exposed to pasturing cattle: Prevalence, densities, and quantitative microbial risk assessment. Water Research, 47, 6244-6257