Silk Road Area Present-day population patterns in the area traversed by the Silk Roads.
16
Silk Road Area Present-day population patterns in the area traversed by the Silk Roads
-
Upload
buddy-higgins -
Category
Documents
-
view
214 -
download
0
Transcript of Silk Road Area Present-day population patterns in the area traversed by the Silk Roads.
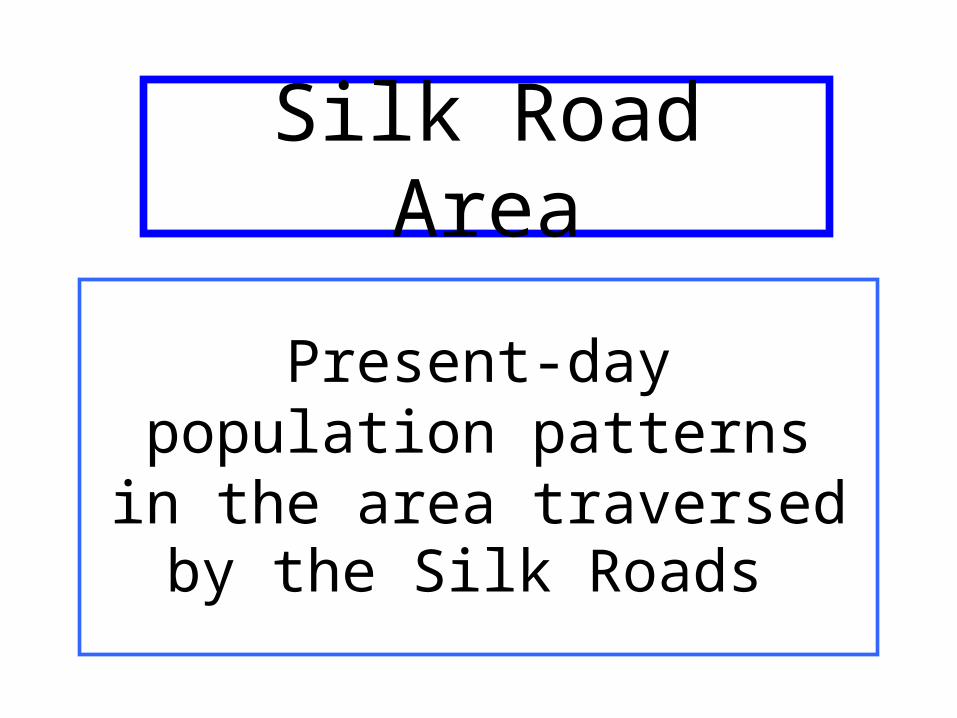
Silk Road Area
Present-daypopulation patterns
in the area traversedby the Silk Roads

These were the largest cities in 100 CE. Predict population today!
This short unit can be used as a presentation,with a teacher commenting on the slides.
Other teachers might prefer to use itas an in-class or take-home investigation,
with students making hypotheses and gathering information from the maps.
To do it that way, make copies of the maps(or overhead transparencies), or be prepared
to “shuttle” back and forth between maps.

These were the largest cities in 100 CE. Predict population today!
Start by asking students to examinethe pattern of cities in the year 100 CE.

These were the largest cities in 100 CE. Predict population today!
Here are some focus questions: -- “Are these ancient cities likely to be centers of large populations today?” -- “Which of these ancient cities do you think has continued to grow until today?” -- “What parts of this map do you think have the largest populations today?”
You might ask students to circle the ones they think still
have large populations.
Rememberto ask them for reasons
to justify their hypotheses.
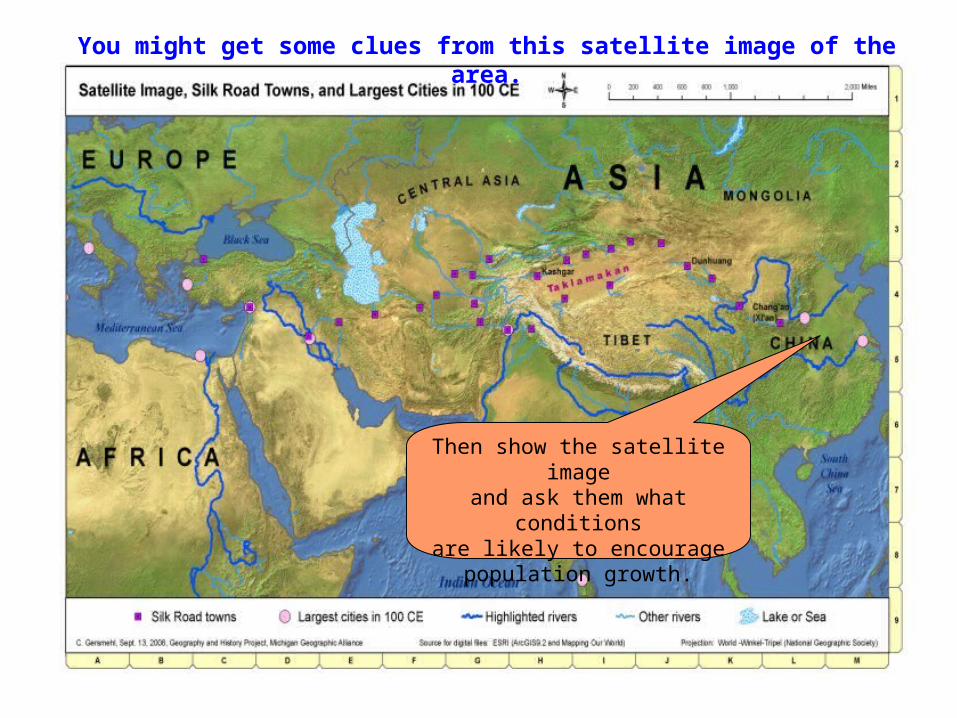
You might get some clues from this satellite image of the area.
Then show the satellite imageand ask them what conditions
are likely to encouragepopulation growth.

You might get some clues from this satellite image of the area.
. . . mountainslook “lumpy,” . . .
Remember, on this kind of satellite image,
deserts are tan, . . .
. . . and pink dots
show large cities in 100 CE.

8
This map uses dotsto show the patternof population today.
Human geography: Where is population density high? Why there?

8 “Human geography:” population density! Why in those places?
Note the large populationsin China and India.
Ask students why so manypeople live in those areas.
This map uses dotsto show the patternof population today.
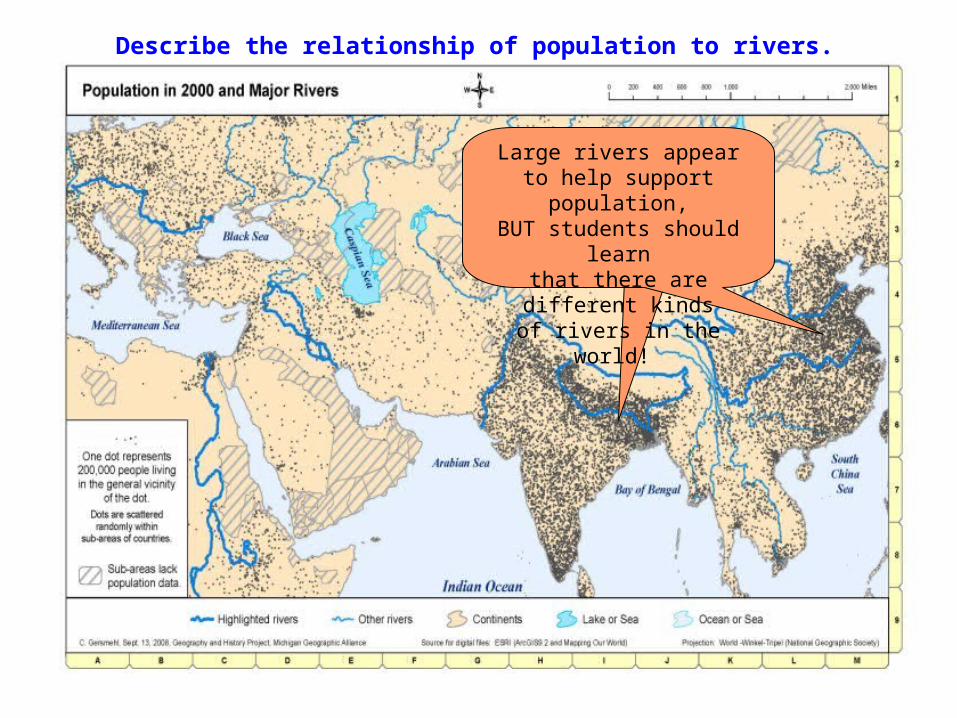
Describe the relationship of population to rivers.
Large rivers appearto help support population,BUT students should learn
that there are different kindsof rivers in the world!

Overlay “rivers” and precipitation, and compare with the population map.
Rivers that startin really high mountains
or flow through rainy areasare more likely to supportlarge human populations.

Add the major cities in 100 CE. Do they “predict” present population density?
Look back at the patternof large cities in 100 CE.
Several that werenear large rivers
were likely to continue to grow.
Silk Road Towns
This short unit examines the locations of the largest cities in the year 100 CE
in terms of the continental patternof average annual temperature
and total precipitation.

Which weather stations have the lowest temperature? The highest temperature?
Note: These weather stations are located in large, present-day cities.
This map usesan unusual “language”
- colored dots – to show the pattern
of average temperature.
Notice colder temperatures in the north
and warmer in the south.

This map shows large cities in 100 CE. Write a generalization about their temperature.
By overlaying these maps(or shuttling back and forth)
students should discoverthat most of the large cities in 100 CE
had medium temperatures(not very hot OR cold).
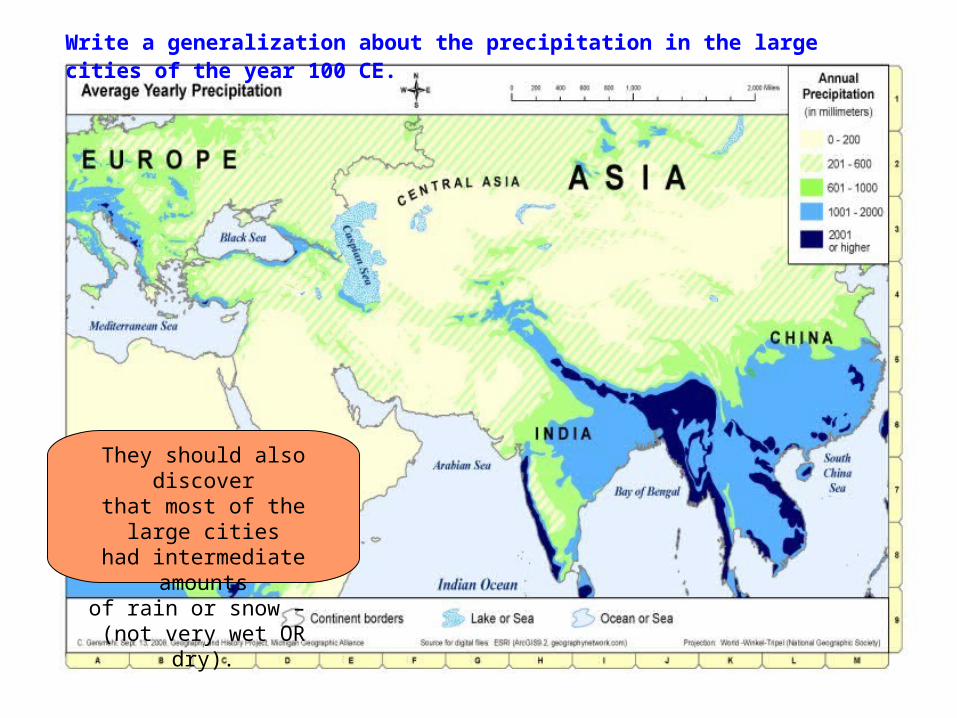
Write a generalization about the precipitation in the large cities of the year 100 CE.
They should also discoverthat most of the large citieshad intermediate amounts
of rain or snow – (not very wet OR dry).
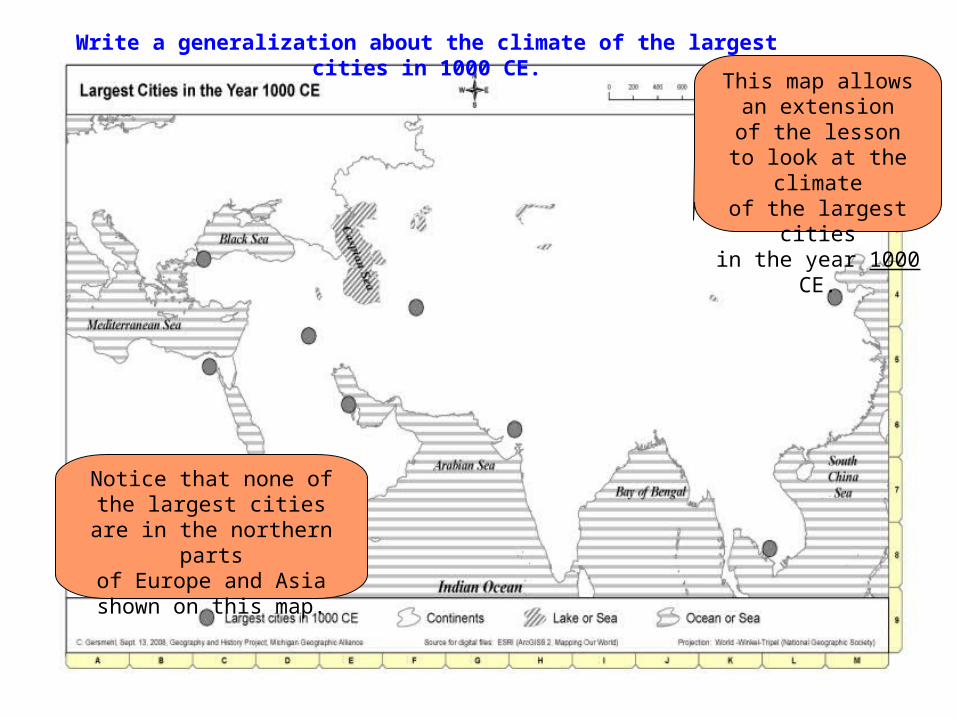
Write a generalization about the climate of the largest cities in 1000 CE.
This map allowsan extensionof the lesson
to look at the climateof the largest cities
in the year 1000 CE.
Notice that none of the largest cities are in the
northern partsof Europe and Asia shown
on this map.