Silicon Valley in Transition from Global Innovation Summit
24
Silicon Valley in Transition Global Innovation Summit + Week February 19, 2015 Mark Radcliffe, DLA Piper, Silicon Valley Office [email protected] , 650-833-2266
-
Upload
mark-radcliffe -
Category
Technology
-
view
87 -
download
1
Transcript of Silicon Valley in Transition from Global Innovation Summit

Silicon Valley in Transition
Global Innovation Summit + Week
February 19, 2015
Mark Radcliffe, DLA Piper, Silicon Valley Office
[email protected], 650-833-2266

Global Platform
Largest law firm in the
world with 4,200 lawyers in
31 countries and 77 offices
throughout Asia, Europe,
the Middle East and the US
Ranked #1 among the
world’s leading global law
firms
More than 145 DLA Piper
lawyers in IP transactions
1st in Venture Capital and
Private Equity deal volume
More than 550 DLA Piper
lawyers ranked as leaders
in their fields
2
Mark Radcliffe
Background
B.S. Chemistry, magnum cum laude, University of Michigan
Harvard Law School (l1996, Distinguished Alumni)
Practicing in Silicon Valley for over 30 years
Corporate securities and intellectual property licensing
US Private Sector Co-Chair (US Department of State/METI),
US-Japan Innovation and Entrepreneurship Council
Chair, Corporate Venture Group
Chair, International Startup Group
3

Disruptive Change
Symbian market share: 60% (2007) to >10% (2011)
We too, are standing on a “burning platform,” and we must decide how we are
going to change our behaviour.
Nokia CEO Stephen Elop (2011)
4
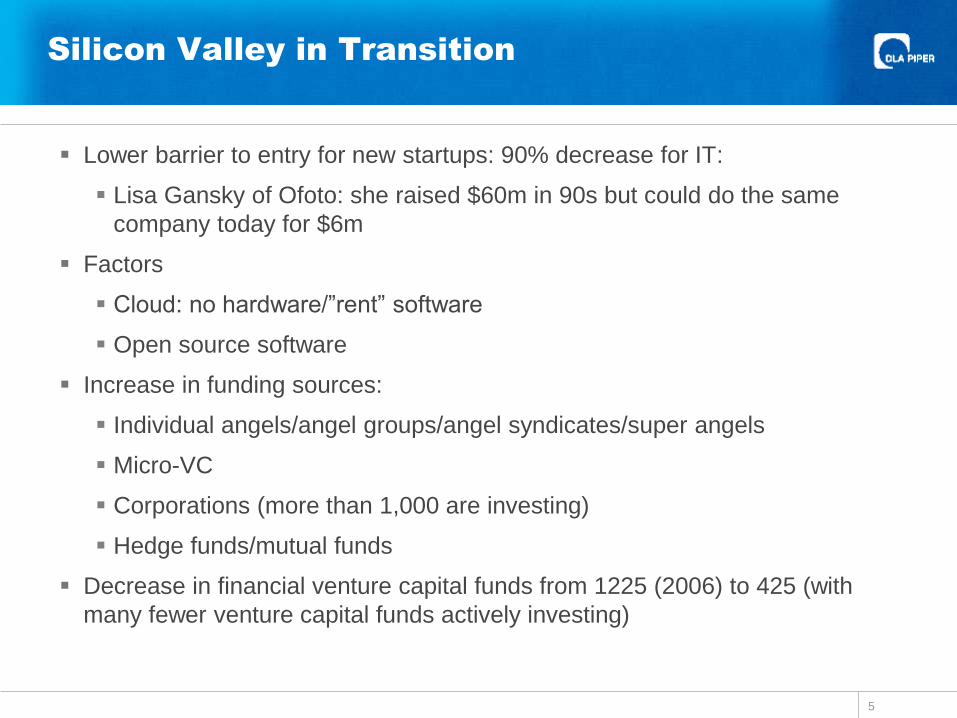
Silicon Valley in Transition
Lower barrier to entry for new startups: 90% decrease for IT:
Lisa Gansky of Ofoto: she raised $60m in 90s but could do the same
company today for $6m
Factors
Cloud: no hardware/”rent” software
Open source software
Increase in funding sources:
Individual angels/angel groups/angel syndicates/super angels
Micro-VC
Corporations (more than 1,000 are investing)
Hedge funds/mutual funds
Decrease in financial venture capital funds from 1225 (2006) to 425 (with
many fewer venture capital funds actively investing)
5
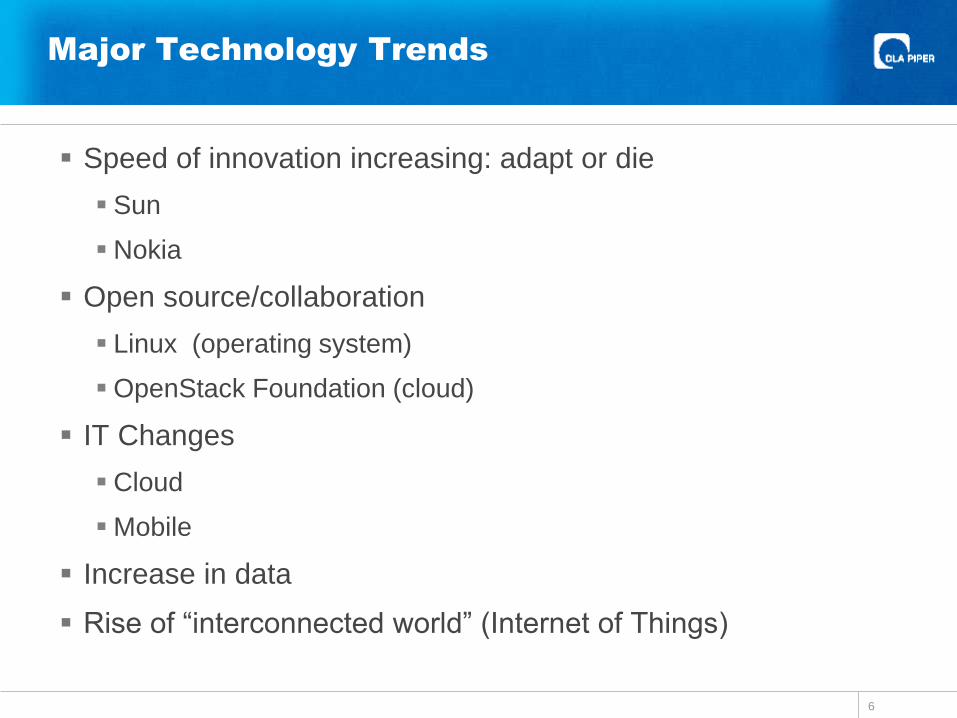
Major Technology Trends
Speed of innovation increasing: adapt or die
Sun
Nokia
Open source/collaboration
Linux (operating system)
OpenStack Foundation (cloud)
IT Changes
Cloud
Mobile
Increase in data
Rise of “interconnected world” (Internet of Things)
6
“Software is eating the world.”
Marc Andreessen - 2012
7
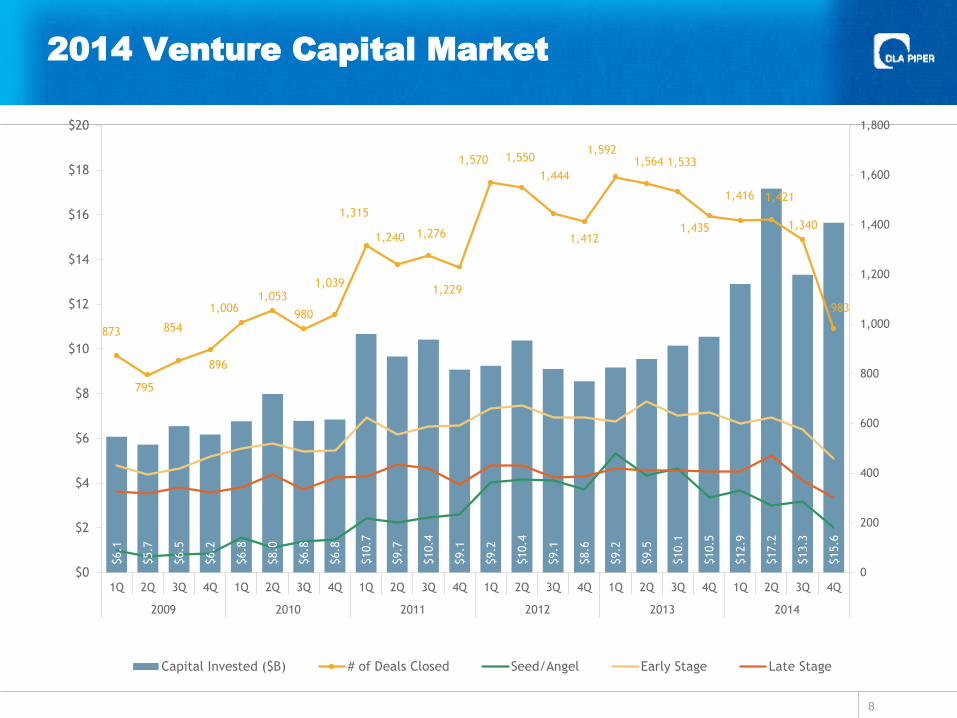
2014 Venture Capital Market
8
$6.1
$5.7
$6.5
$6.2
$6.8
$8.0
$6.8
$6.8
$10.7
$9.7
$10.4
$9.1
$9.2
$10.4
$9.1
$8.6
$9.2
$9.5
$10.1
$10.5
$12.9
$17.2
$13.3
$15.6
873
795
854
896
1,0061,053
980
1,039
1,315
1,240 1,276
1,229
1,570 1,550
1,444
1,412
1,5921,564 1,533
1,435
1,416 1,421
1,340
983
0
200
400
600
800
1,000
1,200
1,400
1,600
1,800
$0
$2
$4
$6
$8
$10
$12
$14
$16
$18
$20
1Q 2Q 3Q 4Q 1Q 2Q 3Q 4Q 1Q 2Q 3Q 4Q 1Q 2Q 3Q 4Q 1Q 2Q 3Q 4Q 1Q 2Q 3Q 4Q
2009 2010 2011 2012 2013 2014
Capital Invested ($B) # of Deals Closed Seed/Angel Early Stage Late Stage

2014 Deal by Stage
9
0% 10% 20% 30% 40% 50% 60% 70% 80% 90% 100%
1Q
2Q
3Q
4Q
1Q
2Q
3Q
4Q
1Q
2Q
3Q
4Q
2012
2013
2014
Seed/Angel Early Stage Late Stage

2014 Seed/Angel Stage
10
$72
$50
$73
$156
$143
$184
$152
$211
$217
$341
$306
$274
$343
$303
$414
$349
$269
$332
$323
$296
139
102
125132
217203
223
234
362
375
370
332
480
391
420
300329 270
287
180
0
50
100
150
200
250
300
350
400
450
500
$0
$50
$100
$150
$200
$250
$300
$350
$400
$450
1Q 2Q 3Q 4Q 1Q 2Q 3Q 4Q 1Q 2Q 3Q 4Q 1Q 2Q 3Q 4Q 1Q 2Q 3Q 4Q
2010 2011 2012 2013 2014
Capital Invested ($M) # of Deals Closed

2014 Early Stage
11
$2.9
$2.6
$2.9
$2.3
$3.3
$2.9
$3.5
$3.7
$3.0
$3.8
$3.0
$2.9
$3.1
$3.7
$3.5
$4.1
$4.5
$5.2
$4.8
$4.6
497
518
485490
622
554
589
590
662
674622 624 609
689
632
645
601
625
575
460
0
100
200
300
400
500
600
700
800
$0
$1
$2
$3
$4
$5
$6
1Q 2Q 3Q 4Q 1Q 2Q 3Q 4Q 1Q 2Q 3Q 4Q 1Q 2Q 3Q 4Q 1Q 2Q 3Q 4Q
2010 2011 2012 2013 2014
Capital Invested ($B) # of Deals Closed

Angel Group Update: Halo Report Q2 2014
Highlights
Round size drops in angel-only
deals, while syndicated round
size increases
Median pre-money valuation
continues to rise, jumping to
$3.0M from $2.7M in Q1 2014
Texas breaks into top three
most active regions; Mid-
Atlantic leads in dollars
invested
Median healthcare round size
jumps by $1M, while median
Internet round size falls by $1M
Most Active Angel Groups
Total Deals Q2 2014 (Alpha
Order)
Alliance of Angels
Central Texas Angel Network
Desert Angels
Golden Seeds
Houston Angel Network
Launchpad Venture Group
Maine Angels
Tech Coast Angels
12

Median/Mean Angel Round Size Falls in
Q2 2014
13
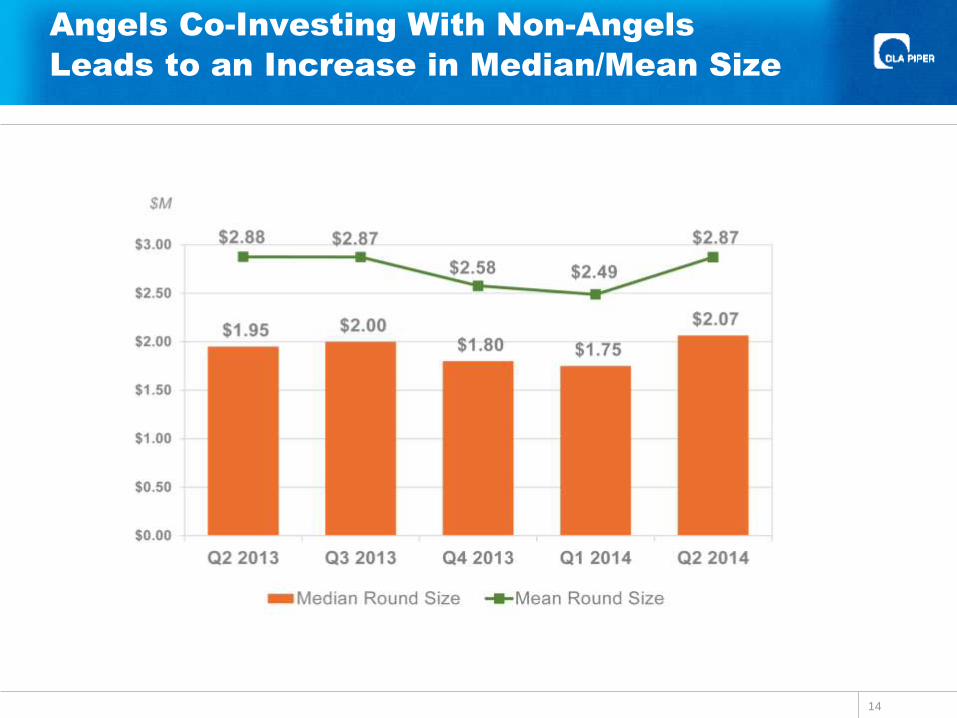
Angels Co-Investing With Non-Angels
Leads to an Increase in Median/Mean Size
14
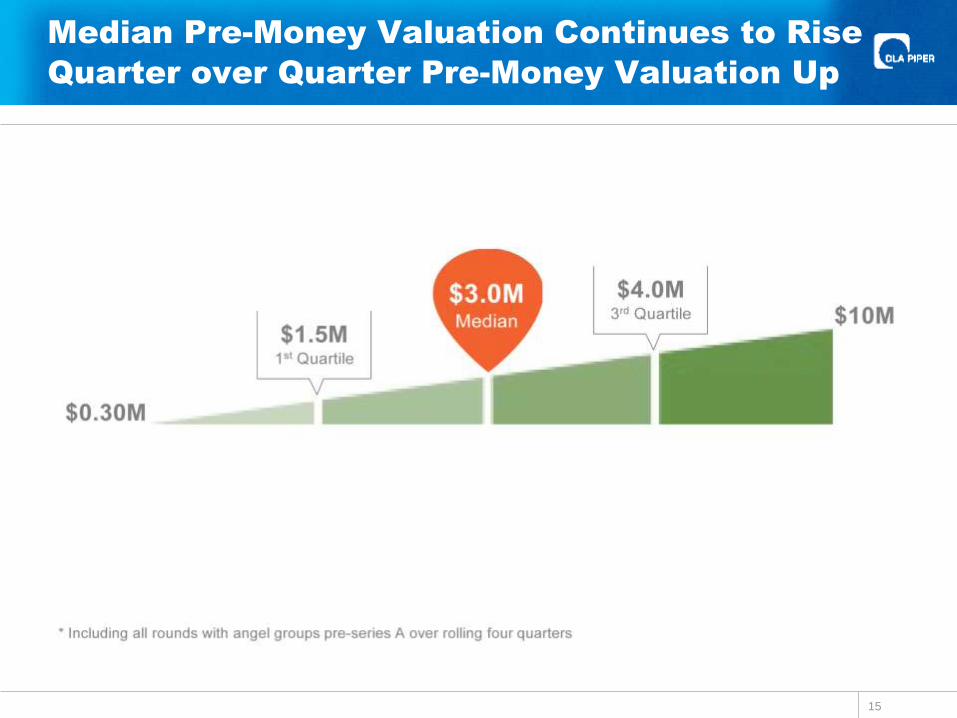
Median Pre-Money Valuation Continues to Rise
Quarter over Quarter Pre-Money Valuation Up
15

Q2 2014 Share of Angel Group Deals by Region
16

Texas Breaks Top 3 With the Mid-Atlantic
Region Close Behind
17
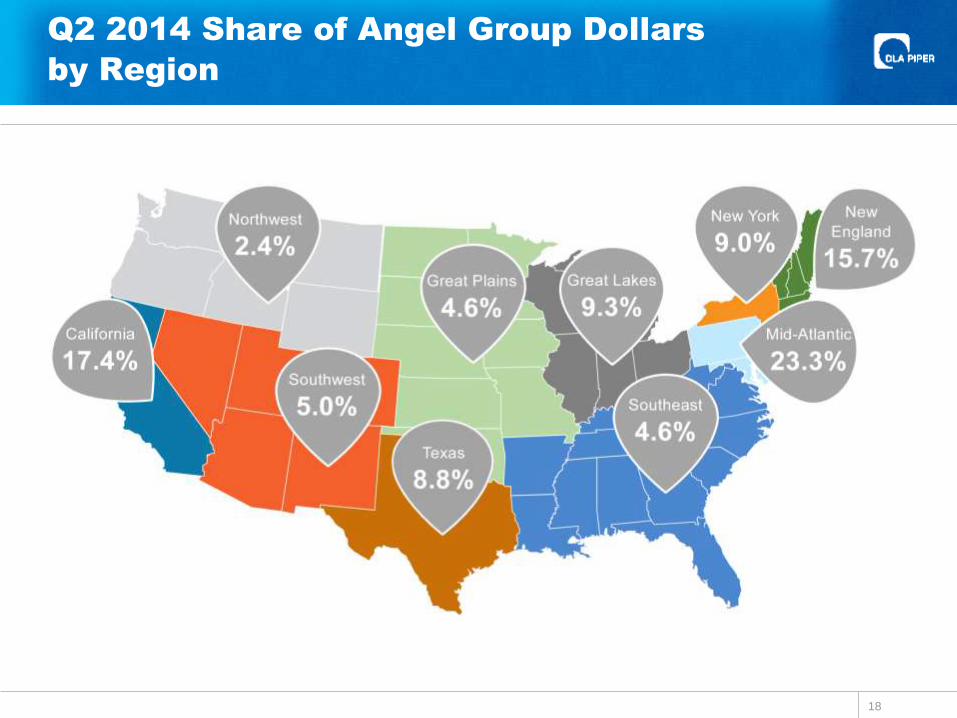
Q2 2014 Share of Angel Group Dollars
by Region
18

Healthcare & Internet Remain Stable While
Mobile Down Slightly
19
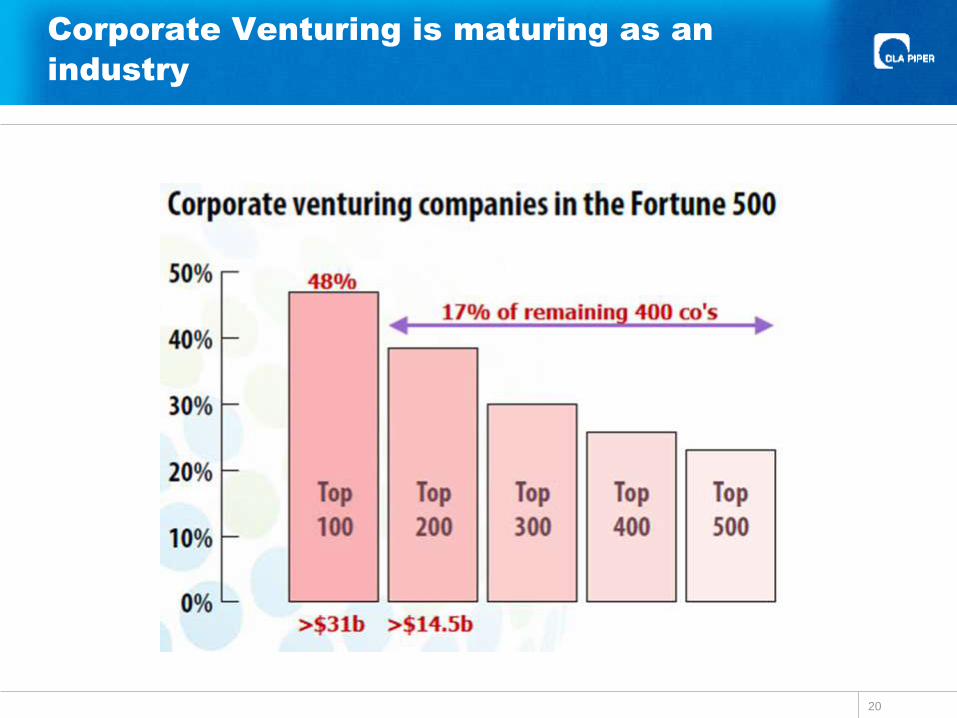
Corporate Venturing is maturing as an
industry
20
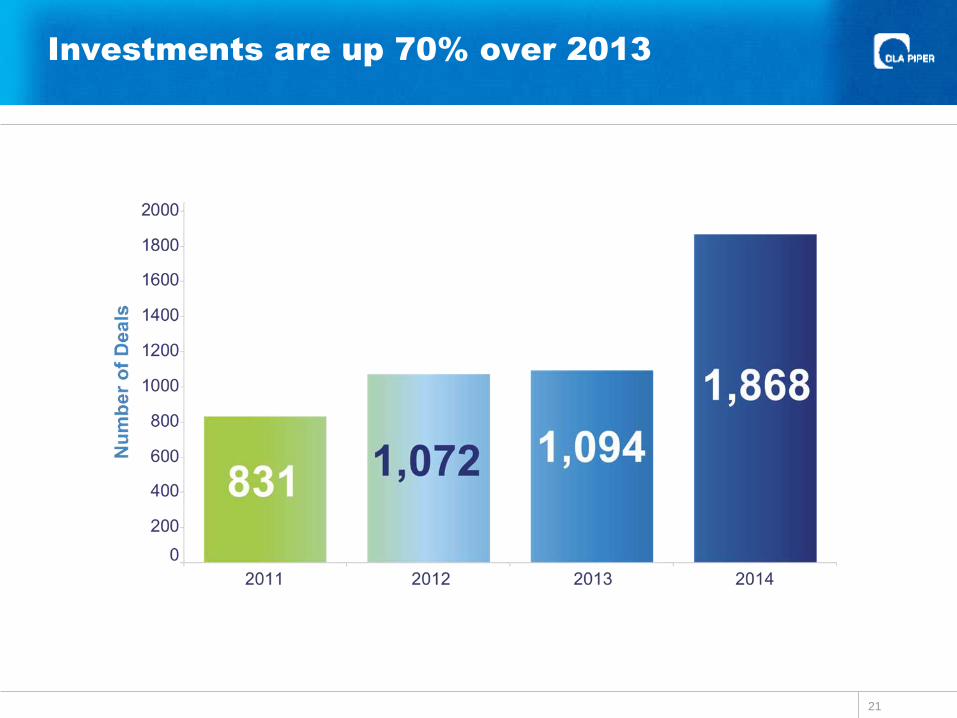
Investments are up 70% over 2013
21
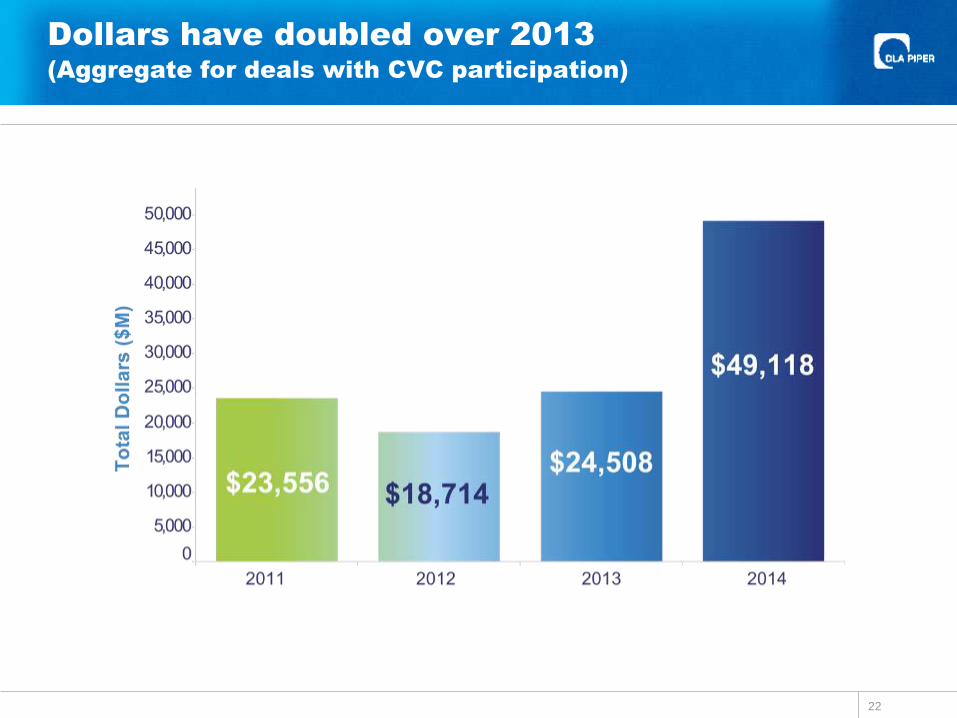
Dollars have doubled over 2013
(Aggregate for deals with CVC participation)
22

2014 Investments
Seed and Series A – D Rounds
23
Summary
IT critical in more industries
Cars: mobile computers
Smart Phones: displacing PCs and now tablets
Disruptive technology changes in IT
Innovation is accelerating in multiple industries
Startups emerging across the globe
Funding ecosystem becoming more complex
Silicon Valley retains its primary position
24