SIKA MEDIA AND INVESTOR PRESENTATION FEBRUARY 22, 2019
47
RECORD RESULTS IN 2018 SIKA MEDIA AND INVESTOR PRESENTATION FEBRUARY 22, 2019
Transcript of SIKA MEDIA AND INVESTOR PRESENTATION FEBRUARY 22, 2019
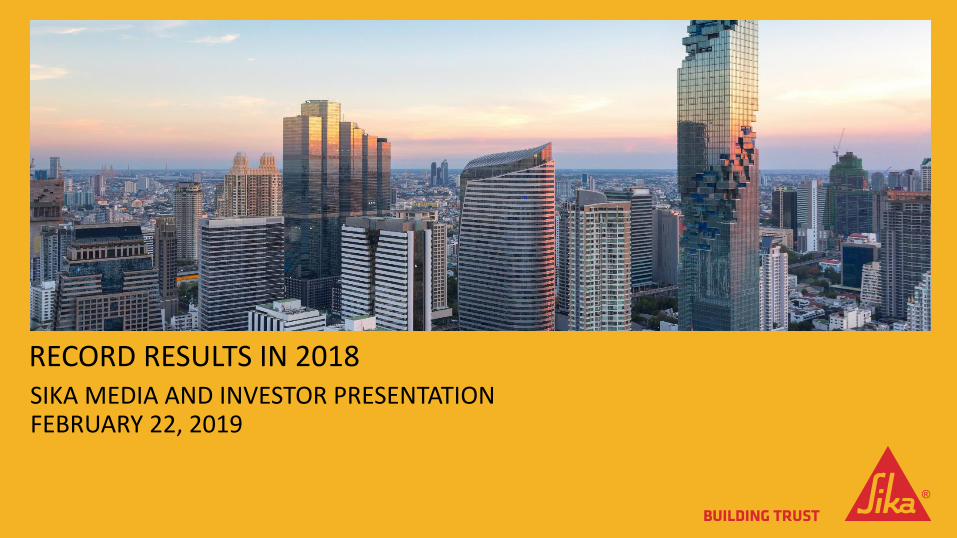
RECORD RESULTS IN 2018SIKA MEDIA AND INVESTOR PRESENTATIONFEBRUARY 22, 2019
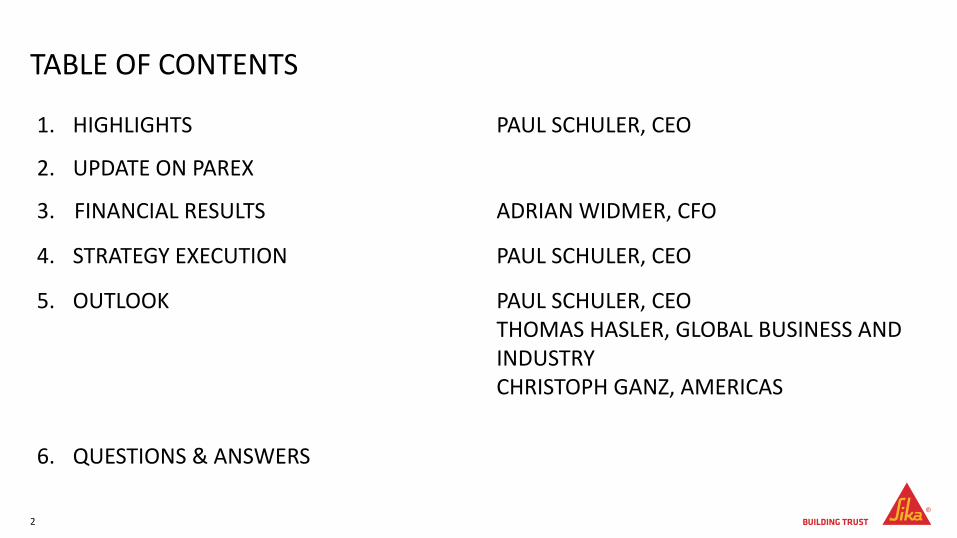
TABLE OF CONTENTS
2
1. HIGHLIGHTS
2. UPDATE ON PAREX
PAUL SCHULER, CEO
3. FINANCIAL RESULTS ADRIAN WIDMER, CFO
4. STRATEGY EXECUTION PAUL SCHULER, CEO
5. OUTLOOK PAUL SCHULER, CEOTHOMAS HASLER, GLOBAL BUSINESS AND INDUSTRYCHRISTOPH GANZ, AMERICAS
6. QUESTIONS & ANSWERS

1. HIGHLIGHTS
PAUL SCHULER, CEO
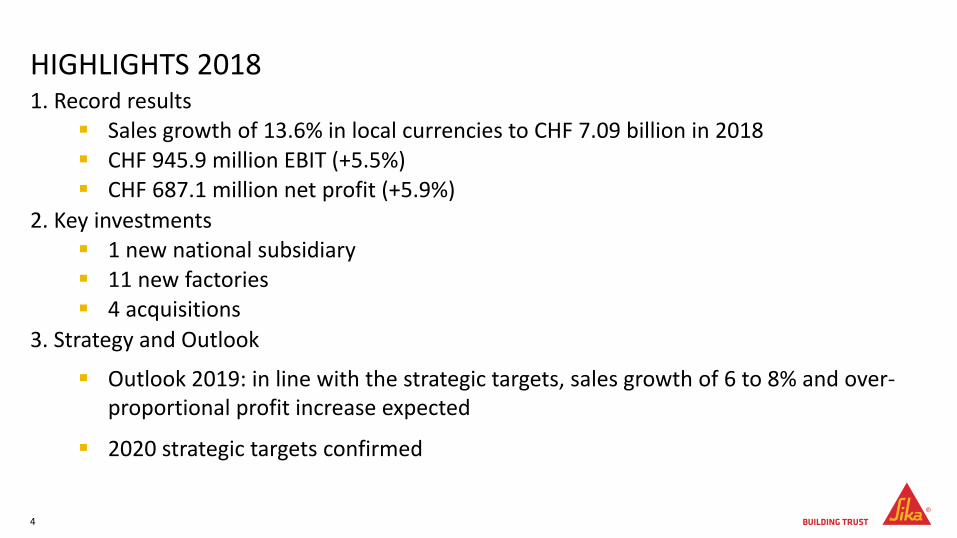
1. Record results Sales growth of 13.6% in local currencies to CHF 7.09 billion in 2018 CHF 945.9 million EBIT (+5.5%) CHF 687.1 million net profit (+5.9%)
2. Key investments 1 new national subsidiary 11 new factories 4 acquisitions
3. Strategy and Outlook
Outlook 2019: in line with the strategic targets, sales growth of 6 to 8% and over-proportional profit increase expected
2020 strategic targets confirmed
HIGHLIGHTS 2018
4
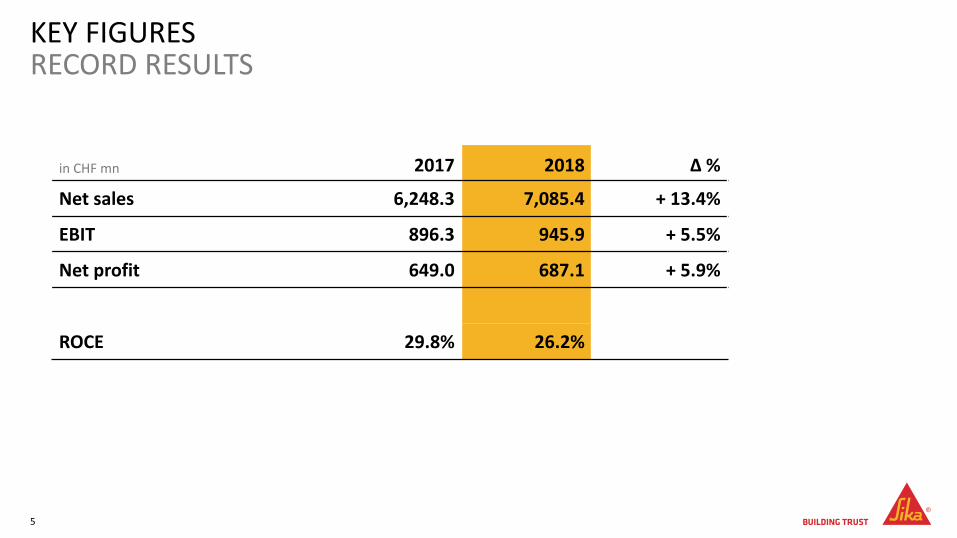
KEY FIGURESRECORD RESULTS
5
in CHF mn 2017 2018 Δ %
Net sales 6,248.3 7,085.4 + 13.4%
EBIT 896.3 945.9 + 5.5%
Net profit 649.0 687.1 + 5.9%
ROCE 29.8% 26.2%
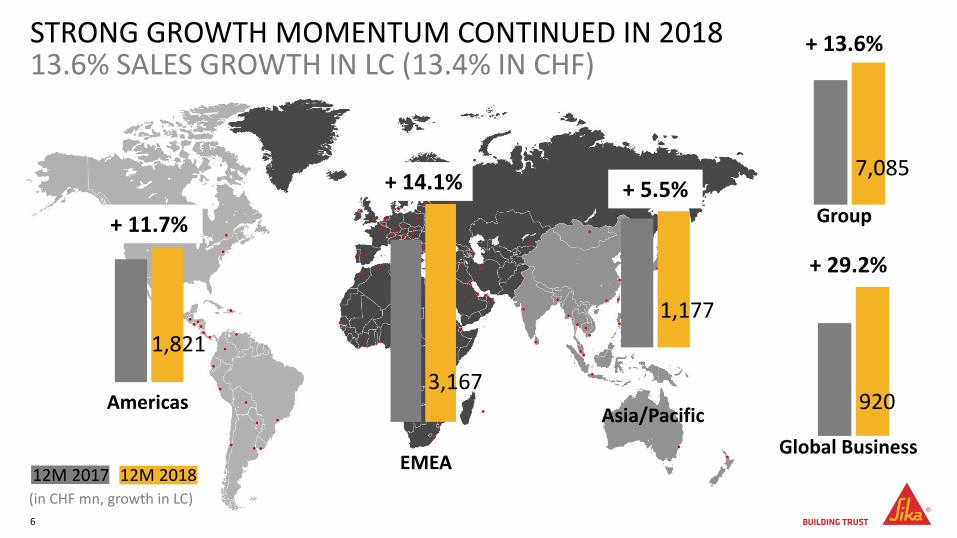
STRONG GROWTH MOMENTUM CONTINUED IN 201813.6% SALES GROWTH IN LC (13.4% IN CHF)
+ 14.1%
Americas
EMEA
Asia/Pacific
(in CHF mn, growth in LC)
+ 5.5%
+ 11.7%
12M 2017 12M 2018
Global Business
+ 29.2%
6
3,167
1,177
920
1,821
Group
+ 13.6%
7,085
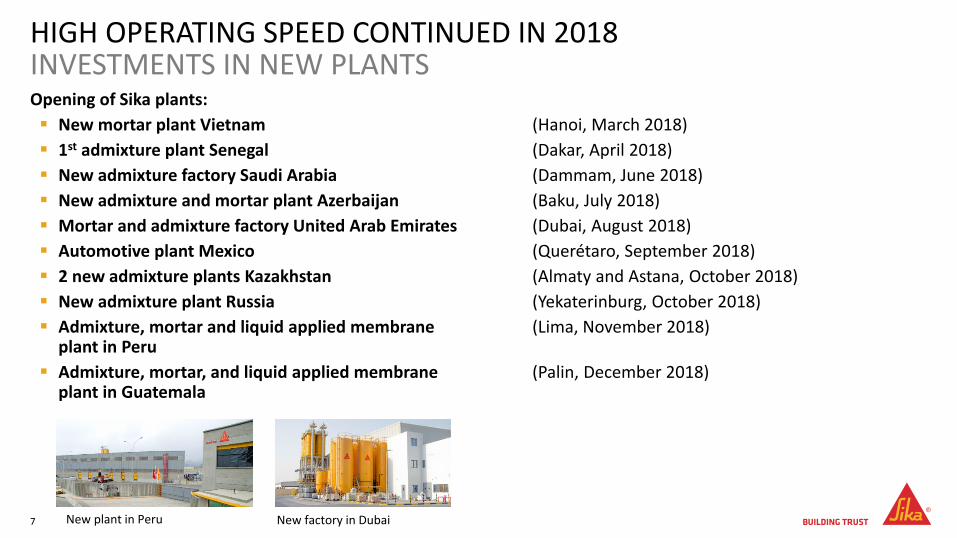
Opening of Sika plants:
New mortar plant Vietnam (Hanoi, March 2018)
1st admixture plant Senegal (Dakar, April 2018)
New admixture factory Saudi Arabia (Dammam, June 2018)
New admixture and mortar plant Azerbaijan (Baku, July 2018)
Mortar and admixture factory United Arab Emirates (Dubai, August 2018)
Automotive plant Mexico (Querétaro, September 2018)
2 new admixture plants Kazakhstan (Almaty and Astana, October 2018)
New admixture plant Russia (Yekaterinburg, October 2018)
Admixture, mortar and liquid applied membrane (Lima, November 2018)plant in Peru
Admixture, mortar, and liquid applied membrane (Palin, December 2018)plant in Guatemala
HIGH OPERATING SPEED CONTINUED IN 2018INVESTMENTS IN NEW PLANTS
7 New plant in Peru New factory in Dubai
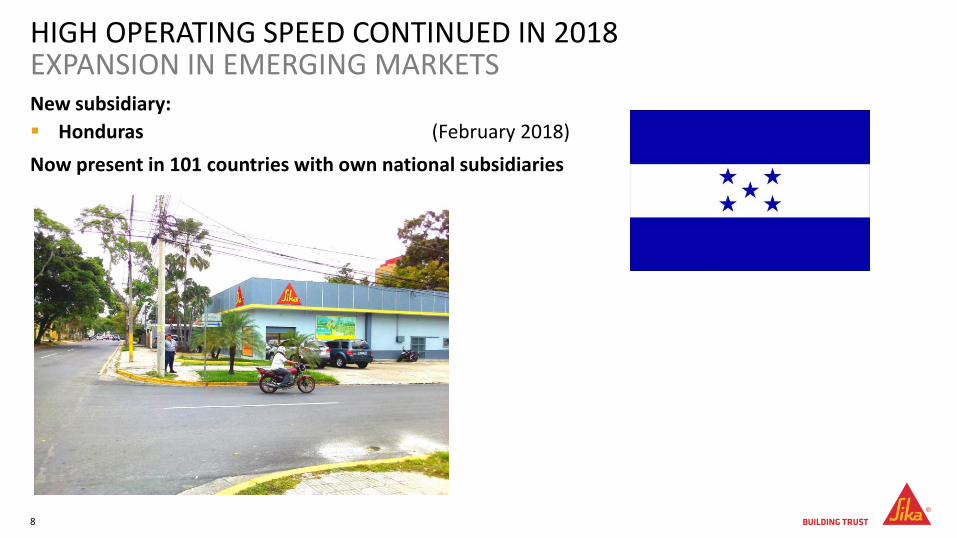
New subsidiary:
Honduras (February 2018)
Now present in 101 countries with own national subsidiaries
HIGH OPERATING SPEED CONTINUED IN 2018 EXPANSION IN EMERGING MARKETS
8
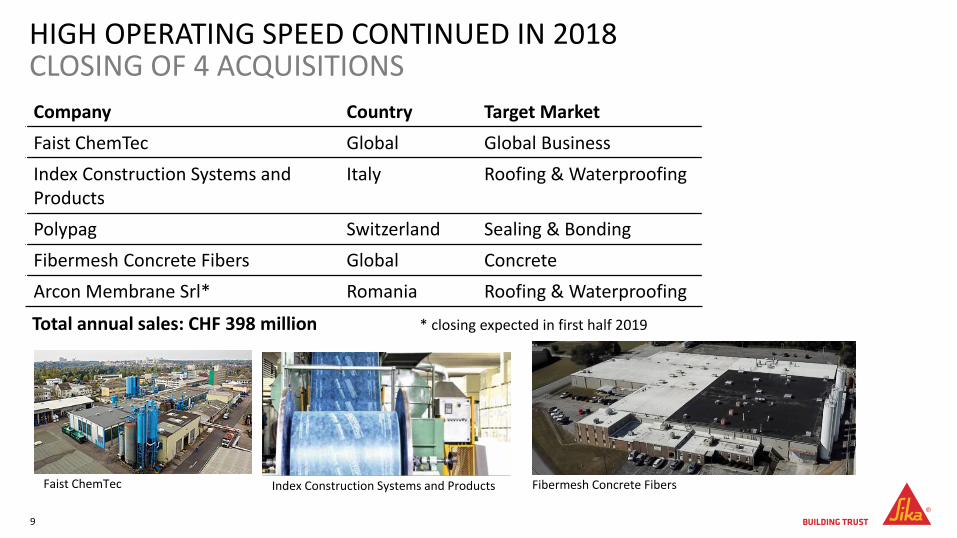
HIGH OPERATING SPEED CONTINUED IN 2018CLOSING OF 4 ACQUISITIONS
Company Country Target Market
Faist ChemTec Global Global Business
Index Construction Systems andProducts
Italy Roofing & Waterproofing
Polypag Switzerland Sealing & Bonding
Fibermesh Concrete Fibers Global Concrete
Arcon Membrane Srl* Romania Roofing & Waterproofing
Total annual sales: CHF 398 million * closing expected in first half 2019
9
Faist ChemTec Index Construction Systems and Products Fibermesh Concrete Fibers
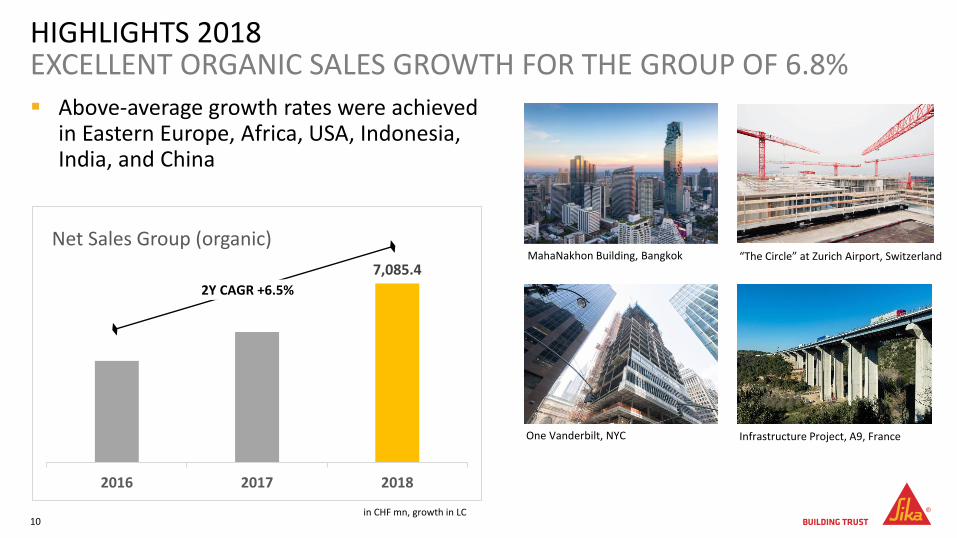
7,085.4
2016 2017 2018
Net Sales Group (organic)
2Y CAGR +6.5%
HIGHLIGHTS 2018EXCELLENT ORGANIC SALES GROWTH FOR THE GROUP OF 6.8%
10
Above-average growth rates were achieved in Eastern Europe, Africa, USA, Indonesia, India, and China
“The Circle” at Zurich Airport, Switzerland
One Vanderbilt, NYC
MahaNakhon Building, Bangkok
Infrastructure Project, A9, France
in CHF mn, growth in LC
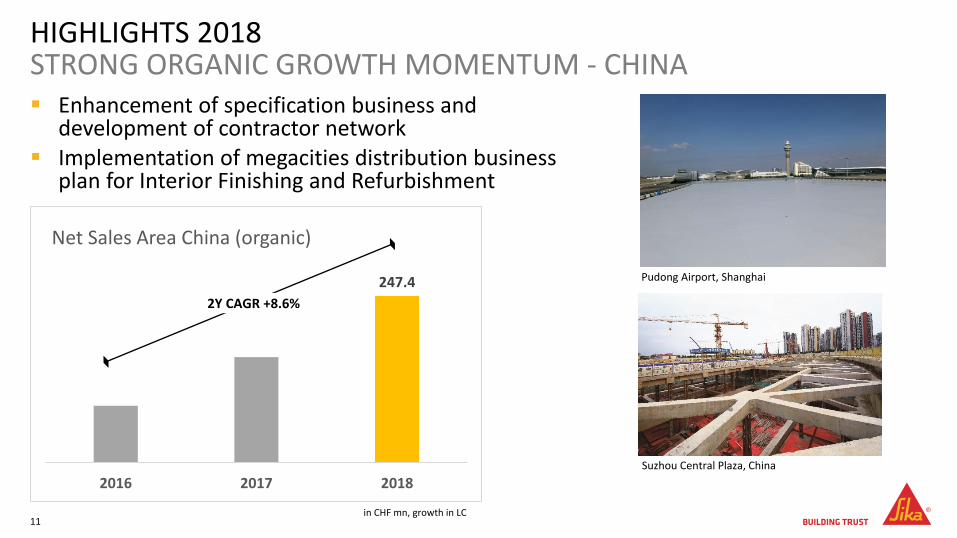
247.4
2016 2017 2018
Net Sales Area China (organic)
2Y CAGR +8.6%
Pudong Airport, Shanghai
Suzhou Central Plaza, China
Enhancement of specification business and development of contractor network
Implementation of megacities distribution business plan for Interior Finishing and Refurbishment
HIGHLIGHTS 2018STRONG ORGANIC GROWTH MOMENTUM - CHINA
11in CHF mn, growth in LC
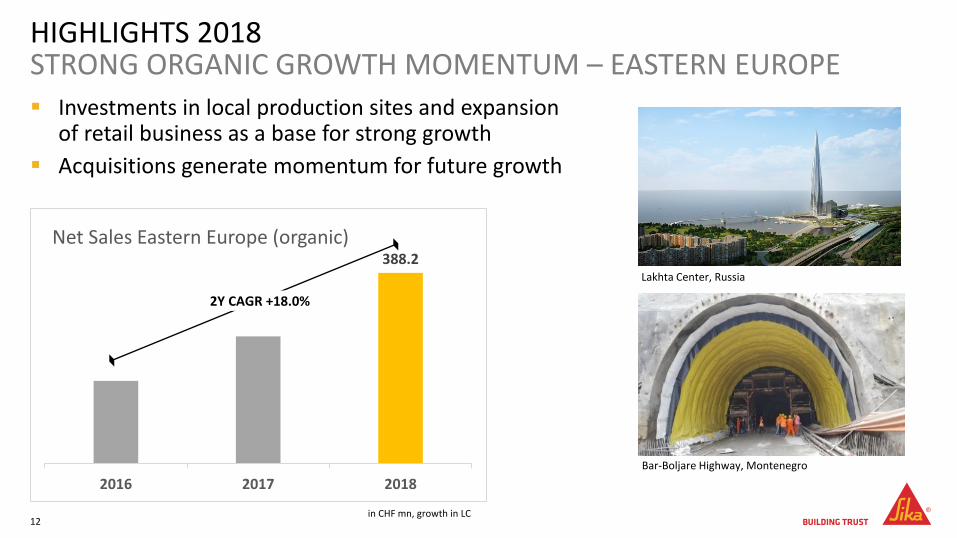
388.2
2016 2017 2018
Net Sales Eastern Europe (organic)
2Y CAGR +18.0%
HIGHLIGHTS 2018STRONG ORGANIC GROWTH MOMENTUM – EASTERN EUROPE
12
Investments in local production sites and expansion of retail business as a base for strong growth
Acquisitions generate momentum for future growth
Lakhta Center, Russia
Bar-Boljare Highway, Montenegro
in CHF mn, growth in LC
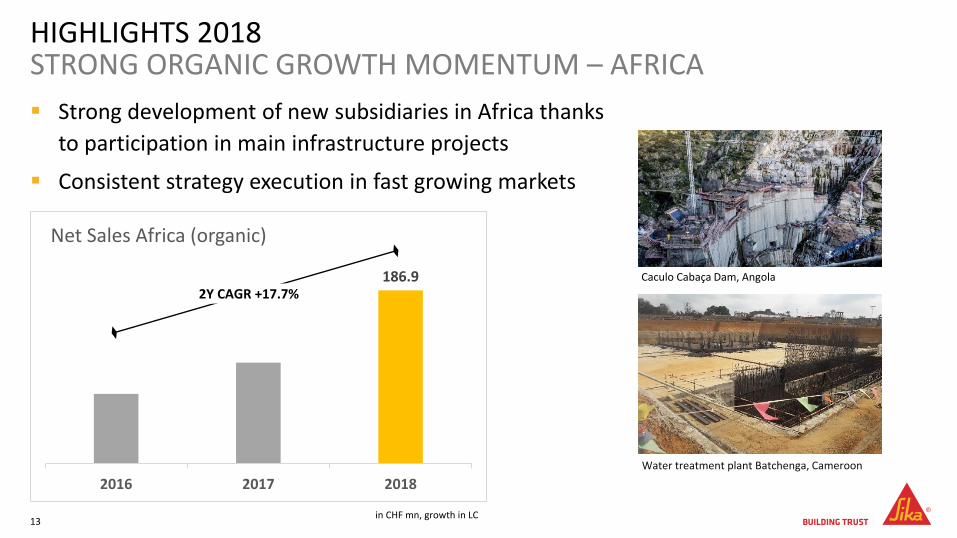
186.9
2016 2017 2018
Net Sales Africa (organic)
2Y CAGR +17.7%
HIGHLIGHTS 2018STRONG ORGANIC GROWTH MOMENTUM – AFRICA
13
Strong development of new subsidiaries in Africa thanks
to participation in main infrastructure projects
Consistent strategy execution in fast growing markets
Caculo Cabaça Dam, Angola
Water treatment plant Batchenga, Cameroon
in CHF mn, growth in LC
90.0%
95.0%
100.0%
105.0%
110.0%
115.0%
45.0%
50.0%
55.0%
60.0%
65.0%
2015 2016 2017 2018
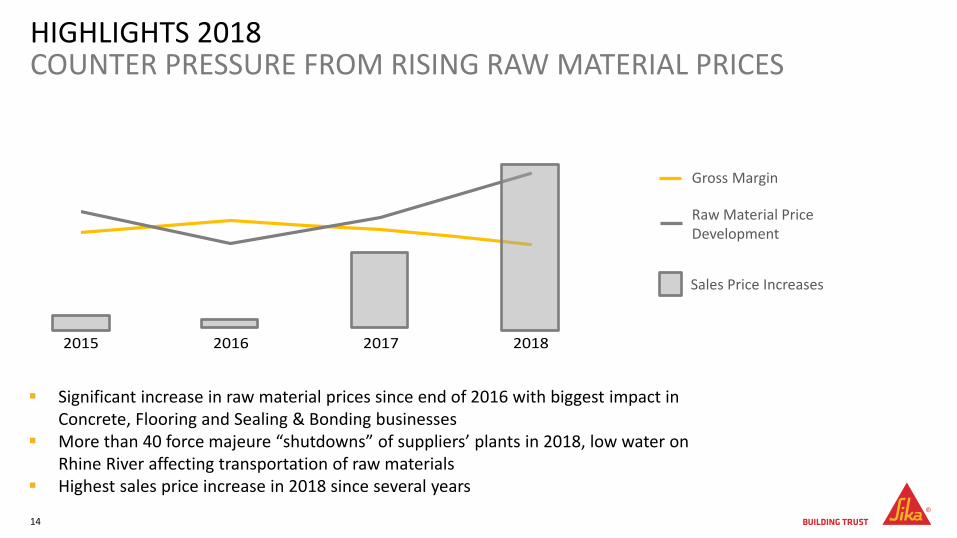
HIGHLIGHTS 2018 COUNTER PRESSURE FROM RISING RAW MATERIAL PRICES
14
Sales Price Increases
Gross Margin
Raw Material Price Development
Significant increase in raw material prices since end of 2016 with biggest impact in Concrete, Flooring and Sealing & Bonding businesses
More than 40 force majeure “shutdowns” of suppliers’ plants in 2018, low water on Rhine River affecting transportation of raw materials
Highest sales price increase in 2018 since several years
HIGHLIGHTS 2018EFFICIENCY IMPROVEMENTS TO COUNTER PRESSURE ON MARGINS
15
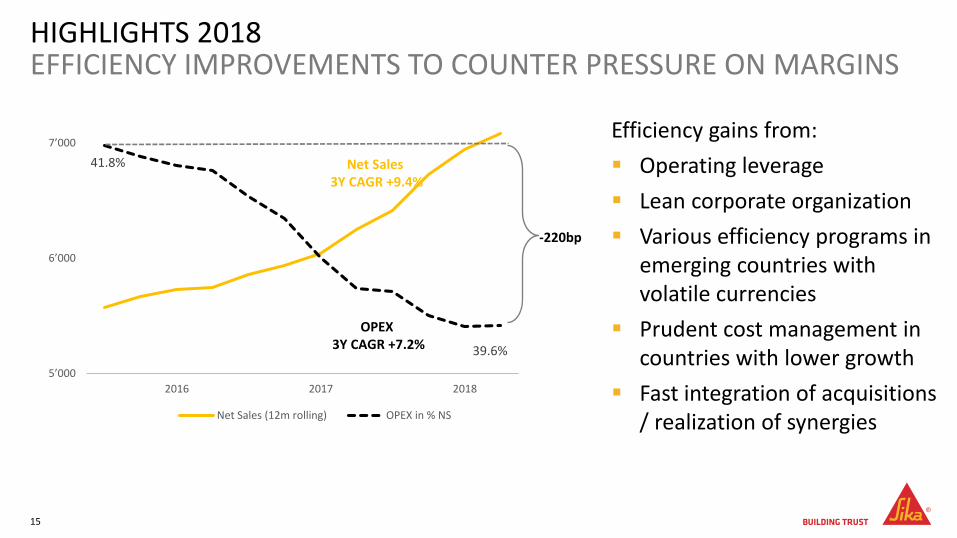
Efficiency gains from:
Operating leverage
Lean corporate organization
Various efficiency programs in emerging countries with volatile currencies
Prudent cost management in countries with lower growth
Fast integration of acquisitions / realization of synergies
41.8%
39.6%
5’000
6’000
7’000
2016 2017 2018
Net Sales (12m rolling) OPEX in % NS
Net Sales 3Y CAGR +9.4%
OPEX 3Y CAGR +7.2%
-220bp
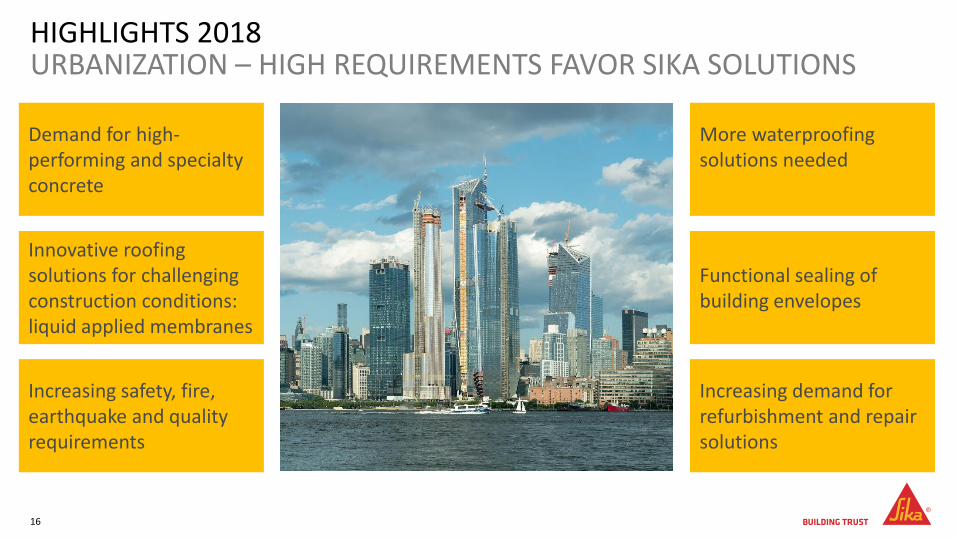
HIGHLIGHTS 2018URBANIZATION – HIGH REQUIREMENTS FAVOR SIKA SOLUTIONS
Demand for high-performing and specialtyconcrete
Innovative roofingsolutions for challengingconstruction conditions: liquid applied membranes
Increasing safety, fire, earthquake and qualityrequirements
More waterproofingsolutions needed
Functional sealing ofbuilding envelopes
Increasing demand forrefurbishment and repairsolutions
16
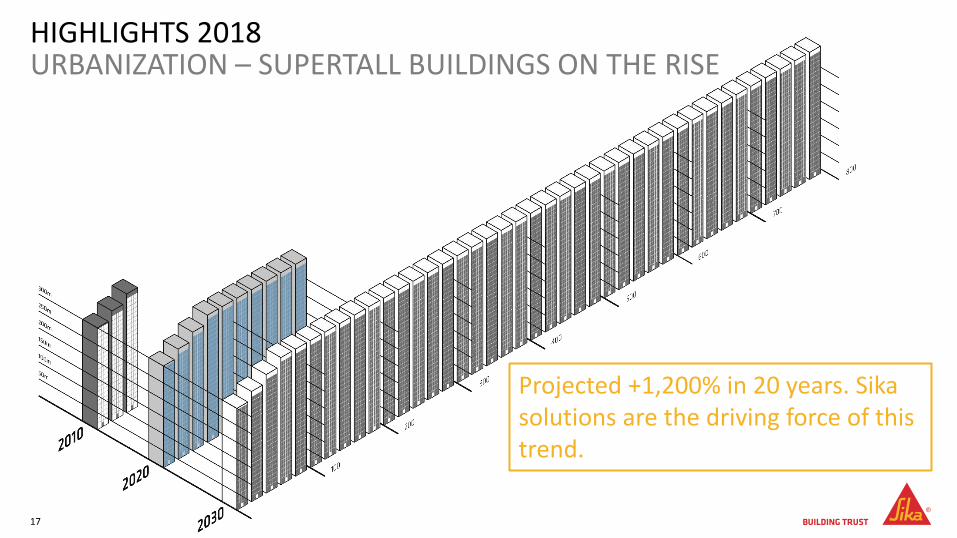
HIGHLIGHTS 2018URBANIZATION – SUPERTALL BUILDINGS ON THE RISE
17
Projected +1,200% in 20 years. Sika solutions are the driving force of thistrend.
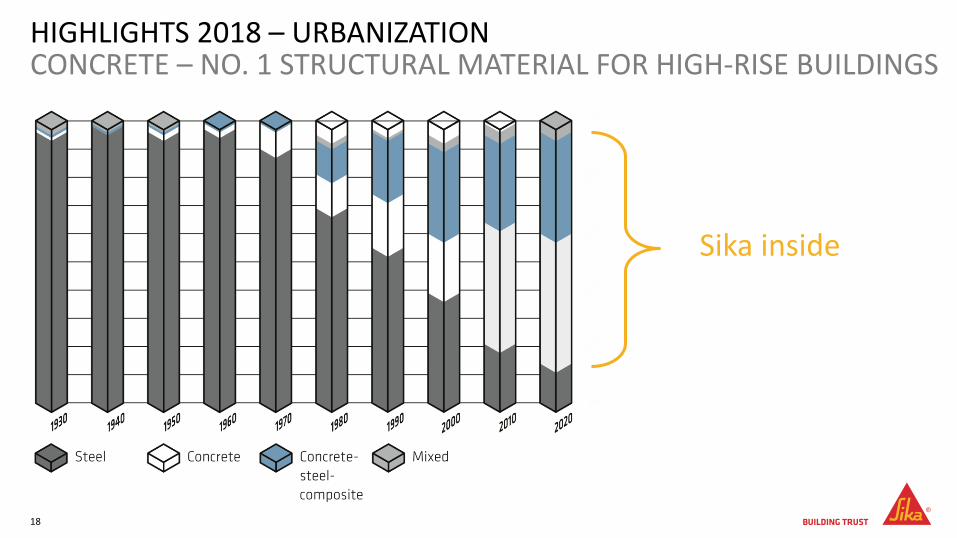
HIGHLIGHTS 2018 – URBANIZATIONCONCRETE – NO. 1 STRUCTURAL MATERIAL FOR HIGH-RISE BUILDINGS
18
Sika inside
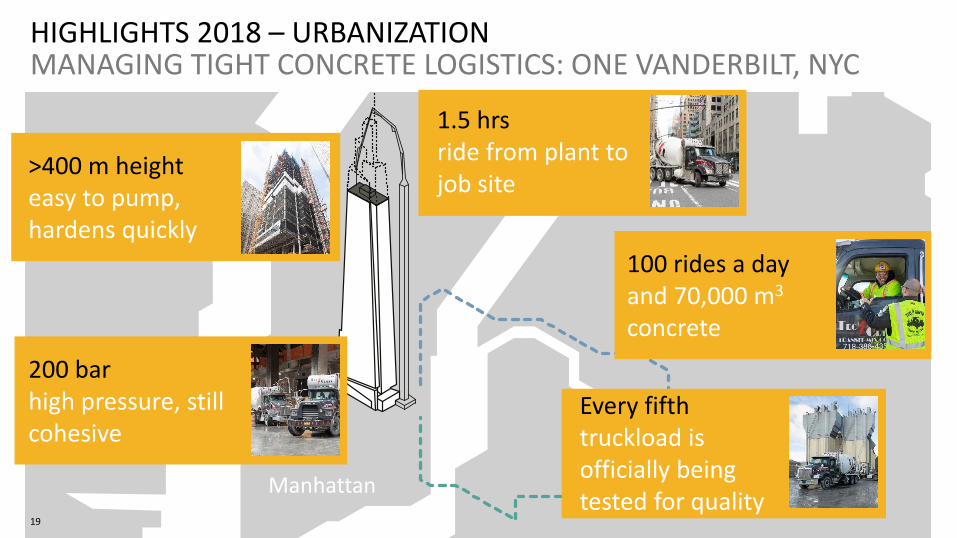
HIGHLIGHTS 2018 – URBANIZATIONMANAGING TIGHT CONCRETE LOGISTICS: ONE VANDERBILT, NYC
19
Manhattan
Mixing Plant
>400 m heighteasy to pump, hardens quickly
1.5 hrsride from plant tojob site
100 rides a dayand 70,000 m3
concrete
200 barhigh pressure, still cohesive
Every fifthtruckload isofficially beingtested for quality

2. UPDATE ON PAREX
PAUL SCHULER, CEO
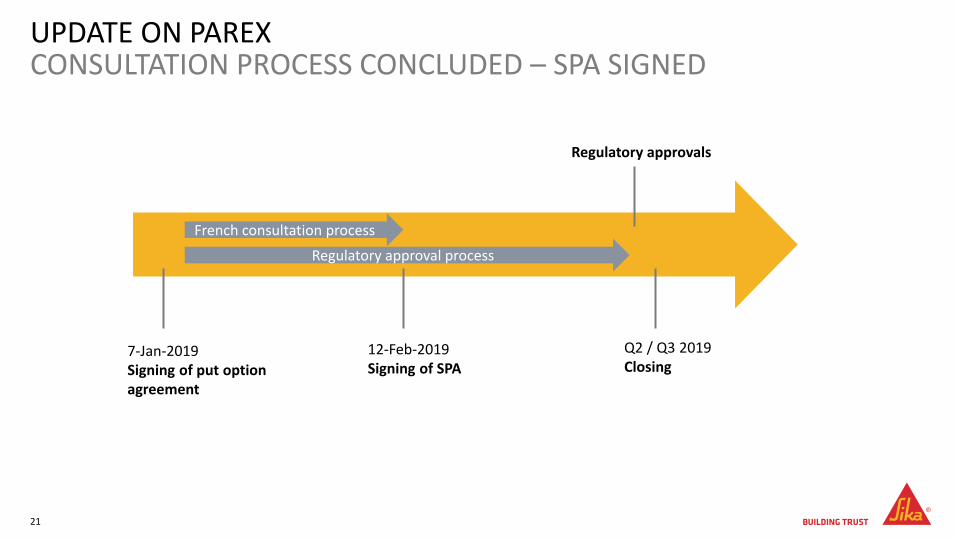
UPDATE ON PAREXCONSULTATION PROCESS CONCLUDED – SPA SIGNED
21
7-Jan-2019Signing of put option agreement
Q2 / Q3 2019Closing
Regulatory approval process
12-Feb-2019Signing of SPA
Regulatory approvals
French consultation process
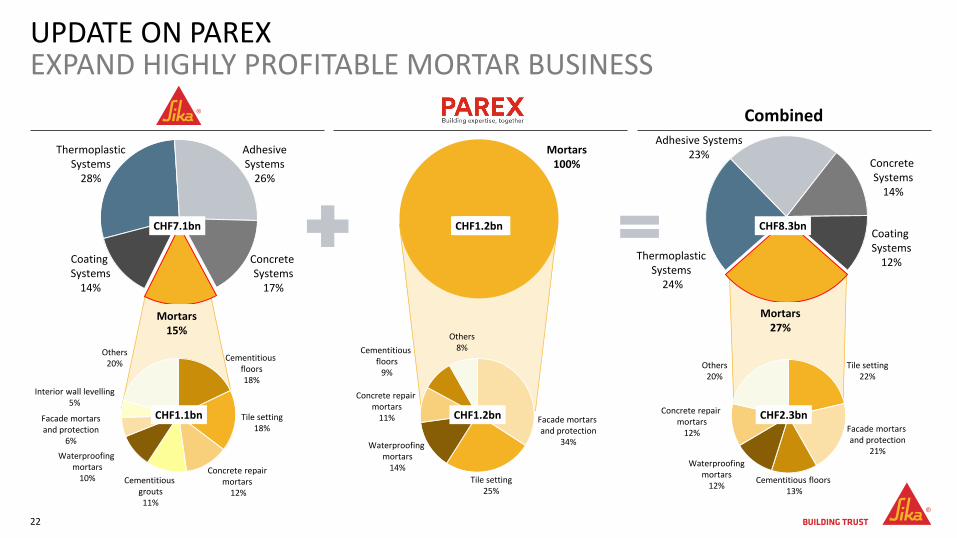
22
Mortars100%
CHF1.1bn
Combined
Concrete Systems
17%
Mortars27%
CHF8.3bn
Concrete repair mortars
12%
Waterproofing mortars
10%
Cementitious floors18%
Tile setting18%
Cementitious grouts11%
Others20%
Mortars15%
Adhesive Systems
26%
Cementitious floors 13%
Concrete repair mortars
12%
Tile setting22%
Facade mortars and protection
21%
Waterproofingmortars
12%
Others20%
CHF1.1bn CHF2.3bn
UPDATE ON PAREXEXPAND HIGHLY PROFITABLE MORTAR BUSINESS
CHF7.1bn CHF1.2bn
CHF1.2bn Facade mortars and protection
34%Waterproofing mortars
14%
Concrete repair mortars
11%
Tile setting25%
Cementitious floors
9%
Others8%
Thermoplastic Systems
28%
Coating Systems
14%
Thermoplastic Systems
24%
Adhesive Systems23%
Concrete Systems
14%
Coating Systems
12%
Facade mortars and protection
6%
Interior wall levelling 5%
3. FINANCIAL RESULTS 2018
ADRIAN WIDMER, CFO
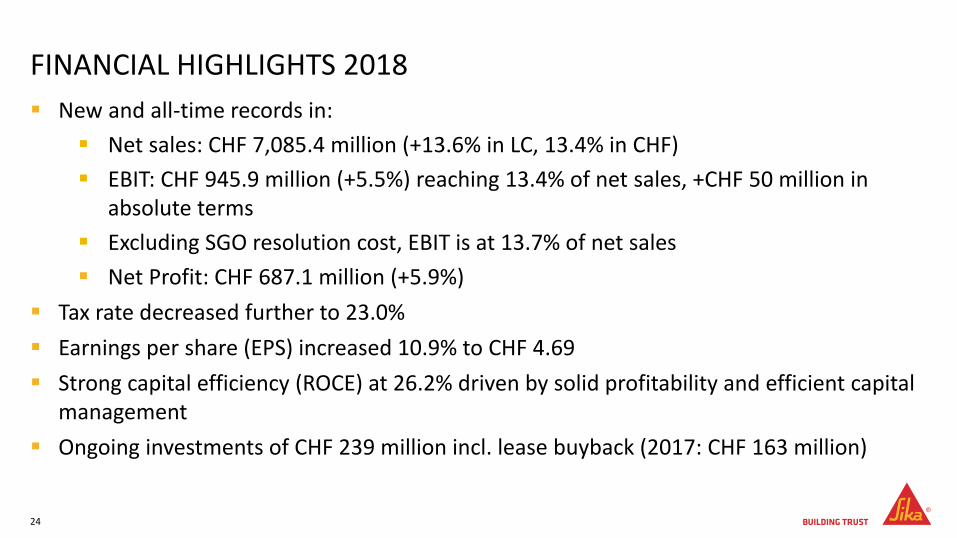
New and all-time records in:
Net sales: CHF 7,085.4 million (+13.6% in LC, 13.4% in CHF)
EBIT: CHF 945.9 million (+5.5%) reaching 13.4% of net sales, +CHF 50 million in absolute terms
Excluding SGO resolution cost, EBIT is at 13.7% of net sales
Net Profit: CHF 687.1 million (+5.9%)
Tax rate decreased further to 23.0%
Earnings per share (EPS) increased 10.9% to CHF 4.69
Strong capital efficiency (ROCE) at 26.2% driven by solid profitability and efficient capital management
Ongoing investments of CHF 239 million incl. lease buyback (2017: CHF 163 million)
FINANCIAL HIGHLIGHTS 2018
24
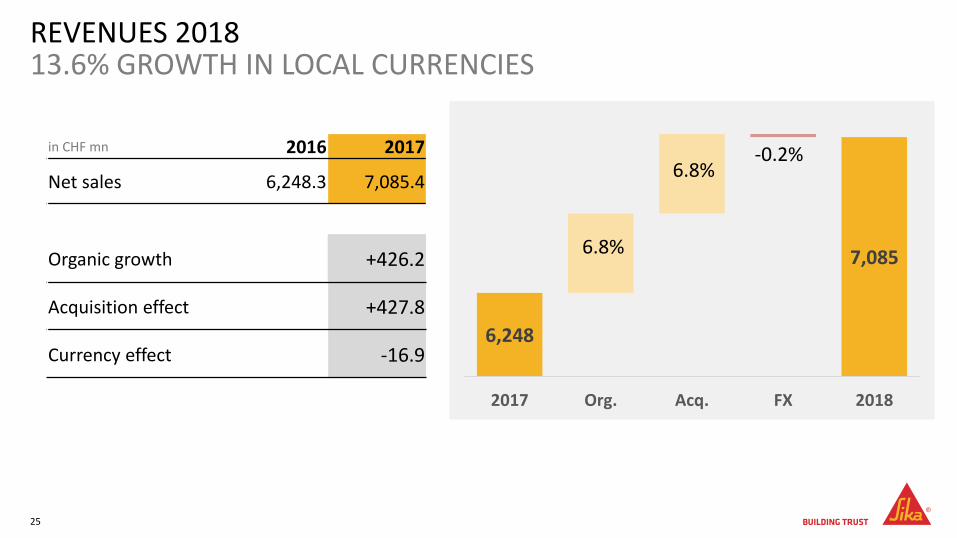
REVENUES 201813.6% GROWTH IN LOCAL CURRENCIES
25
in CHF mn 2016 2017
Net sales 6,248.3 7,085.4
Organic growth +426.2
Acquisition effect +427.8
Currency effect -16.9 6,248
7,085
2017 Org. Acq. FX 2018
6.8%
6.8%-0.2%
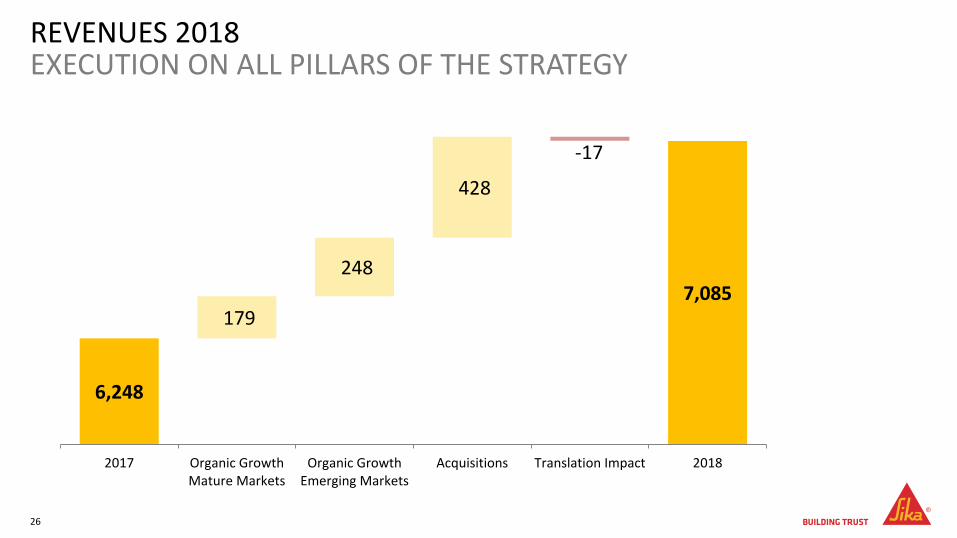
REVENUES 2018EXECUTION ON ALL PILLARS OF THE STRATEGY
26
6,248
7,085
-17
179
248
428
2017 Organic GrowthMature Markets
Organic GrowthEmerging Markets
Acquisitions Translation Impact 2018
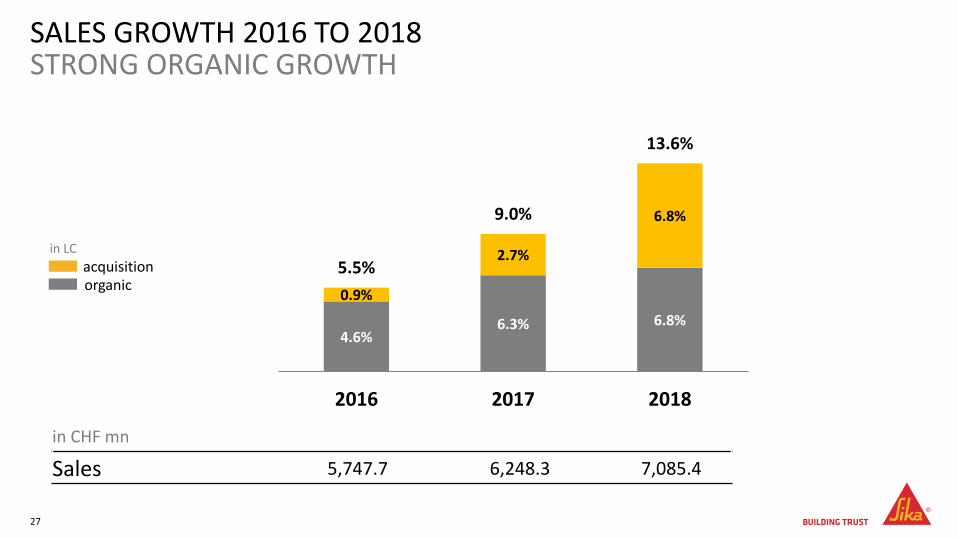
SALES GROWTH 2016 TO 2018STRONG ORGANIC GROWTH
27
acquisitionorganic
in LC
4.6%6.3% 6.8%
0.9%
2.7%
6.8%
5.5%
9.0%
13.6%
2016 2017 2018
in CHF mn
Sales 5,747.7 6,248.3 7,085.4
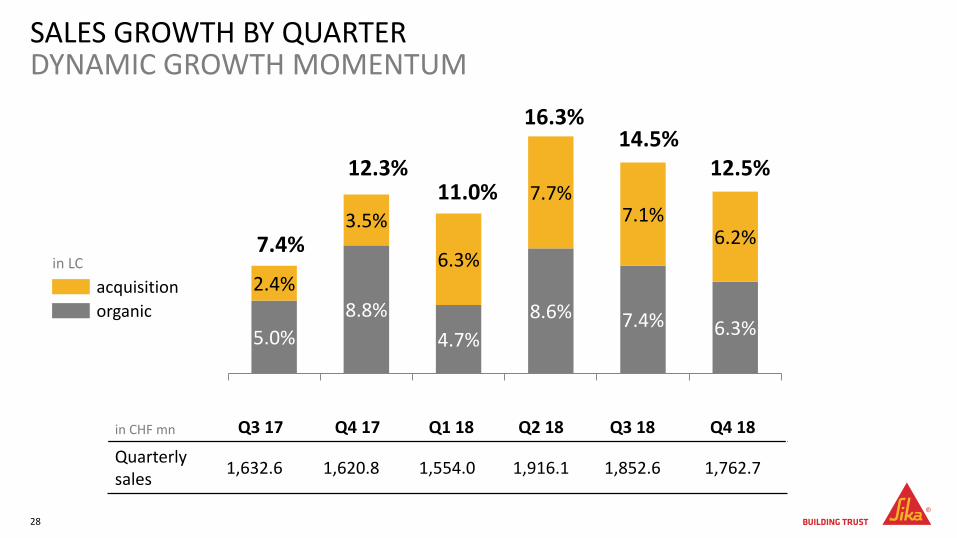
SALES GROWTH BY QUARTERDYNAMIC GROWTH MOMENTUM
28
acquisition
organic
in LC
5.0%
8.8%
4.7%
8.6% 7.4% 6.3%
2.4%
3.5%
6.3%
7.7%7.1%
6.2%
0%
2%
4%
6%
8%
10%
12%
14%
16%
18%
Q3 CY Q4 CY Q1 CY Q2 CY Q3 CY Q4 CY
in CHF mn Q3 17 Q4 17 Q1 18 Q2 18 Q3 18 Q4 18
Quarterly sales
1,632.6 1,620.8 1,554.0 1,916.1 1,852.6 1,762.7
16.3%
11.0%
7.4%
12.3% 12.5%14.5%
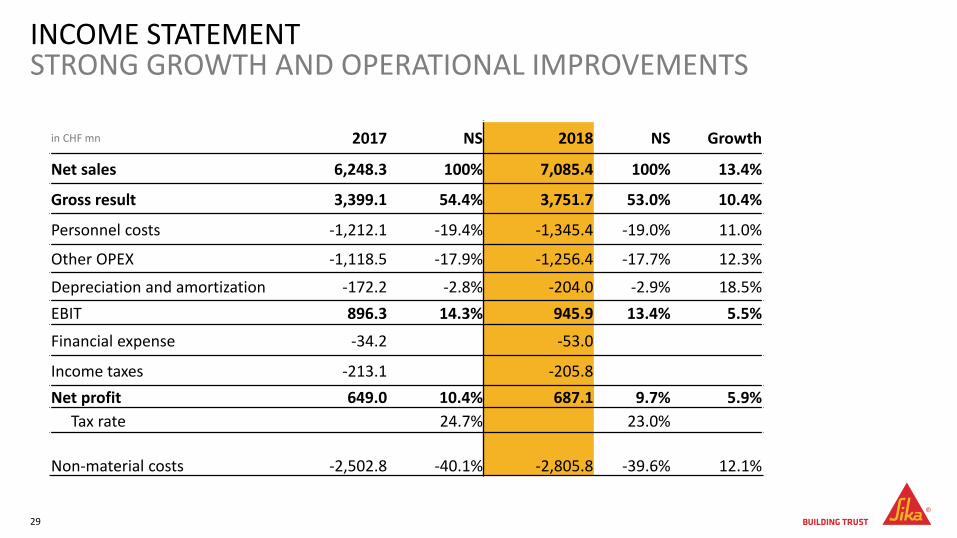
INCOME STATEMENTSTRONG GROWTH AND OPERATIONAL IMPROVEMENTS
29
in CHF mn 2017 NS 2018 NS Growth
Net sales 6,248.3 100% 7,085.4 100% 13.4%
Gross result 3,399.1 54.4% 3,751.7 53.0% 10.4%
Personnel costs -1,212.1 -19.4% -1,345.4 -19.0% 11.0%
Other OPEX -1,118.5 -17.9% -1,256.4 -17.7% 12.3%
Depreciation and amortization -172.2 -2.8% -204.0 -2.9% 18.5%
EBIT 896.3 14.3% 945.9 13.4% 5.5%
Financial expense -34.2 -53.0
Income taxes -213.1 -205.8
Net profit 649.0 10.4% 687.1 9.7% 5.9%
Tax rate 24.7% 23.0%
Non-material costs -2,502.8 -40.1% -2,805.8 -39.6% 12.1%
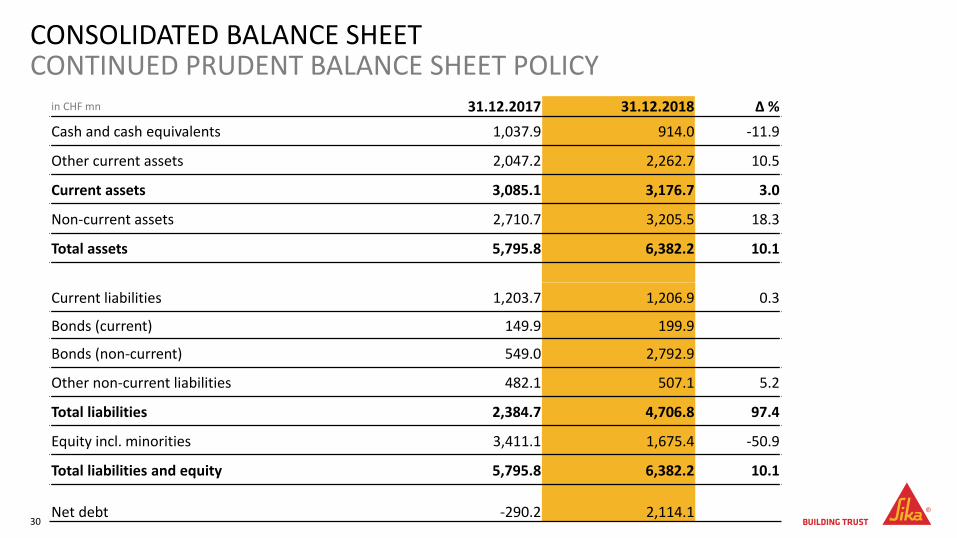
CONSOLIDATED BALANCE SHEETCONTINUED PRUDENT BALANCE SHEET POLICY
30
in CHF mn 31.12.2017 31.12.2018 Δ %
Cash and cash equivalents 1,037.9 914.0 -11.9
Other current assets 2,047.2 2,262.7 10.5
Current assets 3,085.1 3,176.7 3.0
Non-current assets 2,710.7 3,205.5 18.3
Total assets 5,795.8 6,382.2 10.1
Current liabilities 1,203.7 1,206.9 0.3
Bonds (current) 149.9 199.9
Bonds (non-current) 549.0 2,792.9
Other non-current liabilities 482.1 507.1 5.2
Total liabilities 2,384.7 4,706.8 97.4
Equity incl. minorities 3,411.1 1,675.4 -50.9
Total liabilities and equity 5,795.8 6,382.2 10.1
Net debt -290.2 2,114.1
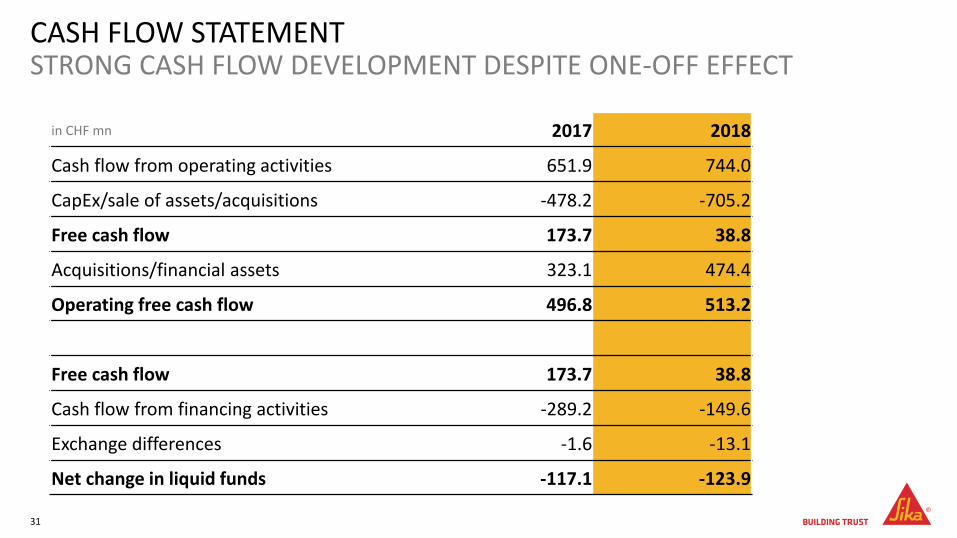
CASH FLOW STATEMENTSTRONG CASH FLOW DEVELOPMENT DESPITE ONE-OFF EFFECT
31
in CHF mn 2017 2018
Cash flow from operating activities 651.9 744.0
CapEx/sale of assets/acquisitions -478.2 -705.2
Free cash flow 173.7 38.8
Acquisitions/financial assets 323.1 474.4
Operating free cash flow 496.8 513.2
Free cash flow 173.7 38.8
Cash flow from financing activities -289.2 -149.6
Exchange differences -1.6 -13.1
Net change in liquid funds -117.1 -123.9
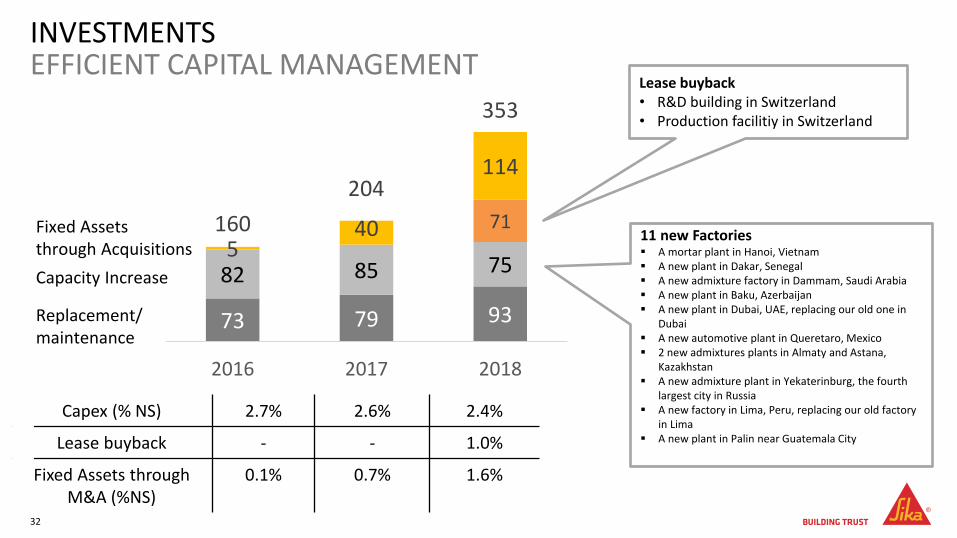
73 79 93
82 85 75
71
540
114
160
204
353
2016 2017 2018
Fixed Assets through Acquisitions
Replacement/maintenance
Capacity Increase
INVESTMENTSEFFICIENT CAPITAL MANAGEMENT
32
11 new Factories A mortar plant in Hanoi, Vietnam A new plant in Dakar, Senegal A new admixture factory in Dammam, Saudi Arabia A new plant in Baku, Azerbaijan A new plant in Dubai, UAE, replacing our old one in
Dubai A new automotive plant in Queretaro, Mexico 2 new admixtures plants in Almaty and Astana,
Kazakhstan A new admixture plant in Yekaterinburg, the fourth
largest city in Russia A new factory in Lima, Peru, replacing our old factory
in Lima A new plant in Palin near Guatemala City
Capex (% NS) 2.7% 2.6% 2.4%
Lease buyback - - 1.0%
Fixed Assets throughM&A (%NS)
0.1% 0.7% 1.6%
Lease buyback• R&D building in Switzerland• Production facilitiy in Switzerland
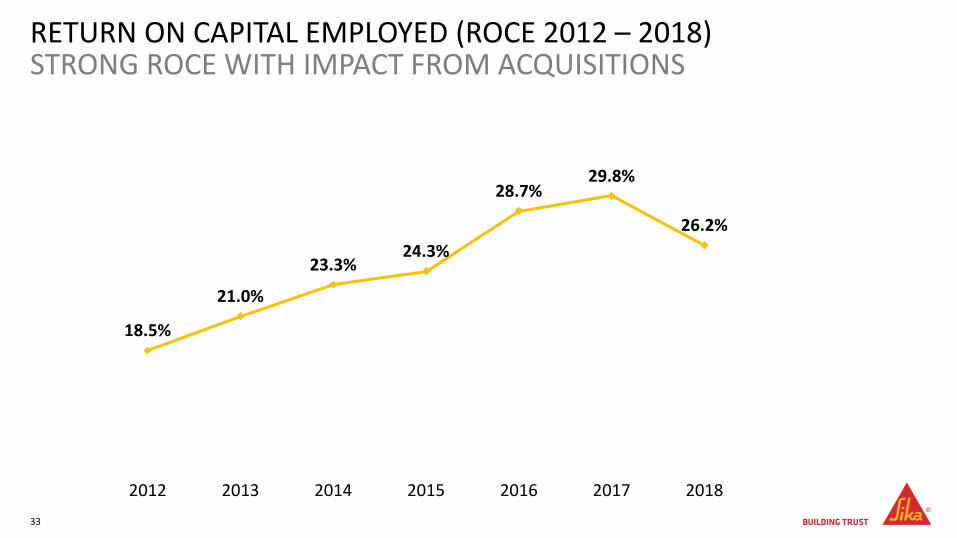
RETURN ON CAPITAL EMPLOYED (ROCE 2012 – 2018)STRONG ROCE WITH IMPACT FROM ACQUISITIONS
33
18.5%
21.0%
23.3%24.3%
28.7%29.8%
26.2%
2012 2013 2014 2015 2016 2017 2018
RECORD DIVIDENDBOARD PROPOSES 10.8% DIVIDEND INCREASE
34
Dividend payment CHF 2.05 per share (+10.8% vs. PY)
in CHF mn 2017 2018
Group profit (after minorities) 643.5 682.9
Dividend out of retained earnings 281.8 290.6
Dividend per share 1.85* 2.05*
Total payout ratio 43.8% 42.6%
*in CHF
4. SUCCESSFUL STRATEGY EXECUTIONPAUL SCHULER, CEO
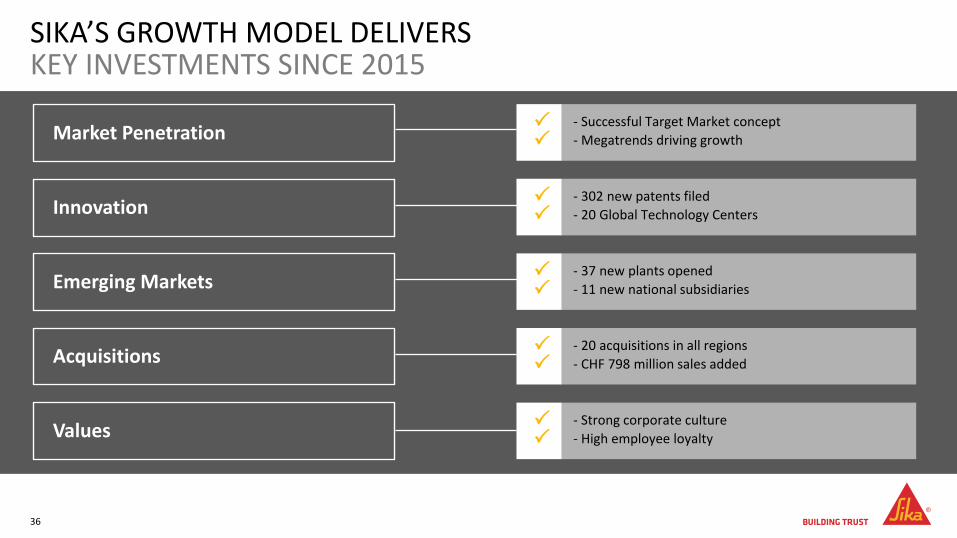
SIKA’S GROWTH MODEL DELIVERSKEY INVESTMENTS SINCE 2015
- Successful Target Market concept
- Megatrends driving growth
- 302 new patents filed
- 20 Global Technology Centers
- 37 new plants opened
- 11 new national subsidiaries
- 20 acquisitions in all regions
- CHF 798 million sales added
- Strong corporate culture
- High employee loyalty
Market Penetration
Innovation
Emerging Markets
Acquisitions
Values
36
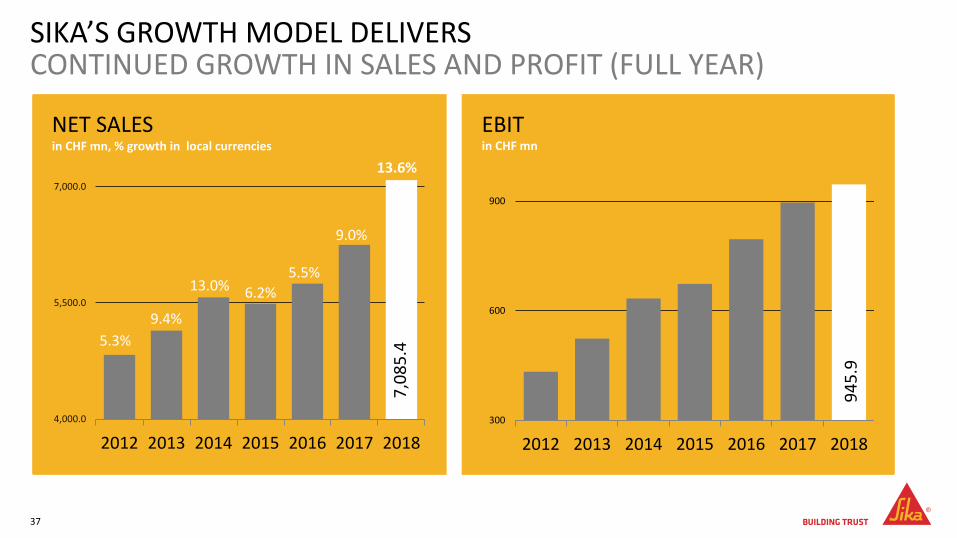
SIKA’S GROWTH MODEL DELIVERSCONTINUED GROWTH IN SALES AND PROFIT (FULL YEAR)
37
NET SALES
300
600
900
2012 2013 2014 2015 2016 2017 2018
94
5.9
in CHF mn
EBIT
5.3%
9.4%
13.0% 6.2%
5.5%
9.0%
13.6%
2012 2013 2014 2015 2016 2017 2018
in CHF mn, % growth in local currencies
7,0
85
.4
NET SALES
SIKA’S GROWTH MODEL DELIVERSSTRATEGIC TARGETS 2020
38
6 - 8% ANNUAL GROWTH MARKET PENETRATION
INNOVATION
EMERGING MARKETS
ACQUISITIONS
VALUES
30 NEW PLANTS
14 - 16% EBIT MARGIN PER YEAR
> 25% ROCE PER YEAR
105 NATIONAL SUBSIDIARIES
> 10% OPERATING FREE CASH FLOW PER YEAR
5. OUTLOOKPAUL SCHULER, CEOTHOMAS HASLER, GLOBAL BUSINESS & INDUSTRYCHRISTOPH GANZ, AMERICAS
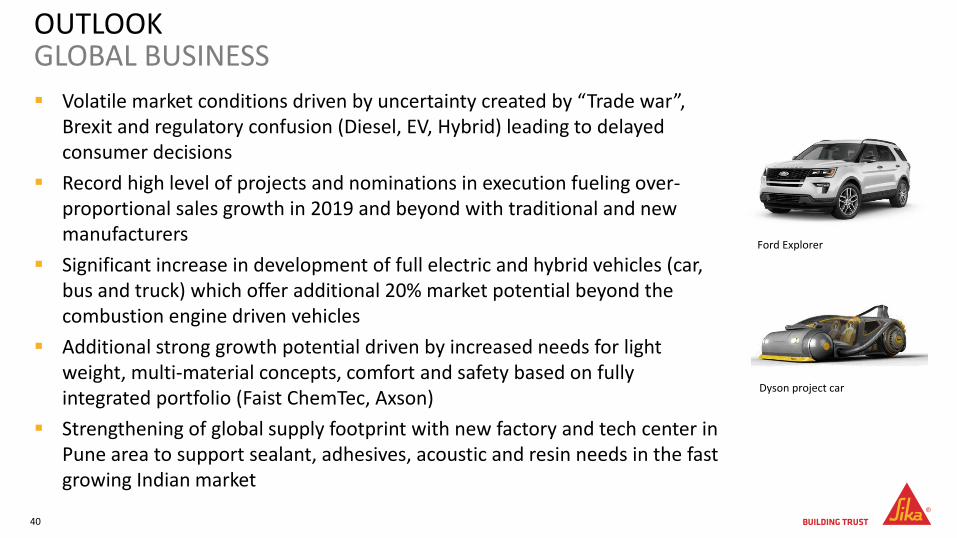
OUTLOOKGLOBAL BUSINESS
Volatile market conditions driven by uncertainty created by “Trade war”, Brexit and regulatory confusion (Diesel, EV, Hybrid) leading to delayed consumer decisions
Record high level of projects and nominations in execution fueling over-proportional sales growth in 2019 and beyond with traditional and new manufacturers
Significant increase in development of full electric and hybrid vehicles (car, bus and truck) which offer additional 20% market potential beyond the combustion engine driven vehicles
Additional strong growth potential driven by increased needs for light weight, multi-material concepts, comfort and safety based on fully integrated portfolio (Faist ChemTec, Axson)
Strengthening of global supply footprint with new factory and tech center in Pune area to support sealant, adhesives, acoustic and resin needs in the fast growing Indian market
Ford Explorer
Dyson project car
40
Positive market environment expected for the USA and Canada
Challenging markets in Latin America (Argentina, Mexico) with some bright spots (Brazil, Colombia)
Sika also able to deliver profitable growth in challenging markets by focusing on innovation, big city approach, distribution channels, project selling
Combination of North- and Latin America into one Region Americas on track and resulting in benefits: US specifications in Latin America, mining business for North America, acrylic waterproofing for US sunbelt, PVC roofing and park deck coating for Latin America
New customers and project wins, plus sales price increases and efficiency projects implemented last year will deliver positive results in 2019
OUTLOOKAMERICAS
41
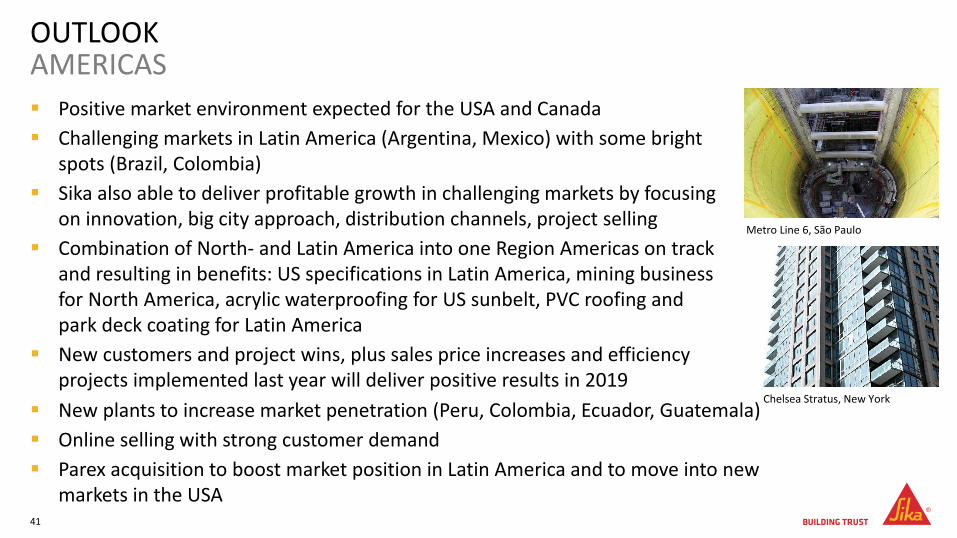
Metro Line 6, São Paulo
Chelsea Stratus, New York New plants to increase market penetration (Peru, Colombia, Ecuador, Guatemala)
Online selling with strong customer demand
Parex acquisition to boost market position in Latin America and to move into new markets in the USA
Positive construction market development and promising new opportunities for industry business
Excellent development in Eastern Europe thanks to numerous infrastructure projects and strong growth in distribution business
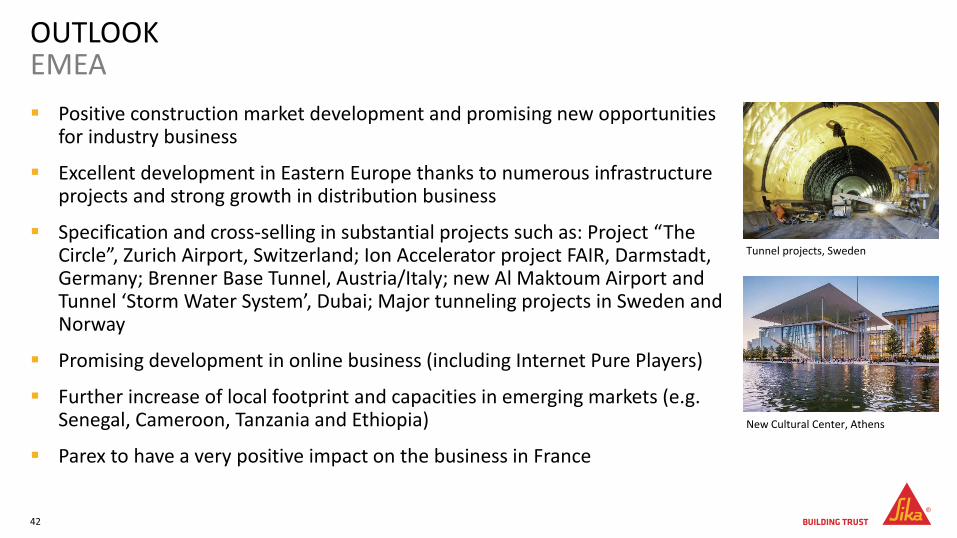
Specification and cross-selling in substantial projects such as: Project “The Circle”, Zurich Airport, Switzerland; Ion Accelerator project FAIR, Darmstadt, Germany; Brenner Base Tunnel, Austria/Italy; new Al Maktoum Airport andTunnel ‘Storm Water System’, Dubai; Major tunneling projects in Sweden and Norway
Promising development in online business (including Internet Pure Players)
Further increase of local footprint and capacities in emerging markets (e.g. Senegal, Cameroon, Tanzania and Ethiopia)
Parex to have a very positive impact on the business in France
OUTLOOKEMEA
42
Tunnel projects, Sweden
New Cultural Center, Athens
Market in Asia/Pacific remains strong with huge growth potential in all Target Markets
Strong growth likely in China, India and parts of South East Asia. Challenging markets will continue in Malaysia, Hong Kong and the Philippines.
Continued development of distribution channels throughout China, India, Japan and South East Asia
Tokyo 2020 Olympics will be major focus in Japan
Expansion of production base and supply chain with the completion of 4 more production sites
Continuation of acquisition activity in our key market to spur additional growth
Parex acquisition will significantly boost our market position in the region particularly in China, Singapore and Australia. Solid growth in Malaysia, Thailand and the Philippines.
OUTLOOKASIA/PACIFIC
43
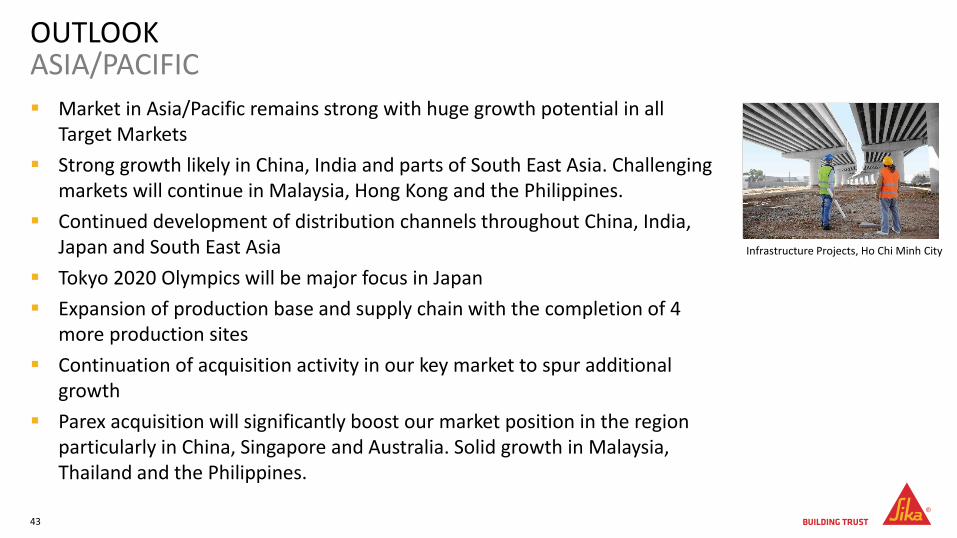
Infrastructure Projects, Ho Chi Minh City
6 to 8% sales growth in local currencies (excluding Parex)
Sales to exceed CHF 8 billion for the first time, depending on closing date of Parex transaction
Over-proportional profit increase expected for the year
Opening of 7 to 9 new factories
Strategy 2023 to be communicated at Capital Markets Day on October 3, 2019
STRONG OUTLOOK 2019CONTINUATION OF SUCCESSFUL GROWTH STRATEGY
44

6. QUESTIONS AND ANSWERS
THANK YOU FOR YOUR ATTENTION
This presentation contains certain forward-looking statements. These forward-looking statements may be identified by words such as ‘expects’, ‘believes’, ‘estimates’, ‘anticipates’, ‘projects’, ‘intends’, ‘should’, ‘seeks’, ‘future’ or similar expressions or by discussion of, among other things, strategy, goals, plans or intentions. Various factors may cause actual results to differ materially in the future from those reflected in forward-looking statements contained in this presentation, among others:
Fluctuations in currency exchange rates and general financial market conditions
Interruptions in production
Legislative and regulatory developments and economic conditions
Delay or inability in obtaining regulatory approvals or bringing products to market
Pricing and product initiatives of competitors
Uncertainties in the discovery, development or marketing of new products or new uses of existing products, including without limitation negative results of research projects, unexpected side-effects of pipeline or marketed products
Increased government pricing pressures
Loss of inability to obtain adequate protection for intellectual property rights
Litigation
Loss of key executives or other employees
Adverse publicity and news coverage
Any statements regarding earnings per share growth are not a profit forecast and should not be interpreted to mean that Sika’s earnings or earnings per share for this year or any subsequent period will necessarily match or exceed the historical published earnings or earnings per share of Sika.
For marketed products discussed in this presentation, please see information on our website: www.sika.com
All mentioned trademarks are legally protected.
FORWARD-LOOKING STATEMENT
47