SiilStatistical CiC omputing - Biostatistics - Departmentshji/courses/statcomputing/Lecture1.pdf ·...
32
S i i lC i StatisticalComputing (140.776) http://www.biostat.jhsph.edu/~hji/courses/statcomputing/ Instructor: Hongkai Ji Instructor: Hongkai Ji Department of Biostatistics 615 N Wolfe Street, Room E3638 Phone: 410‐955‐3517 Email: [email protected] Teaching Assistant: Thomas Prior Teaching Assistant: Thomas Prior Email: [email protected]
-
Upload
hoangtuong -
Category
Documents
-
view
218 -
download
0
Transcript of SiilStatistical CiC omputing - Biostatistics - Departmentshji/courses/statcomputing/Lecture1.pdf ·...
S i i l C iStatistical Computing(140.776)
http://www.biostat.jhsph.edu/~hji/courses/statcomputing/
Instructor: Hongkai JiInstructor: Hongkai JiDepartment of Biostatistics
615 N Wolfe Street, Room E3638Phone: 410‐955‐3517Email: [email protected]
Teaching Assistant: Thomas PriorTeaching Assistant: Thomas PriorEmail: [email protected]
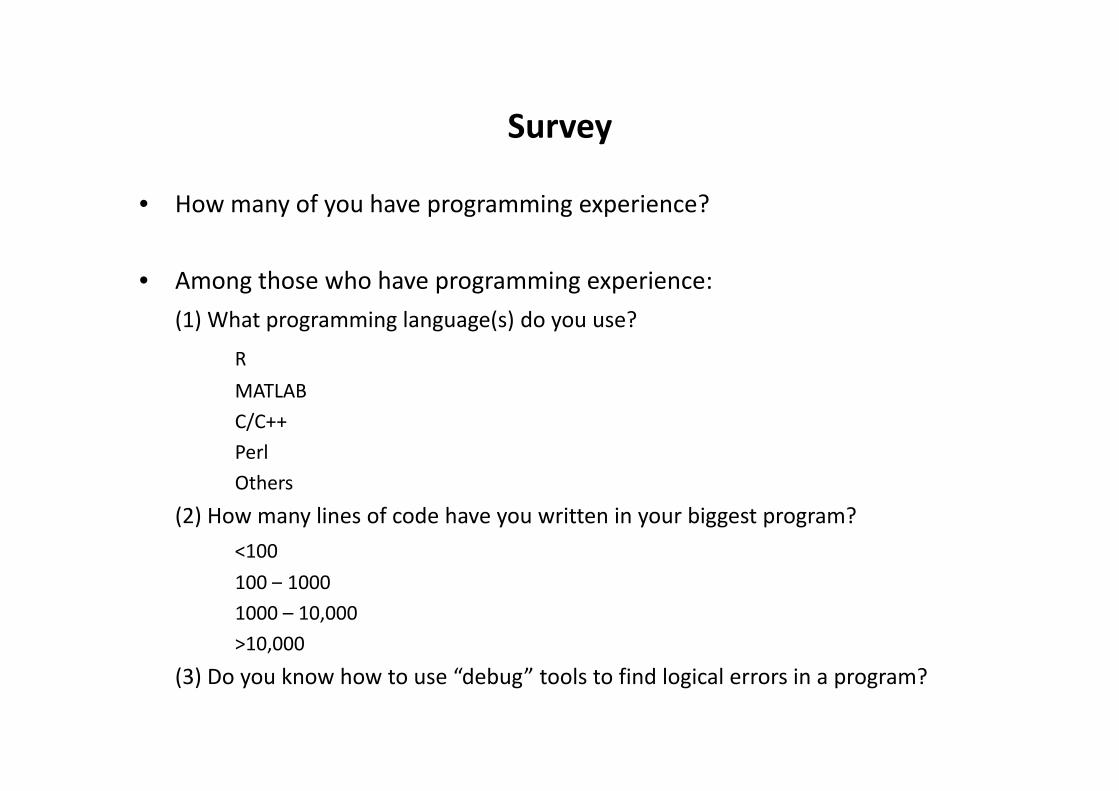
SurveySurvey
• How many of you have programming experience?y y p g g p
• Among those who have programming experience:
(1) What programming language(s) do you use?
R
MATLABMATLAB
C/C++
Perl
OthersOthers
(2) How many lines of code have you written in your biggest program?
<100
100 – 1000
1000 – 10,000
>10,000
(3) Do you know how to use “debug” tools to find logical errors in a program?

Who should take this courseWho should take this course
• This course is about R programming• This course is about R programming
• We will also talk a little about how to use programs to solve statistical problems
Y h ld t k thi• You should take this course
(1) If you want to learn R;
(2) If you want to obtain some basic skills to deal with data (visualization,(2) If you want to obtain some basic skills to deal with data (visualization, elementary statistical analysis);
(3) If you have some programming experience but wish to improve it (for l l h t d b t k it k l )example, learn how to debug a program to make it work properly).
Who should take this courseWho should take this course
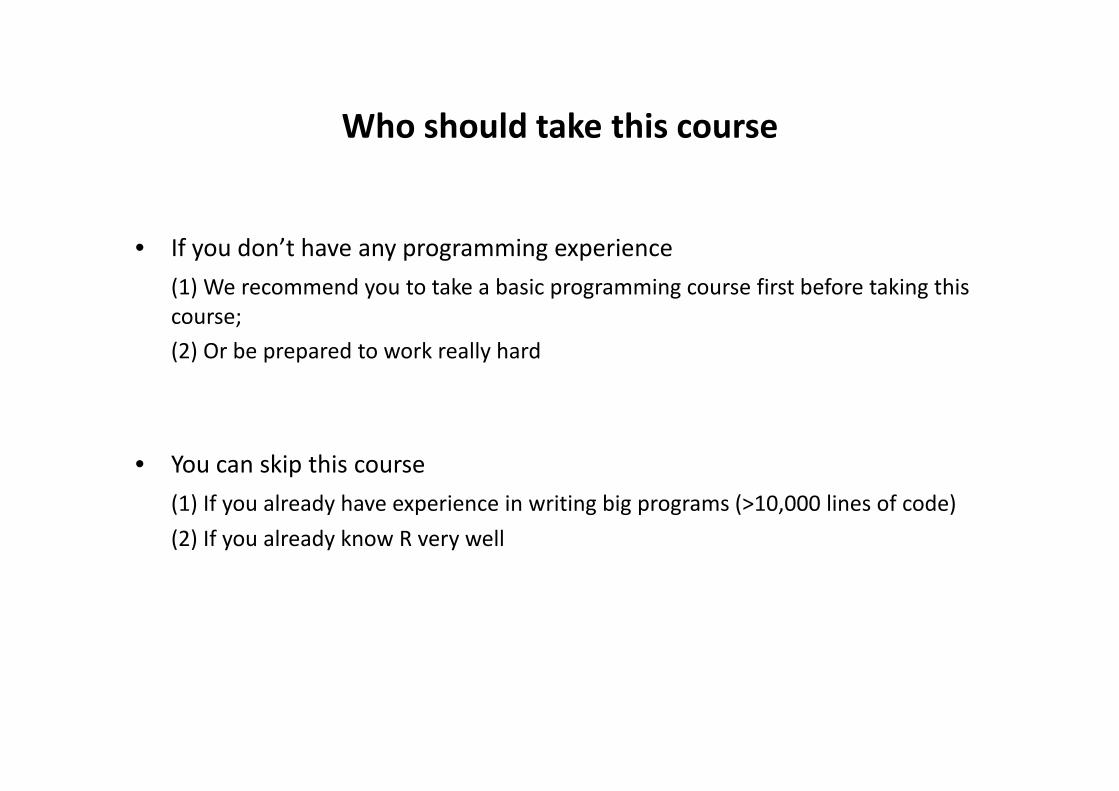
• If you don’t have any programming experience
(1) We recommend you to take a basic programming course first before taking this course;
(2) Or be prepared to work really hard
• You can skip this course
(1) If you already have experience in writing big programs (>10,000 lines of code)
(2) If you already know R very well

776 vs 778776 vs. 778
• Statistical Computing (140.776)– Practical issues: programming
Elementary statistical computing topics– Elementary statistical computing topics
Ad d S i i l C i (140 778)• Advanced Statistical Computing (140.778)– Algorithm design: Optimization, Monte Carlo, Markov Chain Monte
Carlo, etc.Carlo, etc.
– Theoretical issues: How do they work, why do they work, how to make them efficient
Tips for learningTips for learning
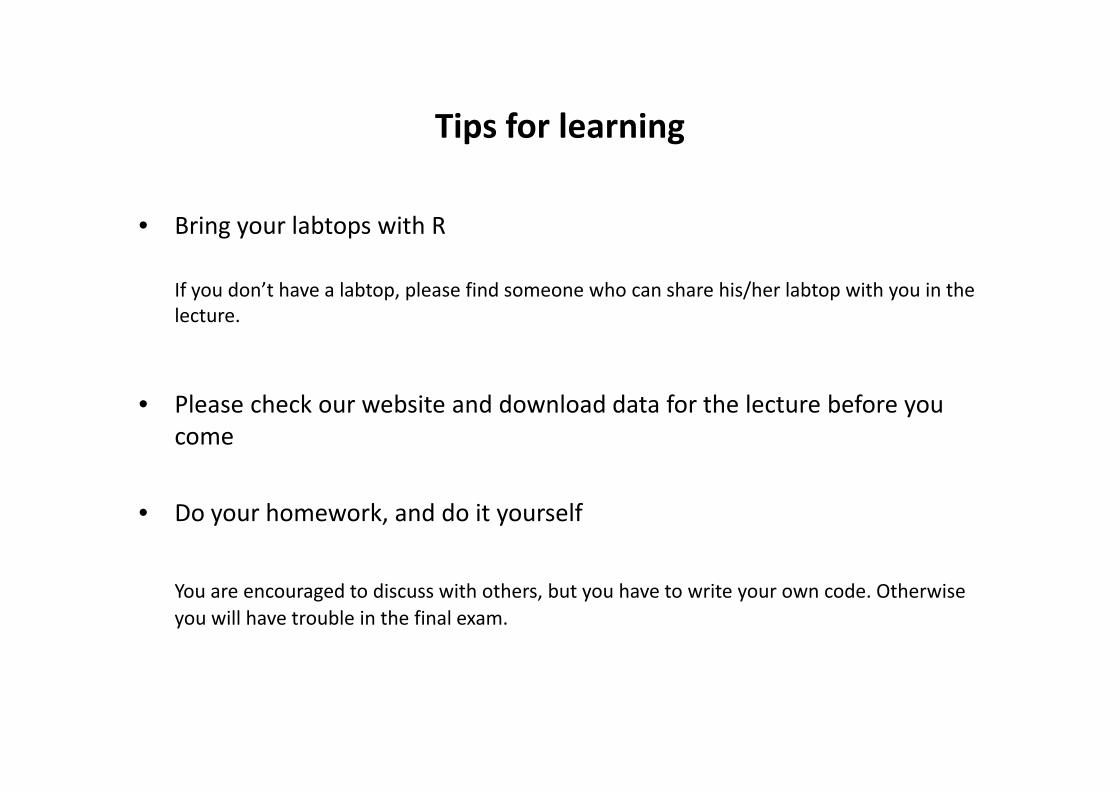
l b h• Bring your labtops with R
If you don’t have a labtop, please find someone who can share his/her labtop with you in the lecture.
l h k b i d d l d d f h l b f• Please check our website and download data for the lecture before you come
• Do your homework, and do it yourself
You are encouraged to discuss with others, but you have to write your own code. Otherwise you will have trouble in the final exam.
Grading systemGrading system
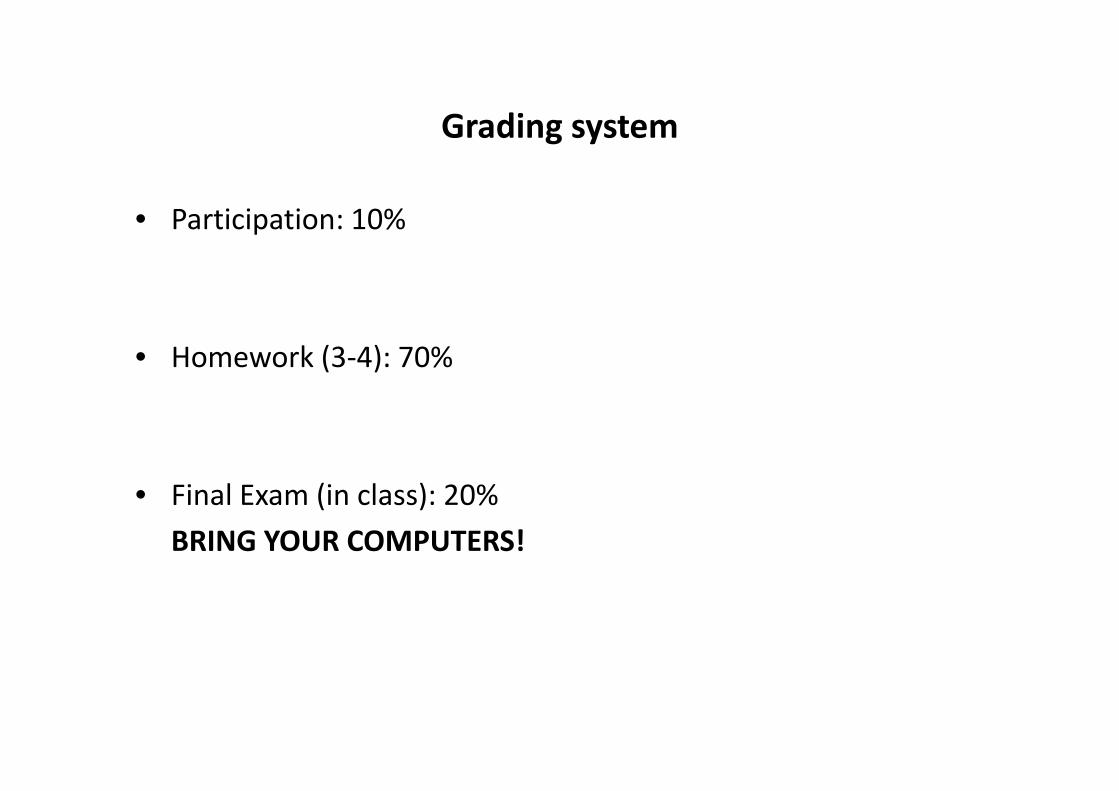
• Participation: 10%• Participation: 10%
• Homework (3‐4): 70%
Fi l E (i l ) 20%• Final Exam (in class): 20%
BRING YOUR COMPUTERS!

Teaching AssistantTeaching Assistant
• Tom Prior• Tom Prior
• Office hour

R is a statistical programming language

Some basic elements of statistics

Statistics is a data driven scienceStatistics is a data‐driven science
Probability: What is the probability to get 1 red and 2 black balls?
Statistics:h f b ll h b dWhat percentage of balls in the box are red?

Study design and data collectionStudy design and data collection
l• Example:
Does fish oil help reduce blood pressure?
• Randomization
‐ Random sampling from the population (Inference can be drawn for the population)
‐ Random treatment assignment (Causal inference can be drawn)
• Observational studies vs. Randomized experiments

DataData
Reduction of blood pressure
Fish oil diet: 8 12 10 14 2 0 0
Regular diet: -6 0 1 2 -3 -4 2
Question: What is the first thing you would do to analyze the data?

Data Exploration and VisualizationData Exploration and Visualization

Data Exploration and VisualizationData Exploration and Visualization
Statistical InferenceStatistical Inference
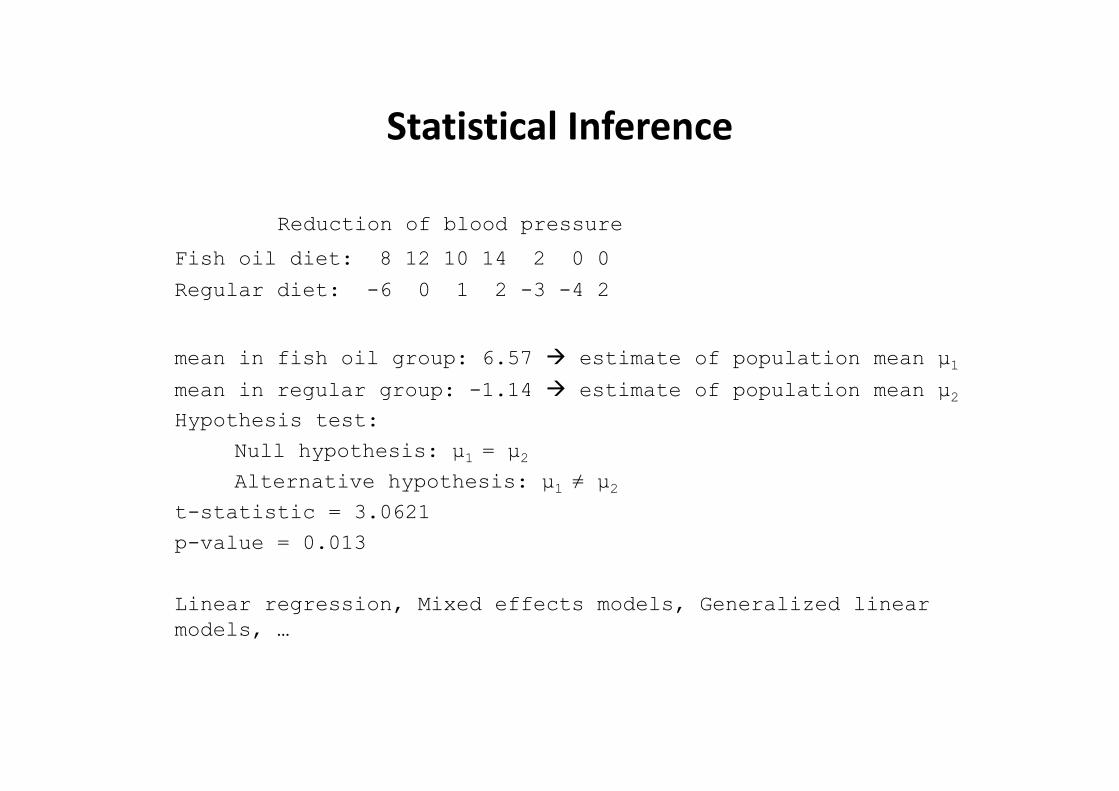
Reduction of blood pressure
Fish oil diet: 8 12 10 14 2 0 0
Regular diet: -6 0 1 2 -3 -4 2
mean in fish oil group: 6.57 estimate of population mean μ1mean in regular group: -1.14 estimate of population mean μ2mean in regular group: 1.14 estimate of population mean μ2Hypothesis test:
Null hypothesis: μ1 = μ2Alternative hypothesis: μ1 ≠ μ2Alternative hypothesis: μ1 ≠ μ2
t-statistic = 3.0621p-value = 0.013
Linear regression, Mixed effects models, Generalized linear models, …

Assumptions assumptions assumptions!Assumptions, assumptions, assumptions!
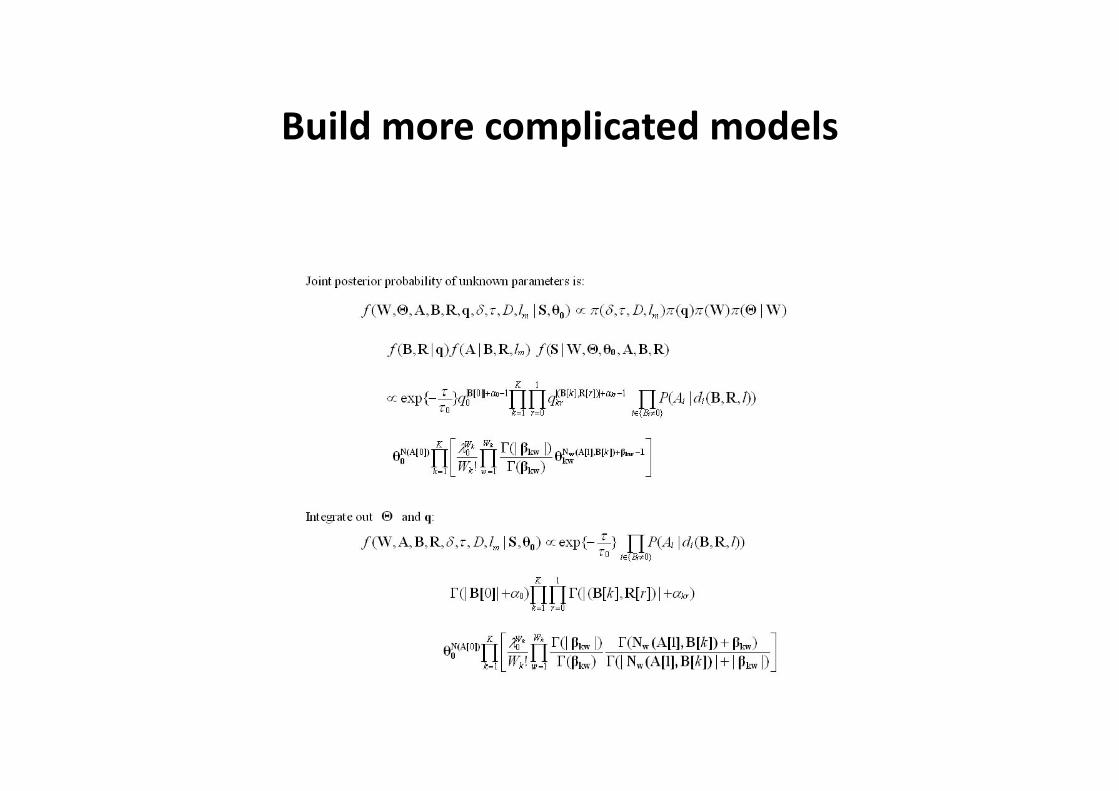
Build more complicated modelsBuild more complicated models
How to handle these complex models?How to handle these complex models?
Now you need Advanced computing techniques such as Markov Chain Monte Carlo, EM, etc., which will be covered by Advanced Statistical , , , yComputing.

Data are getting biggerData are getting bigger
• Netflix competition• Netflix competition
> 480,000 customers, >18,000 movie titles, >100 million ratings (scale from 1 to 5 stars)
Data collected between October 1998 and December 2005Data collected between October, 1998 and December, 2005.
Predict how a customer will rate a new movie.
• Human genome project
3 x 10⁹ base pairs (3 GB)
• 1000 genome projects
3 x 109 x 1000
We need help from computers!

That’s why statistical computingThat s why statistical computing becomes so important!
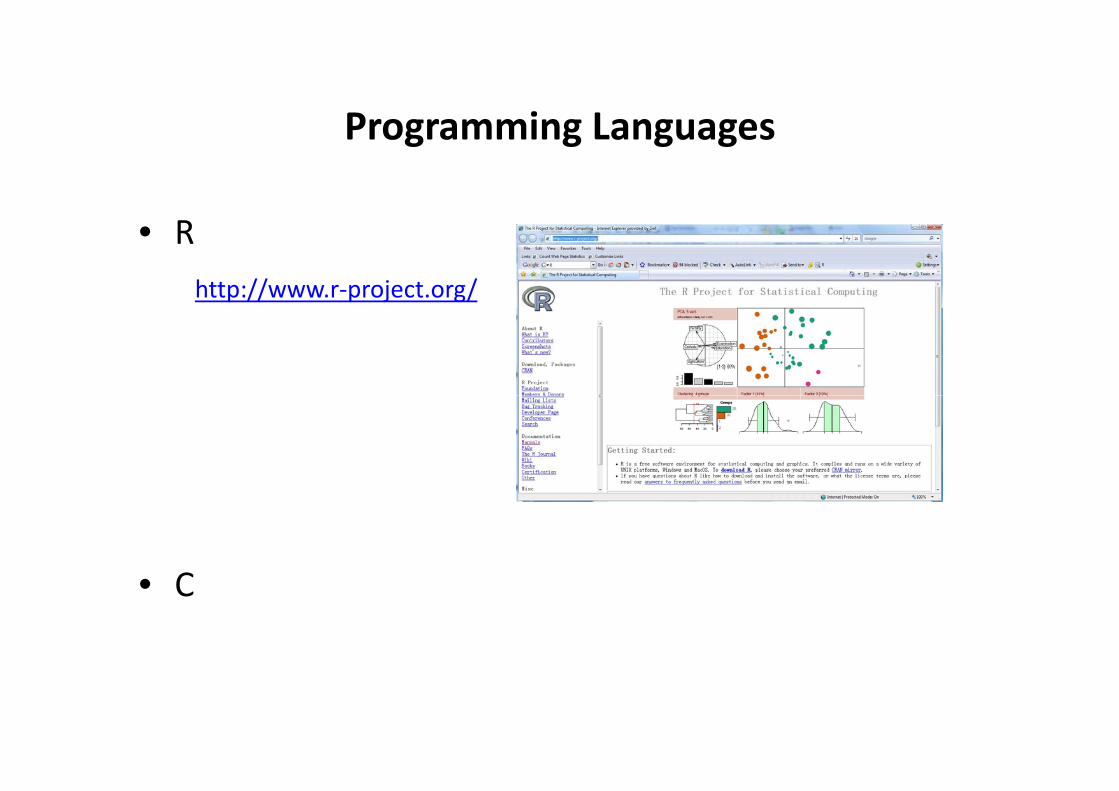
Programming LanguagesProgramming Languages
• R
http://www.r‐project.org/
C• C

Programming LanguagesProgramming Languages
C: Compiled language, transformed into an executable form before running
R: Interpreted language, read and then executed d ldirectly
An Introduction to RAn Introduction to R
• URL
R website: http://cran.r‐project.org/ or http://www.r‐project.org/(Download, Manuals)
• An integrated suite of software for data manipulation, calculation and graphical displaymanipulation, calculation and graphical display
A i l t ti f th S l• An implementation of the S language
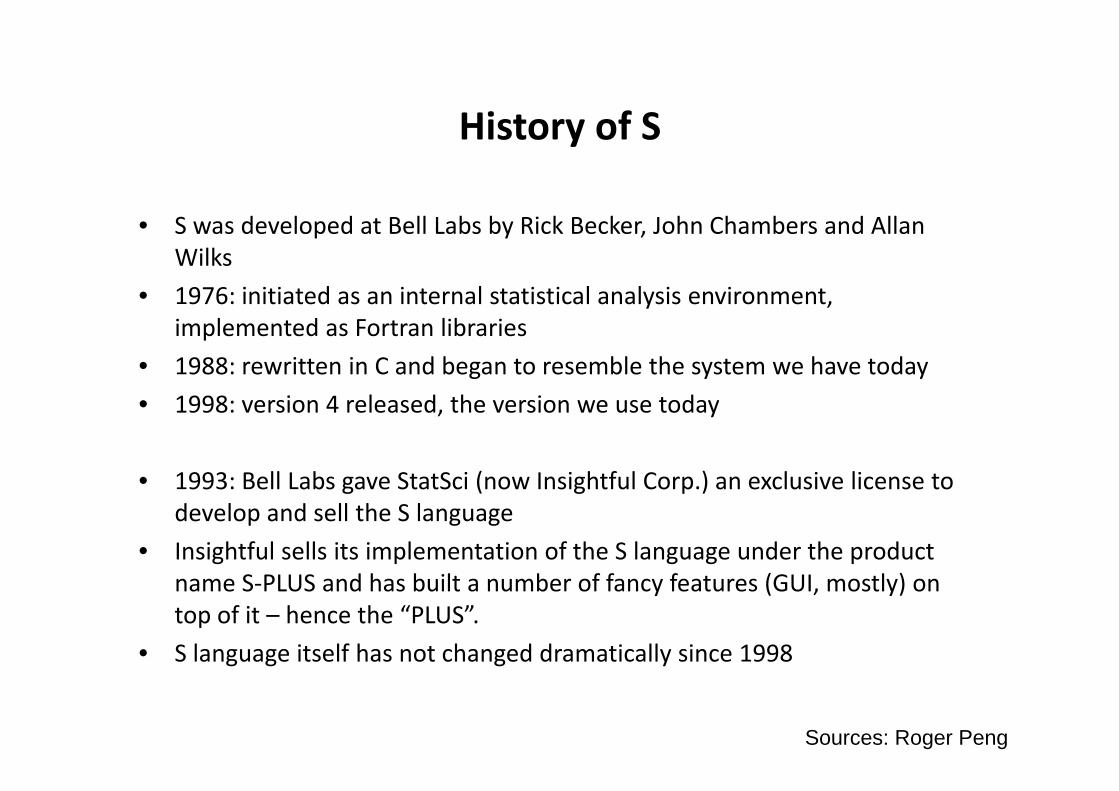
History of SHistory of S
d l d ll b b k k h h b d ll• S was developed at Bell Labs by Rick Becker, John Chambers and Allan Wilks
• 1976: initiated as an internal statistical analysis environment, y ,implemented as Fortran libraries
• 1988: rewritten in C and began to resemble the system we have today
998 i l d h i d• 1998: version 4 released, the version we use today
• 1993: Bell Labs gave StatSci (now Insightful Corp ) an exclusive license to1993: Bell Labs gave StatSci (now Insightful Corp.) an exclusive license to develop and sell the S language
• Insightful sells its implementation of the S language under the product S PLUS d h b il b f f f (GUI l )name S‐PLUS and has built a number of fancy features (GUI, mostly) on
top of it – hence the “PLUS”.
• S language itself has not changed dramatically since 1998g g g y
Sources: Roger Peng
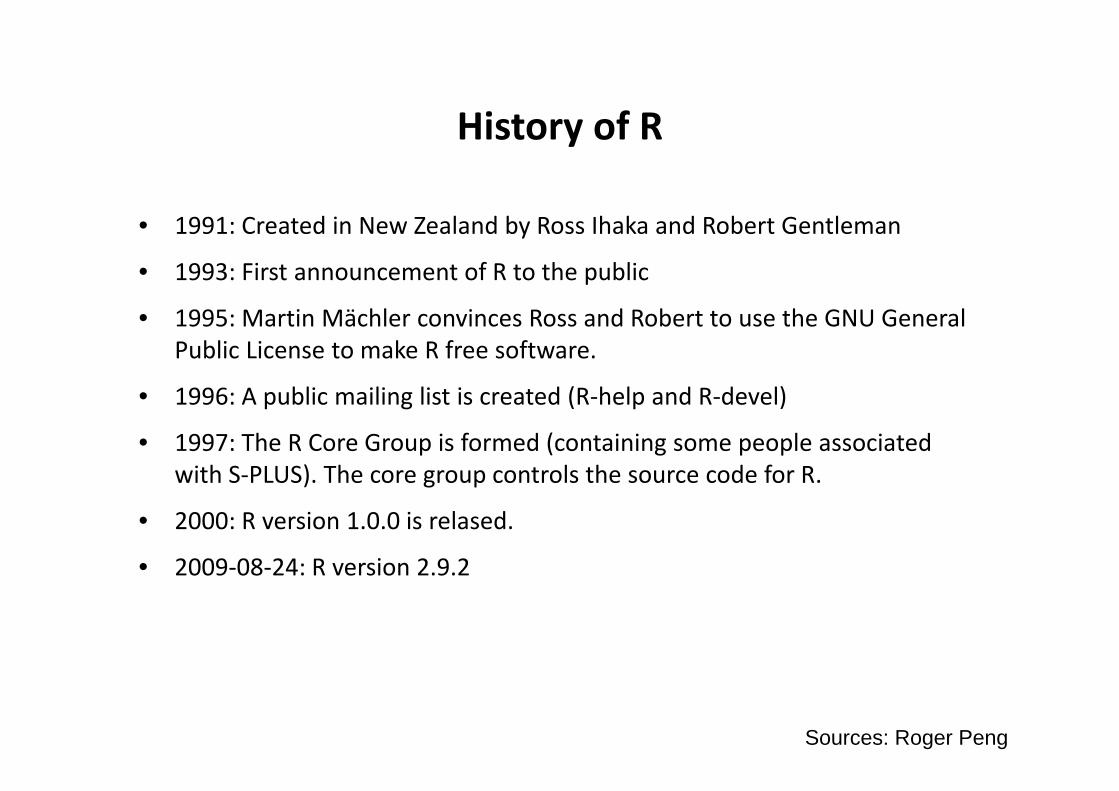
History of RHistory of R
d l d b h k d b l• 1991: Created in New Zealand by Ross Ihaka and Robert Gentleman
• 1993: First announcement of R to the public
• 1995: Martin Mächler convinces Ross and Robert to use the GNU General Public License to make R free software.
• 1996: A public mailing list is created (R help and R devel)• 1996: A public mailing list is created (R‐help and R‐devel)
• 1997: The R Core Group is formed (containing some people associated with S‐PLUS). The core group controls the source code for R.) g p
• 2000: R version 1.0.0 is relased.
• 2009‐08‐24: R version 2.9.22009 08 24: R version 2.9.2
Sources: Roger Peng

Features of RFeatures of R
• Syntax is very similar to S
• Runs on almost any standard computing platform
• Frequent releases
• Graphics capabilities
• Can be used interactively AND contains a powerful programming language
• Active user community
• Free
Sources: Roger Peng

Some R ResourcesSome R Resources
Available from
http://cran.r‐project.org/
or http://www.r‐project.org
• An Introduction to R
• The R language definition
• Writing R Extensions
• R Data Import/Export
• R Installation and Administration• R Installation and Administration
• R Internals
• The R Reference Index

R BooksR Books
• There is a “books” link at http://www.r‐project.org
Getting Help in RGetting Help in R
• Type command
> help(lm)
oror> ?lm

R commandsR commands
• R is an expression language
Elementary commands consist of either expressions or assignmentsy p g
Commands separated by a semi‐colon (;) or a new line; grouped by braces ({ })
Comments start with a hashmark (#)
R i iti• R is case sensitive
A and a are different

Executing commands from or diverting output to a fileExecuting commands from or diverting output to a file
• Execute commands from a file
(“ d ”)> source(“mycommands.R”)
• Divert output to a file
> sink(“myresults.lis”)
To restore it to the console again, use> sink()