Significant Predictors of Functional Status and … · 2016-02-22 · iii developed a clinical and...
315
Significant Predictors of Functional Status and Complications in Patients Undergoing Surgery for the Treatment of Cervical Spondylotic Myelopathy Lindsay Anne Tetreault A thesis submitted in conformity with the requirements for the degree of Doctor of Philosophy Institute of Medical Sciences University of Toronto © Copyright by Lindsay Tetreault 2015
Transcript of Significant Predictors of Functional Status and … · 2016-02-22 · iii developed a clinical and...

Significant Predictors of Functional Status and Complications in
Patients Undergoing Surgery for the Treatment of Cervical Spondylotic
Myelopathy
Lindsay Anne Tetreault
A thesis submitted in conformity with the requirements for the degree of Doctor of Philosophy
Institute of Medical Sciences
University of Toronto
© Copyright by Lindsay Tetreault 2015
ii
Significant Predictors of Functional Status and Complications in Patients
Undergoing Surgery for the Treatment of Cervical Spondylotic
Myelopathy
Lindsay Anne Tetreault
Doctor of Philosophy
Institute of Medical Sciences, University of Toronto
2015
Abstract Introduction: Cervical spondylotic myelopathy (CSM) is a degenerative spine disease and the
most common cause of spinal cord dysfunction in adults worldwide. Surgery is increasingly
recommended as the preferred management strategy for these patients as it can effectively
halt neurological progression and improve functional status. In this field, there is an increasing
need to manage patients’ expectations of outcomes and inform them of relative risks and
benefits of their surgical procedure.
Objectives: This thesis aims to identify important predictors of functional outcomes and
perioperative complications in patients undergoing surgery for the treatment of CSM.
Methods: Three systematic reviews of the literature were performed to identify 1) important
clinical predictors of surgical outcome; 2) important imaging predictors of surgical outcome;
and 3) significant clinical and surgical predictors of complications. Two surveys were also
conducted to evaluate what spine professionals believed were the most critical predictors of
functional outcomes and complications. Finally, using prospectively-collected data, we

iii
developed a clinical and a complications prediction rule to predict functional status at 1-year
follow-up and a patient’s risk of complications.
Results: Patients were more likely to achieve an “optimal outcome” if they were younger; had
milder myelopathy and a shorter duration of symptoms preoperatively; did not smoke; had
fewer and less severe co-morbidities; and did not present with gait dysfunction. Patients were
at a higher risk of perioperative complications if they had a greater number of co-morbidities,
co-existing diabetes, a diagnosis of myelopathy secondary to ossification of a posterior
longitudinal ligament and a longer operative duration.
Conclusions: Our outcomes prediction study provides information that can be used by clinicians
to manage patients’ expectations and counsel concerned patients as to potential treatment
options. Furthermore, the results from this study emphasize the importance of accurately
detecting CSM at a mild disease state and referring these patients for early surgical
consultation. The knowledge gained from our complications study can be used by surgeons to
objectively quantify a patient’s risk of complications and discuss this risk during the surgical
consent process. Furthermore, surgeons should use this information to institute case-specific
preventative plans and to strategize appropriate postoperative care.

iv
Acknowledgements My experiences in graduate school have been positive, rewarding and humbling. I have
had the opportunity to collaborate with professionals from a wide variety of backgrounds,
present at international neurosurgery and spine conferences and witness evidence-based
medicine first hand.
I have been privileged to work under the supervision of Dr. Michael Fehlings as he is a
leading authority in spinal cord injury and has advanced the field through innovative
translational research. Dr. Fehlings is also an exceptional mentor and was able to lead me on an
appropriate career path, relate to my athletic background and competitiveness and provide the
guidance I needed to achieve my goals. I was always made to feel welcomed and valued in the
lab and encouraged that my work would eventually influence clinical practice. I have been
inspired over the last four years and have developed a new passion for research.
Dr. Fehlings, I am grateful to be a member of your clinical research team. Thank you for
encouraging me to pursue a doctorate degree, for the countless opportunities and for setting
such high standards. I hope to continue this working relationship for years to come.
I would also like to acknowledge several other individuals who have generously shared
their expertise with me and have provided the support I needed to complete this degree. To,
Pierre Côté and Robert Chen for being such positive presences on my Program Advisory Committee and for the valuable input, constructive criticism and methodological guidance you have provided me with over the years. Branko Kopjar for all of the statistical and methodological advice and for challenging me to think creatively. You have taught me the power of collaboration and your suggestions have truly enhanced the quality of my work. Anoushka Singh for giving me several opportunities to expand my knowledge, being my biggest source of support and encouragement and your unconditional friendship. Jeff Wilson for being such a positive role model and for all your helpful advice. Your work is truly remarkable and your modesty, charisma and time management skills are inspirational.

v
Paul Arnold for instilling confidence in me and for your constant motivation, valuable suggestions and collaboration. Marina Englesakis for your help in conducting such brilliant literature searches for my systematic reviews. Andrea Skelly and Joe Dettori for teaching me all I know about systematic reviews and for doing it so patiently. Sherry Peterson, Madeleine O’Higgins and Amy Lem for the administrative support and helping me with my organization. Kevin Beverly for your dedication in preparing and cleaning the datasets for my use. Yuriy Petrenko, Yuliya Petrenko and Natalia Nugaeva for mentoring me during my first six months in the Fehlings’ lab and for your unwavering support and friendship. Anick Nater for being such a positive influence and a constant source of inspiration. Aria Nouri for your commitment, passion for research and collaboration and for providing the data I needed to perform the MRI prediction study. Suhkvinder Kalsi Ryan for providing positive and constructive feedback, for motivating me during my thesis writing and for sharing your clinical expertise. My friends and rowing teammates for giving me balance in my life and for always lifting my spirits. I am also thankful to AOSpine North America and International for their sponsorship and
the co-investigators of the CSM-North America and International studies for conducting such
high quality prospective studies. I am grateful that I was able to use this data for my thesis.
My family has truly done this journey with me. My parents have been exceptionally
supportive of my ambitions and have always taken interest in my work. Thank you both for
teaching me invaluable life lessons, giving me the opportunity to succeed and for your
unconditional love. Jennifer, I have come to realize you are my best friend. You have been such
a positive influence in my life and I know I can always count on you and Brent for advice,
reassurance and motivation.
Lindsay A. Tetreault, 2015

vi
Contributions
Chapter 1
Andrea Skelly conducted the literature search and Han Jo Kim assisted with the writing and
editing of Sections 1.5.3 and 1.5.4
Anoushka Singh assisted in the literature review and writing of Section 1.7
Chapter 3
Marina Englesakis conducted the literature search for systematic review A and C. Joe Detorri
and his team at Spectrum assisted with the literature search, data extraction and rating of the
evidence for systematic review B.
Chapter 5
Co-investigators of the CSM-International and North America study were responsible for
collecting the data used throughout this thesis.
Branko Kopjar and his team cleaned the dataset for analysis.
Chapter 9
Aria Nouri analyzed all magnetic resonance images and collected the data used for the analysis
presented in Chapter 9.
Chapter 11
Gamaliel Tan helped adjudicate each complication as related to surgery, related to myelopathy
or unrelated.

vii
Table of Contents Abstract ......................................................................................................................................................... ii
Acknowledgements ...................................................................................................................................... iv
Contributions ............................................................................................................................................... vi
List of Tables ............................................................................................................................................... xiv
List of Figures ............................................................................................................................................ xviii
List of Abbreviations ................................................................................................................................... xxi
Preamble ....................................................................................................................................................... 1
Thesis Structure ............................................................................................................................................ 2
Chapter 1: An Overview of Diagnosis, Pathophysiology, Treatment and Assessment Standards for
Cervical Spondylotic Myelopathy.................................................................................................................. 4
1.1 Introduction ........................................................................................................................................ 4
1.2 Anatomy of the Cervical Spine ............................................................................................................ 4
1.3 The Degenerative Process and Pathophysiology ................................................................................ 5
1.4 Prevalence of CSM and Economic Implications of Disease ................................................................ 7
1.5 Current Approaches to CSM Diagnosis ............................................................................................... 7
1.5.1 Clinical Assessment ...................................................................................................................... 7
1.5.2 Imaging Assessment ..................................................................................................................... 8
1.5.3 Electrodiagnosis ........................................................................................................................... 9
1.5.4 Differential Diagnosis ................................................................................................................. 10
1.6 Risk Factors of Disease Diagnosis, Development and Progression ................................................... 15
1.6.1 Clinical Risk Factors .................................................................................................................... 15
1.6.2 MRI Risk Factors ......................................................................................................................... 16
1.6.3 Genetic Risk Factors ................................................................................................................... 20
1.7 Evaluating Functional Status and Quality of Life using Outcome Measures .................................... 20
1.7.1 Validity of Existing Outcome Tools ............................................................................................ 22
1.7.2 Reliability of Existing Outcome Measures ................................................................................. 26
1.7.3 Responsiveness of Existing Outcome Tools ............................................................................... 26
1.8 Management and Treatment Strategies ........................................................................................... 27
1.8.1 Non-operative Management ..................................................................................................... 27
1.8.2 Surgery ....................................................................................................................................... 29
Chapter 2: A Clinical and Complications Prediction Rule in Cervical Spondylotic Myelopathy: Rationale,
Objectives and Specific Aims ...................................................................................................................... 30

viii
2.1 Definition of a Clinical Prediction Rule.............................................................................................. 30
2.2 The APACHE II Score and the Model for End-Stage Liver Disease .................................................... 30
2.3 Clinical Prediction Rules in Traumatic Spinal Cord Injury ................................................................. 31
2.4 Rationale, Objectives and Specific Aims ........................................................................................... 31
2.4.1 Rationale .................................................................................................................................... 31
2.4.2 Knowledge Gaps in the Literature ............................................................................................. 34
2.4.3 Objectives and Specific Aims ..................................................................................................... 35
Chapter 3: Identifying Significant Predictors of Surgical Outcome and Complications: Results from
Systematic Reviews of the Literature ......................................................................................................... 38
3.1 Introduction ...................................................................................................................................... 38
3.2 Overview of Common Methods ........................................................................................................ 40
3.2.1 Eligibility Criteria ........................................................................................................................ 40
3.2.2 Study Characteristics .................................................................................................................. 42
3.2.3 Information Sources ................................................................................................................... 43
3.2.4 Search Strategy .......................................................................................................................... 43
3.2.5 Study Selection ........................................................................................................................... 44
3.2.6 Data Extraction and Synthesis ................................................................................................... 44
3.2.7 Risk of Bias in Individual Studies ................................................................................................ 44
3.2.8 Risk of Bias Across Studies ......................................................................................................... 45
3.2.9 Clinical Recommendations and Consensus Statements ............................................................ 47
3.3 Results Part A: Important Clinical Predictors of Surgical Outcome .................................................. 48
3.3.1 Study Selection ........................................................................................................................... 48
3.3.2 Study Characteristics .................................................................................................................. 48
3.3.3 Risk of Bias ................................................................................................................................. 48
3.3.4 Are there clinical factors that can predict surgical outcome? ................................................... 49
3.3.5 Results of studies without multivariate analysis ....................................................................... 58
3.3.6 Evidence Summary ..................................................................................................................... 67
3.3.7 Discussion ................................................................................................................................... 67
3.3.8 Evidence-Based Clinical Recommendations .............................................................................. 71
3.4 Results Part B: Important Imaging Predictors of Surgical Outcome ................................................. 72
3.4.1 Study Selection ........................................................................................................................... 72
3.4.2 Study Characteristics .................................................................................................................. 73
3.4.3 Risk of Bias ................................................................................................................................. 73

ix
3.4.4 Are there anatomic characteristics that can predict outcome? ................................................ 78
3.4.5 Are there cord properties that can predict outcome? .............................................................. 80
3.4.6 Evidence Summary ..................................................................................................................... 84
3.4.7 Discussion ................................................................................................................................... 87
3.4.8 Evidence-Based Clinical Recommendations .............................................................................. 90
3.5 Results Part C: Important Clinical and Surgical Predictors of Complications ................................... 90
3.5.1 Study Selection ........................................................................................................................... 90
3.5.2 Study Characteristics .................................................................................................................. 91
3.5.3 Risk of bias ................................................................................................................................. 92
3.5.4 Are there clinical or imaging factors that can predict complications? ...................................... 92
3.5.5 Are there surgical factors that can predict complications? ....................................................... 97
3.5.6 Results of studies without multivariate analysis ....................................................................... 99
3.5.7 Are rates of complications different between surgical interventions or varying techniques? 106
3.5.8 Summary of Evidence .............................................................................................................. 110
3.5.9 Discussion ................................................................................................................................. 122
3.5.10 Evidence-Based Clinical Recommendations .......................................................................... 124
Chapter 4: Surgeons’ Perceptions of Significant Predictors of Surgical Outcome and Complications:
Results from two Surveys of AOSpine International................................................................................. 125
4.1 Introduction .................................................................................................................................... 125
4.2 Overview of Common Methods ...................................................................................................... 126
4.3 Results Part A: Important Clinical and Imaging Predictors of Surgical Outcome ........................... 129
4.3.1 Summary of Respondents ........................................................................................................ 129
4.3.2 Significant Clinical Predictors of Surgical Outcome ................................................................. 130
4.3.3 Significant Imaging Predictors of Surgical Outcome ................................................................ 137
4.3.4 Discussion ................................................................................................................................. 139
4.4 Results Part B: Important Clinical and Surgical Predictors of Complications ................................. 141
4.4.1 Summary of Respondents ........................................................................................................ 141
4.4.2 Complications commonly seen in clinical practice .................................................................. 141
4.4.3 Factors predicting complications ............................................................................................. 143
4.4.4 Significant Clinical Predictors of Complications ....................................................................... 143
4.4.5 Significant Imaging Predictors of Complications ..................................................................... 148
4.4.6 Significant Surgical Predictors of Complications ...................................................................... 149
4.4.7 Discussion ................................................................................................................................. 153

x
Chapter 5: An Overview of the AOSpine CSM-North America and International Studies ........................ 159
5.1 Introduction .................................................................................................................................... 159
5.2 Study Design and Inclusion Criteria ................................................................................................ 159
5.3 Surgical Protocol ............................................................................................................................. 161
5.4 Data Collection ................................................................................................................................ 162
5.4.1 Clinical Variables ...................................................................................................................... 162
5.4.2 Imaging Variables ..................................................................................................................... 166
5.4.3 Surgical Variables ..................................................................................................................... 168
5.5 Primary Outcome Measure ............................................................................................................. 169
5.6 Complications .................................................................................................................................. 170
Chapter 6: The Minimal Clinically Important Difference of the modified Japanese Orthopedic Association
Score and Establishing a Cut-Off Point ..................................................................................................... 174
6.1 Introduction .................................................................................................................................... 174
6.2 Methods .......................................................................................................................................... 175
6.2.1 Patient Sample ......................................................................................................................... 175
6.2.2 The MCID of the mJOA ............................................................................................................. 175
6.2.3 MCID translated to a cut-off point ........................................................................................... 177
6.3 Results ............................................................................................................................................. 178
6.3.1 What is the MCID of the mJOA? .............................................................................................. 179
6.3.2 Does the MCID of the mJOA differ based on severity? ........................................................... 180
6.4 MCID translated to a cut-off point .................................................................................................. 183
6.5 Discussion ........................................................................................................................................ 184
6.6 Strengths and Limitations ............................................................................................................... 186
6.7 Conclusion ....................................................................................................................................... 187
Chapter 7: A Clinical Prediction Model to Determine Outcomes in Patients with Cervical Spondylotic
Myelopathy undergoing Surgical Treatment: Data from the Prospective, Multicenter AOSpine North
American Study ......................................................................................................................................... 188
7.1 Introduction .................................................................................................................................... 188
7.2 Methods .......................................................................................................................................... 188
7.2.1 Patient Sample ......................................................................................................................... 188
7.2.2 Statistical Analysis .................................................................................................................... 188
7.2.3 Secondary Analysis ................................................................................................................... 189
7.3 Results ............................................................................................................................................. 189
7.3.1 Patient Sample ......................................................................................................................... 189

xi
7.3.2 Univariate Analysis ................................................................................................................... 191
7.3.3 Multivariate Analysis ................................................................................................................ 192
7.3.4 Secondary Analysis ................................................................................................................... 194
7.4 Discussion ........................................................................................................................................ 195
7.5 Study Strengths and Limitations ..................................................................................................... 197
7.6 Conclusions ..................................................................................................................................... 198
Chapter 8: A Clinical Prediction Model to Assess Surgical Outcome in Patients with Cervical Spondylotic
Myelopathy: Internal and External Validation using the Prospective Multicenter AOSpine North
American and International Datasets in 743 Patients .............................................................................. 199
8.1 Introduction .................................................................................................................................... 199
8.2 Methods .......................................................................................................................................... 202
8.2.1 Patient Sample ......................................................................................................................... 202
8.2.2 Statistical Analysis .................................................................................................................... 202
8.3 Results ............................................................................................................................................. 203
8.3.1 Patient Sample ......................................................................................................................... 203
8.3.2 Original Model ......................................................................................................................... 204
8.3.3 Internal Validation ................................................................................................................... 206
8.3.4 External Validation ................................................................................................................... 207
8.4 Discussion ........................................................................................................................................ 210
8.5 Applying the Model ......................................................................................................................... 211
8.5.1 Managing Expectations ............................................................................................................ 212
8.5.2 Counseling Patients .................................................................................................................. 213
8.5.3. Influencing Practice ................................................................................................................. 215
8.5.4 Aligning Surgeon Perceptions with Objective Evidence .......................................................... 216
8.6 Strengths and Limitations ............................................................................................................... 217
8.7 Conclusions ..................................................................................................................................... 218
Chapter 9: Does Magnetic Resonance Imaging Improve the Predictive Performance of our Validated
Clinical Prediction Rule ............................................................................................................................. 219
9.1 Introduction .................................................................................................................................... 219
9.2 Methods .......................................................................................................................................... 220
9.2.1 Patient Sample ......................................................................................................................... 220
9.2.2 Statistical Analysis .................................................................................................................... 220
9.3 Results ............................................................................................................................................. 221
9.4 Discussion ........................................................................................................................................ 225

xii
9.5 Strengths and Limitations ............................................................................................................... 227
9.6 Conclusions ..................................................................................................................................... 228
Chapter 10: A Clinical Prediction Rule for Functional Outcomes in Patients Undergoing Surgery for
Cervical Spondylotic Myelopathy: Analysis of an International AOSpine Prospective Multicentre Dataset
of 757 Subjects .......................................................................................................................................... 229
10.1 Introduction .................................................................................................................................. 229
10.2 Methods ........................................................................................................................................ 230
10.2.1 Patient Sample ....................................................................................................................... 230
10.2.2 Statistical Analysis .................................................................................................................. 230
10.3 Results ........................................................................................................................................... 231
10.3.1 Patient Sample ....................................................................................................................... 231
10.3.2 Predicting a mJOA score ≥16 ................................................................................................. 232
10.4 Discussion...................................................................................................................................... 237
10.5 Conclusions ................................................................................................................................... 240
Chapter 11: Clinical and Surgical Predictors of Complications following Surgery for the Treatment of
Cervical Spondylotic Myelopathy: Results from the Prospective AOSpine International study of 479
Patients ..................................................................................................................................................... 242
11.1 Introduction .................................................................................................................................. 242
11.2 Methods ........................................................................................................................................ 243
11.2.1 Patient Sample ....................................................................................................................... 243
11.2.2 Statistical Analysis .................................................................................................................. 243
11.3 Results ........................................................................................................................................... 244
11.3.1 Patient Sample ....................................................................................................................... 244
11.3.2 Complications ......................................................................................................................... 246
11.3.3 Univariate Analysis ................................................................................................................. 246
11.3.4 Multivariate Analysis .............................................................................................................. 248
11.3.5 Sub-Analyses .......................................................................................................................... 249
11.4 Applying the Model to Two Cases ................................................................................................ 250
11.5 Discussion...................................................................................................................................... 252
11.6 Strengths and Limitations ............................................................................................................. 255
11.7 Conclusions ................................................................................................................................... 255
Chapter 12: Summary of Findings, General Discussion, Thesis Limitations and Future Directions ......... 257
12.1. An Overview: Predicting Surgical Outcome ................................................................................. 257
12.2 An Overview: Predicting Complications ........................................................................................ 264
xiii
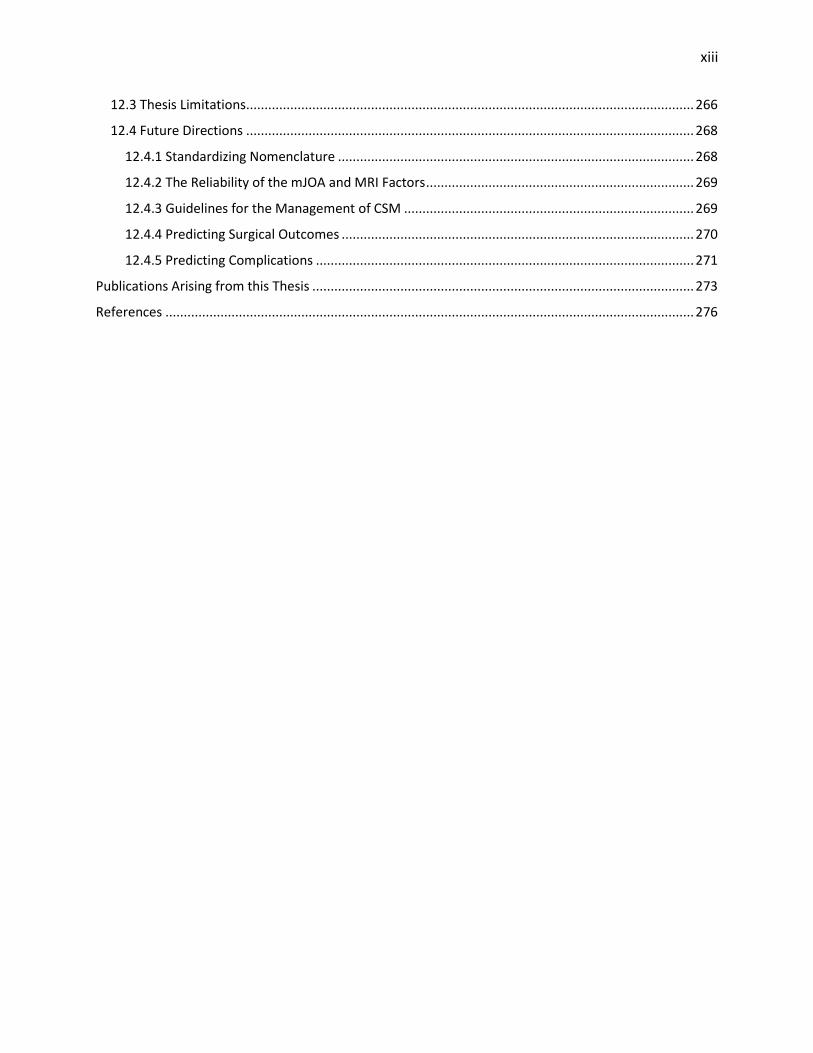
12.3 Thesis Limitations .......................................................................................................................... 266
12.4 Future Directions .......................................................................................................................... 268
12.4.1 Standardizing Nomenclature ................................................................................................. 268
12.4.2 The Reliability of the mJOA and MRI Factors ......................................................................... 269
12.4.3 Guidelines for the Management of CSM ............................................................................... 269
12.4.4 Predicting Surgical Outcomes ................................................................................................ 270
12.4.5 Predicting Complications ....................................................................................................... 271
Publications Arising from this Thesis ........................................................................................................ 273
References ................................................................................................................................................ 276

xiv
List of Tables
Table 1-1. Differential Diagnoses of CSM ..................................................................................... 12
Table 1-2. Methods of Differentiating between CSM and other Common Diagnoses ................ 14
Table 1-3 Clinical Risk Factors of CSM Diagnosis .......................................................................... 15
Table 1-4. MRI Risk Factors of CSM Diagnosis .............................................................................. 18
Table 1-5. A Summary of Studies Evaluating the Validity of Various Measurement Tools ..... 23-25
Table 1-6. Reliability of the JOA, 30-meter Walking Test, NDI and SF-36 .................................... 26
Table 1-7 Responsiveness of the SF-36, mJOA, and NDI .............................................................. 27
Table 3-1. Relevant Prognostic Factors for Systematic Reviews A, B and C ................................. 41
Table 3-2. Relevant Outcomes for Systematic Reviews A, B and C .............................................. 42
Table 3-3. Definition of the Different Levels of Evidence for Prognostic Studies ....................... 45
Table 3-4. Definition of the Different Levels of Evidence for Therapeutic Studies ...................... 46
Table 3-5. Overview of Grade: Reasons for Upgrading and Downgrading Level of Evidence ...... 47
Table 3-6. Characteristics of Prognostic Studies with Multivariate Analysis: Systematic Review A
.................................................................................................................................................. 51-54
Table 3-7. Important Clinical Predictors of Surgical Outcomes: Results of Univariate and
Multivariate Analysis................................................................................................................ 59-62
Table 3-8. The Association between Age and Surgical Outcome: Results from Studies without
Multivariate Analysis .................................................................................................................... 63
Table 3-9. The Predictive Value of Duration of Symptoms: Results from Studies without
Multivariate Analysis..................................................................................................................... 64
Table 3-10. The Relationship between Preoperative Myelopathy Severity and Surgical Outcome:
Results from Studies without Multivariate Analysis ..................................................................... 65
Table 3-11: Other Clinical Predictors of Surgical Outcome: Results from Studies without
Multivariate Analysis..................................................................................................................... 66
Table 3-12. Evaluation of Overall Body of Evidence using GRADE: Systematic Review A ....... 68-69
Table 3-13. Characteristics of Prognostic Imaging Studies with Multivariate Analysis: Systematic
Review B ................................................................................................................................... 75-77
Table 3-14. Association of Anatomic MRI Characteristics with Surgical Outcomes ..................... 80

xv
Table 3-15. Association of MRI Signal Intensity Characteristics with Surgical Outcomes ....... 82-83
Table 3-16. Evaluation of Overall Body of Evidence using GRADE: Systematic Review B ....... 85-86
Table 3-17. Characteristics of Prognostic Complications Studies with Multivariate Analysis:
Systematic Review C ................................................................................................................ 93-94
Table 3-18. Important Clinical, Imaging and Surgical Predictors of Complications: Results of
Univariate and Multivariate Analysis ................................................................................... 100-102
Table 3-19. Clinical, Imaging and Surgical Predictors of Complications: Results of Prognostic
Studies without Multivariate Analysis ................................................................................. 104-106
Table 3-20. Comparative Surgical Studies reporting differences in Complication Rates .... 111-116
Table 3-21. Evaluation of Overall Body of Evidence using GRADE: Systematic Review C ... 117-121
Table 4-1. Survey Questions and Answer Options for Part A .............................................. 126-127
Table 4-2. Survey Questions and Answer Options for Part B .................................................... 127-128
Table 4-3. Important Clinical Predictors of Surgical Outcome: Results for Entire Sample and each
Geographic Region ................................................................................................................................. 132
Table 4-4. Threshold Duration of Symptoms, Age and Baseline Severity Score and Smoking as a
Predictor .................................................................................................................................................. 134
Table 4-5. Important Imaging Predictors of Surgical Outcome: Results for Entire Sample and
each Geographic Region ........................................................................................................................ 138
Table 4-6. Important Clinical Predictors of Postoperative Complications: Results for Entire
Sample and each Geographic Region .................................................................................................. 145
Table 4-7. Complication Rates in Anterior vs. Posterior Surgery ..................................................... 149
Table 4-8. Complications Rates in 1-Stage vs. 2-Stage Surgery ....................................................... 150
Table 4-9. Complication Rates between Laminectomy with Fusion and Laminoplasty ............... 151
Table 4-10. Complication Rates between Fusion and Non-Fusion Surgery ................................... 152
Table 5-1. Inclusion and Exclusion Criteria for Participation in the CSM-North America and CSM-
International Studies .............................................................................................................................. 160
Table 5-2. A Summary of Relevant Clinical Variables collected as part of the CSM-North America
and International Studies ............................................................................................................... 162-166
Table 5-3. A Summary of the Imaging Parameters collected using Quantitative Analysis of
Magnetic Resonance Images from Patients enrolled in the CSM-North America Study ............. 167

xvi
Table 5-4. A Summary of Relevant Surgical Variables collected as part of the AOSpine Studies .................................................................................................................................................................. 168
Table 5-5. The modified Japanese Orthopaedic Association Scale ................................................. 169
Table 5-6. Assessing Outcome in Patients with CSM: Advantages and Disadvantages of the
mJOA, SF-36, NDI, Nurick and 30-meter walking test ................................................................ 171-172
Table 5-7. A List and Description of Anticipated Surgery-Related Complications ........................ 173
Table 6-1. A Summary of Demographics, Baseline Status and Surgical Outcomes of 517 Patients
Enrolled in the AOSpine CSM-North America or CSM-International Multicenter Studies .......... 178
Table 6-2. The mJOA Change Scores in Patients Classified as “Worsened,” “Unchanged,”
“Slightly Improved” and “Markedly Improved” based on the NDI ................................................. 179
Table 6-3. Establishing a Cut-off to Distinguish between Patients with an “Optimal” and
“Suboptimal” Surgical Outcome........................................................................................................... 184
Table 7-1. Patient Baseline Demographic Information and 1-year Functional Outcomes following
Surgery: CSM-North America Study ..................................................................................................... 190
Table 7-2. Univariate Analyses Evaluating the Association between Various Clinical Predictors
and a mJOA Score ≥16 at 1-year following Surgery ........................................................................... 192
Table 7-3: A Clinical Prediction Model to Determine Functional Status and Predict an “Optimal”
Surgical Outcome (mJOA≥16) .............................................................................................................. 194
Table 7-4. Final Linear Regression Model using Postoperative mJOA at 1-year as the Dependent
Variable .................................................................................................................................................... 194
Table 8-1. General Characteristics of the CSM-North America and the CSM-International study .................................................................................................................................................................. 205
Table 8-2. Odds Ratios for Original North American Model and Bootstrap Model ...................... 206
Table 8-3. Calibration of the Original and CSM-International Validation Models ........................ 209
Table 8-4. Refitting the Original Logistic Regression Model on the CSM-International Sample ........................................................................................................................................................... 209-210
Table 9-1. Demographic and MRI Information of a Subset of 99 Patients Enrolled in the CSM-
North America Study.............................................................................................................................. 222
Table 9-2. Predictive Performance of Original Model with the Addition of Various MRI
Parameters .............................................................................................................................................. 223
Table 10-1. Patient Baseline Demographic Information and 1-year Functional Outcomes
following Surgery for CSM ............................................................................................................. 233-234

xvii
Table 10-2. Univariate Analyses Evaluating the Association between Various Clinical Predictors
and a mJOA Score ≥16 at 1-year following Surgery ........................................................................... 234
Table 10-3. Final Clinical Prediction Model to Determine Functional Status (mJOA≥16) at 1-year
following Surgery .................................................................................................................................... 235
Table 10-4. Univariate Analyses Evaluating the Association between Various Clinical Predictors
and a mJOA score ≥12 at 1-year following Surgery in Patients with Severe CSM (mJOA<12) .... 236
Table 10-5. Final Clinical Prediction Model to Determine Functional Status (mJOA≥12) at 1-year
following Surgery in Patients with Severe CSM (mJOA<12) ............................................................. 237
Table 11-1. General Characteristics, Signs and Symptoms, Co-Morbidities, Diagnosis and Surgical
Summary of CSM patients enrolled in the CSM-International Study ............................................. 245
Table 11-2. Univariate Analysis assessing the Relationship between Various Clinical Factors and
Perioperative Complications ................................................................................................................. 247
Table 11-3. Univariate Analysis assessing the Relationship between Various Surgical Factors and
Perioperative Complications ................................................................................................................. 248
Table 11-4. Final Complications Prediction Model: Significant Clinical and Surgical Predictors of
Perioperative Complications ................................................................................................................. 249
Table 11-5. The Association between Important Predictors and Specific Type of Complications .................................................................................................................................................................. 251
Table 11-6. The Relationship between Type of Complications and Surgical Approach, Number of Stages and Posterior Technique ........................................................................................................... 251
xviii
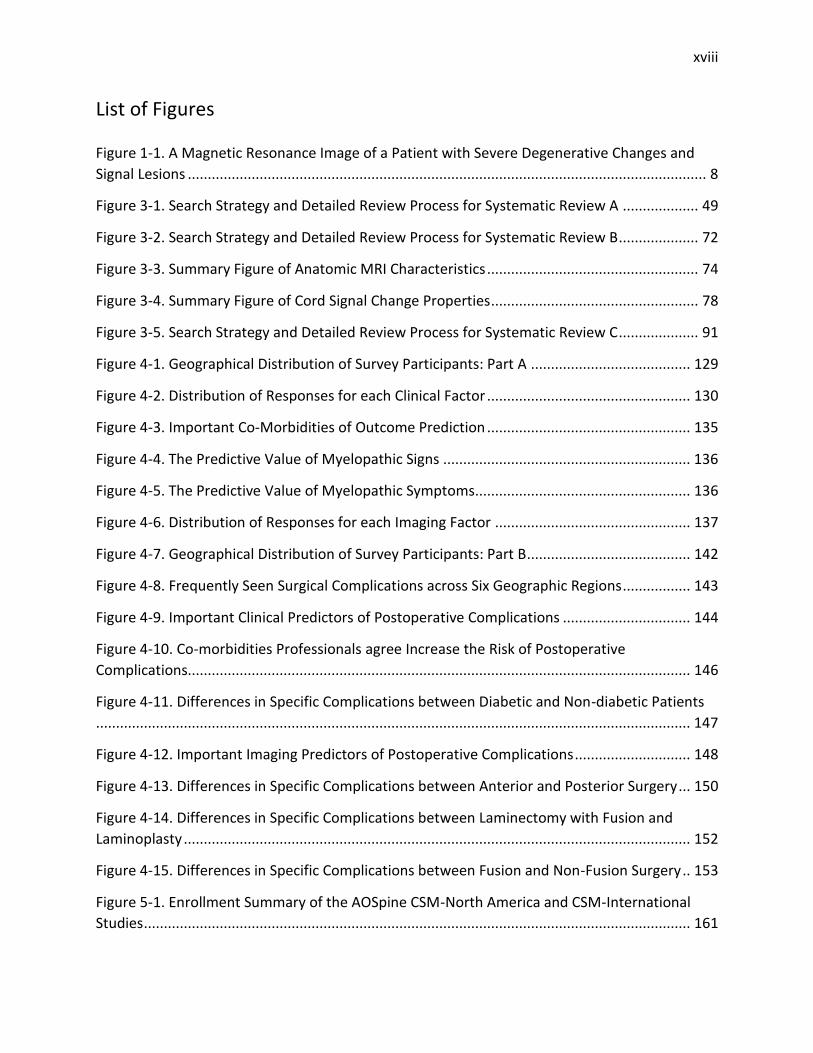
List of Figures
Figure 1-1. A Magnetic Resonance Image of a Patient with Severe Degenerative Changes and
Signal Lesions .................................................................................................................................. 8
Figure 3-1. Search Strategy and Detailed Review Process for Systematic Review A ................... 49
Figure 3-2. Search Strategy and Detailed Review Process for Systematic Review B .................... 72
Figure 3-3. Summary Figure of Anatomic MRI Characteristics ..................................................... 74
Figure 3-4. Summary Figure of Cord Signal Change Properties .................................................... 78
Figure 3-5. Search Strategy and Detailed Review Process for Systematic Review C .................... 91
Figure 4-1. Geographical Distribution of Survey Participants: Part A ........................................ 129
Figure 4-2. Distribution of Responses for each Clinical Factor ................................................... 130
Figure 4-3. Important Co-Morbidities of Outcome Prediction ................................................... 135
Figure 4-4. The Predictive Value of Myelopathic Signs .............................................................. 136
Figure 4-5. The Predictive Value of Myelopathic Symptoms...................................................... 136
Figure 4-6. Distribution of Responses for each Imaging Factor ................................................. 137
Figure 4-7. Geographical Distribution of Survey Participants: Part B ......................................... 142
Figure 4-8. Frequently Seen Surgical Complications across Six Geographic Regions ................. 143
Figure 4-9. Important Clinical Predictors of Postoperative Complications ................................ 144
Figure 4-10. Co-morbidities Professionals agree Increase the Risk of Postoperative
Complications.............................................................................................................................. 146
Figure 4-11. Differences in Specific Complications between Diabetic and Non-diabetic Patients
..................................................................................................................................................... 147
Figure 4-12. Important Imaging Predictors of Postoperative Complications ............................. 148
Figure 4-13. Differences in Specific Complications between Anterior and Posterior Surgery ... 150
Figure 4-14. Differences in Specific Complications between Laminectomy with Fusion and
Laminoplasty ............................................................................................................................... 152
Figure 4-15. Differences in Specific Complications between Fusion and Non-Fusion Surgery .. 153
Figure 5-1. Enrollment Summary of the AOSpine CSM-North America and CSM-International
Studies ......................................................................................................................................... 161
xix
Figure 5-2. Computing Signal Change Ratios .............................................................................. 168
Figure 6-1. ROC Analysis: Difference between Sensitivity and Specificity for All Patients ........ 180
Figure 6-2. Results from a Survey of AOSpine International ...................................................... 181
Figure 6-3. ROC Analysis: Difference between Sensitivity and Specificity for Mild Patients ..... 181
Figure 6-4. ROC Analysis: Difference between Sensitivity and Specificity for Moderate Patients
..................................................................................................................................................... 182
Figure 6-5. ROC Analysis: Difference between Sensitivity and Specificity for Severe Patients .. 183
Figure 6-6. The Distribution of the Number of MCIDs Gained or Lost in two Outcome Groups
(mJOA≥16 and mJOA<16 at 1-year) ............................................................................................ 184
Figure 7-1. Receiver Operating Curve for the Final Clinical Prediction Model ........................... 193
Figure 8-1. Receiver Operating Curves for Original and Bootstrap Models ................................... 206
Figure 8-2. Receiver Operating Curves for the Original North American Model (red) and the
Model Validated on the International Population (blue) ................................................................. 207
Figure 8-3: Calibration Plots. A (top): Original model; B (bottom): Validated Model .................. 208
Figure 8-4. Applying the Clinical Prediction Model in a Surgical Setting: Case 2 .......................... 213
Figure 8-5. Applying the Clinical Prediction Model in a Surgical Setting: Case 3 .......................... 214
Figure 8-6. Applying the Clinical Prediction Model in a Surgical Setting: Case 4 .......................... 217
Figure 9-1. An Overview of our Patient Sample derived from the CSM-North America Study ... 220
Figure 9-2. Summary of Functional Outcome at 1-year Post-Surgery ............................................ 221
Figure 9-3. ROC Curves of Original Model + T2 Hyperintensity, T1-Hypointensity or Combined
T1/T2 Signal Change ............................................................................................................................... 223
Figure 9-4. ROC Curves of Original Model + Height or Area of T2 Signal Change ......................... 224
Figure 9-5. ROC Curves of Original Model + Spinal Canal Compromise or Spinal Cord
Compression ........................................................................................................................................... 224
Figure 9-6. ROC Curves of Original Model + Signal Change Ratio ................................................... 225
Figure 10-1. Summary of Participating Subjects and Predictors Evaluated in this Study ............ 231
Figure 11-1. An Overview of the Types of Complications experienced by CSM Patients in the
Perioperative Period .............................................................................................................................. 247
Figure 11-2. Applying the Complications Prediction Model in a Surgical Setting: Case 1 ............ 250

xx
Figure 12-1. A Theoretical Framework of the Prediction Model ..................................................... 261
Figure 12-2. A Summary of Complications seen in Patients undergoing Surgery for CSM .......... 272

xxi
List of Abbreviations ADC – Apparent Diffusion Coefficient ACDF – Anterior Cervical Discectomy and Fusion AHQR – Agency for Healthcare Research and Quality ALS – Amyotrophic Lateral Sclerosis AUC – Area Under the Curve BMI – Body Mass Index BP – Bodily Pain CDH – Cervical Disc Herniation CI – Confidence Interval CMS – Center for Medicare & Medicaid Services CSF – Cerebrospinal Fluid CT – Computed Tomography CSM – Cervical Spondylotic Myelopathy DCM – Degenerative Cervical Myelopathy DTI – Diffusion Tensor Imaging ELAP – Expansive Open-door Laminoplasty EMG – Electromyography FA – Fractional Anisotropy GH – General Health GRADE – Grades of Recommendation Assessment, Development and Evaluation ICD – International Classification of Disease JOA – Japanese Orthopaedic Association KQ – Key Question MCC – Maximum Canal Compromise MELD – Model for End Stage Liver Disease MEP – Motor Evoked Potential MCID – Minimal Clinically Important Difference MCS – Mental Component Score MH – Mental Health
mJOA – modified Japanese Orthopaedic Association MRI – Magnetic Resonance Imaging MS – Multiple Sclerosis MSCC – Maximum Spinal Cord Compression NCS – Nerve Conduction Studies NCSS – Neurological Cervical Spine Scale NDI – Neck Disability Index ntSCI – non-traumatic Spinal Cord Injury OPLL – Ossification of the Posterior Longitudinal Ligament OR – Odds Ratio PCS – Physical Component Score PF – Physical Functioning PIVD – Prolapsed Intervertebral Discs RE – Role Limitations Emotional RP – Role Limitations Physical ROC – Receiver Operating Characteristics SCI – Spinal Cord Injury SCR – Signal Change Ratio SF – Social Functioning SEM – Standard Error of Measurement SEP – Sensory Evoked Potential SF-36 – Short-Form-36 SI – Signal Intensity/Change SNP – Single Nucleotide Polymorphism SSEP – Somatosensory Evoked Potential tSCI – traumatic Spinal Cord Injury VT - Vitality WI – Weighted Image

1
Preamble
Cervical spondylotic myelopathy (CSM) is a progressive, degenerative spine disease and
the most common cause of spinal cord dysfunction in adults worldwide.1, 2 As our population
ages, an increased number of patients will exhibit degenerative changes and suffer from
varying stages of myelopathy.3 It is essential that global health systems develop guidelines for
the management of CSM to ensure adequate patient support, appropriate treatment plans and
optimal outcomes. Surgery is increasingly recommended as the preferred treatment strategy
for patients with CSM as it can effectively halt disease progression and improve neurological
outcomes, functional status and quality of life.4-9 Surgery, however, is not risk free and is
associated with complications in 11-38% of patients.10, 11 The majority of these are transient,
non-neurological and do not require invasive intervention or prolonged hospital stay.
Regardless, surgical complications still taint a patient’s overall perception of surgery and may
often involve postoperative management, additional follow-up visits and increased associated
costs.
Predicting surgical outcome and perioperative complications in these patients are
increasingly important research topics. This information is valuable to clinicians because 1) it
helps manage patients’ expectations which are directly associated with perception of outcome
and satisfaction; 2) it provides decision-making support to surgeons; 3) it allows surgeons to
identify high-risk patients and institute rigorous preventative strategies; and 4) it gives surgeons
a tool to counsel their patients and discuss relative risks and benefits of the procedure.
Furthermore, this information will enable health care providers to better anticipate hospital
utilization costs, allocate sufficient resources and strategize postoperative management. Given
its clinical value, both an outcome and complications prediction model should be incorporated
into the clinical guidelines for CSM management.
It is therefore the objective of this thesis to develop prediction models that can
accurately predict surgical outcome and perioperative complications in patients with CSM.

2
Thesis Structure
This thesis has two key objectives and has been organized according to the “multiple
paper format” using primarily unaltered peer reviewed material. The first objective is to
develop a clinical prediction rule to predict functional outcomes in patients with CSM
undergoing surgery. The second objective is to determine significant clinical and surgical
predictors of perioperative complications and to construct a complications prediction rule that
can help clinicians identify their high risk patients.
This thesis is divided into 12 chapters. Chapter 1 provides an introduction to the topic of
CSM and summarizes the diagnosis, pathophysiology, clinical and imaging assessment, risk
factors and treatment for this disease. Chapter 2 is a modified version of a paper under review
at the “Evidence-Based Spine Journal” and defines the value of clinical prediction rules in and
out of the setting of spinal cord injury (SCI). Section 2.4 provides the rationale, objectives and
specific aims of this thesis. Chapter 3 presents the methods and results of three systematic
reviews conducted to evaluate important clinical and imaging predictors of surgical outcome
and significant clinical and surgical predictors of complications. This chapter is derived from
three separate manuscripts published in the “European Spine Journal,” “SPINE,” and “Journal of
Neurosurgery: Spine.” Chapter 4 outlines the methods and results from two surveys distributed
to members of AOSpine International and compares these findings to the conclusions from our
systematic reviews. The results from these surveys were published in “World Neurosurgery.”
Chapter 5 is a brief section that summarizes the key objectives of the AOSpine studies and
provides an overview of the datasets used in our analyses. Chapter 6 is a modified version of a
paper published by “SPINE” and establishes the minimal clinically important difference (MCID)
of the modified Japanese Orthopaedic Association (mJOA) scale and uses this value to define an
appropriate cut-off between an “optimal” and “suboptimal” outcome. Chapter 7 is a
reformatted version of a paper published in “Journal of Bone and Joint Surgery” and describes
the initial modeling process using data from patients enrolled in the AOSpine CSM-North
America study. Chapter 8 is derived from a manuscript published in “The Spine Journal” and
summarizes the results of external validation using data on patients enrolled in the AOSpine
3
CSM-International study. Chapter 9 evaluates the role of magnetic resonance imaging (MRI) as
a prognostic tool and aims to determine whether specific imaging variables can improve the
predictive performance of our validated prediction model. This paper has been published by
“SPINE.” Our final outcome prediction paper has been accepted for publication by “Journal of
Bone and Joint Surgery” and is presented in Chapter 10. Chapter 11 is a reformatted version of
a paper invited to be published in “Neurosurgery” and presents a preliminary complications
prediction model that can be used to identify high risk surgical patients. Finally, Chapter 12
summarizes the findings and limitations of our studies and suggests future directions.
4
Chapter 1: An Overview of Diagnosis, Pathophysiology, Treatment and
Assessment Standards for Cervical Spondylotic Myelopathy
1.1 Introduction
Spinal cord injury (SCI) is an insult to the spinal cord that results in disturbances to
normal sensory, motor, or autonomic function and ultimately impacts a patient’s physical,
emotional and social well-being.12 A SCI can be caused by a traumatic event such as a motor
vehicle accident or a fall, or may result from non-traumatic etiologies, including tumors,
degenerative changes, loss of blood supply and infection. Cervical spondylotic myelopathy
(CSM) is a progressive spine disease caused by the degeneration of various components of the
spinal axis and is an example of a non-traumatic SCI that can result in severe neurological
impairment and reduced quality of life.13 This thesis will focus on patients with cord
compression secondary to degenerative changes or “degenerative cervical myelopathy (DCM)”.
We will use the terms DCM and CSM synonymously throughout this thesis. The goal of this
chapter is to provide an overview of the pathophysiology, epidemiology, diagnosis, risk factors,
measurements tools and management strategies for CSM.
1.2 Anatomy of the Cervical Spine
The cervical spine consists of seven vertebrae that span from the occipital bone at the
base of the skull to the thoracic vertebrae that articulate with the ribs.14 A normal vertebra
houses the spinal cord and is composed of a rounded body anteriorly and a vertebral arch
posteriorly.14 The vertebral arch consists of a pair of pedicles and laminae and gives rise to one
spinous, two transverse and four articular processes. The spinous and transverse processes
serve as attachment sites for ligaments and muscles whereas the articular processes adjoin two
adjacent vertebrae.
Intervertebral discs lie between each vertebra and consist of a peripheral annulus
fibrosus and a central nucleus pulposus.14 The annulus fibrosus is composed of fibrocartilage
and firmly attaches to adjacent vertebral bodies and the anterior and posterior longitudinal
5
ligaments. The nucleus pulposus is comprised of gelatinous material and, as such, provides
mobility to the vertebrae.
The vertebral bodies of C3 through C7 have lateral hook-shape processes known as the
uncinate processes that articulate with the surface of the above vertebra and form
uncovertebral joints.15 At the junction of the pedicle and lamina there is a bony pillar that forms
the superior (upward projection) and inferior (downward projection) articular facets. The
superior facet of one vertebra adjoins with the inferior facet of the above vertebra to form a
facet joint on each side of the spinal canal.14
The spinal ligaments provide additional support to the spinal column and consist of the
anterior and posterior longitudinal ligaments, the supraspinous ligaments, interspinous
ligaments, intertransverse ligaments and ligamentum flavum.14 The ones relevant to this thesis
are the posterior longitudinal ligaments which run as a continuous band down the posterior
surface of the vertebral bodies and intervertebral discs, and the ligamentum flavum which
connects the laminae of adjacent vertebrae.
1.3 The Degenerative Process and Pathophysiology
CSM is a progressive disease caused by age-related alterations including a) degeneration
of the facet joints, intervertebral discs and/or vertebral bodies; b) hypertrophy of the
ligamentum flavum; and c) ossification of the longitudinal ligament (OPLL).1, 13 As the spine
ages, the discs begin to degenerate and can no longer fulfill their weight bearing and load-
transferring functions.13, 16 As a result, the uncovertebral processes experience increased load
and become flattened. This alters the load-bearing function of the intervertebral joint and puts
increased stress on the articular cartilage endplates. Osteophytes develop to stabilize
hypermobility and to increase the weight bearing surface of the end plates.17 These bony spurs
also protrude outward from the vertebral body to cover the bulging intervertebral disc.2 In
addition, the ligamentum flavum may stiffen and buckle due to loss of disc height and
straightening of cervical lordosis and other spinal ligaments may hypertrophy or ossify.13, 18
6
These age-related degenerative changes ultimately narrow the spinal canal and
encroach on the spinal cord. In addition to static mechanical factors, nerve root and spinal cord
compression can be aggravated by dynamic factors.19 For example, in neck flexion, the spinal
cord can be compressed by ventral osteophytes, and in extension, the cord can be pinched
between the vertebrae body and the lamina or ligamentum flavum.15 Mechanical, chronic
compression of the cord reduces intraparenchymal spinal cord flow, affects the integrity of the
microvasculature and results in spinal cord ischemia.20, 21 This ischemia damages
oligodendrocytes, endothelial cells and neurons and initiates a chronic immune response that
consists of microglia activation and macrophage recruitment to the site of compression.22-24
Persistent compression can result in axonal demyelination, gliosis, scarring, cavitation,
degeneration of the corticospinal tracts, interneuronal loss and atrophy of the anterior horn
cells.16
The prevalence of degenerative changes in the asymptomatic population is not well
documented. In a study by Ernst et al (2005), the prevalence of annular tears and bulging discs
was 36.7% and 73% of asymptomatic volunteers, respectively.25 Disc protrusions were also seen
in 50% and an extrusion was identified in one subject at the C5-C6 level. Thirty-three percent of
volunteers presented with severe degeneration of one or more discs and 13.3% exhibited
image evidence of medullar compression. A second study on 1211 asymptomatic volunteers
from Japan reported significant disc bulging in 87.6% of the sample and evidence of spinal cord
compression in 5.3%.26 Furthermore, 2.3% exhibited high signal intensity lesions on T2-
weighted images (WI) and 3.1% had flattening of the spinal cord. Finally, Matsumoto et al
(1998) evaluated the discs of 497 volunteers and identified grade-1 (dark and/or speckled) and
grade-2 (almost black) disc degeneration in 86% and 89% of subjects over 60 years of age,
respectively.27 Approximately eight percent of volunteers exhibited grade-2 posterior disc
protrusion with spinal cord compression. OPLL was present in 0.4-3.6% of the sample. All three
studies reported an increase in prevalence of degenerative changes with increasing age.25-27 In
addition, Kato et al (2012) demonstrated a decrease in the diameter of the spinal cord, spinal
canal and dural tube and in the area of the dural tube and spinal cord with increasing age.28
7
Asymptomatic patients with evidence of cervical canal stenosis and cord compression
due to spondylosis are at a high risk of developing signs and symptoms of myelopathy.29
According to a systematic review by Wilson et al (2013), approximately 8% of these patients will
deteriorate and exhibit clinical evidence of CSM at 1-year and 23% at a median of 44-months.29
1.4 Prevalence of CSM and Economic Implications of Disease
CSM is the most common cause of spinal cord dysfunction in adults worldwide.
According to the World Health Organization, the proportion of the population over 60 years of
age is projected to double from 11% in 2010 to 22% in 2050. Thus, it is anticipated that
healthcare systems worldwide will be confronted with an increase in patients presenting with
degenerative changes and varying stages of myelopathy.3 In a recent review on the
epidemiology of non-traumatic SCI (ntSCI), New et al (2013) estimated that degenerative spine
disease encompasses 59% of ntSCIs in Japan, 54% in the USA, 31% in Europe, 22% in Australia
and between 4-30% in Africa.30 Furthermore, the regional incidences of ntSCI in North America,
Europe and Australia are 76, 26 and 6 per million, respectively and the prevalence in Canada is
1,120/million. From these numbers, Nouri et al (2015) conservatively estimated the incidence
and prevalence of CSM in North America as 41 and 605/million, respectively.31 Given this
expected increase in disease prevalence, clinicians must design and implement effective
treatment strategies for patients with CSM in order to optimize outcome, improve quality of life
and lessen future cost burden.
1.5 Current Approaches to CSM Diagnosis
1.5.1 Clinical Assessment
Patients with evidence of cervical degeneration may be completely asymptomatic or
simply have localized neck pain.15 If these degenerative changes result in nerve root or cord
compression, patients may experience referred pain into the upper extremities or exhibit motor
dysfunction in the upper and lower limbs, sensory loss or sphincter disturbance.15
CSM is first diagnosed based on patient reported symptoms and a detailed neurologic
examination.32 Common symptoms include numb hands, loss of manual dexterity, bilateral arm

8
paresthesia, impaired gait, lower extremity weakness, l’Hermitte’s phenomena, urge
incontinence and urgency of urination and defecation.15, 16 Relevant signs of myelopathy are
hyperreflexia, clonus, a positive Hoffman sign, upgoing plantar responses, lower limb spasticity,
corticospinal distribution motor deficits, atrophy of intrinsic hand muscles, broad-based
unstable gait and sensory loss.15, 16
1.5.2 Imaging Assessment
Magnetic resonance imaging (MRI) can visualize neural, osseous and soft tissue
structures with high-resolution and is routinely used to confirm the diagnosis of CSM.33 MRI
can evaluate the degree of degeneration and canal stenosis, identify compression of the spinal
cord and detect intramedullary signal changes.34 It is also one of the most valuable tools to
differentiate between CSM and other similar diagnoses as it can visualize anatomical changes of
the spinal axis and parenchymal abnormalities including neoplasms, demyelinating plaques and
syringomyelia.32 Furthermore, MRI plays a role in surgical decision making and may be useful in
predicting postoperative outcomes. Figure 1-1 displays a MRI of a patient with severe
degenerative changes, spinal canal narrowing and a high signal lesion on a T2WI.
Figure 1-1. A Magnetic Resonance Image of a Patient with Severe Degenerative Changes and Signal Lesions
9
Using a MRI, a clinician typically evaluates the anteroposterior diameter, compression
ratio and transverse area of the spinal cord and searches for T1 signal hypointensity, T2 signal
hyperintensity, segmentation of T2 signal change, effacement of cerebrospinal fluid (CSF) and
deformation of the cord.15
Unfortunately, patients cannot be examined by MRI if they have metallic foreign body in
their eye, aneurysm clips, embedded wires, stimulators or batteries, nitroglycerin patches,
pacemakers or severe claustrophobia. Computed tomographic (CT) scans or myelography are
alternative diagnostic modalities for patients with contraindication to MRI.35 This form of
imaging can also be used to visualize bony abnormalities and cord deformation.
Lateral plain X-rays are often used in conjunction with MRI to depict spinal canal
narrowing.15 In addition, lateral X-rays can identify instability, degenerative disc disease,
scoliosis, subluxation and kyphosis.
1.5.3 Electrodiagnosis
Electrodiagnosis is less commonly used to diagnose CSM but can help differentiate
between patients with spondylotic neural compression and those with mimicking diagnoses.15
Common forms of electrodiagnosis include electromyography (EMG), electroneurography or
nerve conduction studies (NCS) and evoked potentials.
EMG assesses the activity of muscle cells by repeatedly stimulating receptors of the
sensory system and measuring resultant cortical activity.36 At rest, insertion activity may be
absent in various neuromuscular disorders, reduced in metabolic diseases and prolonged in
denervated muscle. Rhythmic fibrillation potentials in single muscle fibers and positive sharp
waves are also indicators of denervation. Although fasciculation potentials may be present in
normal muscle, they are also indicative of chronic partial denervations as in amyotrophic lateral
sclerosis (ALS).37 Alterations in motor unit potentials can help diagnose other diseases: double
discharges occurring at the beginning of voluntary contractions can indicate disorders of the
anterior horn cells, roots or peripheral nerves; myokymic discharges can reflect patients with
radiation myelopathy, multiple sclerosis (MS), chronic radiculopathy, entrapment neuropathy

10
or syringomyelia; and neuromyotonic discharges can be present in patients with peripheral
axonal or demyelinated neuropathy.37
During muscular contraction, the amplitude and duration of motor unit action potentials
are affected by the size of the motor unit. In neuropathic disorders, the number of functional
motor units is reduced and the motor unit potentials are longer and sometimes polyphasic.36
Greater amplitude potentials can indicate anterior horn cell involvement.
Electroneurography or NCS can quantify the motor and sensory conduction velocities of
peripheral nerves. This is done by placing two electrodes at different points along a peripheral
nerve; the interval between the stimulus and recorded response is measured and divided by
the distance between the two electrodes.36, 37 When the peripheral nerve is stimulated, one
response will travel antidromically towards the spinal cord, synapse with the ganglionic cells in
the anterior horn and travel back towards the periphery. This is known as an F-wave. NCS are
less important in detecting CSM and pure sensory radiculopathies.15 They are, however,
essential in ruling out alternative diagnoses, including peripheral axonal and demyelinating
neuropathy, and peripheral nerve entrapment such as carpal tunnel syndrome.15
Evoked potentials are important tools for determining the integrity of various functional
systems, including the visual, auditory, somatosensory and motor. In the case of somatosensory
evoked potentials (SSEP), an electrical stimulus applied to the skin will travel through the
peripheral nerve, nerve root, posterior columns, spinothalamic tract, medial lemniscus and
thalamocortical connections.36, 37 Any decrease in velocity may reflect injury along any of these
pathways and can help assess the degree of sensory conduction impairment. Although these
potentials may be useful in the diagnosis of CSM, they are not commonly used in clinical
practice except for electrophysiological monitoring during surgery.15
1.5.4 Differential Diagnosis
There are several neurological conditions that present similarly to CSM, including
intracranial, demyelinating, motor neuron, infectious, inflammatory and metabolic
abnormalities. Table 1-1 provides a summary of the differential diagnoses of CSM.

11
As suggested by two textbooks, Harrison's Internal Medicine and Clark's Cervical Spine,
the four major differential diagnoses of CSM are ALS, MS, peripheral nerve entrapment, and
vitamin B12 deficiency (Table 1-2).38, 39
ALS is a debilitating upper and lower motor neuron disease that manifests in the fourth
to sixth decade of life, similarly to CSM.38 It often presents with symmetrical muscular
weakness of the shoulders, fasciculation and atrophy of the upper limbs, and muscular
spasticity.38, 39 In contrast to CSM, patients with ALS do not have pain or sensory changes and
have tongue fasciculations, normal bladder and bowel function and a unique CSF profile.39 A
recent study of protein contents in the CSF identified three biomarkers that are specific to
patients with ALS. In one study, cystatin C, a proteolytic fragment of VGF, and a third protein
species were found to be significantly lower in patients with ALS than in control subjects.40 In a
second study, Ranganathan et al. (2005) reported that patients with ALS had decreased levels
of cystatin C and transthyretin and increased levels of a carboxy-terminal fragment of the
neuroendocrine protein 7B2.41 The most useful biomarkers for distinguishing ALS from other
neurodegenerative diseases and healthy subjects are erythropoietin (decreased),42 hepatocyte
growth factor (upregulated),43 monocytic chemotactic protein (increased),44 neurofilament light
and heavy subunits (upregulated), cystatin C and transthyretin.45
MS presents similarly to CSM but occurs more commonly in young adults between ages
20 to 40 years. 38 Patients with MS display relapsing symptoms involving the white matter tracts
and may experience L’Hermitte’s phenomena, and motor, sensory, and bladder/bowel
dysfunction.39 Diagnosis is likely not MS if 1) symptoms are localized to the spinal cord; 2)
patients are <15 or >60 years of age; 3) the disease is progressive in nature; and 4) there is a
lack of visual dysfunction.39

12
Table 1-1. Differential Diagnoses of CSM
Compressive Myelopathies
Cervical spondylotic myelopathy o Spondylosis o Disc herniation o Ossification of the Posterior Longitudinal Ligament o Subluxation o Hypertrophy of the Ligamentum Flavum o Congenital stenosis
Cord compression by spinal tumor
Spinal epidural abscess
Spinal epidural hematoma
Hematomyelia
Chiari Malformation
Trauma
Non-Compressive Myelopathies
Spinal cord infarction
Inflammatory and immune myelopathies (myelitis) o Multiple Sclerosis o Rheumatoid arthritis o Neuromyelitis optica o Systemic immune-mediated disorders (Lupus, Sjorgren’s syndrome,
sarcoid myelopathy, vasculitis, perinuclear antineutrophilic cytoplasmic antibodies and primary central nervous system vasculitis)
o Post-infectious myelitis o Acute infections myelitis (viral (Herpes zosters, HIV, rabies), bacterial,
fungal and parasitic)
Radiation myelopathy
Infection (disc space infection or osteomyelitis)
Amyotrophic Lateral Sclerosis
Chronic Myelopathies
Vascular malformations of the cord and dura (dural arteriovenous fistulas)
Retrovirus-associated myelopathies (HTLV-1, HIV)
Syringomyelia
Subacute combined degeneration (vitamin B deficiency)
Hyocupric myelopathy
Tabes dorsalis
Other (congenital anomalies or genetic-linked diseases)
Congenital anomalies of the atlantoaxial joint (Dwarfing conditions, Down syndrome or odontoid hypoplasia)
Malformations of the occipital bone (basilar invaginations)
Klippel-Feil syndrome
Os odontoideum
Familial spastic paraplegia
Adrenomyeloneuropathy

13
Symptoms of CSM are often mistaken as peripheral nerve entrapment such as carpal
tunnel syndrome.46, 47 In carpal tunnel, examination of the hand will reveal thenar wasting but
not concurrent atrophy of the lumbrical muscles as is seen in CSM. Furthermore, patients with
CSM will exhibit other neurological signs of cord compression such as hyperreflexia, lower limb
spasticity, a positive Hoffman’s sign and upgoing plantar responses.48 The MRI of patients with
peripheral nerve entrapment will be normal; however nerve conduction velocty and SSEPs will
be abnormal.15
Vitamin B12 deficiency can also result in symptoms similar to CSM, including sensory
and motor deficiencies and gait ataxia.48 Deep tendon reflexes are usually absent or severely
diminished, while pathologic reflexes (Babinski sign) are present.48 Usually these neurologic
findings are accompanied by dementia and/or other psychiatric symptoms. Patients should be
examined for Vitamin B12 deficiency if they have a history of pernicious anemia or
gastrointestinal abnormalities, symptoms of gait ataxia and motor or sensory deficits.48
Syringomyelia refers to a disorder in which abnormal fluid-filled cavities or cysts form in
the spinal cord.38, 39 The symptoms begin earlier than in CSM, but, like CSM, the onset of
syringomyelia is insidious and progresses irregularly.39 Symptoms include sensory loss, aflexic
weakness, atrophy in the upper limbs, leg spasticity, bladder and bowel dysfunction, and
Horner’s syndrome.39 Due to several overlapping symptoms, syringomyelia should be included
in the differential diagnosis of CSM.
Finally, compressive spinal tumors can also mimick the signs and symptoms of CSM.39
Other important differential diagnoses include any condition that results in cord compression,
including compressive, non-compressive, and chronic myelopathies.38, 39

14
Table 1-2. Methods of Differentiating between CSM and other Common Diagnoses
Diagnosis Common Symptoms Physical Exam Findings
MRI Findings Electrodiagnosis Serologic/ Tissue
CSM -Older age -Gradual onset -Loss of manual dexterity -Balance and coordination problems -Neck pain -Gait dysfunction
-Gait abnormality, hyperreflexia, clonus, spasticity
-Spinal cord compression with or without signal change -Spondylotic changes -Signal intensity change localized to areas of compression
-Normal or signs of radiculopathy: slowing of the peripheral and central portion of motor pathway. -Prolonged central conduction time on MEP
Normal
ALS -Weakness, muscle atrophy, fasciculations, gait difficulty usually due to weakness
-Gait difficulty -Babinski
-Normal -Increased T2 signal intensity on brain MRI in posterior part of internal capsule
-Fibrillation and fasciculations Normal
Peripheral Nerve Entrapment
-Night pain in upper extremities -Positional variation in symptoms
Normal Abnormal Nerve Conduction Velocity and SSEPs
Normal
Vitamin B12 Deficiency
-History of pernicious anemia, GI disorders, malnutrition -Dementia
-Decreased deep tendon reflexes -Babinski
Normal -Can have abnormal Visual Evoked Potentials -Multimodality abnormalities on SSEP
Decreased Vitamin B12
MS - Age 20-40 -More common in females -Vision problems -Gait dysfunction and imbalance
-Gait abnormality -Motor and sensory deficits which wax and wane
-Increased T2 signal intensity on brain MRI
-Abnormal Visual Evoked Potentials -Abnormal Brain Auditory Evoked Potentials -Scalp-recorded SEPs are present in 50-86% -Short-latency N13 from the neck or P14 from the scalp are present in 69-94%
Normal
CSM: cervical spondylotic myelopathy; ALS: amyotrophic lateral sclerosis; MS: multiple sclerosis; GI: gastrointestinal; MRI: magnetic resonance imaging; MEP: motor evoked potentials; SEPs: sensory evoked potentials.

15
1.6 Risk Factors of Disease Diagnosis, Development and Progression
1.6.1 Clinical Risk Factors
Several studies have examined the association between age, gender and CSM diagnosis.
Age was identified as a significant risk factor of CSM by two studies.49, 50 Yue et al (2001)
compared age between CSM patients and controls with neck pain but no evidence of
spondylosis; on average, patients from the myelopathy group were 56.7 years and significantly
older than subjects in the control group (43.3 years). In a study by Takamiya et al (2006),
increased age was also a significant risk factor for cervical myelopathy (OR: 1.07, 95% C.I.: 1.01-
1.14). In contrast, a single study reported no significant relationship between age and CSM
diagnosis.51 (Table 1-3). Based on two studies, gender is not a risk factor of diagnosis.
Table 1-3 Clinical Risk Factors of CSM Diagnosis
Clinical Factor Outcome Author (year) Controlled for Confounders
Associated with Risk?
Age CSM Diagnosis Yue et al (2001) Yes Positively Takamiya et al (2006)
Yes Positively
Chen et al (1994) No No Gender CSM Diagnosis Yue et al (2001) Yes No
Takamiya et al (2006)
Yes No
Disease Development or Progression
Other studies have aimed to determine significant clinical predictors of disease
development or progression in asymptomatic patients or those treated conservatively for
myelopathy. Bednarik et al (2008) evaluated key predictors of early symptomatic CSM in
patients with 1) MRI signs of spondylotic or disc compression of the cervical spinal cord with or
without signal changes on T1/T2-WI, 2) axial pain or clinical signs and/or symptoms of
radiculopathy that could be managed conservatively and 3) no clinical signs and symptoms of
myelopathy.52 In univariate analysis, patients with an abnormal EMG, defined as motor axonal
neuropathy in at least two myotomes, were 2.87 times more likely to progress to symptomatic
CSM. In addition, disease development was predicted by clinically symptomatic radiculopathy
(OR: 4.69, p=0.004), and abnormal motor (MEP) (OR: 2.94, p=0.046) and sensory evoked

16
potentials (OR: 3.97, p=0.011). All of these clinical variables were included in the final
multivariate model except for abnormal EMG as it was highly correlated with clinical
radiculopathy. Gender and age were not significant predictors of disease development or
progression.52, 53 In a study by Barnes and Saunders (1984), however, there were more women
in the myelopathic group that exhibited deterioration following conservative treatment than in
the group that remained stable.54
1.6.2 MRI Risk Factors
Five studies explored the relationship between CSM diagnosis and various imaging
factors (Table 1-4).49, 51, 55-57 In a study by Hukuda et al (1996), several CT measurements were
compared between patients with CSM and a control group of patients with other forms of
spinal lesions (ex. metastatic thoracic tumor, rheumatoid spondylitis, traumatic subluxation).55
In the myelopathy group, patients had vertebral bodies with significantly larger cross-sectional
areas (C3-C6), transverse diameters (C3, C5-C7) and sagittal diameters (C3-C7). The transverse
diameter and sagittal diameter of the spinal canal were significantly smaller in the CSM group
at all vertebral levels. In addition, at C3 and C7, the cross-sectional area of the spinal canal was
significantly smaller in the myelopathy group compared to the control group. CSM patients also
had a smaller sagittal diameter of the spinal cord at all levels and a smaller transverse diameter
at C4, C6 and C7. The space available for the spinal cord in the sagittal (C5-C7) and transverse
planes (C3, C5) was significantly smaller in the myelopathy group than in the control group.
There was no significant difference in the cross-sectional space available for the spinal cord
between the two groups. Finally the ratios between vertebral body: spinal canal and spinal
canal: spinal cord (sagittal: C3-C4, transverse: C5-C7, cross-sectional: C3-C7) were significantly
larger in CSM patients.
Using MRIs, Okada et al (1994) compared the transverse area of the spinal canal and
dural tube and the occupying ratio of the spinal cord between patients with CSM (n=28) and
controls (n=96) without neurological symptoms.56 The canal occupying ratio was computed by
dividing the area of the spinal cord by the area of the spinal canal. These measurements were
made at C3 which was uncompressed in the CSM patients. Patients with CSM still had a

17
significantly smaller transverse area and a higher canal occupying ratio of the spinal cord at C3
than the controls. There was no correlation between transverse area of the dural tube and CSM
diagnosis.
A study by Chen et al (1994) compared the sagittal diameter of the vertebral bodies and
spinal canal in patients (n=100) undergoing surgery for CSM and asymptomatic volunteers
(n=100).51 In the myelopathic group, the sagittal diameter of the vertebral bodies was
significantly larger and the sagittal diameter of the spinal canal was significantly smaller than in
the control group. The Torg-Pavlov ratio, defined as the ratio between the sagittal diameter of
the cervical canal and the cervical vertebra at the same level, was significantly lower in CSM
patients than in the volunteers. This finding was confirmed by Yue et al (2001) who reported a
smaller Torg-Pavolv ratio in myelopathy patients.49
Finally, Golash et al (2001) compared MRI features across three groups: 1) volunteers, 2)
asymptomatic patients with image-evidence of cervical spondylosis, and 3) patients with
symptomatic myelopathy and MRI evidence of spondylosis.57 The cross-sectional areas of the
spinal canal, cord and CSF were significantly smaller in the CSM groups than the other two
groups. However, the cross-sectional area of the CSF was the only independent prognostic
factor of CSM diagnosis. Specifically, patients had a 90% risk of clinical myelopathy if the area of
their CSF space was less than 0.7 cm2.
Disease Development or Progression
The objective of other studies was to assess various imaging predictors of disease
development, progression or failed conservative treatment. In the study by Bednarik et al
(2008), there was no significant univariate association between development of early (<12
months) symptomatic CSM and type of compression (osteophytes vs. other), number of
stenotic levels (1 vs. ≥1), MRI hyperintensity, Pavlov ratio, compression ratio or cross-sectional
area of the spinal cord.52 In multivariate analysis, however, the presence of MRI hyperintensity
decreased the risk of early manifestation of myelopathy.

18
Table 1-4. MRI Risk Factors of CSM Diagnosis
Image Factor Outcome Author (year) Controlled for Confounders
Associated with Outcome?
Cross-sectional area of spinal canal
CSM diagnosis Golash et al (2001) Yes No
Hukuda et al (1996) Yes Negatively (C3, C7)
Sagittal diameter of vertebral body
CSM diagnosis Hukuda et al (1996) Yes Positively
Chen et al (1994) No Positively
Transverse diameter of spinal canal
CSM diagnosis Hukuda et al (1996) Yes Negatively
Okada et al (1994) No Negatively
Sagittal diameter of spinal canal
CSM diagnosis Hukuda et al (1996) Yes Negatively
Chen et al (1994) No Negatively
Torg Pavlov ratio CSM diagnosis Yue et al (2001) Yes Negatively
Chen et al (1994) No Negatively
Cross-sectional area for CSF space
CSM diagnosis Golash et al (2001) Yes Negatively
Transverse diameter of spinal cord
CSM diagnosis Hukuda et al (1996) Yes Negatively (C4, C6-C7)
Sagittal diameter of spinal cord
CSM diagnosis Hukuda et al (1996) Yes Negatively
Cross-sectional area of spinal cord
CSM diagnosis Hukuda et al (1996) Yes Negatively
Transverse diameter of vertebral body
CSM diagnosis Hukuda et al (1996) Yes Positively (C3, C5-C7)
Cross-sectional area of vertebral body
CSM diagnosis Hukuda et al (1996) Yes Positively (C3-C6)
Vertebral body: spinal canal ratio (sagittal)
CSM diagnosis Hukuda et al (1996) Yes Positively
Vertebral body: spinal canal ratio (transverse)
CSM diagnosis Hukuda et al (1996) Yes Positively
Canal: cord diameter (sagittal)
CSM diagnosis Hukuda et al (1996) Yes Positively (C3-C4)
Canal: cord diameter (transverse)
CSM diagnosis Hukuda et al (1996) Yes Positively (C5-C7)
Canal: cord diameter (cross-sectional)
CSM diagnosis Hukuda et al (1996) Yes Positively
Sagittal space available for spinal cord
CSM diagnosis Hukuda et al (1996) Yes Negatively (C5-C7)
Transverse space available for spinal cord
CSM diagnosis Hukuda et al (1996) Yes Negatively (C3-C5)
Cross-sectional space available for spinal cord
CSM diagnosis Hukuda et al (1996) Yes No
Dural tube transverse area CSM diagnosis Okada et al (1994) No No
Canal-occupying ratio of the spinal cord
CSM diagnosis Okada et al (1994) No Positively
In a study by Shimomura et al. (2007), 70 patients with mild CSM were enrolled to
evaluate factors associated with successful conservative treatment.53 Out of the 56 patients

19
that completed a final follow-up assessment, 11 showed signs of deterioration from mild to
moderate or severe CSM and were recommended surgery. The most significant and only MRI
predictor was circumferential spinal cord compression on an axial MRI. Patients with
circumferential compression were at a 26.624 (CI: 1.682-421.541, p=0.0199) higher risk of
deterioration on the Japanese Orthopaedic Association (JOA) scale. Ten out of 33 patients
(30.3%) with this type of cord compression deteriorated, nine of whom were subsequently
treated surgically. Partial cord compression on axial MRI and high SI grade on T2-WI (OR: 1.317,
CI: 0.161-10.801, p=0.793, multivariate) were not significantly associated with deterioration.
A second study by Oshima et al. (2012) also examined predictors of outcome in 45 mild
CSM patients treated conservatively.58 Sixteen of these patients deteriorated on the JOA score
and went on to receive surgical treatment. Spinal cord diameter, measured by the ratio at the
narrowest part of the canal to the C1 level, was the only MRI characteristic studied and was not
significantly related to failure of conservative treatment (p=0.09). Cox Proportional Hazard
analysis yielded a hazard ratio of 2.24 for a patient with a diameter <50% of the C1 level
compared to one with a diameter of ≥50%. The confidence interval, however, included 1 (CI:
0.83-6.06), indicating insignificance.
Yoshimatsu et al. (2001) studied 69 patients to determine the limitations of non-surgical
intervention and to analyze important predictors of failed conservative treatment.59 Forty-three
of these patients showed functional deterioration, assessed by a decrease in JOA. MRI
characteristics analyzed in this study included the number of intervertebral discs compressing
the spinal cord and the presence of high signal intensity (SI) on a T2WI; neither of these were
significant predictors of deterioration.
In a study by Barnes and Saunders (1994), patients were classified into three groups
based on whether they improved by at least one functional grade following conservative
treatment, stayed the same or deteriorated.54 Patients who worsened had a greater range of
preoperative neck and head movement than patients who stayed the same. Deterioration was
not predicted by anteroposterior diameter, canal size, subluxation, posterior osteophytosis,
lordosis in extension or kyphosis in extension.

20
1.6.3 Genetic Risk Factors
A systematic review by Wilson et al (2013) was conducted to determine whether
individuals with affected relatives are at an increased risk of CSM or OPLL and to summarize
specific genetic polymorphisms associated with these diseases.60
Three studies supported a heritable predisposition for CSM and OPLL. In a study by Patel
et al (2012), first-degree relatives of patients with CSM were 5.1 times (95% C.I.: 2.07-13.1)
more likely to develop CSM.61 The risk ratio of second-degree relatives was non-significant
(p=0.07); however, third degree relatives were at twice the risk of disease development (95%
C.I.: 1.04-3.7). Similar results were reported in two OPLL studies: the risk of OPLL was 5.19 to
7.1 times higher in first-degree relatives than in controls.62, 63
According to Wilson et al (2013), several studies identified specific single nucleotide
polymorphisms (SNPs), haplotypes and gene alleles associated with OPLL and CSM.60 Specific
candidate genes include TGF-β, IL-15 receptor α, NPPS, BMP-2 and 4, RUNX2, VDR, RXRβ, Leptin
Receptor, APOE, COL6A1 and COL11A2. There is low level evidence suggesting that SNPs on the
COLA1 (intron 32(-29), CT) and the COL11A2 (intron 6(-4), AT) genes are associated with an
increased risk of OPLL development. Other SNPs and haplotypes were only examined by single
studies and cannot be deemed significant genetic risk factors. In CSM, disease development
was significantly associated with SNPs in the rs7975232 and rs731236 locations of the VDR
gene, the ε4 allele of APOE and the Trp2 allele of Collagen IX. However, these results were
reported by single studies and therefore are not sufficient to determine whether VDR-SNPs or
alleles of the APOE or Collagen IX are risk factors for CSM.
1.7 Evaluating Functional Status and Quality of Life using Outcome Measures
Quantitative tools are valuable in a clinical setting as they can objectively evaluate
severity at baseline, assess the effectiveness of interventions, predict outcome and provide
decision support to clinicians.64, 65 Singh et al (2005) reported the results of a survey in which
clinicians agreed on the importance of quantifying functional disability in patients with CSM.66
However, respondents also believed that specific assessment tools are underused or not ideal.
In the field of CSM, there is no gold standard for assessing disease severity, predicting outcome
21
or evaluating a patient’s improvement following intervention.67 Clinicians are therefore unable
to establish standard quantitative guidelines for CSM management.
There are several tools designed to evaluate neurological impairment, functional status
and health-related quality of life. In the AOSpine CSM-North America and International studies,
patients were assessed using the modified JOA (mJOA), the Nurick, the 30-meter walking test,
the Neck Disability Index (NDI) and the Short Form-36 (SF-36).
mJOA
The mJOA is an 18-point clinician-administered questionnaire that separately addresses
upper and lower extremity motor function, sensation and micturition. It was modified from the
JOA scale by Benzel et al (1991) to increase its applicability in the Western population.68 Some
of the differences between the JOA and mJOA include that the modified scale is in English and
evaluates a patient’s ability to use western cutlery rather than chopsticks. Factor analysis
demonstrated that the mJOA has two dimensions: 1) motor and sensory function of the
extremities and 2) sphincter dysfunction.69
Nurick
The Nurick score, developed in 1972, is the most commonly cited outcome measure in
existing literature.70, 71 It is a 6-grade ordinal scale that is primarily based on gait impairment
and employment (0=signs or symptoms of root involvement but no evidence of spinal cord
disease, V=chair bound or bedridden).
30-meter walking test
The 30-meter walk test requires a patient to stand up from a stable chair, walk on a
smooth flat surface for 15 meters, turn around, walk back and sit down.72, 73 This scale assesses
a patient’s voluntary movement, balance and coordinated activity and objectively evaluates
walking speed.
Neck Disability Index
The NDI is a 10-item patient questionnaire that evaluates functional activities (personal
care, lifting, reading, work, driving, sleeping, and recreation), pain intensity, concentration and

22
headaches.74-82 For each item, there are six possible answers: 0 is no disability and 5 is complete
disability. The total NDI is out of 100 and is calculated by summating scores from all categories
and multiplying by two.
SF-36 version 2
The SF36v2 is a multipurpose health survey, combining a mental (MCS) and physical
component score (PCS), that measures both functional status and overall quality of life.64, 73, 83,
84 It consists of eight scales including physical functioning (PF), role limitations physical (RP),
bodily pain (BP), general health perceptions (GH), vitality (VT), social functioning (SF), role
limitations emotional (RE) and mental health (MH).
1.7.1 Validity of Existing Outcome Tools
A scale’s validity is how well it measures what it is intended to. Scales are ideally
validated by correlating them with a “gold standard.”73, 85 Given that this has yet to be defined
for CSM, a scale’s validity is evaluated by correlating it with other measures and by assessing
either construct, convergent or divergent, predictive or biological validity. Table 1-5
summarizes the results from studies that have validated the SF-36, 30-meter walking test,
Nurick, JOA/mJOA and NDI.
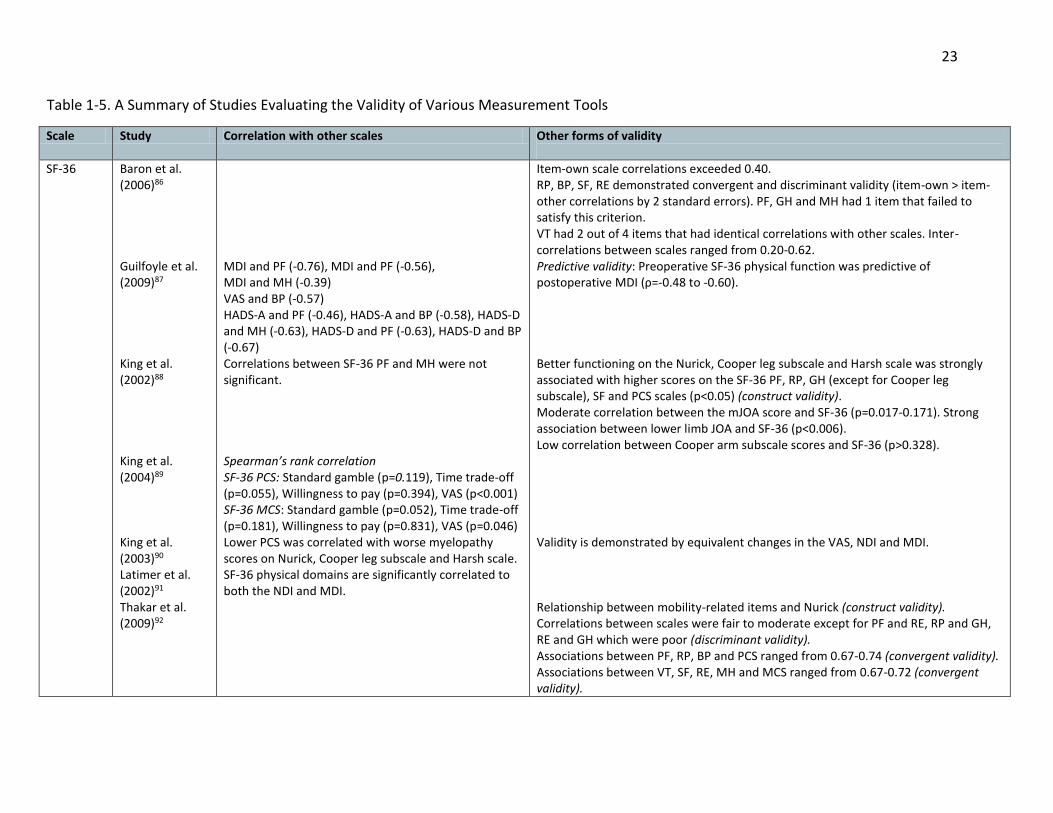
23
Table 1-5. A Summary of Studies Evaluating the Validity of Various Measurement Tools
Scale Study Correlation with other scales Other forms of validity
SF-36 Baron et al. (2006)86 Guilfoyle et al. (2009)87 King et al. (2002)88 King et al. (2004)89 King et al. (2003)90 Latimer et al. (2002)91 Thakar et al. (2009)92
MDI and PF (-0.76), MDI and PF (-0.56), MDI and MH (-0.39) VAS and BP (-0.57) HADS-A and PF (-0.46), HADS-A and BP (-0.58), HADS-D and MH (-0.63), HADS-D and PF (-0.63), HADS-D and BP (-0.67) Correlations between SF-36 PF and MH were not significant. Spearman’s rank correlation SF-36 PCS: Standard gamble (p=0.119), Time trade-off (p=0.055), Willingness to pay (p=0.394), VAS (p<0.001) SF-36 MCS: Standard gamble (p=0.052), Time trade-off (p=0.181), Willingness to pay (p=0.831), VAS (p=0.046) Lower PCS was correlated with worse myelopathy scores on Nurick, Cooper leg subscale and Harsh scale. SF-36 physical domains are significantly correlated to both the NDI and MDI.
Item-own scale correlations exceeded 0.40. RP, BP, SF, RE demonstrated convergent and discriminant validity (item-own > item-other correlations by 2 standard errors). PF, GH and MH had 1 item that failed to satisfy this criterion. VT had 2 out of 4 items that had identical correlations with other scales. Inter-correlations between scales ranged from 0.20-0.62. Predictive validity: Preoperative SF-36 physical function was predictive of postoperative MDI (ρ=-0.48 to -0.60). Better functioning on the Nurick, Cooper leg subscale and Harsh scale was strongly associated with higher scores on the SF-36 PF, RP, GH (except for Cooper leg subscale), SF and PCS scales (p<0.05) (construct validity). Moderate correlation between the mJOA score and SF-36 (p=0.017-0.171). Strong association between lower limb JOA and SF-36 (p<0.006). Low correlation between Cooper arm subscale scores and SF-36 (p>0.328). Validity is demonstrated by equivalent changes in the VAS, NDI and MDI. Relationship between mobility-related items and Nurick (construct validity). Correlations between scales were fair to moderate except for PF and RE, RP and GH, RE and GH which were poor (discriminant validity). Associations between PF, RP, BP and PCS ranged from 0.67-0.74 (convergent validity). Associations between VT, SF, RE, MH and MCS ranged from 0.67-0.72 (convergent validity).
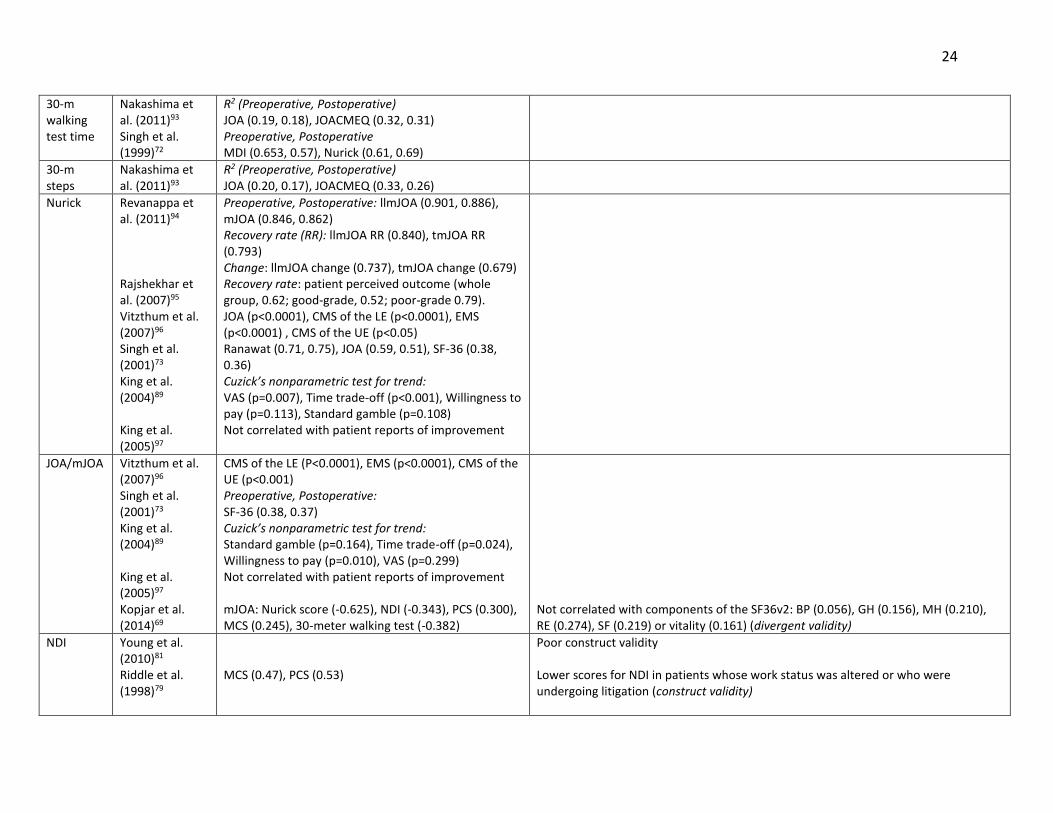
24
30-m walking test time
Nakashima et al. (2011)93 Singh et al. (1999)72
R2 (Preoperative, Postoperative) JOA (0.19, 0.18), JOACMEQ (0.32, 0.31) Preoperative, Postoperative MDI (0.653, 0.57), Nurick (0.61, 0.69)
30-m steps
Nakashima et al. (2011)93
R2 (Preoperative, Postoperative) JOA (0.20, 0.17), JOACMEQ (0.33, 0.26)
Nurick Revanappa et al. (2011)94 Rajshekhar et al. (2007)95 Vitzthum et al. (2007)96 Singh et al. (2001)73 King et al. (2004)89 King et al. (2005)97
Preoperative, Postoperative: llmJOA (0.901, 0.886), mJOA (0.846, 0.862) Recovery rate (RR): llmJOA RR (0.840), tmJOA RR (0.793) Change: llmJOA change (0.737), tmJOA change (0.679) Recovery rate: patient perceived outcome (whole group, 0.62; good-grade, 0.52; poor-grade 0.79). JOA (p<0.0001), CMS of the LE (p<0.0001), EMS (p<0.0001) , CMS of the UE (p<0.05) Ranawat (0.71, 0.75), JOA (0.59, 0.51), SF-36 (0.38, 0.36) Cuzick’s nonparametric test for trend: VAS (p=0.007), Time trade-off (p<0.001), Willingness to pay (p=0.113), Standard gamble (p=0.108) Not correlated with patient reports of improvement
JOA/mJOA Vitzthum et al. (2007)96 Singh et al. (2001)73 King et al. (2004)89 King et al. (2005)97 Kopjar et al. (2014)69
CMS of the LE (P<0.0001), EMS (p<0.0001), CMS of the UE (p<0.001) Preoperative, Postoperative: SF-36 (0.38, 0.37) Cuzick’s nonparametric test for trend: Standard gamble (p=0.164), Time trade-off (p=0.024), Willingness to pay (p=0.010), VAS (p=0.299) Not correlated with patient reports of improvement mJOA: Nurick score (-0.625), NDI (-0.343), PCS (0.300), MCS (0.245), 30-meter walking test (-0.382)
Not correlated with components of the SF36v2: BP (0.056), GH (0.156), MH (0.210), RE (0.274), SF (0.219) or vitality (0.161) (divergent validity)
NDI Young et al. (2010)81 Riddle et al. (1998)79
MCS (0.47), PCS (0.53)
Poor construct validity Lower scores for NDI in patients whose work status was altered or who were undergoing litigation (construct validity)

25
Cleland et al. (2006)75
Change scores with GROC (0.19) Change scores with NPRS (0.61)
RP: role limitations physical; BP: bodily pain; SF: social functioning; RE: role limitations emotional; PF: physical functioning; GH: general health; MH: mental health; VT: vitality;
PCS: physical component score; MCS: mental component score; SF-36: short form-36; NDI: neck disability index; MDI: myelopathy disability index; VAS: visual analog scale;
(m)JOA: (modified) Japanese orthopaedic association; HADS: hospital anxiety depression scale; EMS: European myelopathy score; JOACMEQ: Japanese orthopaedic association
cervical myelopathy evaluation questionnaire; llmJOA: lower limb mJOA; tmJOA: total mJOA; CMS: Cooper myelopathy scale; LE: lower extremity; UE: upper extremity; GROC:
global rating of change; NPRS: numeric pain rating scale;

26
1.7.2 Reliability of Existing Outcome Measures
Inter-observer reliability is the agreement between two or more raters whereas Intra-
observer reliability is the agreement between two ratings made by a single observer on the
same patient.67 Table 1-6 summarizes what is known about the reliability of the JOA, 30-meter
walking test, NDI and SF-36.
Table 1-6. Reliability of the JOA, 30-meter Walking Test, NDI and SF-36
Measurement Study Interobserver Reliability
Test-retest reliability
JOA (Total score) Motor function Fingers Shoulder and elbow Lower extremity Sensory function Upper extremity Trunk Lower extremity Bladder function
Yonenbou et al. (2001)98
ICC=0.813 κ=0.534 (77.7%) κ=0.305 (82.3%) κ=0.488 (62.3%) κ=0.421 (67.7%) κ=0.579 (78.5%) κ=0.339 (62.3%) κ=0.469 (75.4%)
ICC=0.826 Κ (proportion of agreement) κ=0.678 (73.1%) κ=0.501 (82.9%) κ=0.547 (62.2%) κ=0.510 (64.7%) κ=0.537 (75.7%) κ=0.436 (57.1%) κ=0.643 (75.1%)
30m walking test Nakashima et al. (2011)93 Singh et al. (1999)72
Not reported Differences (SD) between 1st and 2nd measurements Preoperative: 0.95 (1.66) Postoperative: 0.89 (1.33) p=0.995 (low variability between trials)
NDI Young et al. (2010)81
Not reported Test-retest over 4 weeks ICC=0.55
SF-36 Physical functioning Social functioning Role limitations Physical Role limitations Emotional Bodily Pain Mental health Vitality General health perception
Brazier et al. (1992)84
Not reported Test-retest (2 week interval) R=0.81 R=0.60 R=0.69 R=0.63 R=0.78 R=0.75 R=0.80 R=0.80
JOA: Japanese orthopaedic association; ICC: intraclass correlation; K: kappa coefficient of Kraemer; SD: standard
deviation; NDI: neck disability index; P: physical; E: emotional
1.7.3 Responsiveness of Existing Outcome Tools
Responsiveness is a scale’s ability to detect clinically significant changes and distinguish
between disease severities.67 Measures of responsiveness include effect sizes, areas (AUC)

27
under receiver operating curves (ROC) and ceiling or floor effects. 99 Table 1-7 displays the
responsiveness of the SF-36, subscales of the SF-36, the mJOA and the NDI.
Table 1-7 Responsiveness of the SF-36, mJOA, and NDI
Measurement Study Effect Size or AUC Floor, Ceiling Effect
SF-36
Baron et al. (2006)86 Guilfoyle et al. (2009)87 Thakar et al. (2009)92
PF (-0.43), BP (-0.62), SF (-0.52), MH (-0.55), VT (-0.70) Standardised response means: PF (0.86), BP (0.65), MH (0.54) PF (0.78), RP (0.49), BP (0.80), GH (0.39), VT (0.53), SF (0.65), RE (0.62), MH (0.54)
PF (15.4%, NS), RP (62.8%, NS) RE (35.1%, 51.8%) RP (50.9%, 20.4%) SF (NS, 22.9%) RE (29.0, 52.1%) RP (64.3%, NS) BP (30%, NS) SF (17.1%, NS) RE (71.4%, NS)
mJOA Kopjar et al (2014)69 1.00
NDI Bolton et al. (2004)82 Young et al. (2010)81
0.80 AUC: improved and stable patients (0.57) AUC: stable and “smaller” clinically improved (0.61) AUC: stable and “larger” clinically improved (0.74)
SF-36: short form-36; PF: physical functioning; BP; bodily pain; SF: social functioning; MH: mental health; VT:
vitality; RP: role limitations physical; RE: role limitations emotional; GH: general health; mJOA: modified Japanese
Orthopaedic Association; NDI: neck disability index; PSFS: patient specific functional scale; AUC: area under a
receiver operating curve (i.e ability of the scale to distinguish between two groups); NS: not significant
1.8 Management and Treatment Strategies
The management of CSM remains controversial due to disagreement surrounding the
natural history of the disease. In one respect, some patients with radiological spondylosis will
remain clinically stable over time whereas others, once symptomatic, will develop deleterious
myelopathic features. Furthermore, a recent systematic review suggested that, if left
untreated, 20-60% of patients with evidence of symptomatic CSM will deteriorate over time.100
1.8.1 Non-operative Management
Non-operative treatments for CSM include physical therapy, medications (steroids,
NSAIDS, gabapentin/pregabalin), spinal injections, collars and cervical traction.15, 101 In a
systematic review of the literature, Rhee et al (2013) investigated the safety and efficacy of

28
non-operative treatment for CSM.101 This review identified four studies comparing the relative
effectiveness of conservative treatment and surgical intervention.
Kadanka et al (2002, 2011) conducted a randomized control trial to evaluate differences
in outcomes between “mild” (mJOA≥12) patients treated conservatively (intermittent bed rest,
use of collar, anti-inflammatory medication and discouragement of high-risk activities) and
those treated surgically.102, 103 The main conclusions from this study were 1) there was no
statistical difference between the non-operative and operative groups at any time point with
respect to the mJOA; 2) the timed 10-meter walk was significantly faster in the non-operative
group; and 3) activities of daily living were similar in both groups 12-120 months after
treatment initiation. This trial was significantly underpowered and the improvements shown in
the operative cohort were much lower than in other published surgical series.
Two cohort studies also examined treatment outcomes in a surgical and a non-surgical
cohort.59, 104 Sampath et al (2000) reported significant improvements in overall pain and
functional status in patients treated surgically.104 This study also determined that patients
undergoing non-operative intervention (pharmacological therapy with either narcotic or
nonsteroidal drugs, steroids, bed rest, home exercise, cervical traction, neck bracing, or spinal
injections) experienced a significant worsening in their ability to perform daily activities. In a
second study by Yoshimatsu et al (2001), 78% of surgical patients improved their JOA score,
whereas only 23% of the non-operative group (cervical continuous traction, immobilisation
using a cervical orthosis, drug therapy, exercise, orthosis therapy, thermal therapy)
demonstrated gains in functional status.59 Although both studies did not directly compare
outcomes between treatment groups, the recorded differences in improvements suggest that
surgery may be more effective for managing these patients.101
Based on this evidence, Rhee et al (2013) developed a clinical recommendation:
“because myelopathy is known to be a typically progressive disorder and there is little evidence
that non-operative treatment halts or reverses its progression, we recommend not routinely
prescribing non-operative treatment as the primary modality in patients with moderate to
severe myelopathy.”101

29
1.8.2 Surgery
Traditionally, surgery was used to halt disease progression and prevent further
neurological deterioration. However, recent results from the prospective AOSpine CSM-North
America study indicated that cervical decompression not only arrests progression but also
improves neurological outcomes, functional status and quality of life in patients with mild,
moderate and severe disease.4 Surgery is therefore increasingly recommended as the standard
treatment for CSM and, as such, we can expect the rate of surgical intervention to rise with the
aging of the population. In fact, according to Lad et al (2009), there was a 7-fold increase in the
number of spinal fusions for CSM between 1993 and 2002 in the United States.105
Surgery can be performed anteriorly or posteriorly; however, the main objective of both
approaches is to remove compressive forces, decompress the cord and provide adequate space
for the spinal cord.106 According to Fehlings et al (2013), patients treated anteriorly have more
focal pathology, are younger and have less severe myelopathy than those treated
posteriorly.107 When adjusting for these baseline characteristics, there are no significant
differences in functional and quality of life outcomes between these two approach groups.
Common anterior surgeries include discectomy and/or corpectomy and fusion and posterior
techniques include laminectomy with or without fusion and laminoplasty. Patients with more
complex degenerative pathology may also undergo a two-stage circumferential procedure.

30
Chapter 2: A Clinical and Complications Prediction Rule in Cervical
Spondylotic Myelopathy: Rationale, Objectives and Specific Aims
2.1 Definition of a Clinical Prediction Rule
A clinical prediction rule combines signs and symptoms, demographics and other
relevant factors to determine the likelihood of developing a disease, achieving a particular
treatment outcome or experiencing a complication.108 These models are valuable in a clinical
setting because 1) they estimate a patient’s probability of disease development, enabling
clinicians to identify high-risk patients, take necessary precautions and educate patients to
recognize future relevant symptoms; 2) quantifying a patient’s likely outcome provides
clinicians with the information they require to discuss the relative risks and benefits of each
treatment and to manage patients’ expectations; 3) they help align both clinician and patient
perceptions of outcome with more objective evidence; and 4) they influence practice by
providing an evidence-based decision aid to clinicians.
2.2 The APACHE II Score and the Model for End-Stage Liver Disease
The APACHE II score and the model for end-stage liver disease (MELD) are two examples
of clinical prediction rules that are valuable in a clinical setting, especially to identify high-risk
patients. The APACHE II score is an intensive care unit scoring system that incorporates 12
physiological measurements, patient age and medical history to assess disease severity and risk
of mortality.109 This score is used to identify life-threatening physiologic problems and to guide
implementation of suitable treatment strategies. Furthermore, this knowledge can inform
concerned family members about the risk of subsequent hospital death. Another example is the
MELD score which uses a patient’s bilirubin, creatinine levels and international normalized ratio
from prothrombin time to evaluate severity of disease, estimate chance of survival and
prioritize recipients of liver transplants.110 These two examples demonstrate that clinical
prediction rules can be used to identify high-risk patients, assess disease severity and provide
prognostic information to patients and their families.

31
2.3 Clinical Prediction Rules in Traumatic Spinal Cord Injury
In the field of spinal cord injury, two models demonstrate how clinical prediction rules
can direct personalized treatment programs, manage patients’ expectations and ultimately
influence clinical practice.111, 112 Both studies were conducted in patients suffering from
traumatic spinal cord injury (tSCI) and were developed to predict long-term functional
outcomes and probability of ambulation. TSCI can impact a patient’s physical, psychological and
social well-being as well as impose substantial financial burden on health care systems.
Therefore, predicting a patient’s functional independence and ambulation following injury can
help educate these patients as to their likely outcome, design optimal rehabilitation strategies
and anticipate future resource utilization.111, 112
A second study by Wilson et al (2012) designed a model to predict the occurrence of
acute complications in patients with tSCI.113 These complications often result in prolongation of
hospital stay, higher rates of mortality, reduced functional recovery and increased management
costs. Clinicians should therefore anticipate these complications, institute aggressive
preventative treatments and strategize appropriate postoperative management. Furthermore,
health care providers should predict future hospital utilization costs for each patient and
allocate resources accordingly. A complications prediction model can provide valuable
information that allows both clinicians and health care providers to identify high risk patients,
develop effective management strategies and lessen future cost burden.
2.4 Rationale, Objectives and Specific Aims
2.4.1 Rationale
Given these benefits in acute SCI, we hypothesized that prediction models would also be
valuable in a surgical CSM setting to predict functional recovery and risk of complications.
Specifically, a model predicting surgical outcomes can be used by clinicians to counsel patients
and their families as to potential treatment options, manage patients’ expectations and identify
ways to optimize results. A complications prediction model, on the other hand, can help
surgeons detect their high risk patients, accurately discuss the risks and benefits of the
32
procedure with their patients and design case-specific preventative strategies. Furthermore,
knowledge of a patient’s likely outcome and risk of complications can allow health care
providers to anticipate future costs, allocate resources accordingly and strategize cost-effective
postoperative care.
Predicting surgical outcome is an increasingly important research topic as surgery is
recommended as the preferred management strategy for patients with CSM. Davidson et al
(2010) suggested that patient satisfaction is closely linked to his/her expectation of outcome.114
Patients who achieve their expected outcome are more likely to be satisfied with the results of
their treatment than those who had unrealistic expectations. It is therefore essential that
clinicians are able to objectively predict a patient’s likely outcome and accurately convey this
information during the surgical consent discussion. In some cases of CSM, the histological
damage to the spinal cord is irreversible and will persist even after surgical decompression.
These patients should be informed that, although they are likely to benefit from surgery, they
will still exhibit some residual neurologic impairment and may continue to require assistance in
daily living.
According to Davidson et al (2010), there is also substantial variability between clinicians
in terms of the information they convey to their SCI patients.114 In this study, a questionnaire
was distributed to spine surgeons across North America who specialized in the management of
tSCI. This survey was designed to evaluate the type of prognostic information surgeons provide
to their injured patients and to assess the variability of responses across practices. The
questionnaire presented various case vignettes and asked questions such as “how long will it
take this patient to return to work?” “what are the chances this patient will be free of back pain
and stiffness 1-year after surgery?” and “what do you tell your patient are the chances for
functional recovery in his/her lower extremities?” Ideally, all surgeons would be well-informed
of existing prognostic literature and provide similar responses to these questions. This, however
was not the case; the results indicated substantial variability in the information surgeons
provide to their patients about how they are expected to fare following intervention. Similarly,
in CSM, surgeons often have different perceptions as to their patients’ surgical prognosis. This
is likely due to the controversy in the literature surrounding the most important clinical and

33
imaging predictors of surgical outcome. Furthermore, there is no quantitative tool that can be
used across centers to objectively quantify a patient’s likely outcome. Such tool would ensure
that consistent and accurate information is being conveyed to these patients and aid in the
alignment of surgeons’ perceptions with more objective evidence.
There is also an increasing need to effectively predict intraoperative and postoperative
complications in CSM patients. Surgery, although proven highly effective, is not risk free and is
associated with complications in 11 to 38% of patients.10, 11 The majority of these are transient,
non-neurological and do not require invasive intervention or prolonged hospital stay.115
Regardless, surgical complications still taint a patient’s overall perception of surgery and often
involve more rigorous postoperative management, additional follow-up visits and increased
costs. Therefore, surgeons should better anticipate these complications, institute preventative
strategies, and closely monitor their patients in the perioperative period. A complication
prediction rule can be used by surgeons to identify their high risk patients, educate their
patients as to the relative risks and benefits of the procedure and strategize intraoperative and
postoperative care. At the Annual Meeting of the Cervical Spine Research Society (2014), Dr.
Hecht, in his discussion of surgical complications, said “an informed patient is a lot more
understanding.” This means that a patient who is aware that he/she is at a higher risk of a
experiencing a complication is less likely to be surprised or dissatisfied if that complication
occurs. It is therefore essential that surgeons objectively quantify risk of complications and
discuss these estimates with their patients during the consent process as a means to manage
expectations. Furthermore, this information will enable health care providers to anticipate
hospital utilization costs, allocate sufficient resources and implement effective postoperative
management strategies.
There is, however, little consensus as to what patient characteristics, imaging
parameters and surgical factors are important predictors of perioperative complications.
Furthermore, there are few studies comparing complications rates between anterior and
posterior surgery, laminoplasty and laminectomy with fusion and various laminoplasty
techniques. These knowledge gaps must be addressed as a first step to developing a

34
complications model that could be used by clinicians to predict a patient’s risk of intraoperative
or perioperative complications.
Along with the clinical benefits of these two models, it is also important for researchers
to be familiar with important predictors of outcome and complications before designing and
conducting therapeutic clinical trials, decision analysis projects and cost-effectiveness studies.
In order to appropriately divide patients into more homogenous subgroups for analysis,
researchers require an understanding of how certain clinical, imaging and surgical factors may
impact a patient’s outcome in the long term or risk of complications.
2.4.2 Knowledge Gaps in the Literature
As will become evident in Chapters 3 and 4, there is little consensus in the literature and
among professionals as to what are the most important predictors of functional status and
complications. Limitations in the methodology of previous studies prevent the formation of
strong evidence-based recommendations and the incorporation of prediction into guidelines
for CSM management. These include:
1) The definition of CSM varies from study to study; some include patients with all forms of
degenerative myelopathy, whereas others only include those with myelopathy
secondary to spondylosis or OPLL. The nomenclature for CSM needs to be
internationally unified and perhaps should be expanded to encompass all degenerative
forms of cervical myelopathy, including OPLL.3
2) There is a paucity of information in the form of high quality, multicenter prospective
studies. The majority of published prediction studies are retrospective. Furthermore,
the sample sizes of previous analyses are typically fewer than 100 patients.
3) Many of the measurement tools used to evaluate outcome have not been validated,
including the Cooper scale, neurosurgical cervical spine scale, neurological assessments,
questionnaires and evaluation of symptom improvement. Future studies should aim to
develop more sensitive and specific outcome measures to assess neurologic and
functional status in CSM patients. However, until this is done, the Nurick score and the
recently validated mJOA are good alternatives.

35
4) The definitions of complications have not been standardized across centers, leading to
both underreporting and over-reporting of rates. For example, some surgeons believe
that every patient treated anteriorly will suffer “dysphagia” whereas others do not
classify “trouble swallowing” as a complication but rather a normal event after an
anterior operation. Future studies should focus on developing guidelines to better
define complications and to distinguish between surgery-related and unrelated adverse
events.
In order to fill these knowledge gaps and add to the current body of literature, we wish
to evaluate key predictors of functional outcomes and perioperative complications using
prospectively-collected data from several spine centers around the world.
2.4.3 Objectives and Specific Aims
This thesis has two primary objectives. The first is to develop and validate a clinical
prediction rule used to determine functional outcomes in patients with CSM undergoing
surgery. This model will be constructed using data collected from two prospective, multicenter
studies funded by AOSpine North America and AOSpine International. However, before
analyzing this data, we will first design a theoretical framework using evidence from the
literature as well as professional opinion obtained from a survey. The following are specific
aims for this objective to ensure the model is both valid and generalizable in future
populations:
Specific Aim #1: To conduct a systematic review of the literature to determine the most
important clinical and imaging predictors of surgical outcome (Chapter 3).
Specific Aim #2: To survey members of AOSpine International to see what spine professionals
view as the most significant predictors of surgical outcome (Chapter 4).
Specific Aim #3: To establish the minimal clinically important difference (MCID) of the mJOA
and determine an appropriate cut-off between an “optimal” and “suboptimal” surgical
outcome (Chapter 6).

36
Specific Aim #4: To develop a clinical prediction rule to predict functional status at 1-year
following surgery using data on 278 patients enrolled in the multicenter, prospective AOSpine
CSM-North America study at 12 North American sites (Chapter 7).
Specific Aim #5: To externally validate this prediction model using data on 479 patients enrolled
in the prospective multicenter AOSpine CSM-International study at 16 global sites (Chapter 8).
Specific Aim #6: To evaluate whether certain MRI parameters contribute to the predictive
performance of our validated North American prediction model (Chapter 9).
Specific Aim #7: To identify limitations in our North American model and address these using
combined data from the North American and International studies (Chapter 10).
By achieving aims 1-7, we can develop a valid and globally relevant prediction model
that can be implemented into clinical practice to guide decisions, manage expectations and
counsel patients as to potential treatment options.
The second objective of this thesis is to determine significant clinical and surgical
predictors of perioperative complications and to develop a complications prediction rule that
clinicians can use to objectively quantify risk. Similar to our first objective, this model will first
be conceptually designed using results from a systematic review and a survey and then
formulated using data from the AOSpine CSM-International study. The following are specific
aims of our second objective:
Specific Aim #8: To perform a systematic review of the literature to identify key clinical and
surgical predictors of perioperative complications and to evaluate whether rates of
complications differ across treatment groups (ex. Anterior versus posterior surgery) (Chapter
3).
Specific Aim #9: To survey members of AOSpine International to determine what spine
professionals believe are the most important predictors of complications.
Specific Aim #10: To analyze data from the multicenter, prospective CSM-International study
and construct a complications prediction rule.

37
By achieving aims 8-10, we can develop a preliminary complications prediction model
that can be used by clinicians to identify their high risk patients. This knowledge should
encourage surgeons to institute rigorous case-specific preventative strategies, inform patients
as to the relative risks and benefits of their operation and strategize postoperative care. This
model must be validated externally before it is implemented into clinical practice.

38
Chapter 3: Identifying Significant Predictors of Surgical Outcome and
Complications: Results from Systematic Reviews of the Literature
3.1 Introduction
This chapter presents the results from three systematic reviews conducted to answer
the following clinical questions:
Part A: What are the most important clinical predictors of surgical outcome?
Part B: Are there MRI characteristics that can predict surgical outcome?
Part C: Key question (KQ) 1: Are there clinical, imaging or surgical factors associated with
intraoperative or postoperative complications? KQ 2: Do rates of complications differ across
surgical interventions?
The results of these systematic reviews will be used to conceptually design our two
prediction models and to justify the inclusion of certain variables regardless of their statistical
significance. Part A was designed to determine the most significant clinical predictors of
outcome in patients undergoing surgery for CSM. Holly et al (2009) performed a similar
systematic review to examine the predictive value of various clinical factors, including motor
and sensory evoked potentials, age, duration of symptoms and preoperative neurological
severity.116 This study used the Cochrane database, the National Library of Medicine database
and the reference lists of specific articles to locate relevant literature published between 1966
and 2007. This review summarized the findings from 14 studies; the main conclusions were 1)
normal preoperative median nerve potentials and/or normalization of these potentials in early
surgery predict favorable outcomes, 2) there is insufficient evidence that motor evoked
potentials predict surgical outcome and 3) class III evidence (low) suggests that age and
duration of symptoms are significant predictors of outcome.
Holly et al. (2009) identified several limitations of their review including 1) there was an
inadequate number of prospective studies, 2) too many studies assessed outcome using un-
validated measures and 3) it was challenging to combine and interpret results across studies
39
due to the use of different scales.116 Our systematic review provides an up-to-date summary of
the literature and attempts to address these limitations by increasing the pool of articles
analyzed. In addition, the mJOA has since been validated, improving the level of evidence of
each study that used this scale to evaluate outcome. Our review will also investigate the
predictive value of other clinical factors, including co-morbidities, smoking status, signs and
symptoms.
Our second systematic review (part B) was performed to identify significant imaging
predictors of surgical outcome and to evaluate the predictive value of the MRI. A previous
review by Karpova et al (2013) summarized the results from 30 studies that assessed the
relationship between surgical outcome and various imaging parameters.117 The main
conclusions from this review were that both transverse area and signal change characteristics
are predictive of outcome. This review identified several limitations in the literature, including
poorly-controlled statistical analyses, selection and measurement bias and potential
overestimation of significance. Although our review cannot address these study limitations, we
only consolidated evidence from the highest quality studies.
Our final systematic review (part C) aimed to identify important clinical and surgical
predictors of intra- and post-operative complications and to evaluate differences in
complication rates across surgical interventions. It is unclear whether patient characteristics
(age and myelopathy severity), imaging parameters (transverse area and signal change) and
surgical factors (number of decompressed levels and estimated blood loss) are important
predictors of complications. Knowledge of these key predictors will allow clinicians to identify
high-risk patients and institute rigorous preoperative and intraoperative preventative
measures. In addition, we lack comparative measures of complication rates between anterior
and posterior surgery, laminoplasty and laminectomy with fusion, anterior decompression and
laminoplasty, and various laminoplasty techniques. This knowledge gap is important and needs
to be filled to help surgeons balance the risks and benefits of each procedure. This study is the
first systematic review exploring significant predictors of surgical complications in patients with
CSM.
40
3.2 Overview of Common Methods
The systematic reviews were formatted based on the Preferred Reporting Items for
Systematic Reviews and Meta-Analyses statement. Accordingly, the materials and methods
section for each review consisted of eligibility criteria, study characteristics, information
sources, search strategy, study selection, data extraction and synthesis, risk of bias in individual
studies and risk of bias across studies.
3.2.1 Eligibility Criteria
A “PPO” table was constructed for each review to outline the target patient population,
prognostic variables of interest and outcome.
Patient Population All of our reviews targeted studies of adult patients (>18 year) with cervical myelopathy
secondary to spondylosis, disc herniation, OPLL, congenital stenosis and/or subluxation. All
patients were treated surgically and followed up postoperatively. Studies were excluded if they
included patients with traumatic spinal cord injury, thoracic or lumbar myelopathy, tumor,
infection, radiculopathy or other non-degenerative forms of myelopathy.
Prognostic Variables (Table 3-1) For part A, we were interested in studies that assessed the predictive value of various
clinical factors such as age, duration of symptoms, baseline severity score or gender.
For part B, we focused on studies designed to evaluate the association between
preoperative MRI factors and surgical outcome. We included cohort studies that assessed the
predictive value of either MRI-specific characteristics (e.g., signal intensity) or anatomical
characteristics assessed by MRI (e.g., spinal canal diameter or number of compressed
intervertebral discs).

41
For part C, we sought studies that evaluated various predictors of complications,
including clinical (ex. age, co-morbidities and body mass index (BMI)), imaging (ex. cervical
alignment, transverse area and signal change) and surgical (ex. approach, operative duration
and estimated blood loss) factors. We were also interested in studies that compared
complication rates between different surgical approaches or techniques. Studies were excluded
if their focus was on the predictive value of neuro-monitoring or surgical materials.
Table 3-1. Relevant Prognostic Factors for Systematic Reviews A, B and C
Inclusion Exclusion
Prognostic
factors: A
Age, duration of symptoms, baseline severity score, neurological signs, patient-reported symptoms, co-morbidities, smoking status, gender, race, disease progression, onset of disease.
Imaging factors
Surgical factors
Prognostic
factors: B
Intramedullary signal changes (T1 & T2-weighted MRI): absence/presence; high/low; ratio
Anatomical factors: transverse area, anteroposterior diameter, number of prolapsed intervertebral discs/number of compressed segments, level of maximum compression, rate of flattening on cord, compression ratio, circumferential maximum compression
Shape of OPLL lesion
Clinical factors
Surgical factors
Factors from other diagnostic modalities (ex. Anteroposterior diameter determined by a radiograph)
Prognostic
factors: C
Clinical factors: age, duration of symptoms, baseline severity score, signs, symptoms, co-morbidities, smoking status, gender, BMI, diagnosis
Imaging factors: signal changes on T1- or T2-weighted MRIs, transverse area, anteroposterior diameter, number of compressed segments, level of maximum compression, compression ratio, shape of OPLL lesion, cervical alignment, range of motion
Surgical factors: approach, technique, number of operated segments, number of stages, fusion, operative time, estimated blood loss
Different types of surgical materials (ex. drills, grafting material)
Neuromonitoring
OPLL: ossification of the posterior longitudinal ligament; BMI: body mass index; MRI: magnetic resonance image
Outcomes (Table 3-2)
Outcome for part A and B was evaluated using functional measures, including the mJOA,
Nurick score and 30-meter timed walking test as well as health related quality of life
questionnaires such as the NDI and the SF-36. In part B, studies were excluded if the primary

42
outcome was radiographic, a non-union, a subjective neurological assessment or a
complication.
To be eligible for part C, the study had to report on either overall postoperative
complication rates or rates of specific complications such as C5 nerve root palsy, dysphagia,
infection or instability. Studies that focused on predictors of heterotopic ossification,
progression of myelopathy or adjacent segment degeneration were excluded as these can be
considered three separate, stand-alone topics. Studies that defined axial pain and
postoperative kyphosis as surgical complications were included. However, those that discussed
axial pain and sagittal alignment as measures of pain and radiographic outcomes, respectively,
were excluded.
Table 3-2. Relevant Outcomes for Systematic Reviews A, B and C
Inclusion Exclusion
Outcome: A Functional outcomes
Clinical outcomes
Health-related quality of life
Studies were not excluded based on assessment tool
Outcome: B Functional outcomes using a validated measure (ex. mJOA/Nurick score/30-m walking test)
Patient reported outcomes (SF-36 or NDI)
Radiographic outcomes
Nonunions
Subjective neurological assessments (ex. Status was “improved,” “unchanged,” or “worse.”
Complications such as infection, pseudoarthrosis, dysphagia, etc.
Outcome: C Postoperative Complications: nerve root palsy, axial pain, surgical, dysphagia, infection, instability, systemic
Adjacent segment degeneration
Heterotopic ossification
Progression of myelopathy
mJOA: modified Japanese Orthopaedic Association; SF-36: short form-36; NDI: neck disability index
3.2.2 Study Characteristics
Part A: We focused on studies that used multivariate analyses to evaluate the
association between various clinical factors and surgical outcome. Results from all relevant
studies were still summarized in this review but were not included when rating the overall body
of evidence.

43
Part B: We limited study selection to those that assessed the predictive value of various
MRI parameters using multivariate analyses that controlled for at least two of the following
three covariates: age, duration of symptoms and severity of myelopathy.
Part C: For KQ1, we sought cohort studies designed to evaluate the association between
complications and clinical, imaging and surgical factors using a multivariate analysis. For the
sake of thoroughness, studies that did not conduct a multivariate analysis were still
summarized but were not included when rating the overall body of evidence. For KQ2, we
focused on cohort or case-control studies that measured the association between different
surgical interventions and complications, while controlling for important confounders. Studies
were excluded if they reported the incidence of complications following a specific surgical
technique but did not compare this to another procedure. For both questions, studies had to
report p-values to be included.
The following types of studies were excluded from each reveiw: review articles, letters,
editorials, commentaries, meeting abstracts and books; those with less than 10-15 patients;
and animal or biomechanical studies.
3.2.3 Information Sources
A systematic search of MEDLINE, MEDLINE in Process, EMBASE and/or Cochrane Central
Register of Controlled Trials was conducted to identify relevant studies.
3.2.4 Search Strategy
We developed a search strategy with a librarian who specializes in neuroscience
research. The strategy was first developed in MEDLINE and then appropriately modified for the
other 2-3 databases. It was reviewed thoroughly by two researchers to ensure accuracy and to
confirm that all disease-related synonyms were included. We used the following search terms
to search all databases:
Part A: Cervical Spondylotic Myelopathy AND Surgery or Postoperative AND
Prediction/Prognosis AND observational studies.
44
Part B: Cervical Spondylotic Myelopathy OR Ossification of the Posterior Longitudinal Ligament
AND Magnetic Resonance Imaging AND comparative study, randomized control trial, clinical
trial.
Part C: Cervical Spondylotic Myelopathy OR Ossification of the Posterior Longitudinal Ligament
AND Prediction or Risk of Complications arising from Surgery or Neurosurgery.
Only studies on humans and written in English were considered for inclusion, with no
other limits applied.
3.2.5 Study Selection
All abstracts and titles were reviewed independently in an unblinded, standardized
manner by two independent reviewers. The abstracts were sorted by our pre-defined inclusion
criteria and were classified as relevant, possibly relevant or irrelevant. Full text investigation of
the “possibly relevant” studies was done for further clarification. Disagreement between
reviewers was resolved through discussion.
3.2.6 Data Extraction and Synthesis
The following data was extracted from each included article: study design; patient
sample and characteristics, including diagnosis and treatment administered; clinical, imaging
and/or surgical prognostic factors evaluated; outcome measure or primary complication
outcome; and results of association, including odds ratios, confidence intervals and p-values.
3.2.7 Risk of Bias in Individual Studies
The class of evidence for each article was rated (Class I, II, III, IV) independently by two
reviewers using criteria outlined by the Journal of Bone and Joint Surgery for prognostic and
therapeutic studies and modified to encompass both methodological quality and risk of bias.118
Prognostic studies included in each review were all cohort studies and were assessed based on
whether patients were at a similar time point in their disease/treatment, the rate of follow-up
and whether the analysis controlled for important confounders (Table 3-3).

45
Table 3-3. Definition of the Different Levels of Evidence for Prognostic Studies
Class Bias Risk Study design Criteria
I Low risk: Study adheres to commonly held tenets of high quality design, execution and avoidance of bias
Good quality cohort Prospective design
Patients at similar point in the course of their disease or treatment
Follow up rate of 80%
Patients followed long enough for outcomes to occur
Accounting for other prognostic factors
II Moderately low risk: Study has potential for some bias; does not meet all criteria for class I but deficiencies not likely to invalidate results or introduce significant bias
Moderate quality cohort Prospective design, with violation of one of the other criteria for good quality cohort study
Retrospective design, meeting all the rest of the criteria in class I
III Moderately high risk: Study has flaws in design and/or execution that increase potential for bias that may invalidate study results
Poor quality cohort Prospective design with violation of 2 or more criteria for good quality cohort
Good quality case-control or cross-sectional study
Retrospective design with violation of 1 or more criteria for good quality cohort
A good case-control study
A good cross-sectional study
IV High risk: Study has significant potential for bias; does not include design features geared toward minimizing bias and/or does not have a comparison group
Poor quality case-control or cross-sectional
Other than a good case-control study
Other than a good cross-sectional study
Case series Any case series design
Therapeutic studies included in systematic review C (KQ2) were rated based on study
design; patient selection; if the analysis included intention to treat; blinded assessment;
whether cointerventions were applied equally; rates of follow-up; statistical power; and control
for confounders. The level of evidence for therapeutic studies in review C was judged based on
how the study was designed to compare and analyze rates of complications across surgical
cohorts (Table 3-4).
3.2.8 Risk of Bias Across Studies
The overall body of evidence was then assessed using a scoring system developed by the
Grades of Recommendation Assessment, Development and Evaluation (GRADE) working group
with recommendations from the Agency for Healthcare Research and Quality (AHQR).119, 120
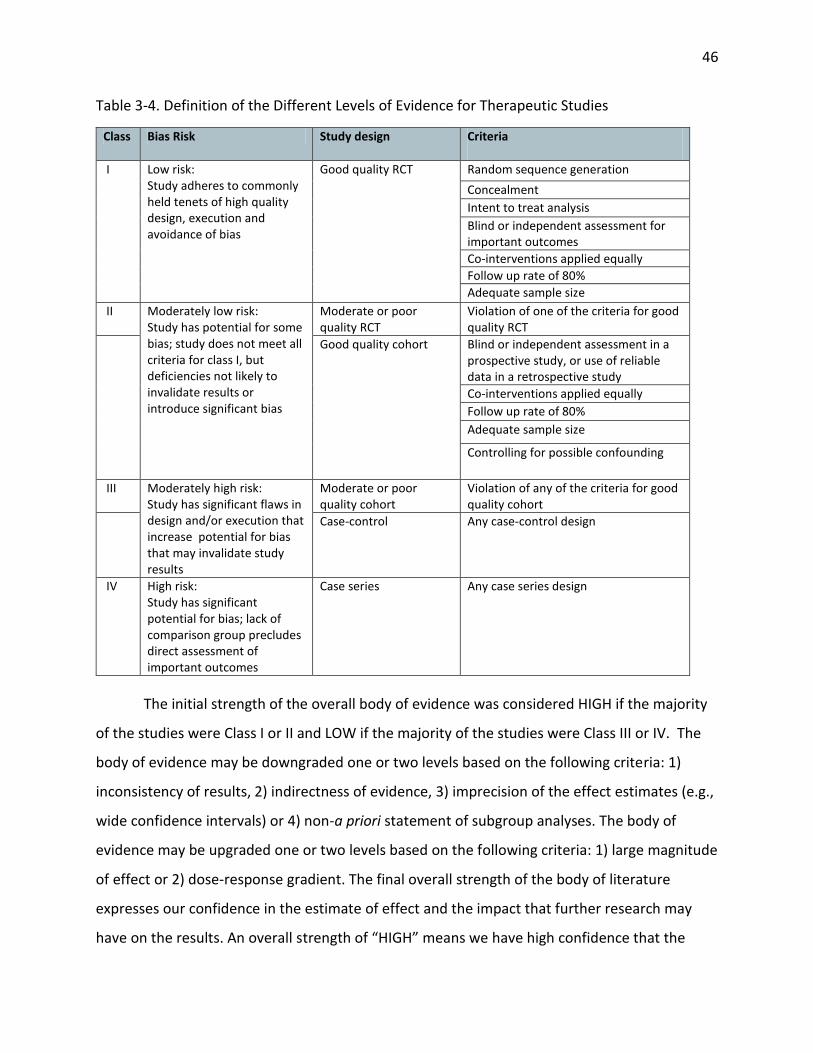
46
Table 3-4. Definition of the Different Levels of Evidence for Therapeutic Studies
Class Bias Risk Study design Criteria
I Low risk: Study adheres to commonly held tenets of high quality design, execution and avoidance of bias
Good quality RCT Random sequence generation
Concealment
Intent to treat analysis
Blind or independent assessment for important outcomes
Co-interventions applied equally
Follow up rate of 80%
Adequate sample size
II Moderately low risk: Study has potential for some bias; study does not meet all criteria for class I, but deficiencies not likely to invalidate results or introduce significant bias
Moderate or poor quality RCT
Violation of one of the criteria for good quality RCT
Good quality cohort Blind or independent assessment in a prospective study, or use of reliable data in a retrospective study
Co-interventions applied equally
Follow up rate of 80%
Adequate sample size
Controlling for possible confounding
III Moderately high risk: Study has significant flaws in design and/or execution that increase potential for bias that may invalidate study results
Moderate or poor quality cohort
Violation of any of the criteria for good quality cohort
Case-control Any case-control design
IV High risk: Study has significant potential for bias; lack of comparison group precludes direct assessment of important outcomes
Case series Any case series design
The initial strength of the overall body of evidence was considered HIGH if the majority
of the studies were Class I or II and LOW if the majority of the studies were Class III or IV. The
body of evidence may be downgraded one or two levels based on the following criteria: 1)
inconsistency of results, 2) indirectness of evidence, 3) imprecision of the effect estimates (e.g.,
wide confidence intervals) or 4) non-a priori statement of subgroup analyses. The body of
evidence may be upgraded one or two levels based on the following criteria: 1) large magnitude
of effect or 2) dose-response gradient. The final overall strength of the body of literature
expresses our confidence in the estimate of effect and the impact that further research may
have on the results. An overall strength of “HIGH” means we have high confidence that the

47
evidence reflects the true effect. Further research is very unlikely to change our confidence in
the estimate of effect. An overall strength of “MODERATE” means we have moderate
confidence that the evidence reflects the true effect. Further research may change our
confidence in the estimate of effect and may change the estimate. A grade of “LOW” means we
have low confidence that the evidence reflects the true effect. Further research is likely to
change our confidence in the estimate of effect and likely to change the estimate. Finally, a
grade of “INSUFFICIENT” means that evidence either is unavailable or does not permit a
conclusion (Table 3-5).
Table 3-5. Overview of Grade: Reasons for Upgrading and Downgrading Level of Evidence
Initial Strength Reasons for Downgrade Reasons for Upgrade
High: if majority of studies are Class I or Class II. Low: if the majority of studies are Class III or IV
Inconsistent results: If effect sizes indicate the same direction of effect and estimates are similar across studies, the body of evidence is judged to be consistent. Single study conclusions are classified as “consistency unknown” and downgraded. Indirectness of evidence: Evidence is direct if it reflects a single, direct link between the interventions of interest and the ultimate health outcome. Raters must determine whether the most clinically relevant outcome is measured or whether a surrogate outcome is assessed. Imprecision of the effect estimate: Pertains to the degree of certainty surrounding an estimate of effect for a specific outcome. Studies may be imprecise if they include relatively few patients or if the outcome is rare. This may lead to wide confidence intervals and unstable effect estimates. Risk of bias: Study has several other limitations including in its study design.
Large magnitude of effect: Add 1 point if RR or OR is >2 or <0.5 and 2 points if RR or OR is >5 or <0.2 Dose-response gradient
OR: odds ratio; RR: relative risk
3.2.9 Clinical Recommendations and Consensus Statements
Clinical recommendations or consensus statements were made based on the overall
body of evidence and classified as either “strong” or “weak”.

48
3.3 Results Part A: Important Clinical Predictors of Surgical Outcome
3.3.1 Study Selection
The electronic search yielded a total of 1677 citations. After initial review of abstracts
and titles, 1,589 articles were excluded because 1) they studied patients without degenerative
myelopathy; 2) they were not prognostic studies; 3) patients were not treated surgically or
there was no follow-up; 4) only the predictive value of imaging factors was assessed; 5) there
was no distinction between patients with cervical myelopathy and those with cervical
radiculopathy; and/or 5) they were not in English. After full text review, two studies were
excluded because their samples included non-surgical patients. Of the remaining 86, 24
conducted a multivariate analysis to evaluate the predictive value of various clinical factors
(Figure 3-1).
3.3.2 Study Characteristics
We identified 86 studies discussing significant clinical predictors of surgical outcome. Of
these, only 24 (2 prospective, 22 retrospective) conducted a multivariate analysis. Sample sizes
ranged from 47 to 146 surgical patients, with mean ages between 43.8 to 77 years. All patients
were diagnosed with some form of degenerative cervical myelopathy, with the majority
presenting with either CSM or OPLL. Few patients (n=79) presented with cervical disc
herniation. Twenty-three studies assessed age as a predictor, 22 evaluated preoperative
myelopathy severity and 19 reported on duration of symptoms. Various outcome measures
were used across the studies, with the mJOA/JOA score or recovery rate reported the most
frequently (n=20), followed by the Nurick grade (n=4) (Table 3-6).
3.3.3 Risk of Bias
We critically appraised the 24 studies that conducted a multivariate analysis. Of these,
seven were classified as level II and 17 were rated level III. Most studies were level III evidence
because they were retrospective cohort studies with unreported follow-up rates or follow-up
rates <80%. The two prospective studies did not have a complete follow-up (<80%) and were
down-graded from level I to level II evidence. In each study, patients were at similar points in

49
the course of their disease or treatment and were followed long enough for outcomes to occur.
In addition, all analyses accounted for other prognostic factors.
Figure 3-1. Search Strategy and Detailed Review Process for Systematic Review A
3.3.4 Are there clinical factors that can predict surgical outcome?
The results from the 24 studies included in our review are summarized in Table 3-7.
3.3.4.1 Age
JOA Recovery Rate
Fourteen studies evaluated the association between a patient’s JOA recovery rate and
his/her age. Recovery rate was calculated using the following equation developed by
Hirabayashi: (postoperative JOA-preoperative JOA)/(17-preoperative JOA)X100%.121
Three studies dichotomized the recovery rate and defined an “excellent” outcome as a
recovery rate ≥ 50% and a “fair” outcome as a recovery rate < 50%.122-124 Yamazaki et al (2003)

50
and Naruse et al (2009) reported no significant difference in age between patients who
achieved an excellent outcome and those who did not. In the study by Kim et al (2008),
however, the interaction of diabetes and old age increased the patient’s risk of a poor surgical
outcome (OR 2.21, 1.15-4.23).
Seven studies reported that older patients had a less favorable surgical outcome based
on the JOA recovery rate.125-131 Chen et al (2001) aimed to examine the impact of T2-SI on
surgical prognosis and identified a significant association between patient age and recovery
rate (p=0.037). Fujimura et al (1998) and Kato et al (1998) explored predictors of recovery at
short-term (1 year) and long-term follow-up: age was a significant predictor of outcome at 5-
years postoperative in both studies. In a study by Koyanagi et al (1993), patients were divided
into three groups depending on whether their primary diagnosis was CSM, OPLL or CDH. Based
on univariate analysis, age was significantly correlated with JOA recovery rate in patients with
OPLL and CDH but not in patients with CSM. However, in multivariate analysis, age was deemed
an insignificant predictor of recovery rate in all three forms of DCM. Finally, three studies
developed linear regression equations relating a combination of significant clinical and imaging
variables to recovery rate. All three equations included age as a predictor.129-131
In contrast, four studies could not identify a significant association between age and JOA
recovery rate.132-135
mJOA/JOA
Seven studies used postoperative mJOA or JOA as the primary outcome measure. Of
these, five reported an insignificant association between age and surgical outcome.135-139 In a
study by Furlan et al (2011), age was significantly correlated with mJOA score at 6-months
(R2=0.287, p<0.0001) and 12-months (R2=0.185, p=0.0003) postoperatively.140 In multivariate
analysis, age was also a significant predictor of mJOA at 1-year (p=0.01). Morio et al (2001)
constructed a regression model using a continuous JOA score as the outcome variable and
included age as a predictor.129

51
Table 3-6. Characteristics of Prognostic Studies with Multivariate Analysis: Systematic Review A
Author (year) Study design
Sample and Characteristics Non-Clinical factors assessed Clinical factor assessed Outcome Measures
Chen et al. (2001) Retrospective cohort (III)
CSM (n=64) Male: 65.6% Mean age, yr (range): 56.67 (27-86)
SI grade on T2WI Cervical curvature Cord compression ratio
Age Gender Preoperative JOA
JOA recovery rate
Chibbaro et al. (2006) Retrospective cohort (II)
CSM (n=70) Male: 67.1% Mean age, yr (range): 57 (29-76) Mean duration of symptoms (range): 13.4 (4-120) months Surgery: anterior cervical corpectomy
SI changes on T1WI SI changes on T2WI Number of levels decompressed
Age Duration of symptoms
mJOA
Chiles et al (1999) Retrospective cohort (II)
CSM (n=57), CDH (n=22) Male: 62% Mean age, yr (range): 56 (29-87) Mean duration of symptoms (range): 16.9 months (1-120) Surgery: anterior, posterior laminectomy
Number of levels decompressed Spinal cord atrophy SI changes on T2WI
Spastic gait Diagnosis Hand wasting Preoperative mJOA
mJOA, Cooper Scale
Choi et al (2005) Retrospective cohort (III)
OPLL (n=47) Male: 76.6% Mean age, yr ±SD: 54.7±8.0 Surgery: anterior discectomy and corpectomy
Snake-eye appearance Occupying ratio Type of OPLL Double-layer sign Pavlov ratio
Age Duration of symptoms Gender Preoperative Nurick Diabetes
Nurick (≥1, <1)
Fujimura et al (1998) Retrospective cohort (III)
OPLL (n=55) Male: 83.64% Mean age, yr ±SD (range): 56.8±9.5 (38-78) Mean duration of symptoms: 18.6 months Surgery: laminoplasty
None Age Duration of symptoms Preoperative JOA
JOA recovery rate
Furlan et al (2011) Prospective cohort (II)
CSM (n=81) Male: 70.37 Mean age, yr ±SD (range): 57.04±1.36 (32-88) Mean duration of symptoms ±SD (range): 25.19±2.7 months (1-120) Surgery: anterior (n=56), posterior (n=23), anteroposterior (n=2)
None Age Gender Duration of symptoms Preoperative severity Charlson co-morbidity index Preoperative number of ICD-9 codes
Nurick mJOA Berg Balance Scale

52
Iwasaki et al (2007) Retrospective cohort (II)
OPLL (n=66) Male: 77.27% Mean age, yr (range): 57 (41-75) Surgery: laminoplasty
Occupying ratio Space available for spinal cord Shape of ossification Cervical alignment
Age Preoperative JOA score
JOA score, JOA recovery rate
Iwasaki et al (2002) Retrospective cohort (II)
OPLL (n=64) Male: 67.18% Mean age, yr (range): 56 (42-78) Surgery: laminoplasty
Occupying ratio Type of OPLL Space available for spinal cord
Age Preoperative JOA score Gender
JOA score
Kato et al. (1998) Retrospective cohort (II)
OPLL (n=44) Male: 84.09% Mean age, yr (range): 57 (39-75) Mean duration of symptoms (range): 36.8 months (3-240) Surgery: laminectomy
Number of resected laminae Occupying ratio Space available for spinal cord Type of OPLL Preoperative trauma
Age Duration of symptoms Preoperative JOA
JOA recovery rate at 1 and 5-years
Kim et al. (2008) Retrospective cohort (III)
CSM, OPLL (n=87) Male: 57% Mean age, yr (range): 62.3 (42-76) Mean duration of symptoms (range): 10 months (4–36) Surgery: laminoplasty
Increased SI on T2WI with a decreased SI on T1WI
Age Presence of diabetes Presence of diabetes and older age Presence of diabetes and smoking Duration of symptoms Preoperative JOA
JOA recovery rate
Koyanagi et al (1993) Retrospective cohort (III)
CSM (n=44), OPLL (n=39), CDH (n=20) Male: 70.87% Mean age, yr: CSM (57), OPLL (59), CDH (46) Mean duration of symptoms, months: CSM (8.6), OPLL (16.9), CDH (8.5) Surgery: laminoplasty (n=67), anterior decompression and fusion (n=33), anteroposterior (n=3)
Transverse area Flattening ratio of the spinal cord
Age Duration of symptoms Preoperative JOA
JOA recovery rate
Morio et al (2001) Retrospective cohort (III)
CSM (n=42), OPLL (n=31) Male: 68.49% Mean age, yr (range): 64 (43-81) Surgery: laminoplasty
Transverse area Spinal cord signal intensity pattern
Age Duration of symptoms Preoperative JOA
JOA score, JOA recovery rate
Naruse et al. (2009) Retrospective cohort (III)
CSM (n=71), OPLL (n=18), CDH (n=12) Male: 70.3% Mean age, yr ±SD: 63.6±11.6 Surgery: laminoplasty
Spinal-cord floating C2-C7 lordotic angle Local kyphosis Beak angles
Age Gender Preoperative JOA
JOA recovery rate (≥50%, <50%)
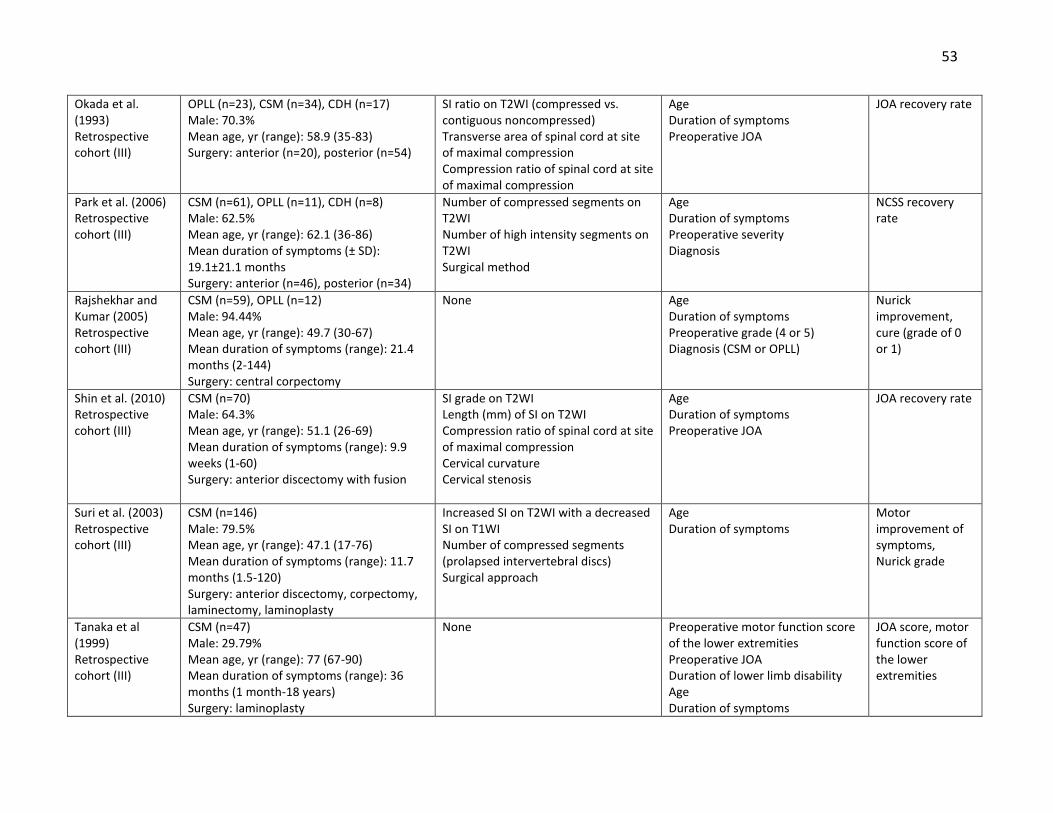
53
Okada et al. (1993) Retrospective cohort (III)
OPLL (n=23), CSM (n=34), CDH (n=17) Male: 70.3% Mean age, yr (range): 58.9 (35-83) Surgery: anterior (n=20), posterior (n=54)
SI ratio on T2WI (compressed vs. contiguous noncompressed) Transverse area of spinal cord at site of maximal compression Compression ratio of spinal cord at site of maximal compression
Age Duration of symptoms Preoperative JOA
JOA recovery rate
Park et al. (2006) Retrospective cohort (III)
CSM (n=61), OPLL (n=11), CDH (n=8) Male: 62.5% Mean age, yr (range): 62.1 (36-86) Mean duration of symptoms (± SD): 19.1±21.1 months Surgery: anterior (n=46), posterior (n=34)
Number of compressed segments on T2WI Number of high intensity segments on T2WI Surgical method
Age Duration of symptoms Preoperative severity Diagnosis
NCSS recovery rate
Rajshekhar and Kumar (2005) Retrospective cohort (III)
CSM (n=59), OPLL (n=12) Male: 94.44% Mean age, yr (range): 49.7 (30-67) Mean duration of symptoms (range): 21.4 months (2-144) Surgery: central corpectomy
None Age Duration of symptoms Preoperative grade (4 or 5) Diagnosis (CSM or OPLL)
Nurick improvement, cure (grade of 0 or 1)
Shin et al. (2010) Retrospective cohort (III)
CSM (n=70) Male: 64.3% Mean age, yr (range): 51.1 (26-69) Mean duration of symptoms (range): 9.9 weeks (1-60) Surgery: anterior discectomy with fusion
SI grade on T2WI Length (mm) of SI on T2WI Compression ratio of spinal cord at site of maximal compression Cervical curvature Cervical stenosis
Age Duration of symptoms Preoperative JOA
JOA recovery rate
Suri et al. (2003) Retrospective cohort (III)
CSM (n=146) Male: 79.5% Mean age, yr (range): 47.1 (17-76) Mean duration of symptoms (range): 11.7 months (1.5-120) Surgery: anterior discectomy, corpectomy, laminectomy, laminoplasty
Increased SI on T2WI with a decreased SI on T1WI Number of compressed segments (prolapsed intervertebral discs) Surgical approach
Age Duration of symptoms
Motor improvement of symptoms, Nurick grade
Tanaka et al (1999) Retrospective cohort (III)
CSM (n=47) Male: 29.79% Mean age, yr (range): 77 (67-90) Mean duration of symptoms (range): 36 months (1 month-18 years) Surgery: laminoplasty
None Preoperative motor function score of the lower extremities Preoperative JOA Duration of lower limb disability Age Duration of symptoms
JOA score, motor function score of the lower extremities

54
Uchida et al. (2005) Retrospective cohort (III)
CSM (n=77), OPLL (n=58) Male: 62% Mean age, yr (range): 43.8 (27-73) Surgery: en bloc C3-7 open door laminoplasty (n=92), Robinson’s anterior fusion (n=15), subtotal spondylectomy at 1-2 vertebrae with interbody fusion (n=28)
SI grade on T2WI Number of compressed segments/ levels Percentage of flattening of the cord Spinal cord evoked potentials type Spinal canal narrowing (preop CT) Radiological abnormality Type of OPLL
Age Preoperative JOA Duration of symptoms
JOA score
Wada et al. (1999) Retrospective cohort (III)
CSM (n=50) Male: 72% Mean age, yr (±SD): 61.0 ± 10.9 (range, 45-81) Mean duration of symptoms (±SD): 9.1±8.5 months (range, 1-36) Surgery: open-door laminoplasty
Number of high SI segments on T2WI AP canal diameter at max compression on plain radiographs Transverse area of spinal cord at max compression on CT myelography Number of blocks on myelogram
Age Preoperative JOA Duration of symptoms
JOA recovery rate
Yamazaki et al. (2003) Retrospective cohort (III)
CSM, OPLL (n=64) Male: 51.6% Mean age, yr (± SD): 64.6 ±12.0 Mean duration of symptoms (± SD): 25.6 ± 30.6 months Surgery: laminoplasty using the spinous process splitting technique
SI changes on T2WI Canal diameter on CT myelogram Transverse area on CT myelogram
Age Duration of symptoms Preoperative JOA
JOA recovery rate
Zhang et al. (2011) Prospective cohort (II)
CSM (n=52) Male: 57.7% Mean age, yr (range): 56.3 (45-67) Mean duration of symptoms (range): 16.1 months (3-34) Surgery: anterior (n=31), posterior (n=16), anteroposterior (n=5)
SI ratio on T2WI:T1WI Age Duration of symptoms Preoperative JOA
JOA recovery rate
Zhang et al. (2010) Retrospective cohort (III)
CSM (n=73) Male: 67.1% Mean age, yr (range) : 53.3 (34–77) Surgery: anterior, posterior, anteroposterior
SI ratio on T2WI (compressed vs. non-compressed C7-T1 levels)
Age Duration of symptoms Preoperative JOA Babinski sign
JOA recovery rate
Level of evidence of each study is given in the first column; CSM: cervical spondylotic myelopathy; SI: signal intensity; WI: weighted image; (m)JOA: modified Japanese
Orthopaedic Association; CDH: cervical disc herniation; OPLL: ossification of the posterior longitudinal ligament; SD: standard deviation; ICD: international classification
of disease; NCSS: neurosurgical cervical spine scale; CT: computed tomography

55
Nurick
In three studies, the Nurick score was dichotomized: a “poor” neurologic outcome was
defined as either no change or a decrease in the Nurick grade and a “good” neurologic outcome
as an increase of at least one Nurick grade.141-143 In studies by Choi et al (2005) and Rajshekar
and Kumar (2005), age was not a significant predictor of outcome. However, according to Suri
et al (2003), patients in the <40 age group were 2.17 times more likely to exhibit improvement
on the Nurick than patients aged 40-60 years (p<0.001). In a fourth study, Furlan et al (2011)
identified a significant association between Nurick score at 1-year and age (p=0.015).140
3.3.4.2 Duration of symptoms
JOA Recovery Rate
Ten studies evaluated the association between JOA recovery rate and preoperative
duration of symptoms. In the study by Yamazaki et al (2003), duration of symptoms was a
significant predictor of an “excellent” recovery (≥50%) in patients aged ≥65 years, but not in
those aged <65 years.122 According to Kim et al (2008), duration of symptoms was not a
significant predictor of a recovery rate ≥50%.124
Fujimura et al (1998) identified that patients with a longer duration of symptoms had a
worse JOA recovery rate at both short-term (1 and 3 years) and long-term follow-up.126 This
finding was also supported by Koyanagi et al (1993): duration of symptoms was a significant
predictor of outcome in patients with CSM, OPLL and CDH.128 Of the five studies that
constructed multiple regression equations, all included duration of symptoms as a significant
predictor of JOA.129-132, 134 In contrast, duration of symptoms was not a significant predictor in
the studies by Kato et al (1998) and Shin et al (2010).127, 133
mJOA/JOA
Five studies reported the relationship between postoperative mJOA or JOA and duration
of symptoms. Tanaka et al (1999) identified duration of symptoms as a significant predictor of
postoperative JOA score and included it in a regression model.138 Duration of symptoms was
also a contributor to a model developed by Morio et al (2001), even though it was not
significantly correlated with postoperative JOA score in univariate analysis.129 The remaining

56
three studies reported that duration of symptoms was not a significant predictor of
postoperative mJOA/JOA.136, 139, 140
Nurick
Four studies evaluated the association between Nurick and duration of symptoms.
Rajshekhar and Kumar (2005) reported that patients with a duration of symptoms ≤12 months
were 4.8 times more likely to improve and 14.0 times more likely to be “cured” following
surgery than patients with a duration of symptoms >12 months.142 In addition, according to Suri
et al (2003), patients with a duration of symptoms >2 years were less likely (OR 0.68) to exhibit
improvement on the Nurick.143 Two studies identified no relationship between duration of
symptoms and Nurick outcome.140, 141
3.3.4.3 Baseline Severity Score
JOA Recovery Rate
Fourteen studies examined the relationship between baseline JOA score and JOA
recovery rate. Using multiple logistic regression analysis, Yamazaki et al (2003) and Kim et al
(2008) reported that preoperative JOA was not predictive of an “excellent” recovery rate
(≥50%).122, 124 In contrast, in a study by Naruse et al (2009), patients with a higher preoperative
JOA were more likely to experience a recovery rate ≥50% (OR 1.645, 1.202-2.253, p=0.0019).123
Four studies demonstrated that patients with milder myelopathy experience a higher
recovery rate on the JOA than those with a lower preoperative score.127, 130, 131, 133 The two
regression equations developed by Zhang et al (2010, 2011) included preoperative JOA as a
predictor of JOA recovery rate.
Seven studies reported an insignificant relationship between preoperative JOA and
recovery rate.125, 126, 128, 129, 132, 134, 135 This is likely because a patient’s recovery rate is already
based on his/her preoperative JOA score.
mJOA/JOA
Results were significantly different when the primary outcome was postoperative
JOA/mJOA instead of recovery rate. All studies reported that patients with a higher

57
preoperative score and milder myelopathy have a significantly higher postoperative score and a
better surgical outcome.129, 135, 137-140, 144 In the two studies that constructed regression models,
preoperative JOA was included as an important predictor of postoperative JOA.130, 131
Nurick
Three studies used the Nurick as an outcome measure. In a study by Choi et al (2005),
preoperative Nurick was a significant predictor of a ≥1 point improvement on the Nurick in
univariate (p=0.0268) but not multivariate (p=0.1552) analysis.141 Rajshekhar and Kumar (2005)
examined predictors of Nurick improvement as well as of a “cure,” defined as a postoperative
Nurick score of 0 or 1.142 Based on this study, patients with a preoperative Nurick score of 4
were 8.6 times more likely to be “cured” than those with a score of 5. Preoperative severity
score, however, was not a significant predictor of “improvement” on the Nurick. According to
Furlan et al (2011), patients with a lower and milder Nurick score had a better surgical
outcome.140
3.3.4.4 Other Predictors
The predictive value of other clinical factors was also examined: gender (n=5),123, 125, 137,
140, 141 diagnosis/type of myelopathy (n=3),142, 144, 145 diabetes (n=2),124, 141 Charlson Co-morbidity
Index (n=1),140 number of ICD-9 codes (n=1),140 smoking status (n=1)124 and various neurological
signs (n=2).130, 144
Gender was not significantly associated with surgical outcome across all outcome
measures.120,122,134,137,138
Three studies evaluated whether type of myelopathy was predictive of surgical
outcome: one study compared patients with OPLL to those with CSM,142 another examined
recovery rates in OPLL, CSM and CDH patients145 and a final study evaluated differences in
outcome between patients with CSM and those with soft disc herniation.144 According to
Rajshekar and Kumar (2005), patients with CSM were 5.3 times more likely to exhibit
improvement on the Nurick than those with myelopathy secondary to OPLL (p=0.02). There was
no significant association between disease diagnosis (CSM or OPLL) and a “cure” or score of 0 or

58
1 on the Nurick. In the study by Park et al (2006), the Neurological Cervical Spine Scale (NCSS)
recovery rates were not significantly different across the three diagnosis groups (OPLL, CSM,
CDH). Finally, patients with soft disc herniation had a better postoperative mJOA and change in
mJOA than patients diagnosed with CSM.144
According to Furlan et al (2011), preoperative number of ICD-9 codes was a significant
predictor of postoperative mJOA at 1-year follow-up (p=0.013).140 In multivariate analysis, this
variable was not significantly associated with Nurick or Berg Balance Scale at 1-year. Charlson
Co-morbidity Index was also not a significant predictor of outcome. The predictive value of
diabetes was examined by two studies.124, 141 Choi et al (2005) reported that patients without
diabetes were 14.3 times more likely to experience improvement by ≥1 point on the Nurick
than patients with diabetes. Kim et al (2008) confirmed these findings: patients with diabetes
were 2.92 times more likely to have a <50% recovery rate than healthy patients. The odds ratio
of this association increased to 4.01 if the patient also smoked.
The predictive value of spastic gait, hand wasting and a positive Babinski sign was
examined by single studies. Hand wasting was significantly associated with postoperative mJOA
and change in mJOA; spastic gait was not predictive of either.144 A positive Babinski sign was
significantly correlated with JOA recovery rate and was included in the final regression equation
developed by Zhang et al (2010).130
3.3.5 Results of studies without multivariate analysis
Sixty-two additional studies discussed the predictive value of various clinical factors but
did not conduct a multivariate analysis. Forty-seven studies assessed age as a predictor, 41
reported on duration of symptoms and 34 examined preoperative myelopathy severity. A wide
variety of outcome measures were used in these studies, including the mJOA/JOA, Nurick score,
European Myelopathy Scale, 30-meter walking test. Other studies used unvalidated or
subjective measures to evaluate outcome such as “improvement of symptoms,” neurological
examination and the modified Lees and Turner. To be thorough, we summarized the results of
these studies in this section.

59
Table 3-7. Important Clinical Predictors of Surgical Outcomes: Results of Univariate and Multivariate Analysis
Author (year) Study Design (level of evidence)
Univariate Analysis Multivariate Analysis (Clinical Factors)
Chen et al (2001)
Multivariate regression analysis
Gender: p=0.294 Age: p=0.014 Preoperative JOA: p=0.055
Gender: p=0.489 Preoperative JOA: p=0.061 Age: p=0.037
Chibbaro et al (2006)
Multivariate regression analysis
NR Age: p=0.47 Duration of symptoms: p=0.29 Preoperative mJOA: p=0.0005
Chiles et al (1999)
Multivariate regression analysis
Postoperative mJOA Spastic gait: p=0.0039 OPLL diagnosis: p=0.0096 Hand wasting: p=0.1389 Change in mJOA OPLL diagnosis: p=0.0004 Spastic gait: p=0.9476 Hand wasting: p=0.9619
Postoperative mJOA Preoperative JOA: p<0.0001 Hand wasting: p=0.0210 OPLL diagnosis: p=0.0226 Spastic gait: p=0.1902 Change in mJOA Preoperative JOA: p<0.0001 Hand wasting: p=0.0255 OPLL diagnosis: p=0.0366 Spastic gait: p=0.1817
Choi et al (2005)
Multiple logistic regression analysis (≥ 1 change/<1 change)
Duration of symptoms: p=0.1082 Diabetes: p=0.0064 Preoperative Nurick: p=0.0268
Diabetes: OR 14.302 (1.034-197.766), p=0.0471 Duration of symptoms: p=0.1127 Preoperative Nurick: p=0.1552
Fujimura et al (1998)
Multivariate regression analysis
NR At 1 and 3-years after surgery: Duration of symptoms: p<0.06 At 5-years after surgery: Duration of symptoms: p<0.05 Age: p<0.05
Furlan et al (2011)
Multivariate regression analysis
Nurick at 1-year Gender: p=0.269 Age: p=0.002 Duration of symptoms: p=0.50 CCI: p=0.123 Preoperative number of ICD-9 codes: p=0.0009 mJOA at 1-year Gender: p=0.331 Age: p=0.0003
Nurick at 1-year Preoperative Nurick: p=0.004 Age: p=0.015 mJOA at 1-year Preoperative JOA: p=0.007 Age: p=0.01 Number of ICD-9 codes: p=0.013 BBS at 1-year Preoperative BBS: p=0.0001
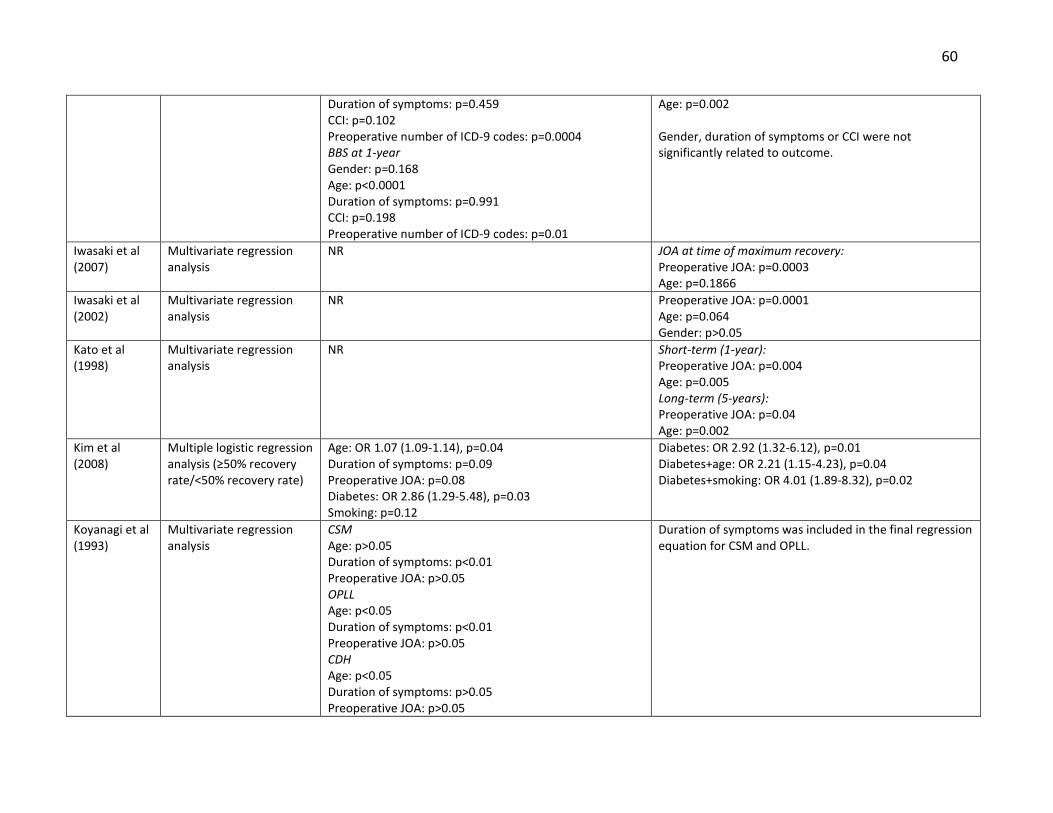
60
Duration of symptoms: p=0.459 CCI: p=0.102 Preoperative number of ICD-9 codes: p=0.0004 BBS at 1-year Gender: p=0.168 Age: p<0.0001 Duration of symptoms: p=0.991 CCI: p=0.198 Preoperative number of ICD-9 codes: p=0.01
Age: p=0.002 Gender, duration of symptoms or CCI were not significantly related to outcome.
Iwasaki et al (2007)
Multivariate regression analysis
NR JOA at time of maximum recovery: Preoperative JOA: p=0.0003 Age: p=0.1866
Iwasaki et al (2002)
Multivariate regression analysis
NR Preoperative JOA: p=0.0001 Age: p=0.064 Gender: p>0.05
Kato et al (1998)
Multivariate regression analysis
NR Short-term (1-year): Preoperative JOA: p=0.004 Age: p=0.005 Long-term (5-years): Preoperative JOA: p=0.04 Age: p=0.002
Kim et al (2008)
Multiple logistic regression analysis (≥50% recovery rate/<50% recovery rate)
Age: OR 1.07 (1.09-1.14), p=0.04 Duration of symptoms: p=0.09 Preoperative JOA: p=0.08 Diabetes: OR 2.86 (1.29-5.48), p=0.03 Smoking: p=0.12
Diabetes: OR 2.92 (1.32-6.12), p=0.01 Diabetes+age: OR 2.21 (1.15-4.23), p=0.04 Diabetes+smoking: OR 4.01 (1.89-8.32), p=0.02
Koyanagi et al (1993)
Multivariate regression analysis
CSM Age: p>0.05 Duration of symptoms: p<0.01 Preoperative JOA: p>0.05 OPLL Age: p<0.05 Duration of symptoms: p<0.01 Preoperative JOA: p>0.05 CDH Age: p<0.05 Duration of symptoms: p>0.05 Preoperative JOA: p>0.05
Duration of symptoms was included in the final regression equation for CSM and OPLL.

61
Morio et al (2001)
Multivariate regression analysis
Recovery rate Preoperative JOA: p=0.9289 Duration of symptoms: p=0.050 Age: p=0.0031 Postoperative JOA score Preoperative JOA: p<0.0001 Duration of symptoms: p=0.5565 Age: p<0.0001
Recovery rate Duration of symptoms and age were included in the final regression equation Postoperative JOA score Duration of symptoms, preoperative JOA score and age were included in the final regression equation.
Naruse et al (2009)
Multiple logistic regression analysis (≥50% recovery rate/<50% recovery rate)
At 1-year Preoperative JOA score: OR 1.369 (1.080-1.734), p=0.0093 Gender: p=0.3076 Age: p=0.7619
Preoperative JOA score: OR 1.645 (1.202-2.252), p=0.0019
Okada et al (1993)
Multivariate regression analysis
RR of patients with CDH was significantly higher than the RR of patients with CSM or OPLL (p<0.01) Duration of symptoms: r=-0.463 for OPLL, r=-0.401 for CSM Age: NS Preoperative JOA: NS
Duration of symptoms was included in the final regression equation.
Park et al (2006)
Multivariate regression analysis
Duration of symptoms: p=0.0039 Preoperative NCSS: p<0.0001 Age: p=0.4279 Diagnosis (OPLL CSM, CDH): p=0.2002
Duration of symptoms: p<0.01 Preoperative NCSS: p>0.05 Age: p>0.05
Rajshekhar and Kumar (2005)
Multiple logistic regression (Nurick improvement ≥1/ <1; cure (Nurick=0 or 1)/ no-cure)
Improvement Age: p=1.00 Duration of symptoms: p=0.003 Preoperative Nurick: p=0.01 OPLL Diagnosis: p=0.005 Cure Age: p=0.40 Duration of symptoms: p=0.007 Preoperative Nurick: p=0.06 OPLL Diagnosis: p=1.00
Improvement Duration of symptoms (ref>12): OR 4.8 (1.4-16.4), p=0.01 Diagnosis (ref=OPLL): OR 5.3 (1.3-22.2), p=0.02 Cure Duration of symptoms (ref>12): OR 14.0 (1.7-115.9), p=0.01 Preoperative Nurick (ref=5): OR 8.6 (1.0-73.0), p=0.05
Shin et al (2010)
Multivariate regression analysis
NR Age: p=0.0604 Duration of symptoms: p=0.2969 Preoperative JOA: p<0.0001
Suri et al (2003)
Multiple logistic regression analysis (improvement in
Motor Outcome: Age (ref=40-60): <40, OR 2.5 (0.64-7.3)
Motor Outcome: Age (ref=40-60): <40, OR 2.9 (0.7-4.2), p<0.05

62
(m)JOA: (modified) Japanese Orthopaedic Association; OPLL: ossification of the posterior longitudinal ligament; ICD: international classification of disease; CCI: Charlston
co-morbidity index; BBS: berg balance scale; OR: odds ratio; CDH: cervical disc herniation; NCSS: neurosurgical cervical spine scale; NS: not significant
symptoms/no improvement)
Duration of symptoms (ref>2 years): <1 year, OR 3.9 (1.1-10.4); 1-2 years, OR 3.11 (0.46-2.66) Disability Outcome: Age (ref=40-60): <40, OR 3.1 (0.71-9.1) Duration of symptoms (ref <1 year): 2 years, OR 0.68 (0.30-1.54)
Duration of symptoms (ref >2 years): <1 year, OR 5.9 (0.82-12.5), p<0.05; 1-2 years, OR 2.89 (1.2-9.5), p<0.05 Disability Outcome: Age (ref=40-60): <40, OR 2.17 (0.61-9.1), p<0.001
Tanaka et al (1999)
Multivariate regression analysis
NR Postoperative motor function score of the lower extremity: Preoperative motor function score of the lower extremity and duration of lower limb disability were included in the final regression equation. Postoperative JOA score: Preoperative JOA and duration of symptoms were included in the final regression equation.
Uchida et al (2005)
Multivariate regression analysis
NR CSM/OPLL: Preoperative JOA: p<0.05
Wada et al (1999)
Multiple regression analysis
Duration of symptoms: r=-0.364 Age: poor correlation Preoperative JOA: poor correlation
Duration of symptoms was included in the final regression equation.
Yamazaki et al (2003)
Multiple logistic regression analysis (recovery rate ≥50%/<50%)
Younger patients (<64 years) Age: p=0.334 Duration of symptoms: p=0.291 Preoperative JOA: p=0.780 Older patients (>65 years) Age: p=0.466 Duration of symptoms: p=0.004 Preoperative JOA: p=0.070
Older patients (>65 years) Duration of symptoms: OR 0.886 (0.817-0.961), p=0.004
Zhang et al (2011)
Multivariate regression analysis
NR Age, duration of symptoms and preoperative JOA were included in the final regression equation.
Zhang et al (2010)
Multivariate regression analysis
NR Age, duration of symptoms, preoperative JOA and Babinski sign were included in the final regression equation.

63
3.3.5.1 Age
One study reported a positive,146 13 a negative147-159 and 30 an insignificant association
between age and surgical outcome.9, 160-187 Table 3-8 summarizes the results from these studies.
Table 3-8. The Association between Age and Surgical Outcome: Results from Studies without
Multivariate Analysis
Association Articles Outcome Measures
Negative Arnold et al. (1993), Bertalanffy and Eggert (1988), Chagas et al. (2005), Cheng et al. (2009), Heidecke et al. (2000), Holly et al. (2008), Lyu et al. (2004), Masaki et al. (2007), Matsuda et al. (1999), Naderi et al. (1998), Nagata et al. (1996), Satomi et al. (2001), Sinha and Jagetia (2011)
Nurick: Chagas mJOA/JOA: Cheng, Holly, Lyu, Masaki, Matsuda, Naderi, Nagata, Satomi Improvement of symptoms: Arnold, Bertalanffy and Eggert European Myelopathy Scale: Heidecke Roosen and Grote: Bertalanffy and Eggert NCSS: Sinha and Jagetia
Positive Singh et al. (2001) Walking test: Singh
None Ahn et al. (2010), Arnasson et al. (1987), Bishara et al. (1971), Chen et al. (2009), Chung et al. (2002), Ebersold et al. (1995), Fessler et al. (1998), Gok et al. (2009), Gregorius et al. (1976), Hamanishi et al. (1996), Hamburger et al. (1997), Handa et al. (2002), Hasegawa et al. (2002), Houten and Cooper (2003), Huang et al. (2003), Hukuda et al. (1985), Kawaguchi et al. (2003), Koc et al. (2004), Lee et al. (1997), Lu et al. (2008), Mastronardi et al. (2007), Matsuoka et al. (2001), Naderi et al. (1996), Nagashima et al. (2011), Ryu et al. (2010), Saunders et al. (1991), Singh et al. (2009), Suzuki et al. (2009), Wiberg et al. (1986), Wohlert et al. (1984)
Nurick: Ebersold, Fessler, Gok, Huang, Lee, Mastronardi, Saunders mJOA/JOA: Ahn, Chen, Chung, Hamanishi, Hamburger, Handa, Hasegawa, Houten and Cooper, Hukuda, Kawaguchi, Koc, Lu, Mastronardi, Matsuoka, Naderi, Nagashima, Ryu, Suzuki Cooper: Houten and Cooper Walking test: Singh Gait Improvement: Lee Modified Lees and Turner: Gregorius Questionnaire/Exam: Arnasson, Wiberg Improvement of symptoms: Bishara, Wohlert
Conditional* Guidetti and Fortuna (1969)188: Significant negative predictor when evaluated alone. When adjusting for disease duration, age was a less important predictor. Nagashima et al. (2006)189: In patients with a preoperative JOA score from 10-12, the recovery rates between ``old`` and ``young`` age groups were similar. In more severe cases, the recovery rates were lower in the older group. Ogawa et al. (2004)190: Negative predictor in severe myelopathy. Insignificant predictor in moderate myelopathy.
JOA: Nagashima, Ogawa Neurological Evaluation: Guidetti and Fortuna
*Indicates a significant relationship only under certain conditions. NCSS: neurosurgical cervical spine scale; (m)JOA: (modified) Japanese Orthopaedic Association

64
3.3.5.2 Duration of Symptoms
Twenty-seven studies reported a negative9, 147-150, 154, 155, 157, 158, 162, 165, 167, 173, 178, 179, 182,
183, 185, 187, 188, 191-197 and 11156, 161, 163, 166, 171, 172, 175, 176, 186, 198, 199 an insignificant association
between duration of symptoms and surgical outcome. Table 3-9 illustrates the results from
these studies.
Table 3-9. The Predictive Value of Duration of Symptoms: Results from Studies without
Multivariate Analysis
Association Articles Outcome Measures
Negative Agrawal et al. (2004), Arnold et al. (1993), Bertalanffy and Eggert (1988), Bishara (1971), Chagas et al. (2005), Ebersold et al. (1995), Gok et al. (2009), Guidetti and Fortuna (1969), Hamanishi et al. (1996), Heidecke et al. (2000), Hukuda et al. (1985), Iencean et al. (2007), Kim et al. (2007), Masaki et al. (2007), Mastronardi et al. (2007), Matsuda et al. (1999), Matsuoka et al. (2001), Moussa et al. (1983), Nagata et al. (1996), Phillips et al. (1973), Ryu et al. (2010), Satomi et al. (2001), Saunders et al. (1991), Scardino et al. (2010), Sinha and Jagetia (2011), Suzuki et al. (2009), Wohlert et al. (1984)
Nurick: Agrawal, Chagas, Ebersold, Gok, Lee, Mastronardi, Phillips, Saunders, Scardino mJOA/JOA: Hamanishi, Hukuda, Iencean, Masaki, Mastronardi, Matsuda, Matsuoka, Naderi, Nagata, Ryu, Satomi, Suzuki EMS: Heidecke Herkowitz: Kim Modified Lees and Turner: Moussa Roosen and Grote: Bertalanffy and Eggert NCSS: Sinha and Jagetia Neurological Evaluation: Guidetti and Fortuna Improvement of symptoms: Arnold, Bertalanffy and Eggert, Bishara, Wohlert
None Arnasson et al. (1987), Chen et al. (2009), Emery et al. (1998), Gregorius et al. (1976), Houten and Cooper (2003), Huang et al. (2003), Koc et al. (2004), Kumar et al. (1999), Lee et al. (1997), Naderi et al. (1998), Wiberg et al. (1986)
Nurick: Emery, Huang mJOA/JOA: Chen, Houten and Cooper, Koc Cooper: Houten and Cooper SF-36/Harsh: Kumar Questionnaire/Exam: Wiberg Neurological Evaluation: Arnasson Modified Lees and Turner: Gregorius Gait Improvement: Lee
Conditional* Chung et al. (2002)200: Negatively correlated with outcome if baseline JOA is <9. Handa et al. (2002)169: Negative relationship with outcome in the older but not the younger group. Ogawa et al. (2004)190: An important predictor in moderate but not severe myelopathy.
JOA: Chung, Handa, Ogawa
*Indicates a significant relationship only under certain conditions. NCSS: neurosurgical cervical spine scale; (m)JOA: (modified) Japanese Orthopaedic Association; SF-36: short form-36

65
3.3.5.3 Baseline Severity Score
Fourteen studies reported a positive,162, 168, 173, 175, 179, 192, 193, 197-203 four a negative146, 165,
172, 184 and 139, 153-155, 158, 160, 163, 164, 167, 183, 186, 187, 204 an insignificant association between baseline
severity score and surgical outcome. Table 3-10 provides an overview of the results from these
studies.
Table 3-10. The Relationship between Preoperative Myelopathy Severity and Surgical Outcome:
Results from Studies without Multivariate Analysis
Association Articles Outcome Measures
Negative Gok et al. (2009), Huang et al. (2003), Singh et al. (2009), Singh et al. (2001),
Nurick: Gok, Huang Walking test: Singh, Singh
Positive Alafifi et al. (2007), Bishara et al. (1971), Chung et al. (2002), Emery et al. (1998), Hamburger et al. (1997), Hukuda et al. (1985), Iencean (2007), Kim et al. (2007), Kiris and Kilincer (2008), Koc et al. (2004), Kumar et al. (1999), Matsuoka et al. (2001), Sinha and Jagetia (2010), Wang et al. (2003).
Nurick: Alafifi, Emery, Wang mJOA/JOA: Chung, Hamburger, Hukuda, Iencean, Kiris and Kilincer, Koc, Matsuoka Herkowtiz: Kim Improvement of symptoms: Bishara SF-36/Harsh: Kumar NCSS: Sinha and Jagetia
None Ahn et al. (2010), Chen et al. (2009), Ebersold et al. (1995), Fessler et al. (1998), Hamanishi et al. (1996), Lyu et al. (2004), Magnaes and Hauge (1980), Masaki et al. (2007), Matsuda et al. (1999), Satomi et al. (2001), Saunders et al. (1991), Wiberg et al. (1986), Wohlert et al. (1984),
Nurick: Fessler, Saunders mJOA/JOA: Ahn, Chen, Hamanishi, Lyu, Masaki, Matsuda, Satomi Questionnaire/Exam: Wiberg Patient`s subjective evaluation: Magnaes and Hauge Improvement of symptoms: Wohlert
Conditional Guidetti and Fortuna (1969)188: Significant positive predictor when evaluated alone. When adjusting for disease duration, baseline severity was a less important predictor. Handa et al. (2002)169: Significant predictor of outcome in the younger but not older group. Ogawa et al (2004)190: Significant predictor of outcome in the severe group but not in the moderate group.
JOA: Handa, Ogawa Neurological Evaluation: Guidetti and Fortuna
*Indicates a significant relationship only under certain conditions. NCSS: neurosurgical cervical spine scale; (m)JOA: (modified) Japanese Orthopaedic Association; SF-36: short form-36
3.3.5.4 Other Predictors
Several other clinical predictors were evaluated. Table 3-11 summarizes the results from
additional studies that examined the predictive performance of other clinical variables.

66
Table 3-11: Other Clinical Predictors of Surgical Outcome: Results from Studies without Multivariate Analysis
N/Hi: Normal T1 image/High T2 signal change, Lo/Hi: Low T1 signal change/High T2 signal change; MRI: magnetic
resonance imaging; ROM: range of motion
Co-Morbidities
Number of co-morbid diseases
Nagata et al. (1996): A greater number of co-morbidities was associated with a poor surgical outcome in the older group.157
Presence of co-morbid disease
Houten and Cooper (1999): Presence of co-morbidities is not related to outcome.171
Diabetes Chen et al. (2009), Kawaguchi et al. (2000): Diabetes is not a significant predictor of outcome.163, 205
Psychological disorders Kumar et al. (1999): Patients in the “poor” outcome group had greater emotional problems than those in the “good” outcome group.206
Signs and Symptoms
Lower extremity dysfunction
Lee et al. (1997): Not a significant predictor of outcome.176 Gregorius et al. (1976): Presence of lower extremity weakness is associated with a worse outcome.166
Upper extremity dysfunction
Lee et al. (1997): Not a significant predictor of outcome.176 Magnaes and Hauge (1980): Presence of arm symptoms is positively associated with leg outcome.204
Bowel/ Bladder Dysfunction
Houten and Cooper (1999), Lee et al. (1997): Not a significant predictor of outcome 171,
176 Gregorius et al. (1976), Sinha and Jagetia (2011): Presence of bladder/bowel dysfunction is associated with a worse outcome.159, 166
Babinski Sign Alafifi et al. (2007): A positive Babinski sign was predictive of a worse outcome in patients with either a N/Hi or Lo/Hi T1/T2-weighted MRI.201
Leg spasticity/Spastic gait Gregorius et al. (1976): Not a significant predictor of outcome.166 Alafifi et al. (2007), Bertalanffy and Eggert (1998): Presence of leg spasticity is associated with a worse outcome.149, 201
Hyperreflexia Hand Atrophy
Alafifi et al. (2007): Both these signs were predictive of a worse outcome in patients with either a N/Hi or Lo/Hi MRI.201
Sexual dysfunction Clonus Gait Impairment
Found to be negative predictors of outcome by single studies.159, 201, 203
Upper extremity atrophy Radicular pain Lower cervical pain Cervical ROM Long tract signs
Found to be insignificant predictors of outcome by single studies.166, 176
Other
Race Race is not a predictor of outcome.166
Gender Emery et al. (1998): Males showed more improvement than females.198 Not a significant predictor of outcome by several studies.163, 165, 166, 187, 200, 207-214
Onset of symptoms Patients with a gradual onset of symptoms have a worse outcome.149
Disease progression Patients with a slower disease progression have a better outcome.194

67
3.3.6 Evidence Summary
Moderate evidence suggests that age is not associated with postoperative JOA score. It
is unknown, however, whether age is predictive of JOA recovery rate or postoperative Nurick.
According to low level evidence, a longer duration of symptoms is predictive of a worse
recovery rate on the JOA. The association between duration of symptoms and postoperative
mJOA/JOA or Nurick are unclear in the literature.
Based on moderate evidence, more severe preoperative myelopathy is predictive of a
lower postoperative mJOA/JOA. Given that the JOA recovery rate is based off of both pre- and
post-operative JOA, there is no association between baseline JOA and JOA recovery rate (low)
evidence).
Gender is not a significant predictor of surgical outcome based on low level evidence.
There is insufficient evidence suggesting that smoking status, hand wasting, spastic gait,
Babinski sign and type of myelopathy are important predictors of surgical outcome.
Based on low to moderate evidence, patients with diabetes are more likely to
experience a worse surgical outcome than patients without diabetes. On the other hand,
Charlson Co-morbidity Index and number of ICD-9 cases are not associated with surgical
outcome (low evidence) (Table 3-12).
3.3.7 Discussion
Our systematic review summarizes important clinical predictors of surgical outcome.
This knowledge will provide decision support to surgeons and allow them to better predict how
their patients are likely to fare following surgery. Furthermore, this information can be used by
clinicians to help manage patients’ expectations, especially those who are less likely to achieve
optimal recovery.
Based on this review, patients with a longer duration of symptoms and more severe
myelopathy preoperatively are likely to have a worse surgical outcome. The rationale behind
this finding is that severe and chronic longstanding compression of the spinal cord may lead to

68
Table 3-12. Evaluation of Overall Body of Evidence using GRADE: Systematic Review A
Baseline quality: HIGH = majority of articles are Level I/II. LOW = majority of articles are Level III/IV.
UPGRADE: Large magnitude of effect (1 or 2 levels); dose response gradient (1 level); Plausible confounding decreases magnitude of effect (1 level)
DOWNGRADE: Inconsistency of results (1 or 2 levels); indirectness of evidence (1 or 2 levels); imprecision of effect estimates (1 or 2 levels); risk of bias (1 or 2 levels);
failure to specify subgroup analysis a priori (1 level); reporting bias (1 level)
Strength of
evidence
Conclusions/Comments Baseline UPGRADE
(levels)
DOWN-GRADE
(levels)
Are there clinical factors that predict post-surgical patient outcome?
Age MODERATE
UNKNOWN
Not associated with JOA: As reported by five retrospective studies, age is not a significant predictor of postoperative JOA.
It is unknown whether age is associated with JOA recovery rate or postoperative Nurick
HIGH Precision unknown
(-1)
Duration of symptoms LOW-
INSUFFICIENT
UNKNOWN
Associated with Lower JOA Recovery Rate: As reported by seven retrospective studies, a longer duration of symptoms is predictive of a worse recovery rate on the JOA
It is unknown whether duration of symptoms is associated with postoperative mJOA/JOA or Nurick.
LOW
N/A
N/A
Precision unknown
(-1)
N/A
Baseline severity score LOW-
INSUFFICIENT
MODERATE
UNKNOWN
Not associated with JOA Recovery Rate: As reported by nine retrospective studies, there is no association between baseline JOA and JOA recovery rate.
Associated with mJOA/JOA: According to five studies (1 prospective, 6 retrospective), more severe preoperative myelopathy is predictive of a lower postoperative mJOA/JOA.
It is unknown whether baseline Nurick score is predictive of postoperative Nurick.
LOW
HIGH
N/A
N/A
Precision unknown
(-1)
Precision unknown
(-1)
N/A
Gender LOW-
INSUFFICIENT
Not associated with outcome: As reported by five studies (1 prospective, 4 retrospective), gender is not a significant predictor of surgical outcome.
LOW Precision unknown
(-1)
Diabetes
LOW-
MODERATE
Associated with a poorer outcome: As reported by two studies (2 retrospective), diabetes is a significant predictor of a worse surgical outcome
HIGH
Large
magnitude of
effect (+1-2)
Imprecision (-1)

69
Charlson co-morbidity index
Number of ICD-9 codes
LOW Not associated with outcome: As reported by a single prospective study, CCI and number of ICD-9 codes are not associated with surgical outcome
HIGH Consistency
unknown (-1), risk
of bias (-1)
Diagnosis INSUFFICIENT There is insufficient evidence (3 retrospective studies) that type of myelopathy (CDH, CSM or OPLL) affects surgical outcome
LOW Inconsistency of
results (-1), precision
unknown (-1)
Hand wasting Spastic gait Babinski sign
INSUFFICIENT
INSUFFICIENT
There is insufficient evidence that hand wasting and spastic gait are predictors of surgical outcome
There is insufficient evidence that a positive Babinski sign is a significant predictor of surgical outcome
LOW
LOW
Inconsistency of
results (-1), precision
unknown (-1)
Smoking status INSUFFICIENT There is insufficient evidence (1 retrospective study) suggesting smoking status predicts surgical outcome
LOW Large
magnitude of
effect (+1)
Consistency
unknown (-1),
Indirect evidence (-1)
Unknown: controversy across studies prevented assessment of strength of evidence. (m)JOA: (modified) Japanese Orthopaedic Association; ICD: international
classification of disease; CCI: Charlston co-morbidity index; CDH: cervical disc herniation; CSM: cervical spondylotic myelopathy: OPLL: ossification of the posterior
longitudinal ligament.

70
irreversible histological damage such as demyelination, cavitation and necrosis of the gray
matter.215 It is therefore essential that primary care physicians detect myelopathy at an early
stage, differentiate between this disease and other common diagnoses such as carpal tunnel
syndrome and refer these patients for early surgical consultation.
There is little consensus in the literature as to whether age is a significant predictor of
surgical outcome. Although most surgeons will not discriminate on the basis of age, they should
be aware that the elderly may not be able to translate neurological improvement to functional
recovery as well as their younger patients. Potential explanations for this discrepancy include 1)
the elderly experience age-related changes in their spinal cord, including a decrease in γ-
motorneurons, number of anterior horn cells and number of myelinated fibers in the
corticospinal tracts and posterior funiculus; 2) since CSM is a progressive disease, older patients
are likely to have more substantial degenerative pathology and may require a more complex
surgery; 3) older patients have reduced physiological reserves and are more likely to have
unassociated co-morbidities that may affect outcome; and 4) the elderly may not be able to
conduct all activities on a certain functional scale due to these co-morbidities (ex. walking time
may be affected by osteoarthritis).124, 157, 170, 216, 217 We recommend that surgeons consider a
patient’s physiological age, evaluate all potential co-morbidities and predict outcome
accordingly.
This review also explored several other predictors of surgical outcome, including gender,
smoking status, co-morbidities, signs and symptoms. Based on low to moderate evidence,
patients with diabetes have reduced odds of achieving a favorable surgical outcome. This is
likely because diabetic individuals exhibit abnormalities in their spinal cord and peripheral
nerves such as infarcts, demyelination, atrophy and softening of the posterior columns.141
Furthermore, diabetics are at an increased risk of perioperative complications that may impact
their recovery following surgery.218 The predictive value of other factors remains unknown and
requires further exploration.
Results from this review significantly differed depending on what scale was used to
evaluate surgical outcome. This may be a result of limitations in the scales rather than an
71
indication of the actual association between predictor and outcome. For example, the Nurick
score is a scale with lower sensitivity; it is a six grade scale that is largely weighted towards
lower limb function and employment.70 Based on our summary of evidence, we were unable to
determine whether age, duration of symptoms or baseline severity score were significantly
associated with postoperative Nurick. On the other hand, various forms of the mJOA were
significantly associated with preoperative myelopathy severity and duration of symptoms. We
suggest that future prediction studies use more sensitive and reliable measures to evaluate the
association between various clinical factors and surgical outcome.
This review also provides insight to researchers as to the most important predictors of
outcome; these should be kept in mind before designing and conducting future prognostic or
therapeutic studies. In addition, when evaluating the predictive value of a particular clinical or
imaging factor, it is important to control for duration of symptoms and baseline severity score.
Furthermore, analyses should also consider age as a potential confounder and adjust
accordingly.
The limitations of this review include 1) we did not separate studies based on length of
follow-up; 2) articles that dichotomized a predictor might have done it differently; and 3) some
of the articles with relevant abstracts or titles were excluded because they were not available
or in another language other than English. The results from this review should encourage
further exploration in this area. Even though many studies have examined important predictors
of surgical outcome in CSM, there still remains a lack of evidence in the form of high quality,
prospective studies using validated outcome measures. A large prospective analysis is required
to reemphasize the predictive value of duration of symptoms and baseline severity score, to
settle the controversy surrounding age and to evaluate the predictive value of smoking status,
signs, symptoms and co-morbidities.
3.3.8 Evidence-Based Clinical Recommendations
Recommendation #1: Duration of symptoms and preoperative myelopathy severity are
significant predictors of surgical outcome as longstanding and chronic compression of the spinal

72
cord can lead to irreversible histological damage. We recommend that these patients are
diagnosed accurately and in a timely fashion and referred early for surgical consultation.
Strength of statement: Moderate
Consensus statement #1: It is unclear whether age is a significant predictor of surgical
outcome. We therefore suggest that surgeons do not discriminate on the basis of chronological
age but instead consider a patient’s physiological age and co-existing co-morbidities.
Consensus Statement #2: We suggest that future prediction studies use more sensitive
outcome measures to evaluate changes in functional status and quality of life.
3.4 Results Part B: Important Imaging Predictors of Surgical Outcome
3.4.1 Study Selection
The electronic search yielded a total of 175 citations. An additional nine citations were
found through a bibliography search. After initial review of abstracts and titles, 137 did not
meet inclusion criteria and were excluded. Of the remaining 47 studies, 31 were excluded due
to small sample sizes or a lack of a multivariate analysis. A total of 17 studies were deemed
relevant following this rigorous review process. (Figure 3-2).
Figure 3-2. Search Strategy and Detailed Review Process for Systematic Review B

73
3.4.2 Study Characteristics
A total of 17 cohort studies (3 prospective, 15 retrospective) met our inclusion criteria.
Sample sizes ranged from 50 to 197 patients, with mean ages between 44 to 65 years. Average
follow-up varied widely (3 months to 8 years). All studies investigated preoperative SI change
on MRI as a predictor and seven studies evaluated the predictive value of anatomic
characteristics. Various outcome measures were used across the studies, with JOA recovery
rate reported most consistently, followed by the Nurick grade. All studies controlled for age and
the majority also controlled for symptom duration and disease severity (Table 3-13).
This review analyzed the predictive value of both anatomic features and spinal cord
properties. The anatomic characteristics considered were cervical curvature, transverse area at
level of maximum compression, spinal canal diameter, number of compressed segments and
rate of cord flattening (Figure 3-3). Cord properties assessed included high SI on T2WI, low SI on
T1WI, combined T1/T2 signal change, SI ratio, number of SI segments and length on T2WI
(Figure 3-4).
3.4.3 Risk of Bias
We critically appraised 17 studies that conducted a multivariate analysis and controlled
for two of the following three covariates: age, duration of symptoms and baseline severity
score. Of these, four were classified as level II and 13 were rated level III. Most studies were
level III evidence because they were retrospective cohort studies with unreported follow-up
rates or follow-up rates <80%. The three prospective studies did not have a complete follow-up
and were down-graded from level I to level II evidence. In each study, patients were at similar
points in the course of their disease or treatment and were followed long enough for outcomes
to occur. In addition, all analyses accounted for other prognostic factors.

74
Figure 3-3. Summary Figure of Anatomic MRI Characteristics i) green outline is the transverse area of the cord, A is the transverse diameter or width of the
cord and B is the anterioposterior axis or sagittal diameter of the cord; ii) normal cervical
curvature; iii) abnormal cervical curvature where the bodies of vertebrae C3 to C6 cross the line
drawn from the dorsocaudal aspect of C2 to the dorsocaudal aspect of C7; iv) multilevel disc
herniation and spondylosis; v) canal diameter at normal and stenotic levels.
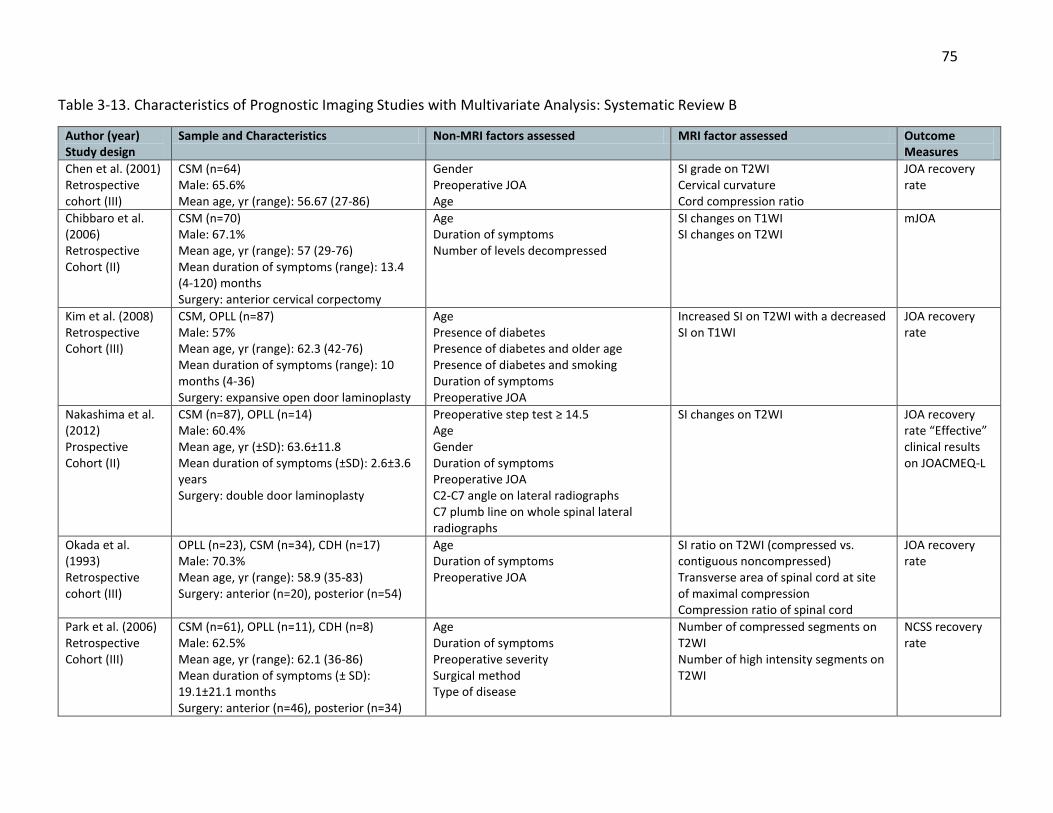
75
Table 3-13. Characteristics of Prognostic Imaging Studies with Multivariate Analysis: Systematic Review B
Author (year) Study design
Sample and Characteristics Non-MRI factors assessed MRI factor assessed Outcome Measures
Chen et al. (2001) Retrospective cohort (III)
CSM (n=64) Male: 65.6% Mean age, yr (range): 56.67 (27-86)
Gender Preoperative JOA Age
SI grade on T2WI Cervical curvature Cord compression ratio
JOA recovery rate
Chibbaro et al. (2006) Retrospective Cohort (II)
CSM (n=70) Male: 67.1% Mean age, yr (range): 57 (29-76) Mean duration of symptoms (range): 13.4 (4-120) months Surgery: anterior cervical corpectomy
Age Duration of symptoms Number of levels decompressed
SI changes on T1WI SI changes on T2WI
mJOA
Kim et al. (2008) Retrospective Cohort (III)
CSM, OPLL (n=87) Male: 57% Mean age, yr (range): 62.3 (42-76) Mean duration of symptoms (range): 10 months (4-36) Surgery: expansive open door laminoplasty
Age Presence of diabetes Presence of diabetes and older age Presence of diabetes and smoking Duration of symptoms Preoperative JOA
Increased SI on T2WI with a decreased SI on T1WI
JOA recovery rate
Nakashima et al. (2012) Prospective Cohort (II)
CSM (n=87), OPLL (n=14) Male: 60.4% Mean age, yr (±SD): 63.6±11.8 Mean duration of symptoms (±SD): 2.6±3.6 years Surgery: double door laminoplasty
Preoperative step test ≥ 14.5 Age Gender Duration of symptoms Preoperative JOA C2-C7 angle on lateral radiographs C7 plumb line on whole spinal lateral radiographs
SI changes on T2WI JOA recovery rate “Effective” clinical results on JOACMEQ-L
Okada et al. (1993) Retrospective cohort (III)
OPLL (n=23), CSM (n=34), CDH (n=17) Male: 70.3% Mean age, yr (range): 58.9 (35-83) Surgery: anterior (n=20), posterior (n=54)
Age Duration of symptoms Preoperative JOA
SI ratio on T2WI (compressed vs. contiguous noncompressed) Transverse area of spinal cord at site of maximal compression Compression ratio of spinal cord
JOA recovery rate
Park et al. (2006) Retrospective Cohort (III)
CSM (n=61), OPLL (n=11), CDH (n=8) Male: 62.5% Mean age, yr (range): 62.1 (36-86) Mean duration of symptoms (± SD): 19.1±21.1 months Surgery: anterior (n=46), posterior (n=34)
Age Duration of symptoms Preoperative severity Surgical method Type of disease
Number of compressed segments on T2WI Number of high intensity segments on T2WI
NCSS recovery rate
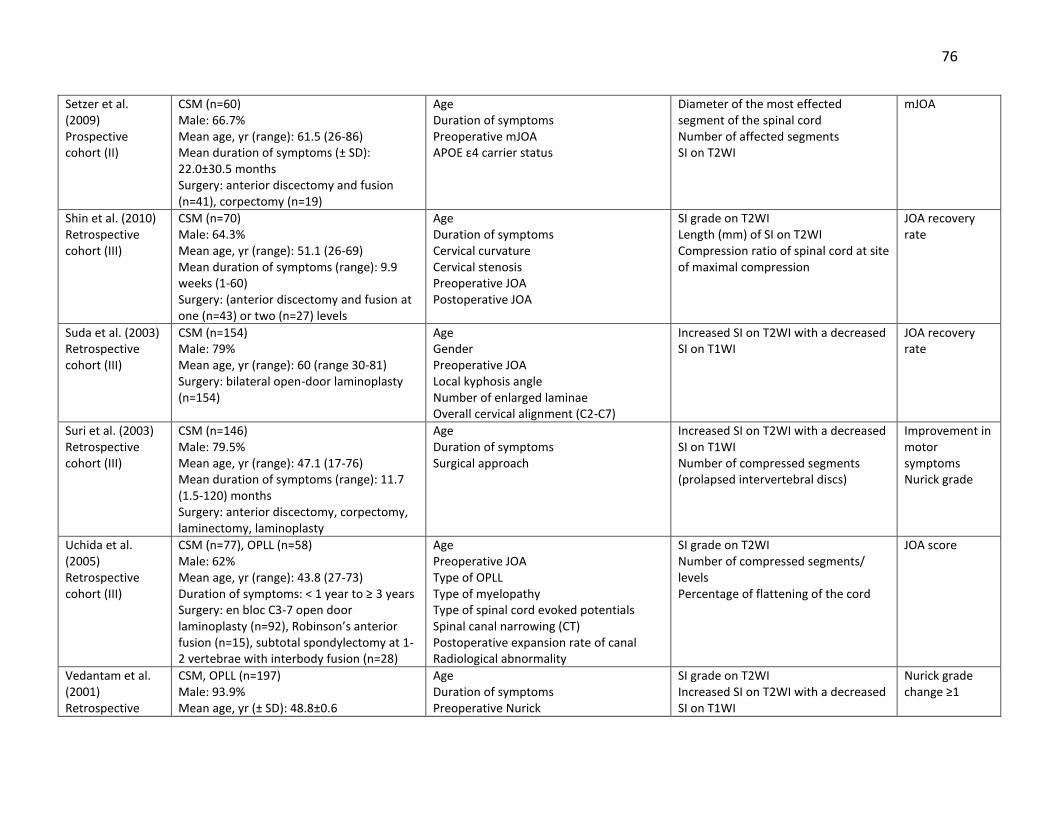
76
Setzer et al. (2009) Prospective cohort (II)
CSM (n=60) Male: 66.7% Mean age, yr (range): 61.5 (26-86) Mean duration of symptoms (± SD): 22.0±30.5 months Surgery: anterior discectomy and fusion (n=41), corpectomy (n=19)
Age Duration of symptoms Preoperative mJOA APOE ε4 carrier status
Diameter of the most effected segment of the spinal cord Number of affected segments SI on T2WI
mJOA
Shin et al. (2010) Retrospective cohort (III)
CSM (n=70) Male: 64.3% Mean age, yr (range): 51.1 (26-69) Mean duration of symptoms (range): 9.9 weeks (1-60) Surgery: (anterior discectomy and fusion at one (n=43) or two (n=27) levels
Age Duration of symptoms Cervical curvature Cervical stenosis Preoperative JOA Postoperative JOA
SI grade on T2WI Length (mm) of SI on T2WI Compression ratio of spinal cord at site of maximal compression
JOA recovery rate
Suda et al. (2003) Retrospective cohort (III)
CSM (n=154) Male: 79% Mean age, yr (range): 60 (range 30-81) Surgery: bilateral open-door laminoplasty (n=154)
Age Gender Preoperative JOA Local kyphosis angle Number of enlarged laminae Overall cervical alignment (C2-C7)
Increased SI on T2WI with a decreased SI on T1WI
JOA recovery rate
Suri et al. (2003) Retrospective cohort (III)
CSM (n=146) Male: 79.5% Mean age, yr (range): 47.1 (17-76) Mean duration of symptoms (range): 11.7 (1.5-120) months Surgery: anterior discectomy, corpectomy, laminectomy, laminoplasty
Age Duration of symptoms Surgical approach
Increased SI on T2WI with a decreased SI on T1WI Number of compressed segments (prolapsed intervertebral discs)
Improvement in motor symptoms Nurick grade
Uchida et al. (2005) Retrospective cohort (III)
CSM (n=77), OPLL (n=58) Male: 62% Mean age, yr (range): 43.8 (27-73) Duration of symptoms: < 1 year to ≥ 3 years Surgery: en bloc C3-7 open door laminoplasty (n=92), Robinson’s anterior fusion (n=15), subtotal spondylectomy at 1-2 vertebrae with interbody fusion (n=28)
Age Preoperative JOA Type of OPLL Type of myelopathy Type of spinal cord evoked potentials Spinal canal narrowing (CT) Postoperative expansion rate of canal Radiological abnormality
SI grade on T2WI Number of compressed segments/ levels Percentage of flattening of the cord
JOA score
Vedantam et al. (2001) Retrospective
CSM, OPLL (n=197) Male: 93.9% Mean age, yr (± SD): 48.8±0.6
Age Duration of symptoms Preoperative Nurick
SI grade on T2WI Increased SI on T2WI with a decreased SI on T1WI
Nurick grade change ≥1

77
Cohort (III) Mean duration of symptoms (range): 8 months (1-180) Surgery: central corpectomy at 1-level (n=99), 2-levels (n=92), and 3-levels (n=6)
Cure: Nurick f/u grade of 0 or 1
Wada et al. (1999) Retrospective cohort (III)
CSM (n=50) Male: 72% Mean age, yr (±SD): 61.0±10.9 (range, 45-81) Mean duration of symptoms (±SD): 9.1±8.5 months (range, 1-36) Surgery: open-door laminoplasty
Age Duration of symptoms Preoperative JOA AP canal diameter at maximal compression on plain radiographs Transverse area of spinal cord at maximal compression on CT myelography Number of blocks on myelogram
Number of high SI segments on T2WI JOA recovery rate
Wang et al. (2010) Retrospective cohort (III)
OPLL (n=58) Male: 71% Mean age, yr (range): 59.6 (47-77) Surgery: expansive open-door laminoplasty
Age Duration of symptoms Preoperative JOA Babinski sign Ankle clonus
SI ratio on T2WI (compressed vs. non-compressed C7-T1 levels)
JOA recovery rate JOA score
Yamazaki et al. (2003) Retrospective cohort (III)
CSM, OPLL (n=64) Male: 51.6% Mean age, yr (± SD): 64.6±12.0 Mean duration of symptoms (± SD): 25.6±30.6 months Surgery: laminoplasty
Age Duration of symptoms Preoperative JOA Canal diameter on CT myelogram Transverse area on CT myelogram
SI changes on T2WI JOA recovery rate
Zhang et al. (2011) Prospective cohort (II)
CSM (n=52) Male: 57.7% Mean age, yr (range): 56.3 (45-67) Mean duration of symptoms (range): 16.1 months (3–34) Surgery: anterior (n=31), posterior (n=16), anteroposterior (n=5)
Age Duration of symptoms
SI ratio on T2/T1-WI JOA recovery rate JOA score
Zhang et al. (2010) Retrospective cohort (III)
CSM (n=73) Male: 67.1% Mean age, yr (range) : 53.3 (34–77) Surgery: anterior, posterior, anteroposterior
Age Duration of symptoms Babinski sign
SI ratio on T2WI (compressed vs. non-compressed C7-T1 levels)
JOA recovery rate JOA score
Level of evidence of each study is given in the first column. CSM: cervical spondylotic myelopathy; (m)JOA: (modified) Japanese Orthopaedic Association; SI: signal intensity;
WI: weighted image; OPLL: ossification of the posterior longitudinal ligament; CDH: cervical disc herniation: JOACMEQ: Japanese Orthopaedic Association Cervical
Myelopathy Evaluation Questionnaire (lower limb); NCSS: neurosurgical cervical spine scale; SD: standard deviation; AP: anteroposterior; CT: computed tomography
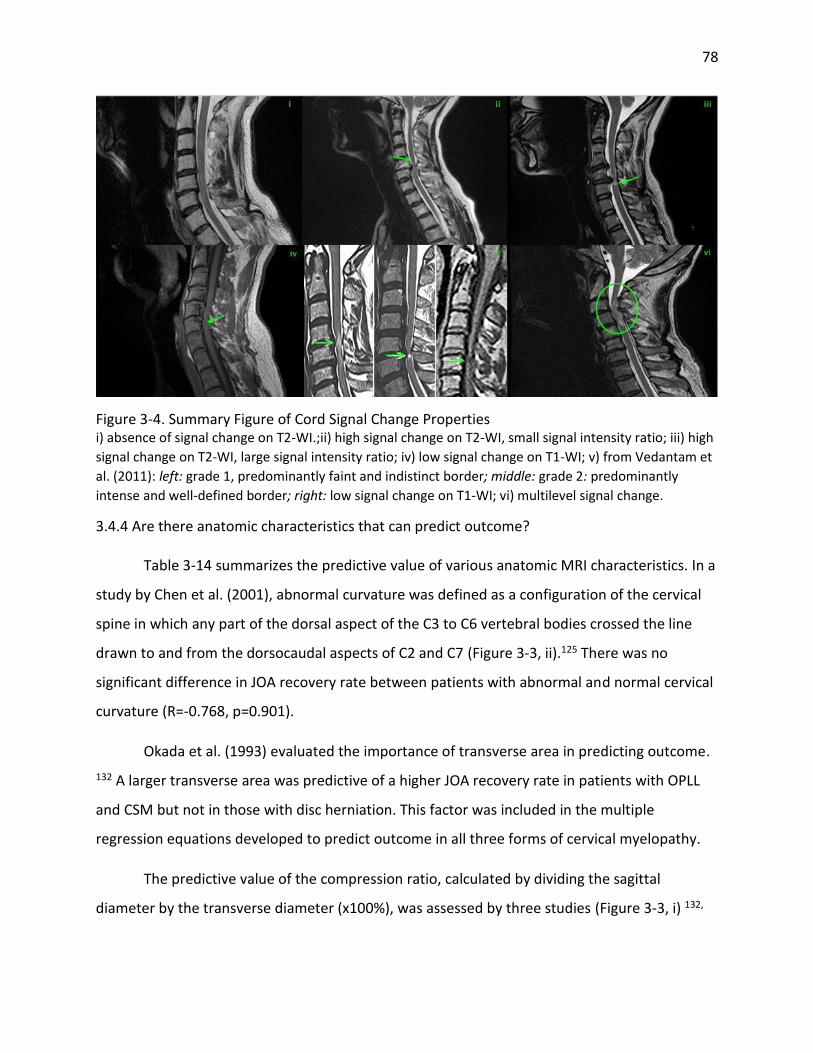
78
Figure 3-4. Summary Figure of Cord Signal Change Properties i) absence of signal change on T2-WI.;ii) high signal change on T2-WI, small signal intensity ratio; iii) high
signal change on T2-WI, large signal intensity ratio; iv) low signal change on T1-WI; v) from Vedantam et
al. (2011): left: grade 1, predominantly faint and indistinct border; middle: grade 2: predominantly
intense and well-defined border; right: low signal change on T1-WI; vi) multilevel signal change.
3.4.4 Are there anatomic characteristics that can predict outcome?
Table 3-14 summarizes the predictive value of various anatomic MRI characteristics. In a
study by Chen et al. (2001), abnormal curvature was defined as a configuration of the cervical
spine in which any part of the dorsal aspect of the C3 to C6 vertebral bodies crossed the line
drawn to and from the dorsocaudal aspects of C2 and C7 (Figure 3-3, ii).125 There was no
significant difference in JOA recovery rate between patients with abnormal and normal cervical
curvature (R=-0.768, p=0.901).
Okada et al. (1993) evaluated the importance of transverse area in predicting outcome.
132 A larger transverse area was predictive of a higher JOA recovery rate in patients with OPLL
and CSM but not in those with disc herniation. This factor was included in the multiple
regression equations developed to predict outcome in all three forms of cervical myelopathy.
The predictive value of the compression ratio, calculated by dividing the sagittal
diameter by the transverse diameter (x100%), was assessed by three studies (Figure 3-3, i) 132,

79
133, 212. All studies reported a non-significant association between cord compression ratio and
recovery rate.
The diameter of the spinal canal was assessed as a predictive factor by a single
prospective study.219 Multivariate logistic analysis yielded a non-significant association between
diameter and final mJOA.
The greatest number of studies (n=4) evaluated the relationship between number of
compressed segments and JOA recovery rate139, NCSS recovery rate220, mJOA score219, Nurick
grade or improvement of motor, sensory and autonomic symptoms143. In the study by Park et
al. (2006), correlation analysis revealed no significant association between NCSS recovery rate
and number of compressed segments (R=-0.0427, p=0.7259).145 Setzer et al. (2009) observed no
differences in the number of affected segments between an “unchanged,” “improvement” and
“deterioration” group.221 Multivariate analysis, conducted by Uchida et al. (2005), however,
demonstrated that outcome in spondylotic patients undergoing either laminoplasty (n=45)
(p=0.0084) or anterior surgery (n=32) (p=0.0293) was significantly impacted by involvement of
≥3 intervertebral levels. 139 Poor outcome in patients with OPLL, on the other hand, was highly
associated with two-vertebra involvement in anterior surgery (p=0.0388) and laminoplasty
(p=0.0076) and with ≥3 vertebra in laminoplasty (p=0.0029). Finally, Suri et al. (2003) reported a
non-significant association between the number of prolapsed intervertebral discs (PIVD) and
motor, sensory or autonomic outcome.143 In terms of disability outcome, evaluated by Nurick
grade, however, patients with single (p<0.001, OR: 2.91, 95%CI: 0.7-10.4) or two-level (p<0.001,
OR: 2.61, 95%CI 0.4-8.9)) involvement had better outcome than patients with multilevel PIVD.
The predictive value of cord flattening rate was examined by a single study.139 This rate
is calculated by dividing the anteroposterior axis of the spinal cord by the spinal cord width
(x100%). A rate of flattening <50% was significantly associated with a worse JOA recovery rate
following anterior surgery and laminoplasty in patients with spondylosis (p=0.0381, p=0.0116).
In patients with OPLL, a flattening rate ≥50% was predictive of a better outcome in both surgical
groups (p=0.0457, p=0.0298).

80
Table 3-14. Association of Anatomic MRI Characteristics with Surgical Outcomes
MRI Characteristic Outcome Author (year) Controlled for Associated with Outcome? Age Duration Severity
Abnormal cervical curvature†
JOA recovery rate
Chen (2001) Yes No Yes No
Larger transverse area of cord at level of maximum compression
JOA recovery rate
Okada (1993) Yes Yes Yes Positively
Larger compression ratio at level of maximum compression§
JOA recovery rate
Chen (2001) Okada (1993) Shin (2010)
Yes No Yes
No No Yes
Yes No Yes
No No No
Diameter of the spinal canal
mJOA score Setzer (2009) Yes Yes Yes No
Greater number of compressed segments**
NCSS recovery rate
Park (2006) Yes Yes Yes No
JOA recovery rate
Uchida (2005) Yes Yes Yes Negatively
mJOA score Setzer (2009) Yes Yes Yes No
Nurick grade Suri (2003) Yes Yes No Negatively
Improvement in motor symptoms††
Suri (2003) Yes Yes No No
Higher rate of flattening of cord (less AP compression)‡‡
JOA recovery rate
Uchida (2005) Yes Yes Yes Positively
(m)JOA: (modified) Japanese Orthopedic Association; NR: not reported †Measured with Batzdorf and Batzdorff method. Abnormal cervical curvature is a configuration of the cervical spine in which any part of the dorsal aspect of any of the vertebral bodies C3 through C6 crosses the C2 through C7 line. §Measured using the following equation: (sagittal diameter)/(transverse diameter) X 100 (%). **Defined as the number of segments where the spinal cord was deformed with disappearance of the surrounding subarachnoid space in one study (Park 2006); the number of prolapsed intervertebral discs (PIVDs) in a second study (Suri 2003); and not reported in the other two (Uchida 2005, Setzer 2009). ††To include weakness, spasticity, wasting, flexor spasms, and fasciculations. ‡‡Measured using the following equation: (anteroposterior axis of the spinal cord)/(spinal cord width) X 100 (%).
3.4.5 Are there cord properties that can predict outcome?
There were more studies that analyzed important MRI SI characteristics than anatomic
properties (Table 3-15). Six studies considered the prognostic value of high SI changes on T2WI.
134, 136, 143, 219, 222, 223 Chibbaro et al. (2006) and Setzer et al. (2009) evaluated the relationship
between presence of a hyperintense signal on T2WI and postoperative mJOA score.136, 219
Setzer et al. (2009) found no significant differences in T2WI SI between the “unchanged,”
“improvement,” and “deterioration” groups. Chibbaro et al. (2006), on the other hand,
concluded that a high SI on a T2WI was significantly correlated with a higher postoperative

81
mJOA (p<0.01). Three studies examined the association between T2WI SI changes and JOA
recovery rate.134, 222, 223 In a study by Yamazaki et al. (2003), T2WI SI changes were not
significantly different between the “excellent” or “fair” recovery groups in the younger
(p=0.848) or elderly population (p=0.051). Both Wada et al. (1999) and Nakashima et al. (2012)
confirmed this non-significant relationship between T2WI SI and outcome using multivariate
analysis.134, 223 Nakashima et al. (2012) also considered the effect of T2WI SI change on a second
outcome measure, JOACMEQ-l. Neither univariate (OR: 0.5, CI: 0.19-1.33, p=0.164) or
multivariate (OR: 0.39, CI: 0.13-1.18, p=0.98) analysis yielded a significant association. Finally, in
a study by Suri et al. (2003), there was no significant difference in motor (OR: 1.26, 0.82-9.81,
p=NS), sensory, autonomic or disability outcome (OR: 0.79, CI: 1.79-7.61, p=NS) in patients with
T2WI SI change and those without.143
The predictive value of high SI grade on T2WI was also examined by four studies. 133, 139,
212, 224 A grade of 0 was defined as no intramedullary high SI, grade 1 as a signal change with a
predominantly faint and indistinct border and grade 2 as a signal change with a predominantly
intense and well-defined border. Uchida et al. (2005) also included a fourth grade in their
definition: cystic formation. In a study by Chen et al. (2001), patients with grade 2 had the
worst surgical outcome (p<0.001, R=-33.302) and no significant difference in prognosis was
detected between grades 0 and 1. The study by Shin et al. (2010) reported a statistically
significant difference in recovery rate among these three signal change groups (p=0.002).
Vedantam et al. (2001) determined that the presence of grade 2 signal change was associated
with a decreased probability of a cure (Nurick grade of 0 or 1, OR: 0.48, CI: 0.2-0.9, p=0.04).
Grade 1 signal, on the other hand, was not predictive of either improvement in Nurick (OR: 0.7,
CI: 0.3-1.5, p=0.41) or a cure (OR: 1.4, CI: 0.7-2.7, p=0.23). Uchida et al. (2005) did not find any
relationship between SI grade and postoperative JOA score in patients with spondylosis or
OPLL.
Low SI change on a T1WI was evaluated as a predictive factor by Chibbaro et al. (2006).
136 This study reported that patients with a low SI change on a T1WI had a lower postoperative
mJOA (p<0.05).

82
Four studies further examined the predictive value of SI characteristics by exploring
combined T1/T2 signal change.143, 224-226 Kim et al. (2008) identified this predictor as an
important risk factor for poor outcome on the JOA using both univariate (OR: 3.02, CI: 1.56-
5.32) and multivariate (OR: 2.53, CI: 1.67-5.95) logistic regression analysis.225 Suda et al. (2003)
also identified combined T1/T2 signal change as a risk factor for poor outcome, defined as a
JOA recovery rate <50% (univariate: OR: 3.25, CI: 1.34-7.91, p<0.01; multivariate: OR: 4.10, CI:
1.51-11.12, p<0.01).226 Suri et al. (2003) reported that patients without SI changes had a
significantly better motor improvement than patients with a combined T1/T2 SI (OR: 5.1, CI:
1.87-25.1, p<0.001). This was not the case when assessing disability outcome using
improvements in Nurick grade. When examining predictors of a Nurick grade of 0 or 1,
however, patients with T1/T2 SI had a lower probability of achieving this “cure.”224
Okada et al. (1993), Wang et al. (2010) and Zhang et al. (2010, 2011) explored the
predictive value of signal change ratio on surgical outcome.132, 227-229 Okada et al. (1993)
developed a SI ratio by dividing the SI at the site of maximal compression on a T2WI by readings
at adjacent noncompressed sites.132 JOA recovery rate was highly correlated with SI ratio in the
OPLL (r=0.53) and CSM (r=0.426) groups and was included in the final multiple regression
equation for all three degenerative diseases. Wang et al. (2010) and Zhang et al. (2010), on the
other hand, compared T2WI SI at sites of compression with SI at the C7-T1 levels. In both
studies, patients were divided into groups according to their SI ratio: group 1, low SI ratio;
group 2, middle SI ratio; and group 3, high SI ratio.228 Recovery rates in group 1, group 2 and
group 3 were significantly different (p<0.0001).
Table 3-15. Association of MRI Signal Intensity Characteristics with Surgical Outcomes
MRI Characteristic Outcome Author (year) Controlled for Associated with Outcome? Age Duration Severity
High SI grade on T2WI†
JOA recovery rate
Chen (2001) Shin (2010)
Yes Yes
No Yes
No Yes
Negatively Negatively
JOA score Uchida (2005) Yes No Yes No
Nurick grade change ≥ 1
Vendantam (2001)
Yes Yes Yes No
Nurick grade 0 or 1
Vendantam (2001)
Yes Yes Yes Negatively
High SI changes on T2WI
mJOA score Chibbaro (2006) Setzer (2009)
Yes Yes
Yes Yes
No Yes
Positively No

83
JOA recovery rate
Nakashima (2012) Yamazaki (2003) Wada (1999)
Yes Yes Yes
Yes Yes Yes
Yes Yes Yes
No No No
“Effective” clinical results on JOACMEQ-L§
Nakashima (2012) Yes Yes Yes No
Improvement in motor symptoms**
Suri (2003) Yes Yes No No
Nurick grade Suri (2003) Yes Yes No No
Low SI changes on T1WI
mJOA score Chibbaro (2006) Yes Yes No Negatively
High SI changes on T2WI + low SI changes on T1WI
JOA recovery rate
Kim (2008) Suda (2003)
Yes Yes
Yes No
Yes Yes
Negatively Negatively
Improvement in motor symptoms**
Suri (2003) Yes Yes No Negatively
Nurick grade Suri (2003) Yes Yes No No
Nurick grade 0 or 1
Vendantam (2001)
Yes Yes Yes Negatively
High SI ratio on T2WI (compressed vs. contiguous noncompressed levels)
JOA recovery rate
Okada (1993) Yes Yes Yes Positively
High SI ratio on T2WI (compressed vs. noncompressed C7-T1 levels)
JOA recovery rate
Wang (2010) Zhang (2010)
Yes Yes
Yes Yes
Yes No
Negatively Negatively
High SI ratio on T2/T1WI††
JOA recovery rate
Zhang (2011) Yes Yes No Negatively
Greater number of high SI segments on T2WI
NCSS recovery rate
Park (2006) Yes Yes Yes Negatively
JOA recovery rate
Wada (1999) Yes Yes Yes Negatively
Longer length of signal intensity on T2WI (mm)
JOA recovery rate
Shin (2010) Yes Yes Yes No
(m)JOA: (modified) Japanese Orthopedic Association; JOACMEQ-L: JOA Cervical Myelopathy Evaluation Questionnaire
(lower limb); NCSS: neurosurgical cervical spine scale; NR: not reported; SI: signal intensity; WI: weighted image.
†Grade 0 = no intramedullary high SI on T2-weighted MRI; Grade 1 = predominantly faint and indistinct border; Grade
2 = predominantly intense and well-defined border. For Uchida 2005 only, a fourth grade was considered: cystic
formation.
§Either condition met: 1) postoperative score higher than the preoperative score by ≥ 20 points or, 2) preoperative
score < 90, and postoperative score ≥ 90 points).
**To include weakness, spasticity, wasting, flexor spasms, and fasciculations.
††Ratio of the signal intensity on T2-weighted to T1-weighted MRI (T2:T1 ratio) at the same spinal cord level and of
similar area.

84
SI ratio was identified as an important predictor of outcome and was included in the
final regression equations in both studies. Finally, Zhang et al. (2011) analyzed the prognostic
value of SI ratio by comparing the SI on T2WI to the SI on T1WI at the same spinal cord level
and over a similar area.229 Patients were split into two groups based on the median T2:T1 ratio:
group 1 (1.18-1.74, n=18) and group 2 (1.79-2.77, n=18). There was a significant difference
between these two groups with respect to the recovery rate (32.6±14.4 versus 21.9±8.3,
p<0.001) and postoperative JOA score (12.3±1.6 versus 10.8±1.5, p<0.001). T2:T1 ratio was also
included in the final regression equation.
The length of the SI on a T2WI was assessed by a single study.133 This variable was not
identified as a significant predictive factor (p=0.0961) of JOA recovery rate.
Park et al. (2006) reported that number of high intensity segments was negatively
correlated with recovery rate (R=-0.289, p=0.0063) and included it in the multivariate
regression model.145 Wada et al. (1999) confirmed this finding by observing that patients in a
“focal” disease group had a better recovery rate and postoperative JOA score (56.1±22.2%,
14.3±1.0) compared to patients in a “multi-segmental” group (38.8±14.7%, 12.6±18)
(p<0.01).134
3.4.6 Evidence Summary
There is insufficient evidence that MRI anatomic characteristics, including cervical
curvature, transverse area, number of compressed segments and flattening rate can predict
surgical outcome. Compression ratio and diameter of the canal were not associated with
surgical outcome (low evidence). Low evidence suggests that high SI on T2WI is not an
important predictive factor. A combined T1/T2 signal change, SI ratio and a greater number of
SI segments on T2WI were negatively associated with outcome. The strength of evidence for
these findings was low. Conclusions could not be drawn on the predictive value of SI grade on
T2WI, low SI changes on T1WI and length of SI on T2WI (Table 3-16).

85
Table 3-16. Evaluation of Overall Body of Evidence using GRADE: Systematic Review B
Baseline quality: HIGH = majority of articles are Level I/II. LOW = majority of articles are Level III/IV.
UPGRADE: Large magnitude of effect (1 or 2 levels); dose response gradient (1 level); plausible confounding decreases magnitude of effect (1 level)
DOWNGRADE: Inconsistency of results (1 or 2 levels); indirectness of evidence (1 or 2 levels); imprecision of effect estimates (1 or 2 levels); risk of bias (1 or 2 levels);
failure to specify subgroup analysis a priori (1 level); reporting bias (1 level)
Strength of
evidence
Conclusions/Comments Baseline UPGRADE
(levels)
DOWN-GRADE
(levels)
Are there characteristics of the MRI that predict post-surgical patient outcome?
MRI signal intensity characteristics
High SI changes on T2WI + low SI changes on T1WI
High SI ratio on T2WI (compressed vs. non-compressed C7-T1)
High SI ratio on T2/T1WI Greater number of high SI
segments on T2WI
LOW Associated with poorer outcomes: As reported by eight studies, high SI changes on T2WI combined with low SI changes on T1WI (4 retrospective cohorts), high SI ratio (compressed vs. non-compressed C7-T1) on T2WI (2 retrospective cohorts), high SI ratio on T2/T1WI (1 prospective cohort), and a greater number of high SI segments on T2WI (2 retrospective cohorts) were all associated with poorer neurological outcomes following surgery.
LOW
High SI changes on T2WI LOW No association: Five (2 prospective, 3 retrospective) out of six studies found no association between high SI changes on T2WI and various neurological outcomes.
LOW
High SI grade on T2WI Low SI changes on T1WI High SI ratio on T2WI
(compressed vs. contiguous non-compressed levels)
Longer length of signal intensity on T2WI (mm)
INSUFFICIENT There is insufficient evidence in the short- and long-term that high SI grade on T2WI (3 retrospective cohorts), low SI changes on T1WI (1 retrospective cohort), high SI ratio (compressed vs. contiguous non-compressed levels) on T2WI (1 retrospective cohort), or longer signal intensity length on T2WI (1 retrospective cohort) predict postoperative neurological outcomes.
LOW Imprecise (-1)
and/or
Consistency (-1)

86
Anatomic MRI characteristics
Larger compression ratio at level of maximum cord compression
Diameter of the spinal canal
LOW No association: Four studies found no association between a larger compression ratio at the level of maximum cord compression (3 retrospective studies) or the diameter of the spinal canal (1 prospective cohort) and neurological outcome following surgery.
LOW
Abnormal cervical curvature
Larger transverse area of cord at level of maximum compression
Greater number of compressed segments
Higher rate of flattening of cord (less AP compression)
INSUFFICIENT There is insufficient evidence in the short- and long-term that abnormal cervical curvature (1 retrospective cohort), larger transverse area of the spinal cord at the level of maximum compression (1 retrospective cohort), a greater number of compressed segments (1 prospective, 3 retrospective), or a higher rate of flattening of the cord (1 retrospective cohort) predict postoperative neurological outcome.
LOW Imprecise (-1)
and/or
Consistency (-1)
WI: weighted image; SI: signal intensity; AP: anteroposterior

87
3.4.7 Discussion
Magnetic resonance imaging is a non-invasive technique routinely used to confirm the
diagnosis of CSM, evaluate cord compression due to canal stenosis and identify any
intramedullary signal changes.33, 34 It is also a valuable tool to exclude differential diagnoses as
it can visualize parenchymal abnormalities including neoplasms, demyelinating plaques and
syringomyelia.32 It should be noted that patients with metallic foreign body in their eye,
aneurysm clips, embedded wires, stimulators or batteries, nitroglycerin patches, pacemakers or
severe claustrophobia cannot be examined by MRI. CT myelography is the preferred alternative
diagnostic modality for patients with contraindications to MRI.230
The objective of this systematic review was to determine the predictive value of MRI.
There is controversy in the literature surrounding the ability of MRI to predict surgical outcome
and whether anatomical dimensions or cord properties are more significant.
A high SI on T2WI reflects a broad spectrum of compressive pathologies and a wide
range of recuperative potentials.143, 224, 227, 229, 231 T2WI SI is non-specific and may indicate either
reversible damage, including edema and ischemia or irreversible changes similar to T1WI SI,
such as necrosis, myelomalacia and cavitation.134, 143, 220, 224, 227, 231, 232 If the SI reflects more
minor pathological changes that will likely diminish post-surgery, then it is not an important
prognostic factor. Chen et al. (2001) and Vedantam et al. (2011) recognized the need to
separate T2 signal changes into grades: type 1 or “faint, fuzzy, indistinct borders” is more
representative of reversible changes whereas type 2 or “intense, well-defined borders” signifies
irreversible histological damage.212, 224 These definitions were based on a histopathologic spinal
cord study that reported that severe changes (microcavitation, spongiform changes and
necrosis) have a higher water content, resulting in more intense borders. Milder histological
damage, such as edema, demyelination and wallerian degeneration, on the other hand,
produce fainter borders. Both studies demonstrated improvements in SI in type 1 following
surgery, confirming that milder signal changes are reversible. Grading of the T2WI SI allows for
an assessment of the amount of irreversible damage. Unfortunately, there is no standard
method of classifying these changes or an approach to quantify the degree of signal change.

88
Based on this review, patients with a greater number of high SI segments on T2WI had a
poor prognosis. The recovery rate of patients with focal SI did not differ from those without
SI.229, 231 Patients with multisegmental involvement, however, had a recovery rate similar to
patients with a T1-signal change and a worse recovery rate than the focal group. Wada et al.
(1999) also noted a correlation between multisegmental areas on T2WI and low SI on T1WI.134
Histologically, a greater number of signal change segments reflects more severe and
irreversible damage than a focal signal change.134, 143
Although less prevalent, combined T1/T2 signal change was an important predictor of
outcome. This type of SI is indicative of severe histological damage including cystic necrosis,
secondary syrinx and cavitation.134, 143, 220, 224, 229 Signal intensity at the site of compression as
well as at unaffected levels, however, differs from patient to patient. Three studies addressed
this issue by creating a ratio comparing SI at compressed and non-compressed sites or by
comparing SI on T2WI and T1WI.227-229 Signal intensity ratio was found to be an important
predictor.
It is clear from this review that there is a lack of evidence in the form of high-quality
prospective studies using validated outcome measures. Other studies have neglected to control
for important confounders when assessing the relationship between predictor and outcome. It
is also important to note that the definitions of CSM varied from study to study: 8 studies
enrolled only patients with CSM; 5 studies included patients with OPLL or CSM; 2 studies
specified cervical myelopathy as the diagnosis and did not provide further explanation; 1 study
explored only patients with OPLL; and 1 study separately examined patients with OPLL, CSM
and disc herniation. In addition, approximately 40% of the studies were conducted in Japan,
where the prevalence of OPLL is higher than in Western populations. Some of these studies
may be considered flawed due to a heterogeneous patient population.
Unfortunately, the scaling of signal intensity changes has not been universally quantified
or agreed upon. From the studies that have assessed high SI on T2WI, it is evident that the type
of methodology impacted the ability to establish a relationship to outcome. Though T2WI SI
changes may not relate to prognosis when measured simply for presence/absence, or

89
subjectively as has been done by previous authors,139, 212 more modern and objective
approaches which have stratified signal intensity into grades or ratios have been effective in
predicting outcome. Accordingly, further research, in the form of prospective studies with
larger patient groups are necessary to conclusively determine the role of T2WI SI changes. No
further systematic reviews should be conducted until a reliable and valid method to quantify SI
changes is devised.
A major issue is that most of the tools used to evaluate outcome in these studies are too
crude and may not be able to detect all functional improvements, especially in milder patients.
Results often differ depending on the outcome measure; this was the case in our first
systematic review on important clinical factors.215 Traditional measures such as the mJOA and
Nurick score should be used in combination with more sensitive and specific measures,
including the walking test, grip strength and the Berg Balance Scale. The use of a wider range of
functional and impairment tests may help better define the prognostic value of certain MRI
characteristics.
Diffusion Tensor Imaging (DTI) is a relatively new neuroimaging technique based on
magnetic resonance. It assesses the structural integrity of white matter tracts by evaluating
diffusion rates of extracellular water molecules through tissue.233-236 DTI measures two key
parameters: the apparent diffusion coefficient (ADC) and the fractional anisotropy (FA).236
Several studies reported significant differences in these two measurements between a control
and myelopathic group: the FA at the level of compression was significantly lower and the ADC
was significantly higher in the patient group.233-236 This form of imaging appears to be more
sensitive and specific than the MRI and can detect damage to the white matter tracts before a
high signal lesion appears on T2WI.235, 237 For example, in a study by Lee et al. (2011), four
patients who had no abnormal signal changes on the MRI had lower FA values and higher ADC
values.236 Another possible advantage of the DTI is that it may be able to distinguish between a
symptomatic and asymptomatic group of patients.235 In a study by Kerkovsky et al. (2012), the
FA values were significantly lower and the ADC values were significantly higher in a
symptomatic group than in an asymptomatic spondylotic cervical cord encroachment subgroup.

90
With respect to outcome prediction, Jones et al. (2013) and Nakamura et al. (2012)
assessed the correlation between various DTI parameters and post-surgical outcome.238, 239
Jones et al. (2013) reported a significant positive association between baseline FA measures
and outcome evaluated by NDI but not by Nurick or mJOA.238 When stratifying the patient
population based on mJOA scores, the results were slightly different. For patients with a mJOA
score of 8, lower FA values were predictive of a worse outcome: for every 0.1 point increase in
FA, the odds of improving were 1.5 times greater. In a second study by Nakamura et al. (2012),
the fiber tract (FT) ratio, calculated by dividing the number of fibers at the compressed level by
the number of fibers at the C2-level, was correlated with the JOA recovery rate (r=0.6066,
p=0.0046).239 Patients with a FT ratio below 60% typically had a poor recovery rate of less than
40%. Further studies are required to evaluate the prognostic value of DTI.
3.4.8 Evidence-Based Clinical Recommendations
Recommendation #1: T2 signal may be a useful prognostic indicator when used in combination
with low SI change on T1WI, or as a ratio comparing compressed versus non-compressed
segments, or as a ratio of T2 compared with T1. We suggest that if surgeons use MRI signal
intensity to estimate the risk of a poor outcome following surgery, they use high SI change on
T2WI in combination with other signal intensity parameters, and not in isolation.
Strength of statement: Weak
3.5 Results Part C: Important Clinical and Surgical Predictors of Complications
3.5.1 Study Selection
The search yielded a total of 5472 citations. After initial review of abstracts and titles,
5259 studies did not meet our inclusion criteria. Following full text investigation, an additional
153 studies were excluded because 1) not all patients were diagnosed with degenerative
cervical myelopathy; 2) p-values were not provided for analyses; and/or 3) a statistical test was
not used to compare complication rates or demographic differences between two groups. A
total of 60 studies were deemed relevant following this rigorous review process (Figure 3-5).

91
Figure 3-5. Search Strategy and Detailed Review Process for Systematic Review C
3.5.2 Study Characteristics
For KQ1, we identified 36 prognostic cohort studies discussing key clinical, imaging or
surgical predictors of complications. Of these, only nine (3 prospective, 6 retrospective)
conducted a multivariate analysis and controlled for potential confounding variables.115, 140, 240-
246 Sample sizes ranged from 81 to 58,118 surgical patients, with mean ages between 57 and
64.1 years. All patients were diagnosed with some form of degenerative cervical myelopathy,
with the majority presenting with either CSM or OPLL. The main outcome was postoperative
complications in four studies,115, 140, 240, 241 C5 or upper extremity palsy in three,242, 243, 246 major
intraoperative blood loss in one,244 and axial pain in one.245 As indicated by Table 3-17, several
clinical, imaging and surgical predictors were evaluated in these studies. Twenty-seven
additional papers reported on predictors of complications but did not use an adequate
multivariate statistical analysis. The following is a summary of the primary outcomes of these
studies: postoperative complications (n=4);4, 152, 177, 247 nerve root palsy (n=8);163, 248-254
radiculopathy (n=3);174, 255, 256 shoulder stiffness and neck pain (n=1);257 instability (n=1);258
postoperative kyphosis (n=2);259, 260 axial pain (n=3);261-263 pseudoarthrosis (n=1);198 graft
dislodgement (n=2);198, 264 closure of lamina (n=2);265, 266 and reconstruction failure (n=1).267

92
For KQ2, a total of 28 therapeutic cohort studies (2 randomized control trials, 11
prospective, 15 retrospective) met our inclusion criteria. These studies were designed to
compare the efficacy and complication rates between different surgical interventions or
techniques. Studies reported on differences between anterior and posterior approaches
(n=9);11, 107, 115, 268-273 laminoplasty and laminectomy and fusion (n=4);115, 274-276 anterior
decompression and Bryan disc (n=1);277 and anterior discectomy and fusion (ACDF) and
corpectomy (n=2).278, 279 In addition, 11 studies compared various laminoplasty techniques or
considered technical differences such as laminoplasty with and without foraminotomy or
muscle preservation.243, 250, 280-288
3.5.3 Risk of bias
For the prognostic studies, we critically appraised nine studies that conducted a
multivariate analysis. Of these, three were considered level II and six were rated level III. None
of the included prognostic studies were rated level I because patients were not at a similar time
point in the course of their disease. The two level II studies were prospective in nature, had
adequate follow-up rates and accounted for key confounding variables in their analyses. The
level III studies had moderately high risk of bias as most were retrospective cohort studies that
violated ≥1 criteria required for a good-quality cohort study.
For the therapeutic studies, the majority were graded level III as they were moderate or
poor-quality cohort studies. These studies were downgraded from level II to level III because
co-interventions were not applied equally; assessment was not blinded in prospective studies;
data was unreliable in retrospective studies; follow-up rates were <80%; and/or analyses did
not control for important confounders. Three studies were level II evidence.
3.5.4 Are there clinical or imaging factors that can predict complications?
Complications Three studies considered age and co-morbidities as important clinical predictors of
perioperative complications.115, 140, 240 Boakye et al (2008) reported that patients aged 65 years
or older were 2.28 (OR: 2.28, 95% CI: 1.74-2.98) times more likely to experience complications

93
Table 3-17. Characteristics of Prognostic Complications Studies with Multivariate Analysis: Systematic Review C
Author (year) Study Design
Sample and Characteristics Clinical or Imaging Factors Assessed
Surgical Factor Assessed
Complications
Boakye et al (2008) Retrospective cohort (III)
CSM (n=58,115) Male: 58.1% Surgery: spinal fusion
Age Gender Race Comorbidities
None Neurological, pulmonary, thromboembolic, cardiac, renal, and hematoma complications, infection, hoarseness, dysphagia
Cook et al (2008) Retrospective cohort (III)
CSM (n=37,732) Male: 56.0% Diabetes (n=3,432) Surgery: spinal fusion
Diabetes (presence vs. absence, type I vs. type II, controlled vs. uncontrolled)
None CNS, respiratory, cardiac, peripheral vascular, procedural, wound and hematoma complications, CSF leak or persistent fistula, carotid or vertebral injury, transfusion, postoperative infection, hoarseness, dysphagia
Fehlings et al (2012) Prospective cohort (II)
CSM (n=302) Male: 58.9% Mean age, yr (range): 57 (29-86) Surgery: anterior (n=176), posterior (n=107), anteroposterior (n=19)
Age Gender Comorbidity score BMI Preoperative severity Smoking status
Approach Number of stages Number of levels Spinal fusion Fusion approach Laminectomy Corpectomy Operative duration Blood loss
Minor and major perioperative complications Major perioperative complications
Furlan et al (2011) Prospective cohort (II)
CSM (n=81) Male: 70.4% Mean age, yr (range): 57 (32-88) Surgery: anterior (n=56), posterior (n=23), anteroposterior (n=2)
Age Gender Duration of symptoms Co-morbidities (number and CCI)
Approach Number of levels
Postoperative complications
Hasegawa et al (2007) Retrospective cohort (III)
CSM (n=587), OPLL (n=143), CDH (n=117), OLF (n=10) Surgery: ACDF (n=424), laminoplasty (n=345), laminectomy (n=88)
Age Gender Preoperative severity Diagnosis
Procedure Number of levels
Postoperative upper extremity palsy
Kaneyama et al (2010) Prospective cohort (II)
CSM (n=108), OPLL (n=31), CDH (n=7) Male: 74.0% Mean age, yr: 64.1 Surgery: open-door laminoplasty (n=73), double-door laminoplasty (n=73)
Age Gender Preoperative severity Diagnosis Physical signs† Radiologic examinations* CMAP amplitude
Surgical technique Number of levels
C5 palsy††

94
Kato et al (2012) Retrospective cohort (III)
OPLL (n=545) Male: 78.7% Mean age, yr : 62.7 Surgery: double-door laminoplasty (n=286), open-door laminoplasty (n=234), other types of laminoplasty (n=25)
Age Gender Comorbidities Size of OPLL OPLL type Occupying ratio C2-C7 angle High SI on T2-WI
Surgical technique Number of levels
Major intraoperative blood loss (>500g)
Kato et al (2008) Retrospective cohort (III)
CSM (n=135) OPLL (n=10) Male: 69.6% Mean age, yr (range): 61 (38-82) Surgery: Open-door laminoplasty
Age Gender Diagnosis Duration of symptoms Preoperative severity Preoperative alignment Preoperative ROM
Operative duration Blood loss Perseveration of paraspinal muscles
Axial pain**
Kimura et al (2012) Retrospective cohort (III)
OPLL (n=150) Male: 75.3% Mean age, yr (range): 60 (31-84) Surgery: ADF
Occupying ratio C2-C7 angle
Operative duration Blood loss Number of fused segments
Postoperative upper extremity paresis†*
CSM: cervical spondylotic myelopathy; CSF: cerebrospinal fluid; BMI: body mass index; CCI: Charlston co-morbidity index; OPLL: ossification of the posterior longitudinal ligament; CDH: cervical disc herniation; OLF: ossification of the ligamentum flavum; ACDF: anterior cervical discectomy and fusion; ADF: anterior decompression and fusion; CMAP: compound muscle action potential. †Physical signs included muscle strength of deltoid and biceps, muscles stretch reflex of deltoid and biceps tendon and neurologic impediment level of myelopathy *Radiologic examinations included cervical alignment, number of compressed segments, position of the superior articular process, cord inclination, high intensity area on T2-weighted image ††Deterioration of bicep and deltoid muscle strength by at least one level in a standard muscle manual test without any deterioration of other neurologic symptoms **New development or progression of axial pain at 6 months to 2 years postoperative †*Deterioration of upper extremity function.
95
following spinal fusion than those aged 18 to 44 years. Furthermore, patients 85 years or older
were at an even higher risk of postoperative complications (OR: 5.1, 95%CI: 3.08-8.35). In a
study by Fehlings et al (2012), age was considered to be an important predictor of minor and
major perioperative complications (OR: 1.029, 95% CI: 1.002-1.057, p=0.035). Similarly, Furlan
et al (2011) concluded that age was significantly associated with postoperative complications
(OR: 1.09, 95% CI: 1.015-1.172, p=0.018). (Table 3-18).
According to Boakye et al (2008), patients with three or more co-morbidities were twice
(OR: 1.98, 95% CI: 1.59-2.48) as likely to experience complications following spinal fusion than
healthy individuals. In an analysis by Fehlings et al (2012), a co-morbidity score was developed
to encompass both number of co-morbidities and severity of disease. Patients who experienced
major or minor perioperative complications did not have a significantly different co-morbidity
score than those who did not (p=0.84). In a univariate analysis by Furlan et al (2011), there was
a greater number of co-morbidities, as defined by the number of ICD-9 codes, in the
complications group compared to the non-complication group (p=0.033). In addition, the mean
Charlson co-morbidity index was higher in patients with postoperative complications, although
this difference did not reach statistical significance (p=0.092). In multivariate analysis, however,
neither the number nor the severity of co-morbidities were found to be predictive.
Cook et al (2008) focused on the impact of diabetes on various complication categories,
including dysphagia, postoperative infection, and procedural complications.241 In univariate
analysis, patients with diabetes experienced a higher rate of dysphagia (p<0.01), transfusion
(p=0.01) and cardiac (p<0.01), peripheral vascular (p=0.01), respiratory (p<0.01) and hematoma
complications (p=0.01) than patients without diabetes. In addition, cardiac (p=0.01) and
hematoma (p=0.01) complications were more prevalent in patients with uncontrolled diabetes
compared to those with controlled disease. There were no significant differences in
complication rates between patients with type I and type II diabetes.241 Following adjustment
for confounders, patients with diabetes were at a higher risk of cardiac complications than
those without diabetes (OR: 1.57, 95% CI: 1.14-2.16, p=0.01).218 In addition, patients with un-
controlled diabetes were more likely to experience, cardiac complications (OR: 2.82, 95% CI:
1.14-7.01, p=0.03), complications of hematomas (OR: 5.13, 95% CI: 2.16-12.17, p<0.01) and
96
postoperative infection (OR: 7.46, 95% CI: 1.33-41.79, p=0.02) compared to patients with
controlled diabetes.
Other clinical predictors such as gender, duration of symptoms, baseline severity score,
smoking status or BMI were not significantly associated with postoperative complications in
either univariate or multivariate analysis.115, 140, 240
Upper extremity or C5 palsy Hasegawa et al (2007), Kaneyama et al (2010) and Kimura et al (2012) explored various
clinical and imaging risk factors of upper extremity palsy following surgical decompression.242,
243, 246 The sample used in the studies by Hasegawa et al (2007) and Kaneyama et al (2010)
consisted of surgical patients with various forms of degenerative cervical myelopathy, including
CSM, OPLL and CDH. Both studies found that patients with OPLL as the primary diagnosis were
at a markedly higher risk of experiencing upper extremity palsy than those with other forms of
degenerative myelopathy (Hasegawa et al (2007), OR: 19.0, p<0.0001); Kaneyama et al (2010),
OR: 43.8, p<0.05). In the study by Hasegawa et al (2007), although older age was found to be a
significant predictor of upper extremity palsy in univariate analysis (OR: 0.1, p<0.05), it was not
significant in multivariate analysis (OR: 2.59, p=0.108). Age was also an insignificant predictor of
C5 palsy in the study by Kaneyama et al (2010).
Kimura et al (2012) conducted a study on 150 OPLL patients to determine risk factors of
neurological complications occurring within two weeks of anterior decompression and
fusion.246 High occupying ratio was the only significant clinical or imaging predictor of
postoperative upper extremity paresis (OR: 1.047, p=0.040). Age was not considered in this
analysis.
Gender, baseline severity score, and various clinical signs were not significant clinical
predictors of upper extremity palsy.242, 243 Several imaging factors were also not related to
postoperative palsy development, including cervical alignment, number of compressed
segments, position of superior articular process, cord inclination, signal change on T2-weighted
MRI and mid C2 to mid C7 angle.243, 246

97
Major Blood Loss A single study by Kato et al (2012) examined important clinical and imaging predictors of
major intraoperative blood loss during laminoplasty in patients with OPLL.244 When comparing
a group of patients with >500g blood loss to a group with ≤500g, there were no significant
differences with respect to age, gender, size or type of OPLL (continuous, segmental, mixed or
local), C2 to C7 alignment or high signal intensity on T2-weighted MRI. The occupying ratio,
however, was significantly higher (48.3±13.4%) in the major blood loss group compared to the
control group (42.7±13.2%, p=0.02). Furthermore, an occupying ratio of 60% or greater was the
only significant risk factor following multivariate logistic regression analysis (OR: 2.94, 95% CI:
1.1-5.3, p=0.03).
Axial Pain Kato et al (2008) defined postoperative axial pain as pain from the nuchal to scapular
region developing or progressing between six months and two years postoperatively.245
Following multivariate analysis, older age was the only significant predictor of axial pain (>63,
OR: 0.17, 95% CI: 0.04-0.72, p>0.05). Gender, diagnosis, duration of symptoms, baseline
severity score, preoperative alignment and range of motion were not significant risk factors.
3.5.5 Are there surgical factors that can predict complications?
Complications Two studies assessed the predictive value of various surgical factors.115, 140 Based on
univariate analysis, a two stage anteroposterior surgery (p=0.016), a longer operative duration
(p=0.009) and greater blood loss (p=0.005) were significantly associated with perioperative
complications. Following multivariate analysis, however, operative time was the only significant
surgical predictor of overall (major and minor) perioperative complications (OR: 1.005, 95% CI:
1.002-1.008, p=0.001).115 Fehlings et al (2012) also explored risk factors for major
complications, defined as an event resulting in permanent or prolonged morbidity,
prolongation of hospital stay or invasive intervention.115 Patients who were treated surgically
with a two-stage procedure were 5.30 more times (OR: 5.30, 95% CI: 1.626-17.256) likely to
98
experience a major complication compared to those undergoing either a single-stage anterior
or posterior surgery (p=0.006). Furlan et al (2011) reported that the anterior approach was
associated with fewer postoperative complications than either a posterior or circumferential
procedure (p=0.018).140 This surgical factor, however, was not a significant predictor following
multivariate analysis (p=0.248).
Fehlings et al (2012) identified no differences in surgical approach (p=0.11) or number of
operated vertebrae (p=0.067) between patients who experienced perioperative complications
and those who did not.115 Furthermore, whether the procedure included spinal fusion (p=0.82)
(anterior or posterior, p=0.064), a laminoplasty (p=0.48) or a corpectomy (p=0.84) did not
influence postoperative complication rates.
Upper Extremity or C5 Palsy Hasegawa et al (2007) reported that surgical approach (anterior versus posterior or ADF
versus laminoplasty versus laminectomy) was not associated with the occurrence of C5 palsy.242
The number of decompressed levels tended to be higher in patients with C5 palsy, although this
relationship did not reach statistical significance. Following stepwise logistic regression, a
greater number of levels was predictive of postoperative C5 palsy in patients undergoing
anterior decompression and fusion (OR: 11.5, p<0.001).
In a study by Kimura et al (2012), patients with fusion of three or more levels (p=0.017)
and a longer operative duration (p=0.002) were at an increased risk of developing upper-
extremity palsy.246 These two relationships, however, were not significant in multivariate
analysis (p=0.77, p=0.74, respectively). Increased intraoperative blood loss was the only
reported surgical predictor of upper-extremity palsy (OR: 1.002, 95% CI: 1.000-1.003, p=0.047).
Finally, Kaneyama et al (2010) identified that patients undergoing open-door
laminoplasty were at a significantly higher risk of developing C5 nerve palsy than those treated
with double-door laminoplasty (OR: 69.6, 95% CI: 1.14-999.99, p=0.043).243 This estimate,
however, has wide confidence limits and is unstable. Number of open laminae was the only
other surgical factor considered in this study and was not predictive of C5 palsy (p=0.483).

99
Major Blood Loss There was no difference in the number of operated levels between patients who
experienced excessive blood loss (5.1±1.0) and those who did not (5.0±0.8, p=0.68).244
Operative duration, however, was significantly longer in the major blood loss group (240±112
versus 149±59 minutes).
Axial Pain Based on multivariate analysis, preservation of paraspinal muscles attached at C2
decreased the risk of postoperative axial pain (OR: 0.13, 95% CI: 0.02-0.98, p<0.05).245
Operative duration, blood loss and preservation of paraspinal muscles attachment at C7 were
not significantly associated with postoperative axial pain.
3.5.6 Results of studies without multivariate analysis
Table 3-19 summarizes the results of studies that identified important predictors of
complications but did not conduct a multivariate analysis.
Based on the results of two studies, preoperative severity was not related to overall
complication rates.4, 152 In a study by Holly et al (2008), complication rates were compared
between patients older than 75 years and patients under 65 years.152 In the elderly group, the
complication rate (38%) was significantly higher than in the younger group (6%, p=0.002). In a
study by Lu et al (2008), the incidence of complications was also much higher (35%) in the aged
group (≥70 years) compared to the control group (9.7%) (<70 years), although this relationship
did not reach statistical significance.177
There was consensus in the literature that age (n=4),248, 250, 251, 254 gender (n=2),251, 254
preoperative severity (n=5),248, 250, 251, 253, 254 muscle manual test results (n=2),250, 251 duration of
symptoms (n=2),250, 254 diagnosis (n=2),248, 254 preoperative cervical lordosis (n=2),248, 254 and
cervical curvature (n=2)249, 250 are not significant predictors of nerve root palsy. In a study by
Imagama et al (2010), patients experiencing C5 palsy had a smaller C5 intervertebral foramen
width and a higher degree of anterior protrusion of the C5 superior articular process.254
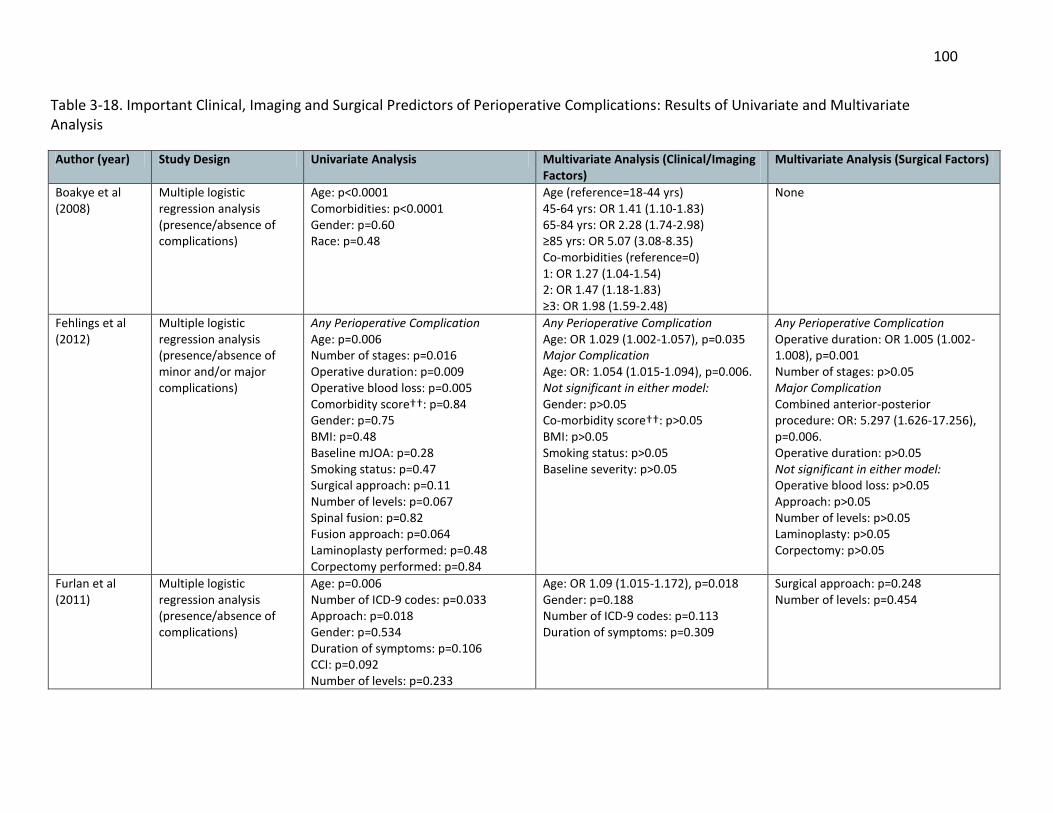
100
Table 3-18. Important Clinical, Imaging and Surgical Predictors of Perioperative Complications: Results of Univariate and Multivariate Analysis
Author (year) Study Design Univariate Analysis Multivariate Analysis (Clinical/Imaging Factors)
Multivariate Analysis (Surgical Factors)
Boakye et al (2008)
Multiple logistic regression analysis (presence/absence of complications)
Age: p<0.0001 Comorbidities: p<0.0001 Gender: p=0.60 Race: p=0.48
Age (reference=18-44 yrs) 45-64 yrs: OR 1.41 (1.10-1.83) 65-84 yrs: OR 2.28 (1.74-2.98) ≥85 yrs: OR 5.07 (3.08-8.35) Co-morbidities (reference=0) 1: OR 1.27 (1.04-1.54) 2: OR 1.47 (1.18-1.83) ≥3: OR 1.98 (1.59-2.48)
None
Fehlings et al (2012)
Multiple logistic regression analysis (presence/absence of minor and/or major complications)
Any Perioperative Complication Age: p=0.006 Number of stages: p=0.016 Operative duration: p=0.009 Operative blood loss: p=0.005 Comorbidity score††: p=0.84 Gender: p=0.75 BMI: p=0.48 Baseline mJOA: p=0.28 Smoking status: p=0.47 Surgical approach: p=0.11 Number of levels: p=0.067 Spinal fusion: p=0.82 Fusion approach: p=0.064 Laminoplasty performed: p=0.48 Corpectomy performed: p=0.84
Any Perioperative Complication Age: OR 1.029 (1.002-1.057), p=0.035 Major Complication Age: OR: 1.054 (1.015-1.094), p=0.006. Not significant in either model: Gender: p>0.05 Co-morbidity score††: p>0.05 BMI: p>0.05 Smoking status: p>0.05 Baseline severity: p>0.05
Any Perioperative Complication Operative duration: OR 1.005 (1.002-1.008), p=0.001 Number of stages: p>0.05 Major Complication Combined anterior-posterior procedure: OR: 5.297 (1.626-17.256), p=0.006. Operative duration: p>0.05 Not significant in either model: Operative blood loss: p>0.05 Approach: p>0.05 Number of levels: p>0.05 Laminoplasty: p>0.05 Corpectomy: p>0.05
Furlan et al (2011)
Multiple logistic regression analysis (presence/absence of complications)
Age: p=0.006 Number of ICD-9 codes: p=0.033 Approach: p=0.018 Gender: p=0.534 Duration of symptoms: p=0.106 CCI: p=0.092 Number of levels: p=0.233
Age: OR 1.09 (1.015-1.172), p=0.018 Gender: p=0.188 Number of ICD-9 codes: p=0.113 Duration of symptoms: p=0.309
Surgical approach: p=0.248 Number of levels: p=0.454

101
Cook et al (2008)
Multiple logistic regression analysis controlling for age, discharge year, race, gender, household income, hospital size, hospital type, primary insurance payer and number of levels fused (presence/absence of complication subgroups)
Diabetes (vs. no diabetes) Respiratory complications: p<0.01 Cardiac complications: p<0.01 Peripheral vascular complications: p=0.01 Complications of hematomas: p=0.01 Transfusion: p=0.01 Dysphagia: p<0.01 Other complications: p=0.001 Controlled diabetes (vs. un-controlled) Cardiac complications: p=0.01 Complications of hematomas: p=0.01
Diabetes (reference=no diabetes) Cardiac complications: OR 1.57 (1.14-2.16), p=0.01 Other complications: OR 1.54 (1.17-2.01), p=0.01 Un-controlled Diabetes (reference=controlled diabetes) Cardiac complications: OR 2.82 (1.14-7.01), p=0.03 Complications of hematomas: OR 5.13 (2.16-12.17), p<0.01 Postoperative infection: OR 7.46 (1.33-41.79), p=0.02
Hasegawa et al (2007)
Multiple logistic regression analysis (presence/absence of upper extremity palsy)
All patients, Anterior procedure Age: p<0.05, <0.01 Diagnosis: <0.0001, <0.001 Number of levels: p=0.0591, <0.001 Procedure: NS, NA Gender: NS, NS Baseline severity score: NS, NS
All patients: Diagnosis (OPLL): OR 19.0, p<0.0001 Age: OR 2.59, p=0.108 Anterior procedure: Age OR: 3.13, p=0.076
Anterior procedure: Number of levels: OR 11.5, p<0.001
Kaneyama et al (2010)
Multiple logistic regression analysis (presence/absence of C5 palsy)
Approach: p<0.05 Diagnosis (OPLL): OR 43.8 (1.03-999.99), p=0.048 Age: p=0.964 Gender: p=0.252 Baseline severity: p=0.219 Physical signs†: p=0.117-0.998 Radiologic examinations*: p=0.101-0.314 CMAP amplitude: p=0.112-0.291
Open-door laminoplasty (vs. double-door): OR 69.6 (1.14-999.99), p=0.043 Number of opened lamina: p=0.493
Kimura et al (2012)
Multiple logistic regression (presence/absence of upper extremity paresis)
Occupying ratio: p=0.005 Blood loss: p=0.021 Operative duration: p=0.002 Long fusion (≥3 segments): p=0.017 C2-C7 angle: p=0.758
Occupying ratio: OR 1.047 (1.002-1.093), p=0.040
Blood loss: OR 1.002 (1.000-1.003), p=0.047 Operative duration : p=0.74 Long fusion (≥3 segments): p=0.77
Kato et al (2012)
Multiple logistic regression analysis
Occupying ratio: p=0.02 Operative duration: p<0.001 Diabetes: p=0.30 Hypertension: p=0.16
Occupying ratio (≥60%): OR 2.4 (1.1-5.3), p=0.03 Age: p>0.05 Gender: p>0.05
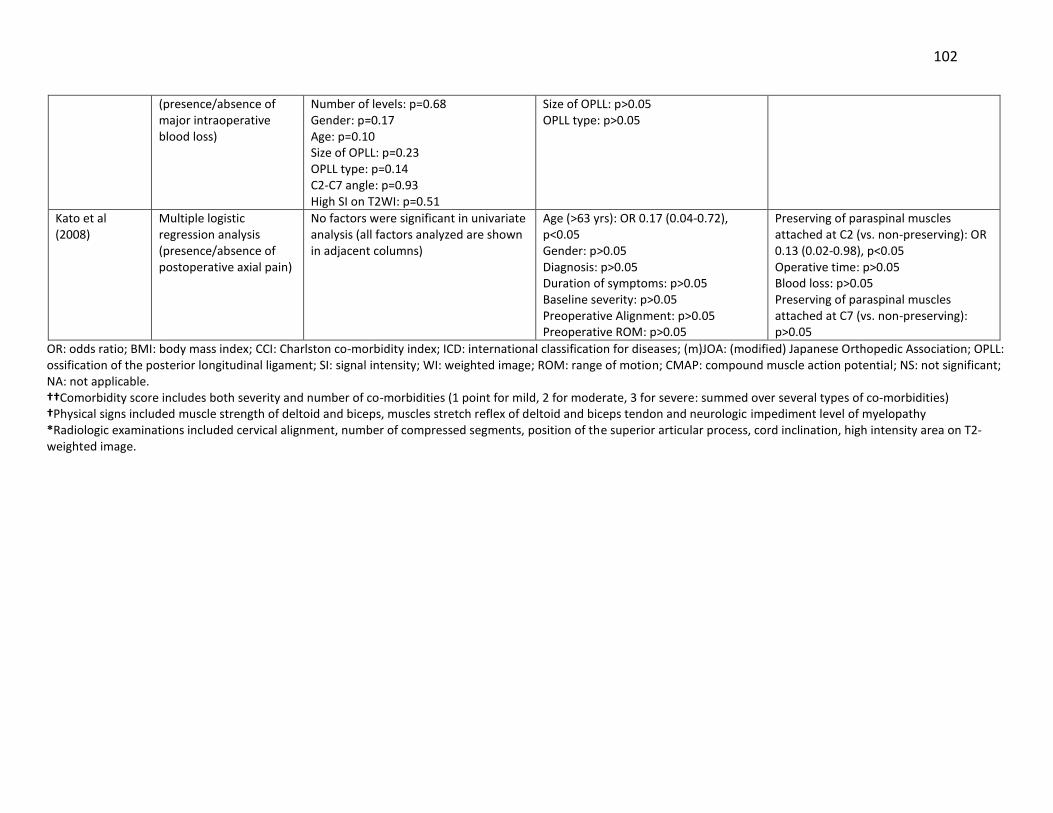
102
OR: odds ratio; BMI: body mass index; CCI: Charlston co-morbidity index; ICD: international classification for diseases; (m)JOA: (modified) Japanese Orthopedic Association; OPLL: ossification of the posterior longitudinal ligament; SI: signal intensity; WI: weighted image; ROM: range of motion; CMAP: compound muscle action potential; NS: not significant; NA: not applicable. ††Comorbidity score includes both severity and number of co-morbidities (1 point for mild, 2 for moderate, 3 for severe: summed over several types of co-morbidities) †Physical signs included muscle strength of deltoid and biceps, muscles stretch reflex of deltoid and biceps tendon and neurologic impediment level of myelopathy *Radiologic examinations included cervical alignment, number of compressed segments, position of the superior articular process, cord inclination, high intensity area on T2-weighted image.
(presence/absence of major intraoperative blood loss)
Number of levels: p=0.68 Gender: p=0.17 Age: p=0.10 Size of OPLL: p=0.23 OPLL type: p=0.14 C2-C7 angle: p=0.93 High SI on T2WI: p=0.51
Size of OPLL: p>0.05 OPLL type: p>0.05
Kato et al (2008)
Multiple logistic regression analysis (presence/absence of postoperative axial pain)
No factors were significant in univariate analysis (all factors analyzed are shown in adjacent columns)
Age (>63 yrs): OR 0.17 (0.04-0.72), p<0.05 Gender: p>0.05 Diagnosis: p>0.05 Duration of symptoms: p>0.05 Baseline severity: p>0.05 Preoperative Alignment: p>0.05 Preoperative ROM: p>0.05
Preserving of paraspinal muscles attached at C2 (vs. non-preserving): OR 0.13 (0.02-0.98), p<0.05 Operative time: p>0.05 Blood loss: p>0.05 Preserving of paraspinal muscles attached at C7 (vs. non-preserving): p>0.05

103
Komagata et al (2004), however, noted no significant difference in the extent of anterior
protrusion between patients with (4.3±4) and without (3.73±3) palsy (p=0.51).250 Hyperintensity
on a MRI was also not an important imaging predictor of nerve root palsy.251, 254
Three studies examined important predictive factors of radiculopathy following
surgery.174, 255, 256 In a study by Greiner-Perth et al (2005), patients who had symptoms of C5
and/or C6 radiculopathy were on average older (62.4 versus 58.6 years, p<0.01) and had a
greater number of operated levels (2.2 versus 1.7 levels, p<0.001) than those who did not. The
incidence of postoperative radiculopathy, however, was not different between an elderly
patient group (≥70 years) and a younger patient group (<70) in a study by Kawaguchi et al
(2003) (p=0.18). There was consensus in the literature that preoperative severity (n=2) was not
significantly associated with postoperative radiculopathy.255, 256
Risk factors for stability complications such as instability (n=1)258 and postoperative
kyphosis (n=2)259, 260 were assessed by three studies. Guigui et al (1998) reported that patients
who were younger (p=0.03), had a hypermobile spine (p<0.0001), greater preoperative range of
motion (p<0.0001) and received a C2 laminectomy (p=0.0164) were more susceptible to spinal
destabilization. With respect to postoperative kyphosis, a single study reported that a diagnosis
of CSM, smaller preoperative Cobb’s angle in neutral (p=0.000), larger degree of preoperative
flexion (p=0.023) and small degree of preoperative extension (p=0.025) were all important
predictors.260
As demonstrated by two studies, an increase in the number of operative lamina is
significantly associated with increased incidence of axial pain (p<0.001, p=0.03).261, 263 A
diagnosis of OPLL (compared to CSM) is also an important clinical predictor of axial pain
(p=0.027).261
As indicated by single studies, risk factors for various surgical complications include: 1)
younger age (p<0.05) and multilevel surgery (p<0.002) for pseudoarthrosis;198 2) previous
surgery for graft complications (p<0.001);198 3) preoperative kyphosis for closure of lamina
(p=0.014);265 and 4) a larger number of fused segments for reconstruction failure (4.2 versus

104
3.5, p<0.05).267 Age (n=3)265-267 and gender (n=3)265-267 were not significant predictors of surgical
complications.
Table 3-19. Clinical, Imaging and Surgical Predictors of Complications: Results of Prognostic Studies without a Multivariate Analysis
Author (year)
Patient Population, Surgical Treatment
Related to Not related to
Postoperative Complication Rates
Fehlings et al (2013)
CSM (n=278), anterior (n=169), posterior (n=95), combined (n=14)
Preoperative severity
Holly et al (2008)
CSM (n=70), anterior (n=10), posterior (n=24), combined (n=2)
Older age Preoperative severity
Lu et al (2008)
CSM (n=51), corpectomy Age
Meyer et al (2011)
CSM (n=12), OPLL (n=28), laminoplasty
Diagnosis
Neurological Complications: Nerve Root Palsy
Chen et al (2007)
OPLL (n=49), laminectomy and posterior fixation
Age, gender, preoperative severity, MMT, number of operated levels, preoperative lordosis, occupying rate, SI on T2-WI
Chen et al (2009)
OPLL (n=83), laminectomy and instrumented fusion
Preoperative lordosis, occupying rate, presence of snake-eye sign on MRI
Chen et al (2013)
OPLL (n=30), posterior hybrid technique (n=15), laminoplasty (n=15)
Segmental instability
Chiba et al (2002)
OPLL, CSM, CDH (n=208), laminoplasty
Preoperative severity
Imagama et al (2010)
CSM (n=1570), OPLL (n=288), laminoplasty
Smaller width of C5 intervertebral foramen, higher degree of anterior protrusion of the C5 superior articular process
Age, gender, duration of symptoms, preoperative severity, diagnosis, preoperative lordosis, number of compressed levels, SI on T2WI, operative duration, estimated blood loss, position of bony gutter, surgical procedure
Komagata et al (2004)
CSM (n=197), OPLL (n=108), laminoplasty
Age, duration of symptoms, preoperative severity, deltoid MMT, cervical spine curvature index, degree of anterior protrusion of the superior articular process
Liu et al (2010)
CSM (n=101), laminectomy and posterior internal fixation
Mean cervical curvature, cervical curvature index
Minoda et al (2003)
CSM (n=27), OPLL (n=14), laminoplasty
Age, preoperative severity, diagnosis, preoperative lordosis, foramen diameter, preoperative lamina angle, gutter position,

105
spinal cord flatness, preoperative anterior cord distance
Neurological Complications: Radiculopathy
Greiner-Perth et al (2005)
CSM (n=121), corpectomy
Older age, greater number of levels
Preoperative severity
Kawaguchi et al (2003)
CSM (n=106), laminoplasty
Age
Uematsu et al (1998)
CSM, OPLL, developmental canal stenosis (n=365), laminoplasty
Diagnosis, narrowest level, preoperative severity, degree of flatness, cervical curvature, extent of anterior protrusion of the superior articular process, laterality of osteophytes or OPLL, angle of lamina before expansion.
Neurological Complications: Shoulder stiffness and neck pain
Yoshida et al (2002)
CSM (n=90), OPLL (n=66), CDH (n=14), CLF (n=3), laminoplasty
Age, AP canal diameter, preoperative severity, diagnosis, cervical alignment.
Stability Complications: Instability
Guigui et al (1998)
CSM (n=58), laminectomy without fusion
Greater preoperative ROM, younger age, C2 laminectomy and hypermobility
Gender, number of removed lamina, preoperative olisthesis, preoperative type of curvature.
Stability Complications: Postoperative Kyphosis
Kaptain et al (2000)
CSM (n=46), laminectomy
Gender, age, history of smoking, C2 laminectomy, foraminotomy, number of levels, preoperative type of curvature (lordosis vs. straight)
Suk et al (2007)
CSM (n=52), OPLL (n=29), CDH (n=4), laminoplasty
Diagnosis of CSM, smaller preoperative Cobb’s angle in neutral, <10⁰ preoperative lordotic angle in neutral, preoperative kyphotic angle during flexion greater than lordotic angle during extension
Axial Pain
Motosuneya et al (2011)
CSM (n=42), OPLL (n=33), laminoplasty
Diagnosis of OPLL, number of open lamina
Ohnari et al (2006)
CSM (n=33), OPLL (n=14), CYL (n=2), CDH (n=1), OYL (n=1), laminoplasty
Age, blood loss, operative duration, gender, duration of cervical orthosis use, reconstruction of semispinalis cervicis muscle, preoperative axial symptoms
Sasai et al (2005)
CDH (n=32), microsurgical posterior
Number of EBLPs

106
herniotomy with en bloc laminoplasty
Surgical Complications: Pseudoarthrosis (Emery et al (1998)); Graft (Emery et al (1998), Kumar et al (2009)); Closure of lamina (Matsumoto et al (2008), Wang et al (2011)); Reconstruction failure (Okawa et al (2011)).
Emery et al (1998)
CSM (n=108), anterior decompression and arthrodesis
Pseudoarthrosis: Younger age, multilevel surgery
Smoking
Emery et al (1998)
CSM (n=108), anterior decompression and arthrodesis
Graft: Previous surgery
Kumar et al (2009)
OPLL, CSM (n=410), corpectomy
Number of levels, the location of the lower mortise in the C7 body (compared to other vertebral bodies)
Matsumoto et al (2008)
CSM (n=67), OPLL (n=15), laminoplasty
Preoperative kyphosis Gender, age, cause of myelopathy, use of anchor screws.
Wang et al (2011)
CSM (n=24), OPLL (n=6), laminoplasty
Age, gender
Okawa et al (2011)
CSM (n=7), OPLL (n=24), corpectomy and reconstruction
Larger number of fused segments
Age, gender, preservation of vertebral endplates, preoperative C2-C7 lordotic angle, fused lordotic angle, C7 horizontal angle, screw type, use of intermediate screws for fibular grafting.
CSM: cervical spondylotic myelopathy; OPLL: ossification of the posterior longitudinal ligament; SI on T2-WI: hyperintensity on T2-weighted MRI; MRI: magnetic resonance image; CDH: cervical disc herniation; MMT: muscle manual test; CLF: calcification of the ligamentum flavum; AP: anteroposterior; JOA: Japanese Orthopedic Association; ROM: range of motion; OYL: ossification of the yellow ligament; CYL: calcification of the yellow ligament; EBLP: en bloc laminoplasty
3.5.7 Are rates of complications different between surgical interventions or varying techniques?
Anterior versus Posterior Fehlings et al (2012, 2013) compared rates of complications between anterior and
posterior surgical groups.107, 115 Patient demographics were significantly different in the two
cohorts: patients treated anteriorly were on average younger and less severe, had fewer
operated levels and a smaller volume of blood loss than those treated posteriorly. There were,
however, no significant differences in rates of perioperative complications (Fehlings 2012:
p=0.11; 2013: p=0.197), major complications (p=0.61), new neurological deficits (p=1.00), C5
radiculopathy (p=1.00) or dysphagia (p=0.65). Based on results from Fehlings et al (2012), there
was a higher incidence of postoperative infection in the posterior group (4.7%) compared to the
anterior group (0.6%, p=0.030). Ghogawala et al (2011) also reported similar overall
complication rates (p=1.00) between patients who underwent anterior cervical decompression
and fusion and those treated posteriorly by laminectomy with fixation.268 In addition, there

107
were no significant differences in rates of overall (p=0.654), surgical (p=0.507), medical (p=1.00)
or irreversible complications (p=0.74) between corpectomy and laminectomy with fusion
surgeries.269 The frequency of dysphagia and transient hoarseness, however, was greater in the
corpectomy group (7.1%) compared to the laminectomy with fusion group (0%). (Table 3-20).
Five studies analyzed differences in complication rates between anterior decompression
surgery and laminoplasty.11, 270-273 The surgical approach was at the discretion of the attending
surgeon in two studies.11, 272 In the other three studies, the design was quasi-randomized:
patients were treated anteriorly within a specific time frame and posteriorly in subsequent
years.270, 271, 273 Based on results from Edwards et al (2002) and Liu et al (2011), there was a
higher incidence of complications in the anterior group (ACDF with plate cage benezech
(p<0.05) or corpectomy (p<0.05)) compared to the laminoplasty group. Rates of axial pain were
also significantly higher in laminoplasty surgery compared to anterior decompression and
fusion.270 These conclusions, however, were based on single studies. According to Sakaura et al
(2005), there were no significant differences in rates of C5 palsy, bone graft complications,
donor site morbidities, axial pain or postoperative kyphosis between the groups.
Anterior Techniques Three studies compared the efficacy and safety of various anterior approaches: ACDF
versus Bryan Disc Prosthesis (n=1)277 and ACDF versus corpectomy (n=2).278, 279 Cheng et al
(2011) conducted a randomized control trial to compare operative and postoperative
characteristics between a Bryan disc and an ACDF group. Complication rates were higher in the
ACDF group since dysphagia was seen in seven patients as compared to only one in the Bryan
group (p<0.001).
When comparing ACDF to anterior corpectomy, there were no significant differences in
rates of surgical complications (p=0.694), CSF leakage (p=0.604), hoarseness (Song (2012):
p=0.742; Ling (2012): p=1.00), epidural hematoma (p=1.00), C5 radiculopathy (p=1.00),
dysphagia (Song (2012): p=0.436; Ling (2012): p=1.00), graft dislodgement (p=0.246),
subsidence (p=0.121) and dural tear (p=0.688). Although graft-related complications were not
significantly different between surgical groups in the study by Song et al (2012), Lin et al (2012)

108
reported a higher incidence of total instrumented and graft-related complications in the
corpectomy group (p=0.032).
Posterior Techniques Four studies compared complication rates between laminoplasty and laminectomy with
fusion.115, 274-276 According to studies by Fehlings et al (2012) and Woods et al (2011), there is no
difference in overall complication rates between posterior surgeries (Fehlings (2012): p=0.14;
Wood (2011): p=0.087). In addition, rates of wound infections (Yang (2013): p=0.285; Fehlings
(2012): p=0.43), dysphagia (p=0.32), neck pain (p=0.066), CSF leakage (p=0.252), kyphosis
(p=0.756) and restenosis (p=0.448) were not significantly different between the two groups. In
studies by Chen et al (2012) and Yang et al (2013), there was a higher incidence of C5 palsy in
the laminectomy with fusion group compared to the laminoplasty group (p<0.05). Fehlings et al
(2012), however, noted no differences in rates of C5 radiculopathy between the two posterior
techniques. Although Chen et al (2012) reported no significant differences between
laminoplasty and laminectomy with fusion with respect to axial pain, Yang et al (2013) found a
higher incidence of axial pain in patients treated with laminectomy with fusion.
Laminoplasty Techniques Various laminoplasty techniques have been designed and modified to improve surgical
outcome and decrease postoperative morbidity. In this review, 11 studies compared
complication rates between different forms of laminoplasty procedures. In a quasi-randomized
study, Park et al (2012) observed no significant differences in aggravated neck pain (p=0.34), C5
palsy (p=0.34) or other complications (p=1.00) between midline-splitting and unilateral single-
door laminoplasty.284 Similarly, hinge position (wide group: hinge located at the inner margin of
the lateral mass; narrow group: hinge at the lamina margin) was not associated with the
development of C5 palsy (p=0.17).288 In a comparative study between open-door and double
door laminoplasty, C5 palsy rates tended to be higher following open-door laminoplasty
(p<0.05).243

109
Selective expansive open-door laminoplasty (ELAP) was designed to reduce damage to
cervical posterior elements and prevent common long-term problems of laminoplasty such as
axial symptoms, malalignment and decreased range of motion.287 This procedure consists of an
open-door laminoplasty at the levels of stenosis and a partial laminectomy combined with
laminoplasty at the most inferior stenotic level. As indicated by Tsuji et al (2007), the incidence
of C5 palsy was significantly lower in the selective ELAP group than in a C3-C7 ELAP group
(p=0.037).
Another modification of laminoplasty was designed to reduce the amount of bone
grafting during operation (three levels only in the open side), shorten the period of orthosis
application and encourage patients to exercise their posterior neck muscles postoperatively.283
Complication rates in this modified group were compared to rates following traditional open-
door en bloc laminoplasty. There was a lower incidence of axial pain and neck stiffness in the
modified group (p=0.0019).
Two studies examined the effectiveness of foraminotomy in combination with
laminoplasty in preventing postoperative C5 palsy.250, 282 Both Komagata et al (2004) and
Katsumi et al (2012) reported a significantly lower incidence of C5 palsy in the concurrent
foraminotomy group (p<0.05).
Four studies have explored muscle-preserving techniques and have compared rates of
axial pain, postoperative kyphosis and C5 nerve root palsy.280, 281, 285, 286 Sakaura et al (2010,
2008) examined whether preservation of 1) subaxial deep extensor muscles or 2) the funicular
section of the nuchal ligament attached to the C6 and C7 spinous process could prevent poor
radiologic outcomes and axial pain. Based on results from these two studies, there was no
significant difference in rates of axial pain between muscle-preserving and muscle-disrupting
groups. Incidence of postoperative kyphosis was also not different between the subaxial deep
extensor preserving group and the control group.
The cohort study conducted by Hosono et al (2006) compared C3-7 to C3-6
laminoplasty. The only difference between the procedures was that the C7 lamina was opened
in the C3-7 group because these patients exhibited cord compression at C6/7 or lower levels.

110
Early and late axial pain rates were higher in the C3-7 group likely due to disruption of the
trapezius and rhomboideus minor muscles that typically attach to the C7 vertebra (early:
p=0.006; late: p=0.015). These results were confirmed by a second study by Hosono et al
(2007): there was a higher incidence of early and late axial pain in the left-opened C3-7 group
compared to either the left- or right-opened C3-6 groups (early: p=0.0008; late: p=0.0036).
3.5.8 Summary of Evidence
High evidence suggests that old age is predictive of perioperative complications. Low
evidence reports that old age decreases the risk of postoperative axial pain. Age, however, is
not associated with upper extremity/C5 palsy (low evidence).
Based on low evidence, there is no association between perioperative complications
and co-morbidities, baseline severity score, BMI, duration of symptoms or smoking status.
Gender is also not a significant predictor (moderate evidence).
Low evidence suggests that patients with a diagnosis of OPLL are at a greater risk of
developing upper extremity palsy or C5 palsy postoperatively.
Low to moderate evidence suggests no association between perioperative
complications and surgical approach, number of levels, estimated blood loss, laminoplasty or
corpectomy. Longer operative duration is predictive of overall perioperative complications
(moderate evidence) but not of major complications (low evidence).
Based on moderate evidence, there are higher rates of neck pain in laminoplasty
compared to anterior spinal fusion and higher rates of dysphagia in ACDF than in Bryan disc.
With respect to laminoplasty techniques, there is no difference in rates of C5 palsy between
wide and open-door laminoplasty (moderate evidence). Low evidence reports a lower incidence
of C5 palsy in laminoplasty with concurrent foraminotomy compared to laminoplasty with no
foraminotomy. (Table 3-21).
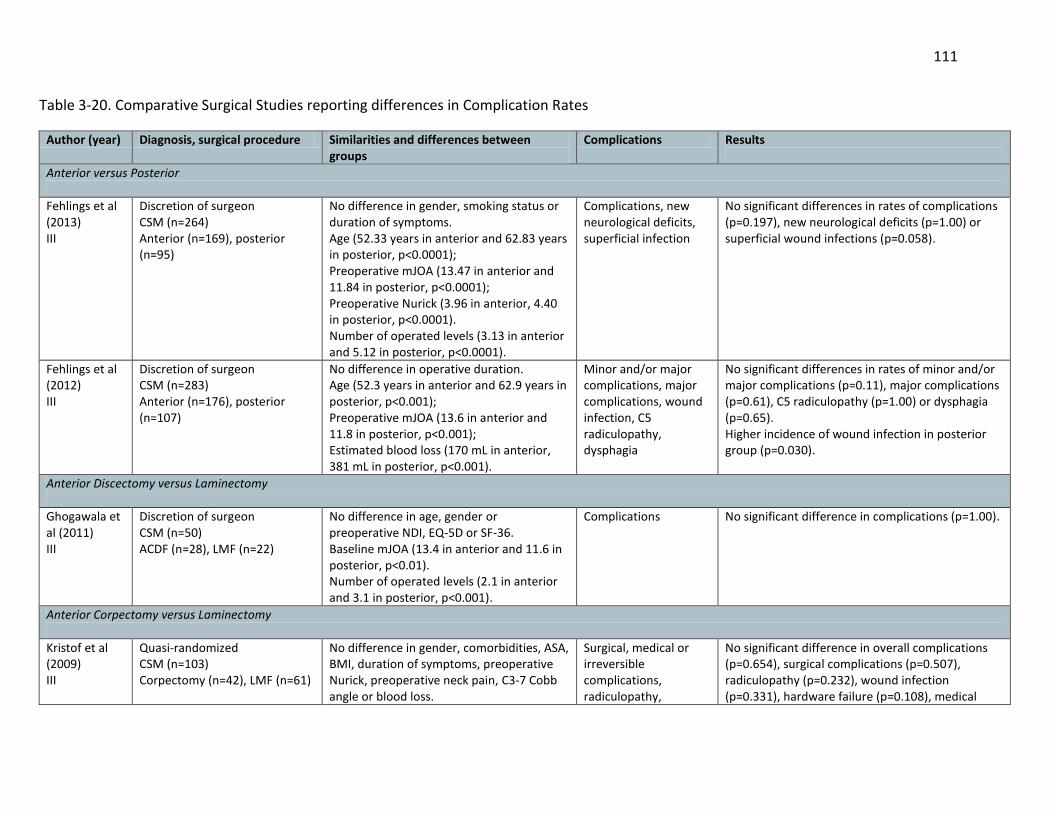
111
Table 3-20. Comparative Surgical Studies reporting differences in Complication Rates
Author (year) Diagnosis, surgical procedure Similarities and differences between groups
Complications Results
Anterior versus Posterior
Fehlings et al (2013) III
Discretion of surgeon CSM (n=264) Anterior (n=169), posterior (n=95)
No difference in gender, smoking status or duration of symptoms. Age (52.33 years in anterior and 62.83 years in posterior, p<0.0001); Preoperative mJOA (13.47 in anterior and 11.84 in posterior, p<0.0001); Preoperative Nurick (3.96 in anterior, 4.40 in posterior, p<0.0001). Number of operated levels (3.13 in anterior and 5.12 in posterior, p<0.0001).
Complications, new neurological deficits, superficial infection
No significant differences in rates of complications (p=0.197), new neurological deficits (p=1.00) or superficial wound infections (p=0.058).
Fehlings et al (2012) III
Discretion of surgeon CSM (n=283) Anterior (n=176), posterior (n=107)
No difference in operative duration. Age (52.3 years in anterior and 62.9 years in posterior, p<0.001); Preoperative mJOA (13.6 in anterior and 11.8 in posterior, p<0.001); Estimated blood loss (170 mL in anterior, 381 mL in posterior, p<0.001).
Minor and/or major complications, major complications, wound infection, C5 radiculopathy, dysphagia
No significant differences in rates of minor and/or major complications (p=0.11), major complications (p=0.61), C5 radiculopathy (p=1.00) or dysphagia (p=0.65). Higher incidence of wound infection in posterior group (p=0.030).
Anterior Discectomy versus Laminectomy
Ghogawala et al (2011) III
Discretion of surgeon CSM (n=50) ACDF (n=28), LMF (n=22)
No difference in age, gender or preoperative NDI, EQ-5D or SF-36. Baseline mJOA (13.4 in anterior and 11.6 in posterior, p<0.01). Number of operated levels (2.1 in anterior and 3.1 in posterior, p<0.001).
Complications No significant difference in complications (p=1.00).
Anterior Corpectomy versus Laminectomy
Kristof et al (2009) III
Quasi-randomized CSM (n=103) Corpectomy (n=42), LMF (n=61)
No difference in gender, comorbidities, ASA, BMI, duration of symptoms, preoperative Nurick, preoperative neck pain, C3-7 Cobb angle or blood loss.
Surgical, medical or irreversible complications, radiculopathy,
No significant difference in overall complications (p=0.654), surgical complications (p=0.507), radiculopathy (p=0.232), wound infection (p=0.331), hardware failure (p=0.108), medical

112
Age (62.5 years in corpectomy and 66.0 years in LMF, p=0.012). Operative duration (229 min in corpectomy and 184 min in LMF, p<0.001).
dysphagia, wound infection, hardware failure, pneumonia, renal failure, sepsis
complications (p=1.00), pneumonia (p=0.797), or irreversible complications (p=0.74). Higher incidence of dysphagia/transient hoarseness in corpectomy group (p=NR).
Anterior Decompression versus Laminoplasty
Edwards et al (2002) III
Discretion of surgeon CSM (n=25), OPLL (n=1) Corpectomy (n=13), LMP (n=13)
No difference in age, duration of symptoms, myelopathy severity, mean lordosis, sagittal motion from C2-7, or operative duration.
Complications, axial pain
Higher incidence of complications in corpectomy group (p<0.05). No significant differences in axial pain.
Hosono et al (1996) III
Quasi randomized CSM (n=98) Corpectomy (n=26), LMP (n=72)
No difference in age, gender, preoperative JOA, or AP spinal canal diameter.
Axial pain Higher incidence of axial symptoms in laminoplasty group (p<0.05).
Koakutsu et al (2010) II
Quasi randomized Soft disc herniation (n=50) ACDF (n=25), LMP (n=25)
No difference in age, gender, level of disc herniation, AP canal diameter and operative duration. Blood loss (128mL in ACDF and 63mL in LMP, p=0.0084). Occupancy ratio (47.4% in ACDF and 55.5% in LMP, p=0.0043).
Neck pain Higher incidence of neck pain at 1-year in laminoplasty group (p=0.037).
Liu et al (2011) III
Discretion of the surgeon CSM (n=52) ACDF with PCB (n=25), LMP (n=27)
No difference in age, duration of symptoms, number of blocks, canal diameter, preoperative JOA score, sagittal alignment, Cobb angle, sagittal diameter or ROM. Operative duration (116 in ACDF and 188 min in LMP, p<0.001) Estimated blood loss (118 mL in ACDF and 361 mL in LMP, p<0.001)
Complications Higher incidence of complications in the ACDF group (p<0.05).
Sakaura et al (2005) III
Quasi randomized CDH (n=43) ASF (n=21), LMP (n=22)
No difference in age, preoperative JOA, duration of symptoms, number of levels of disc herniation, AP diameter or transverse area.
C5 palsy, bone graft, donor site morbidity, axial pain, kyphotic deformities
No significant difference in C5 palsy, bone graft complications, donor site morbidities, axial pain or kyphotic deformities.
Anterior Decompression and Fusion versus Bryan Disc
Cheng et al (2011) II
Randomized CDH or stenosis (n=83) ACDF (n=42), Bryan (n=41)
No difference in age, gender, smoking status or preoperative NDI, SF-36 and JOA. Blood loss (100 mL in Bryan and 150 mL in ACDF, p<0.0001).
Dysphagia
Higher incidence of dysphagia in ACDF (p<0.001).

113
Operative duration (132.4 min in Bryan, 115.1 min in ACDF, p<0.0001)
Anterior Discectomy versus Corpectomy
Lin et al (2012) III
Allocation undefined CSM (n=120) ACDF (n=57), ACCF (n=63)
No difference in age, gender or operative segments. Blood loss (103 mL in ACDF and 149 mL in ACCF, p=0.000). Operative duration (138 min in ACDF and 125 min in ACCF, p=0.021).
CSF leakage, hoarseness, epidural hematoma, C5 radiculopathy, dysphagia, graft dislodgement, subsidence
No significant difference in surgery-related complications (p=0.694), CSF leakage (p=0.604), hoarseness (p=1.00), epidural hematoma (p=1.00), C5 radiculopathy (p=1.00) or dysphagia (p=1.00). No significant difference in graft dislodgement (p=0.246) or subsidence (p=0.121). Higher incidence of total instrumentation and graft-related complications in ACCF group (p=0.032).
Song et al (2012) III
Allocation undefined CSM (n=40) ACDF (n=25), ACCF (n=15)
No difference in age, gender, number of fusion levels or graft materials. Blood loss (621 mL in ACDF, 1011 mL in ACCF, p=0.001). Operative duration (186 min in ACDF, 268 min in ACCF, p=0.024).
Hardware related, pseudoarthrosis, dysphagia, hoarseness, donor site pain, graft related, dural tear
No significant difference in hardware-related complications (p=0.408), pseudoarthrosis (p=0.537), dysphagia (p=0.436), hoarseness (p=0.742), donor site pain (p=0.092), graft-related complications (p=0.158), or dural tear (p=0.688).
Laminoplasty versus Laminectomy
Chen et al (2012) III
Cervical alignment OPLL (n=164) ACCF (n=91), LMP (n=41), LMF (n=32)
No difference in age, gender, occupying rate or number of intervertebral levels. Preoperative JOA score (10.2 in LMP, 9.1 in LMF, p<0.05). All patients in LMF group had cervical kyphosis. All patients in LMP group had cervical lordosis.
C5 palsy Axial pain
No difference in axial pain between LMP and LMF. Higher incidence of C5 radiculopathy in LMF compared to LMP (p<0.001).
Fehlings et al (2012) III
Discretion of surgeon CSM (n=302) LMP (n=34), LMF (n=82)
No significant difference in age or baseline severity. Operative duration (150 min in LMP and 225 min in LMF, p<0.001). Estimated blood loss (198 mL in LMP and 476 mL in LMF, p<0.001).
Minor and/or major complications, major complications, wound infection, C5 radiculopathy, dysphagia.
No significant difference in rates of minor and/or major complications (p=0.14), major complications (p=1.00), wound infections (p=0.43), C5 radiculopathy (p=0.50) or dysphagia (p=0.32).
Woods et al (2011) III
Discretion of the surgeon CSM (n=121) LMF (n=82), LMP (n=39)
No difference in preoperative alignment.
Complications, neck pain
No significant difference in complication rates (p=0.087) or neck pain at final follow-up (p=0.066).
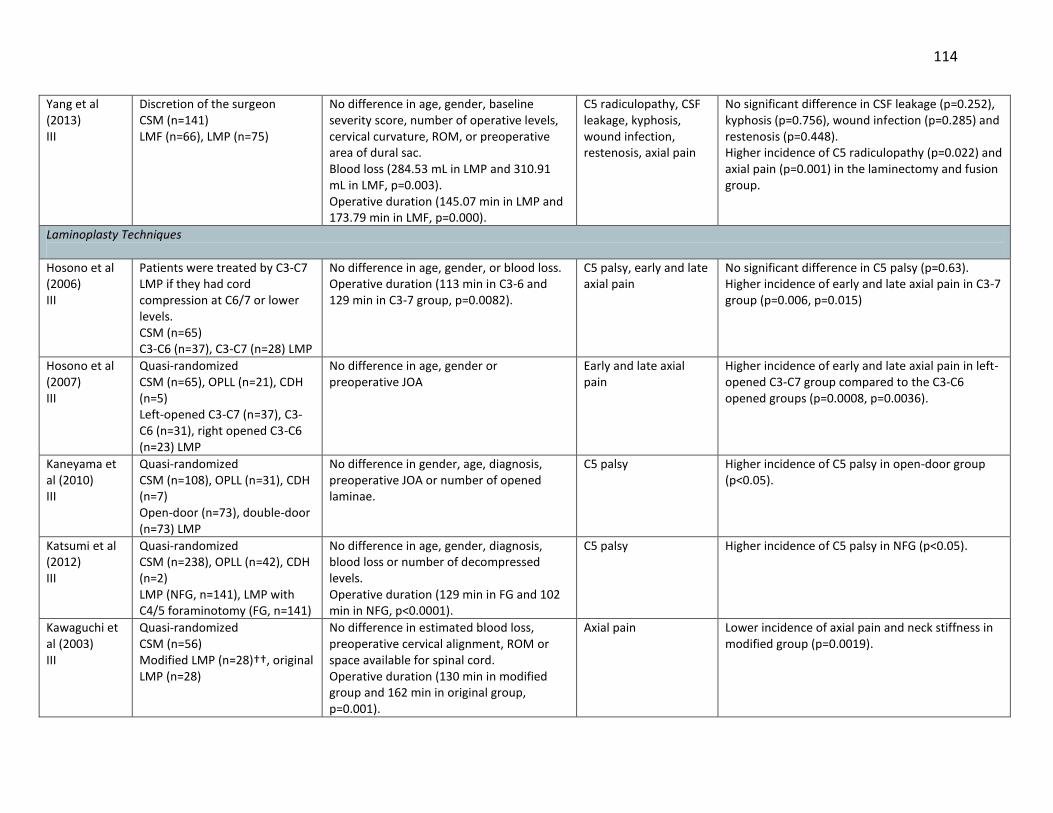
114
Yang et al (2013) III
Discretion of the surgeon CSM (n=141) LMF (n=66), LMP (n=75)
No difference in age, gender, baseline severity score, number of operative levels, cervical curvature, ROM, or preoperative area of dural sac. Blood loss (284.53 mL in LMP and 310.91 mL in LMF, p=0.003). Operative duration (145.07 min in LMP and 173.79 min in LMF, p=0.000).
C5 radiculopathy, CSF leakage, kyphosis, wound infection, restenosis, axial pain
No significant difference in CSF leakage (p=0.252), kyphosis (p=0.756), wound infection (p=0.285) and restenosis (p=0.448). Higher incidence of C5 radiculopathy (p=0.022) and axial pain (p=0.001) in the laminectomy and fusion group.
Laminoplasty Techniques
Hosono et al (2006) III
Patients were treated by C3-C7 LMP if they had cord compression at C6/7 or lower levels. CSM (n=65) C3-C6 (n=37), C3-C7 (n=28) LMP
No difference in age, gender, or blood loss. Operative duration (113 min in C3-6 and 129 min in C3-7 group, p=0.0082).
C5 palsy, early and late axial pain
No significant difference in C5 palsy (p=0.63). Higher incidence of early and late axial pain in C3-7 group (p=0.006, p=0.015)
Hosono et al (2007) III
Quasi-randomized CSM (n=65), OPLL (n=21), CDH (n=5) Left-opened C3-C7 (n=37), C3-C6 (n=31), right opened C3-C6 (n=23) LMP
No difference in age, gender or preoperative JOA
Early and late axial pain
Higher incidence of early and late axial pain in left-opened C3-C7 group compared to the C3-C6 opened groups (p=0.0008, p=0.0036).
Kaneyama et al (2010) III
Quasi-randomized CSM (n=108), OPLL (n=31), CDH (n=7) Open-door (n=73), double-door (n=73) LMP
No difference in gender, age, diagnosis, preoperative JOA or number of opened laminae.
C5 palsy Higher incidence of C5 palsy in open-door group (p<0.05).
Katsumi et al (2012) III
Quasi-randomized CSM (n=238), OPLL (n=42), CDH (n=2) LMP (NFG, n=141), LMP with C4/5 foraminotomy (FG, n=141)
No difference in age, gender, diagnosis, blood loss or number of decompressed levels. Operative duration (129 min in FG and 102 min in NFG, p<0.0001).
C5 palsy Higher incidence of C5 palsy in NFG (p<0.05).
Kawaguchi et al (2003) III
Quasi-randomized CSM (n=56) Modified LMP (n=28)††, original LMP (n=28)
No difference in estimated blood loss, preoperative cervical alignment, ROM or space available for spinal cord. Operative duration (130 min in modified group and 162 min in original group, p=0.001).
Axial pain Lower incidence of axial pain and neck stiffness in modified group (p=0.0019).
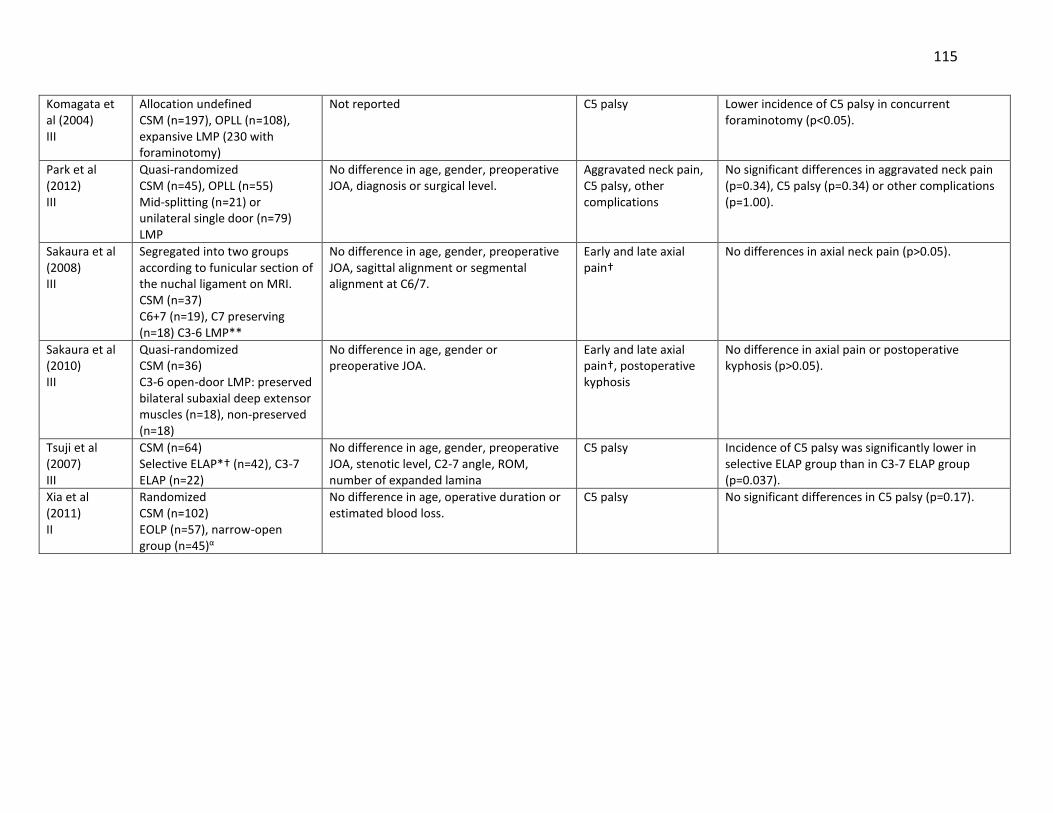
115
Komagata et al (2004) III
Allocation undefined CSM (n=197), OPLL (n=108), expansive LMP (230 with foraminotomy)
Not reported C5 palsy Lower incidence of C5 palsy in concurrent foraminotomy (p<0.05).
Park et al (2012) III
Quasi-randomized CSM (n=45), OPLL (n=55) Mid-splitting (n=21) or unilateral single door (n=79) LMP
No difference in age, gender, preoperative JOA, diagnosis or surgical level.
Aggravated neck pain, C5 palsy, other complications
No significant differences in aggravated neck pain (p=0.34), C5 palsy (p=0.34) or other complications (p=1.00).
Sakaura et al (2008) III
Segregated into two groups according to funicular section of the nuchal ligament on MRI. CSM (n=37) C6+7 (n=19), C7 preserving (n=18) C3-6 LMP**
No difference in age, gender, preoperative JOA, sagittal alignment or segmental alignment at C6/7.
Early and late axial pain†
No differences in axial neck pain (p>0.05).
Sakaura et al (2010) III
Quasi-randomized CSM (n=36) C3-6 open-door LMP: preserved bilateral subaxial deep extensor muscles (n=18), non-preserved (n=18)
No difference in age, gender or preoperative JOA.
Early and late axial pain†, postoperative kyphosis
No difference in axial pain or postoperative kyphosis (p>0.05).
Tsuji et al (2007) III
CSM (n=64) Selective ELAP*† (n=42), C3-7 ELAP (n=22)
No difference in age, gender, preoperative JOA, stenotic level, C2-7 angle, ROM, number of expanded lamina
C5 palsy Incidence of C5 palsy was significantly lower in selective ELAP group than in C3-7 ELAP group (p=0.037).
Xia et al (2011) II
Randomized CSM (n=102) EOLP (n=57), narrow-open group (n=45)α
No difference in age, operative duration or estimated blood loss.
C5 palsy No significant differences in C5 palsy (p=0.17).

116
Other
Caroom et al (2013) III
CSM (n=112) Vancomycin (n=40), control (n=72) Posterior decompression and instrumentation (n=112)
No difference in age, diabetes, preoperative severity, BMI, operative duration, estimated blood loss or number of instrumented levels.
Surgical site infection Higher incidence in control group (p=0.007).
Yoshida et al (2012) III
CSM (n=31), controls (n=30) ELAP C3-7 (n=31), lumbar decompression (n=30)
No difference in age, gender, ASA or operative duration. Blood loss (165 mL in LMP and 257 mL in lumbar decompression, p=0.0132).
Complications Higher incidence in LMP group (p=0.0183).
CSM: cervical spondylotic myelopathy; mJOA: modified Japanese Orthopaedic Association; ACDF: anterior cervical discectomy and fusion; LMF: laminectomy and fusion; NDI: Neck Disability Index; EQ-5D: EuroQol-5D; SF-36: short form-36; ASA: American Society of Anesthesiologists; BMI: body mass index; OPLL: ossification of the posterior longitudinal ligament; ASF: anterior spinal fusion; AP: anteroposterior; PCB: plate cage benezech; ROM: range of motion; CDH: cervical disc herniation; ACCF: anterior cervical corpectomy and fusion; CSF: cerebral spinal fluid; ELAP: expansive laminoplasty; EOLP: expansive open-door laminoplasty; FG: foraminotomy group; NFG: non-foraminotomy group ††Modified group: 1) bone grafts in the open gap were placed at three levels, 2) bone grafting in the hinged side was not performed, 3) the neck collar was worn for only 1 month and 4) patients were advised to perform early posterior neck muscle exercises. †Early axial pain: more than a week, less than a month; late axial pain: persisting for more than 1 month. **C6+7 group: funicular sections attaching to both C6 and C7 spinous process were preserved; C7 group: funicular section of the nuchal ligament attached only to the C7 spinous process was preserved (not attached to C6 process on MRI). *†In selective ELAP, open-door laminoplasty was performed only at stenotic levels; partial laminectomy of the upper half of lamina at the most inferior stenotic level was combined with laminoplasty. α: Wide group: the hinge trough was positioned at the inner margin of the lateral mass; narrow group: the hinge trough was positioned at one-third outside the lamina and 2-3mm more inward than the wide-open method.

117
Table 3-21. Evaluation of Overall Body of Evidence using GRADE: Systematic Review C
Baseline quality: HIGH = majority of articles are Level I/II. LOW = majority of articles are Level III/IV.
UPGRADE: Large magnitude of effect (1 or 2 levels); dose response gradient (1 level); plausible confounding decreases magnitude of effect (1 level)
DOWNGRADE: Inconsistency of results (1 or 2 levels); indirectness of evidence (1 or 2 levels); imprecision of effect estimates (1 or 2 levels); risk of bias (1 or 2 levels); failure to specify subgroup analysis a priori (1 level); reporting bias (1 level)
Strength of evidence
Conclusions/Comments Baseline UPGRADE (levels)
DOWN-GRADE (levels)
KQ1: Are there clinical or imaging factors that can predict perioperative complications?
Age
HIGH LOW LOW INSUFFICIENT
Associated with perioperative complications: As reported by three studies (2 prospective, 1 retrospective), older patients are at a greater risk of perioperative complications
Associated with axial pain: A single retrospective study reported that older age decreased the risk of postoperative axial pain.
Not associated with upper extremity/C5 palsy: Two studies (1 prospective, 1 retrospective) reported no association between age and upper extremity/C5 palsy.
There is insufficient evidence from a single retrospective study that age predicts major intraoperative blood loss.
HIGH LOW HIGH LOW
Large effect size (+2)
Consistency unknown, imprecise (-2) Inconsistent, indirect (-2) Consistency/precision unknown (-2), indirect (-1)
Co-morbidities
LOW LOW-INSUFFICIENT
Not associated with perioperative complications: Two (prospective) out of three studies found no association between co-morbidities and perioperative complications.
There is insufficient evidence from a single retrospective study that diabetes (compared to no diabetes) is associated with cardiac complications and that uncontrolled diabetes (compared to controlled diabetes) is related to cardiac complications, hematomas and postoperative infection.
HIGH LOW
Large effect size (+1-2)
Inconsistent, precision unknown (-2) Consistency unknown, imprecise (-2)
Gender MODERATE INSUFFICIENT
Not associated with perioperative complications: As reported by two prospective studies, gender is not related with perioperative complications.
There is insufficient evidence from a single prospective study that gender predicts C5 palsy.
HIGH HIGH
Precision unknown (-1) Consistency/precision unknown, sparse (-3)

118
INSUFFICIENT
There is insufficient evidence that gender predicts intraoperative blood loss (1 retrospective), and axial pain (1 retrospective).
LOW
Indirect (-1) and/or consistency unknown, imprecise or precision unknown (-2)
BMI Smoking Status Duration of
symptoms
LOW INSUFFICIENT
Not associated with perioperative complications: There is evidence from single prospective studies that BMI, duration of symptoms and smoking status are not related to perioperative complications.
There is insufficient evidence from a single retrospective study that duration of symptoms predicts axial pain.
HIGH LOW
Consistency/precision unknown (-2) Consistency unknown, imprecise (-2)
Baseline severity LOW INSUFFICIENT
Not associated with perioperative complications: A single prospective study reported no association between baseline severity and perioperative complications.
There is insufficient evidence that baseline severity predicts C5 palsy (1 prospective) and axial pain (1 retrospective).
HIGH LOW
Consistency/precision unknown (-2) Sparse (-1) and/or consistency unknown, imprecise (-2)
Diagnosis LOW Associated with upper extremity or C5 palsy: Two studies (1 prospective, 1 retrospective) reported an association between a diagnosis of OPLL and postoperative upper extremity or C5 palsy.
HIGH Large effect size (+2)
Inconsistent, indirect, imprecise/precision unknown, risk of bias (-4)
Size of OPLL Type of OPLL Preoperative
Alignment Preoperative ROM Cervical alignment Number of
compressed segments
Position of articular process
Cord inclination SI on T2-WI
INSUFFICIENT INSUFFICIENT INSUFFICENT
There is insufficient evidence from a single retrospective study that size of OPLL and type of OPLL are predictive of intraoperative blood loss.
There is insufficient evidence from a single retrospective study that preoperative alignment and ROM predict axial pain.
There is insufficient evidence from a single retrospective study that cervical alignment, number of compressed segments, position of the superior articular process, cord inclination and high intensity on T2-WI are predictive of C5 palsy.
LOW LOW HIGH
Consistency/precision unknown, indirect (-3) Consistency unknown, imprecise (-2) Consistency unknown, imprecise, sparse (-3)
Occupying ratio INSUFFICIENT
There is insufficient evidence from a single retrospective study that occupying ratio is predictive of upper extremity paresis.
LOW
Consistency unknown (-1)

119
INSUFFICIENT There is insufficient evidence from a single retrospective study that occupying ratio is predictive of intraoperative blood loss.
LOW Large effect size (+1)
Consistency unknown, imprecise, indirect (-3)
KQ1: Are there surgical factors that can predict perioperative complications?
Number of levels MODERATE INSUFFICIENT INSUFFICIENT
Not associated with perioperative complications: Based on two prospective studies, the number of levels is not associated with perioperative complications.
There is insufficient evidence that number of opened lamina is predictive of C5 palsy.
There is insufficient evidence from a single retrospective study that long fusion predicts upper extremity paresis.
HIGH HIGH LOW
Precision unknown (-1) Consistency unknown, imprecise, sparse (-3) Consistency unknown, imprecise, indirect (-3)
Surgical approach MODERATE Not associated with perioperative complications: As reported by two prospective studies, surgical approach is not related to perioperative complications.
HIGH Precision unknown (-1)
Operative duration MODERATE LOW INSUFFICIENT
Associated with perioperative complications: Based on a single prospective study, a longer operative duration is associated with perioperative complications.
Not associated with major perioperative complications: As reported by a single prospective study, operative duration is not associated with major perioperative complications.
There is insufficient evidence from single retrospective studies that operative duration is predictive of axial pain and upper extremity paresis.
HIGH HIGH LOW
Consistency unknown (-1) Consistency/precision unknown (-2) Consistency unknown/imprecise (-2); indirect, consistency unknown (-2)
Number of stages HIGH LOW
Associated with major perioperative complications: Based on a single prospective study, a two stage procedure is a risk factor for major perioperative complication development.
Not associated with perioperative complications: Based on a single prospective study, number of stages is not related with perioperative complications.
HIGH HIGH
Large effect size (+2)
Consistency unknown, imprecise (-2) Consistency/precision unknown (-2)
Operative blood loss LOW
Not associated with perioperative complications: A single prospective study reported no association between operative blood loss and perioperative complications.
HIGH
Consistency/precision unknown (-2)

120
INSUFFICIENT There is insufficient evidence from single retrospective studies that operative blood loss is predictive of axial pain and upper extremity paresis
LOW Consistency unknown (-1)
Laminoplasty, corpectomy
LOW Not associated with perioperative complications: A single prospective study reported no association between laminoplasty or corpectomy and perioperative complications.
HIGH Consistency/precision unknown (-2)
KQ2: Are there differences in rates of surgical complications between procedures?
Anterior versus Posterior
INSUFFICIENT There is insufficient evidence from four studies (3 prospective, 1 retrospective) that complication rates differ between anterior and posterior surgery.
LOW Risk of bias (-1)
Anterior corpectomy versus Laminoplasty
INSUFFICIENT There is insufficient evidence from one retrospective study that complication rates differ between anterior corpectomy and laminoplasty.
LOW Consistency unknown (-1)
Anterior decompression versus Laminoplasty
MODERATE INSUFFICIENT
Higher rates of neck pain in laminoplasty: A single prospective study reported a higher incidence of neck pain in laminoplasty compared to anterior spinal fusion.
There is insufficient evidence that rates of complications, C5 radiculopathy, bone graft complications, axial pain or postoperative kyphosis differ between anterior decompression and laminoplasty
HIGH LOW
Consistency unknown (-1) Risk of bias and/or consistency unknown/inconsistent (-1)
ACDF versus Bryan disc
MODERATE Higher rates of dysphagia in ACDF: A single RCT reported a higher rate of dysphagia in ACDF than in Bryan disc surgery.
HIGH Consistency unknown (-1)
ACCF versus ACDF INSUFFICIENT There is insufficient evidence from two retrospective studies that complication rates differ between ACCF and ACDF.
LOW Risk of bias and/or inconsistency (-1/-2)
Laminectomy and fusion versus Laminoplasty
INSUFFICIENT There is insufficient evidence from three studies (1 prospective, 2 retrospective) that complication rates differ between laminectomy with fusion and laminoplasty.
LOW Risk of bias and/or inconsistency (-1/-2)
Laminoplasty techniques
MODERATE LOW
No difference in rates of C5 palsy between wide and narrow open door laminoplasty: As reported by one RCT, hinge position does not affect rates of C5 palsy.
Lower incidence of C5 palsy in laminoplasty with concurrent foraminotomy: Two studies (1 prospective, 1 retrospective) reported a
HIGH LOW
Consistency unknown (-1)

121
INSUFFICIENT INSUFFICIENT INSUFFICIENT
lower incidence of C5 palsy in a concurrent foraminotomy group compared to a non-foraminotomy group.
There is insufficient evidence from three studies (1 prospective, 1 retrospective, 1 case-control) that rates of axial pain and C5 palsy differ between C3-6 selective laminoplasty and C3-7 laminoplasty.
There is insufficient evidence from two prospective studies that rates of axial pain and postoperative kyphosis differ between muscle-preserving and muscle-disrupting groups.
There is insufficient evidence from single studies (2 prospective, 1 retrospective) that rates of C5 palsy differ between open-door and double door laminoplasty; rates of axial pain and neck stiffness differ between modified and original laminoplasty; and rates of aggravated neck pain, C5 palsy and other complications differ between mid-splitting and unilateral single-door laminoplasty.
LOW LOW LOW
Consistency unknown (-1) and/or risk of bias (-1) Consistency unknown, risk of bias (-2) Consistency unknown, risk of bias (-2)
Vancomycin INSUFFICENT There is insufficient evidence from a single study that rates of infection differ between a vancomycin and a control group.
LOW Consistency unknown (-1)
BMI: body mass index; OPLL: ossification of the posterior longitudinal ligament; ROM: range of motion; SI on T2-WI: hyperintensity on T2-weighted MRI; ACDF: anterior cervical discectomy and fusion; ACCF: anterior cervical corpectomy and fusion; RCT: randomized control trial

122
3.5.9 Discussion
This review summarizes important clinical and surgical predictors of post-operative
complications. This knowledge will allow clinicians to identify high-risk patients and institute
rigorous prevention strategies. Furthermore, surgeons can use this information to objectively
discuss surgical risks with their patients. This, together with outcome prediction, will enable
patients to make more informed decisions during the surgical-consent process and will also aid
in expectation management. Finally, from an economic standpoint, health care providers will be
able to appropriately allocate resources and predict future hospital utilization costs for each
surgical patient.
Literature discussing complication prediction is limited compared to outcome
prediction. In a review by Tetreault et al (2013), 91 studies reported associations between
clinical parameters and postoperative functional status or quality of life.215 In this current
review, only 36 studies evaluated the relationship between various clinical or surgical variables
and complications. Nine of these used multivariate analysis and controlled for important
confounders. It was therefore challenging to formulate strong evidence-based
recommendations due to limitations in study design, inconsistency and imprecision of results,
single study conclusions and risk of bias due to uncontrolled analyses.
Based on this review, age is a significant predictor of postoperative complications. This
is consistent with previous lumbar spine studies that have shown significant adverse events in
elderly patients following surgery.289, 290 As CSM is a progressive disease, older patients are
likely to have substantial degenerative pathology and, as a result, may require a more complex
surgery.115 In addition, the elderly can be less tolerant to surgery due to worse overall general
health status, co-morbidities and reduced physiological reserves. Clinicians must inform these
patients that they are at a higher risk of postoperative complications and are less likely to
achieve a favorable outcome.
There is controversy in the literature surrounding the predictive value of co-morbidities.
The number of co-morbidities was significantly associated with perioperative complications in a
study by Boakye et al (2008). This finding was based on a large retrospective analysis of 58,115

123
patients undergoing spinal fusion at a single hospital. Furlan et al (2011), on the other hand,
reported no relationship between the number of ICD-9 codes and perioperative complications.
This insignificant multivariate association may be due to a potential interaction between older
age and number of co-morbidities.140 Patients with diabetes, particularly uncontrolled or type I,
are at a greater risk of perioperative complications and may require a longer length of stay and
more hospital resources.241 These findings are consistent with results from previous lumbar
spine studies that concluded diabetes is a significant risk factor of wound infections and non-
unions.291-294
With respect to surgical factors, a longer operative duration is associated with higher
rates of perioperative complications.115 Duration of surgery may be a surrogate for case
complexity. Therefore, we do not recommend surgeons speed up surgery but rather identify
complex cases, anticipate complications and plan accordingly. A two-stage anteroposterior
surgery is predictive of major complications; similarly, this factor may reflect greater
degenerative pathology and increased case complexity.115
The second objective of this review was to compare complication rates between various
surgical techniques. Based on the results of KQ1, studies had to control for age and operative
duration in order to be classified as good quality cohort studies. Unfortunately, the majority of
the literature included in this review did not adjust for these two confounders, preventing
accurate comparisons between intervention groups. Further research is required to determine
real differences in complication rates between anterior and posterior surgery, laminectomy
with fusion and laminoplasty and various laminoplasty techniques.
There was low to moderate evidence, however, suggesting differences in complication
rates between ACDF and laminoplasty, ACDF and Bryan’s disc, narrow and wide-hinge
laminoplasty and presence and absence of concurrent foraminotomy. Postoperative neck pain
is frequently encountered following laminoplasty and rates are significantly higher than in
anterior spinal fusion surgery.
Current hypotheses for intra- or post-operative C5 nerve root palsy include traumatic
surgical procedure, edema of the spinal cord or tethering of the root. Yonenobu et al (1991,

124
1992) suggested that C5 palsy is more common following wide-open door laminoplasty due to
excessive backward shift of the spinal cord.295, 296 The hinge position determines how open the
door is and an inward shift of the hinge restricts excessive backward shift and overstretching of
the nerve roots.288 Although no patients in the narrow-group experienced C5 palsy and three
cases were seen in the wide group, this difference did not reach statistical significance. There
was a lower incidence of this complication following laminoplasty with concurrent
foraminotomy, suggesting that another potential cause of C5 palsy is existing C4/C5 foraminal
stenosis.282
3.5.10 Evidence-Based Clinical Recommendations
Recommendation #1: While surgeons should not discriminate on the basis of age, they should
be informed that older patients are at a higher risk of complications. We therefore recommend
surgeons discuss these risks with their patients; plan and institute rigorous preventative
strategies; and closely monitor their patients in the perioperative period. Furthermore, health
care systems should anticipate higher associated costs and allocate resources accordingly.
Strength of Statement: Moderate
Recommendation #2: Longer operative duration and two-stage surgery are important
predictors of complications. However, both likely reflect substantial degenerative pathology
and increased case complexity. We therefore recommend surgeons identify these cases
preoperatively, anticipate complications and plan both preventative and postoperative
management strategies.
Strength of Statement: Moderate
Consensus Statement #1: We suggest that results from this study guide the development of
future complication prediction rules. Furthermore, we suggest that analyses in comparative
complication studies control for operative duration and age.
125
Chapter 4: Surgeons’ Perceptions of Significant Predictors of Surgical
Outcome and Complications: Results from two Surveys of AOSpine
International
4.1 Introduction
This chapter summarizes the results from two surveys distributed to members of
AOSpine International. AOSpine International is a community of orthopaedic- or neuro-
surgeons, academics, researchers and other spine care professionals dedicated to knowledge
expansion, education development and innovative research in the field of spine to improve
patient care and outcomes. Members are professionals from six international regions: North
America, Asia Pacific, Europe, Africa, Middle East and Latin America.
The objective of these surveys was to address the following clinical questions:
Part A:
1. What are important clinical predictors of surgical outcome in patients with CSM?
2. Is MRI a valuable prognostic tool? If so, what are the most important imaging predictors
of surgical outcome in patients with CSM?
3. Do perceptions of important predictors of outcome vary from region to region?
Part B:
1. What are important clinical and imaging predictors of complications in patients treated
surgically for CSM?
2. What are important surgical predictors of complications in patients treated surgically for
CSM?
3. Do perceptions of important predictors of complications vary from region to region as a
result of differences in patient characteristics and surgical preferences?
This information will guide the construction of our clinical and complications prediction
models which will be used to predict functional outcomes and quantify risk of complications for
each surgical patient. In addition, by exploring regional differences in perceptions, we can

126
identify international biases in CSM management and preferences of surgeons from different
regions. These differences will be valuable when interpreting findings from our external
validation study.
4.2 Overview of Common Methods
Two English language surveys were designed to ask spine professionals what they
believed were the most important predictors of surgical outcome and complications in patients
with CSM. An email request to participate in these surveys was sent to members of AOSpine
International with a cover letter outlining the objectives of these studies and an attached link to
Survey Monkey. This link was available electronically for 35-50 days, with reminders sent out
throughout this period.
Both surveys were designed to confirm the results of our systematic reviews and to
address key knowledge gaps in the literature. In addition, questions were developed based on
available data from the AOSpine CSM-North America and International studies as results from
these surveys will serve to validate our future clinical and complications prediction rules.
Finally, the questions were constructed to ascertain regional biases in opinions that may exist
due to international differences in patient characteristics and surgical preferences. Tables 4-1
and 4-2 summarize the surveys created for part A and part B, respectively.
Table 4-1. Survey Questions and Answer Options for Part A
1. CLINICAL FACTORS: Rank the following clinical factors from the most (1) to least (8) important in terms of their ability to predict surgical outcome. Options: Age Baseline Severity Score Gender Co-morbidities Duration of symptoms Signs Smoking status Symptoms
2. AGE: What is the threshold age above which there is a negative impact on surgical outcome? Options: 30, 40, 50, 60, 65 years, Other (please specify)
3. DURATION OF SYMPTOMS: What is the threshold duration of symptoms above which there is a negative impact on surgical outcome? Options: 1-3, 6, 12, 24 months, Other (please specify)
4. SMOKING STATUS: Is current smoking status important in predicting outcome? Options: YES, NO Is past smoking status important in predicting outcome? Options: YES, NO

127
5. BASELINE SEVERITY SCORE: What is the threshold baseline mJOA above/ below which there is a negative impact on surgical outcome? Options: 0-18 points
6. CO-MORBIDITIES: Select the five most important co-morbidities in terms of their ability to predict surgical outcome. Options: Cardiovascular (myocardial infarct, angina/coronary artery disease, hypertension, peripheral arterial disease, arrhythmia, venous disease), Respiratory, Gastrointestinal (stomach, pancreas, hepatic), Renal, Endocrine (diabetes), Psychiatric, Rheumatologic, Neurologic (neuromuscular disorders, stroke, paralysis)
7. SIGNS: Select the two most important myelopathic signs in terms of their ability to predict surgical outcome. Options: Corticospinal motor deficits, Atrophy of intrinsic hand muscles, Hyperreflexia, Positive Hoffman sign, Upgoing plantar responses, Broad-based unstable gait
8. SYMPTOMS: Select the two most important symptoms of CSM in terms of their ability to predict surgical outcome. Options: Numb hands, Clumsy hands, Impaired gait, Bilateral arm paresthesiae, L’Hermitte’s phenomena, Muscular weakness in legs
9-11. MAGNETIC RESONANCE IMAGING FACTORS: Does Magnetic Resonance Imaging (MRI) provide prognostic information? Options: YES, NO Are cord properties (ex. Signal change) more important than canal measurements (ex. Transverse area) for predicting surgical outcome? Options: YES, NO Rank the following MRI factors from the most (1) to least (8) important in terms of their ability to predict of surgical outcome. Options: Transverse area Area of signal intensity on T2 High T2 signal intensity Height of signal intensity on T2 Low T1 signal intensity Number of compressed segments High T2/Low T1 Segmentation of T2 signal intensity
Table 4-2. Survey Questions and Answer Options for Part B
GENERAL 1: What type of complications do you see the most in your practice (select 2)? Options: Pseudoarthrosis, C5 radiculopathy, dysphagia, dural tear, axial pain, wound-related, postoperative kyphosis
GENERAL 2: What type of factors are the most important in predicting complications? Clinical factors (ex. Age, duration of symptoms, preoperative severity, co-morbidities) Imaging factors (ex. Transverse area, signal intensity) Surgical factors (ex. Approach, technique, operative time).
3. CLINICAL FACTORS: Rank the following clinical factors from the most (1) to least (6) important in terms of their ability to predict complications: Age Baseline Severity Score Gender Co-morbidities Duration of symptoms Smoking Status
4. CO-MORBIDITIES: A. Which of the following is the most important predictor of complications? Number of co-morbidities Type of co-morbidity (ex. Endocrine vs. cardiovascular) Severity of co-morbidity B. Select the five most important co-morbidities in terms of their ability to predict complications: Options: myocardial infarct, angina/coronary artery disease, hypertension, peripheral arterial disease, arrhythmia, venous disease, respiratory disease, stomach/intestine, pancreas, hepatic system, renal dysfunction, diabetes, psychiatric disorders, rheumatologic issues, neuromuscular disorders, stroke, paralysis.

128
C. Are the following complications more prevalent in diabetic patients than in non-diabetic patients? Dysphagia Extensive bleeding Cardiac complications Wound infection C5 radiculopathy Respiratory complications Non-union
5. AGE: What is the threshold age above which there is an increased risk of complications? Options: 40, 50, 60, 65, other (please specify)
6. SMOKING STATUS: Does smoking lead to pseudoarthrosis or non-union?
7. IMAGING FACTORS: How important are the following imaging factors in predicting complications (1=not important, 10=very important) Transverse area Anteroposterior diameter Low signal intensity on T1-MRI High signal intensity on T2-MRI High signal change ratio Combined T1/T2 signal change Multilevel involvement
8. ANTERIOR VERSUS POSTERIOR: A. Are rates of complications different between anterior and posterior surgery? B. Select whether the following complications are more prevalent in anterior or posterior surgery or if there is no difference: Pseudoarthrosis C5 radiculopathy Dysphagia Dural tear Axial pain Wound-infection Instability Adjacent segment degeneration
9. 1-STAGE VERSUS 2-STAGE: Are rates of complications different between 1-stage and 2-stage surgery?
10. LAMINOPLASTY VERSUS LAMINECTOMY AND FUSION: A. Are rates of complications different between laminoplasty and laminectomy with fusion? B. Select whether the following complications are more prevalent in laminectomy with fusion or laminoplasty or if there is no difference: Pseudoarthrosis C5 radiculopathy Dysphagia Dural tear Axial pain Wound-infection Instability Adjacent segment degeneration
11. NUMBER OF LEVELS: What is the threshold number of operative levels above which there is an increased risk of complications: Options: 2, 3, 4+
12. FUSION VERSUS NON-FUSION: A. Are rates of complications different between fusion and non-fusion surgery? B. Select whether the following complications are more prevalent in fusion or non-fusion surgery or if there is no difference: Pseudoarthrosis Instrumentation migration Non-union Instability Axial pain Adjacent segment degeneration
The results from the ranking questions are summarized as means +/- standard
deviations and modes with percentages of that response. A mean score closer to one indicates
that the clinical or imaging factor has high predictive value based on professional opinion. The
results from the other questions are presented as frequencies or percentages of responses. To
assess variations in international perceptions, we separated the data into six geographic groups

129
and ran similar analyses for each region. The results from Africa were not included in this sub-
analysis as a limited number of professionals from this continent participated in these surveys.
4.3 Results Part A: Important Clinical and Imaging Predictors of Surgical Outcome
4.3.1 Summary of Respondents
Six hundred and eighty nine members of AOSpine International completed the survey,
reflecting a response rate of 11.6% (689/5,934). The majority of respondents were either
neuro- (n=219), orthopaedic- (n=215) or spine- surgeons (n=171). Eighteen residents also
participated as well as two operating room nurses, two researchers, one neurologist, one pain
management specialist, one radiologist and one rheumatologist. Geographically, the greatest
number of participants were from Europe (n=204), followed by Asia Pacific (n=161), North
America (n=107), the Middle East (n=55), with the lowest representation from Africa (n=9)
(Figure 4-1).
Figure 4-1. Geographical Distribution of Survey Participants: Part A Purple: North America; yellow: Latin America; blue: Europe; pink: Middle East; forest green: Africa; green: Asia Pacific. The red flags represent the number of respondents from each country. Any country in Europe with fewer than 5 participants were not flagged but only colored (Austria, Belgium, Bulgaria, Croatia, Czech Republic, Denmark, Estonia, Finland, France, Hungary, Ireland, Israel, Latvia, Malta, Moldova, Netherlands, Norway, Romania, Serbia, Slovakia, Slovenia, Ukraine).

130
4.3.2 Significant Clinical Predictors of Surgical Outcome
Table 4-3 displays the results from question 1 for the entire sample and for each
geographic region. Figure 4-2 illustrates the distribution of responses for each clinical factor.
Based on the distributions, it is evident that professionals believe duration of symptoms,
baseline severity score, signs and symptoms are more predictive than gender, smoking status
and the presence of co-morbidities. For age, 45% of the responses were 1-4, whereas 55% were
5-8, making it difficult to draw conclusions about this predictor. Duration of symptoms and
baseline severity were perceived as the most significant clinical predictors of outcome, with
mean rankings of 2.66±1.54 and 3.14±1.95, respectively. The mode for preoperative severity
was 1, with 28.2% of the sample selecting this answer. Although the mode for duration of
symptoms was 2, 26% of participants still ranked this factor as the most important predictor of
outcome. Symptoms and signs were also selected as having the greatest predictive value by
15.4% and 14.4% of the sample, respectively. Smoking status, gender and co-morbidities all had
low mean rankings and each had less than 5% choosing it as the number one predictor.
Figure 4-2. Distribution of Responses for each Clinical Factor The x-axis reflects the ranking number and the y-axis represents the number of responses.

131
Compared to the entire sample, participants from Europe ranked signs as a significantly
more important predictor and smoking status as a significantly less important predictor of
surgical outcome. Duration of symptoms had the highest mean ranking across all geographies,
with the exception of North America where baseline severity score was ranked higher. The
mean ranking for baseline severity score was the second highest for Latin America, Middle East
and Asia. Europeans ranked signs as a more important clinical predictor than preoperative
severity.
Threshold age
Fifty-three percent of participants selected 65 years as the threshold age above which
there is a negative impact on surgical outcome (Table 4-4). Twenty-four percent chose 60 years
and 17% responded “other.” Of these, 29 participants specified 70 years, 36 said 75 years and
25 stated 85 years was the threshold age. Furthermore, 39 respondents declared that there is
no specific cut-off either because age is not a significant predictor of outcome or because
physiological age is far more important than chronological age.
There was international agreement that 65 years was the cut-off age, with proportions
of responses ranging from 0.42 in North America to 0.58 in Latin America. A higher proportion
(0.35) of North Americans answered “other,” with 65% (n=24/37) suggesting a limit between 70
and 85 years.
Threshold duration of symptoms
The majority of respondents answered that six months (n=241) or 12 months (n=238)
was the threshold duration of symptoms above which there is a negative impact on surgical
outcome (Table 4-4). Twenty percent selected 24-months.
There was international agreement that either six or 12 months was the cut-off duration
of symptoms, with proportions ranging from 0.24-0.42 and 0.31-0.42, respectively. Participants
from Latin America, however, significantly favored “12-months” over “six-months.” All other
geographical regions had approximately equal proportions selecting six- and 12-months.

132
Table 4-3. Important Clinical Predictors of Surgical Outcome: Results for Entire Sample and each Geographic Region:
All Europe Asia Pacific Latin America North America Middle East Africa
Age Mean Mode (%) Number 1 (%)
N=677 4.40±1.84 5 (23.0) N=59 (8.7)
N=202 4.52±1.72 5 (24.2) N=14 (6.9)
N=159 4.35±2.00 5 (21.4) N=19 (11.9)
N=141 4.40±1.79 5 (24.1) N=6 (4.2)
N=106 4.26±1.81 5/6 (23.6) N=11 (10.4)
N=50 4.6±1.99 6 (26.0) N=6 (12.0)
N=9 3.33±1.80 1/3/5 (22.2) N=2 (22.2)
Gender Mean Mode (%) Number 1 (%)
N=677 7.01±1.78 8 (61.6) N=27 (4.0)
N=202 6.96±1.75 8 (56.4) N=8 (3.9)
N=159 7.17±1.63 8 (64.8) N=4 (2.5)
N=140 6.77±2.04 8 (58.6) N=9 (6.4)
N=106 7.52±1.19* 8 (77.4) N=1 (0.94)
N=51 6.67±1.91 8 (50.1) N=2 (3.9)
N=9 5.44±3.17 8 (44.4) N=2 (22.2)
Duration of Symptoms Mean Mode (%) Number 1 (%)
N=676 2.66±1.54 2 (28.2) N=176 (26.0)
N=201 2.58±1.52 2 (31.8) N=54 (26.9)
N=159 2.70±1.57 1 (27.0) N=43 (27.0)
N=141 2.66±1.50 1 (26.2) N=37 (26.2)
N=106 2.58±1.37 2 (37.7) N=22 (20.8)
N=50 2.64±1.68 1 (30.0) N=15 (30.0)
N=9 3.67±2.34 1/2/6 (22.2) N=2 (22.2)
Smoking Status Mean Mode (%) Number 1 (%)
N=677 6.18±1.56 7 (41.0) N=9 (1.3)
N=202 6.42±1.46* 7 (43.6) N=1 (0.50)
N=159 6.31±1.37 7 (40.2) N=3 (1.9)
N=140 5.91±1.81 7 (35) N=3 (2.1)
N=106 6.20±1.35 7 (50) N=1 (0.94)
N=51 5.80±1.60 7 (35.3) N=0 (0)
N=9 5.22±2.44 7 (44.4) N=0 (0)
Baseline Severity Mean Mode (%) Number 1 (%)
N=678 3.14±1.95 1 (28.2) N=191 (28.2)
N=202 3.39±1.93 4 (23.2) N=46 (22.8)
N=159 3.17±1.95 1 (25.2) N=40 (25.2)
N=141 3.28±2.07 1 (29) N=41 (29)
N=106 2.26±1.48 1 (44.34) N=47 (44.34)
N=51 3.22±2.07 1 (27.4) N=14 (28.4)
N=0 3.89±2.47 1/4 (22.2) N=2 (22.2)
Co-morbidities Mean Mode (%) Number 1 (%)
N=677 5.22±1.60 5 (25.7) N=14 (2.1)
N=202 5.28±1.65 6 (26.7) N=4 (2.0)
N=159 4.98±1.52 5 (30.2) N=3 (1.9)
N=140 5.47±1.58 6 (29.3) N=4 (2.8)
N=106 5.13±1.49 5 (29.2) N=2 (1.9)
N=51 5.33±1.80 5 (23.5) N=1 (2.0)
N=9 4.56±1.88 3/4/6 (22.2) N=0 (0)
Signs Mean Mode (%) Number 1 (%)
N=678 3.63±1.90 3 (20.5) N=98 (14.4)
N=202 3.48±1.78* 3 (22.3) N=27 (1.33)
N=159 3.76±1.96 2 (20.1) N=19 (11.9)
N=141 3.47±2.01 1 (19.8) N=28 (19.8)
N=106 3.88±1.92 3 (24.5) N=13 (12.3)
N=51 3.43±1.88 3 (23.5) N=9 (17.6)
N=9 4.89±1.76 4 (33.3) N=0 (0)
Symptoms Mean Mode (%) Number 1 (%)
677 3.75±2.09 2 (19.4) N=104 (15.4)
N=202 3.33±2.06 1 (23.8) N=48 (23.8)
N=159 3.55±2.04 2 (20.1) N=28 (17.6)
N=140 4.0±2.05 2 (20) N=13 (9.3)
N=106 4.17±2.02 4 (17.9) N=9 (8.5)
N=51 4.14±2.18 2/4 (21.6) N=4 (7.8)
N=9 5.0±2.4 5 (33.3) N=1 (11.1)
Mean ranking ± standard deviations are given in the second row. Frequencies and percentages of number 1 answers are provided in the fourth row. A * indicates that the mean for that region is significantly different than the mean from the entire sample

133
Smoking Status
Seventy-one percent of participants said that current smoking status was valuable in
predicting surgical outcome, whereas only 39% percent believed that past smoking status was
important (Table 4-4).
Although there was international agreement that current smoking status is an important
predictor, a more convincing proportion from the Middle East (0.85) answered “YES” to this
question. There was no consensus surrounding the value of past smoking status: participants
from North America and Europe had a significantly higher proportion of “NO” responses than
the entire sample, whereas professionals from Latin America suggested that past smoking does
carry prognostic value.
Threshold Baseline mJOA Score
Forty-one percent of participants chose 12 points as the threshold baseline mJOA
severity score below which there is a negative impact on surgical outcome (Table 4-4). The
second most frequently selected score was 10 points, which was chosen by 24% of the sample.
There was international agreement that a mJOA of 12 reflects the cut-off preoperative
severity score, with proportions ranging from 0.37-0.43. Although few participants chose the
“other” option, a significantly larger proportion (0.08) of Europeans answered this compared to
the entire sample, with the majority noting that they were either unaware of this scale or that it
was not commonly used in their practice.
Co-morbidities
Five hundred and thirty-eight professionals rated diabetes as an important co-morbidity
with respect to outcome prediction (Figure 4-3). Neuromuscular disorders, stroke and paralysis
were also frequently selected. Two-hundred and ninety-three respondents chose psychological
disorders and 266 agreed that rheumatologic issues were predictive. Diseases of the respiratory
system (n=211), renal dysfunction (n=182) and gastrointestinal diagnoses (n=52) were not
frequently ranked as important co-morbidities.

134
Table 4-4. Threshold Duration of Symptoms, Age and Baseline Severity Score and Smoking as a
Predictor
All Geographies
Comments for Other Regional Differences
Threshold Duration of Symptoms 1-3 months 6 months 12 months 24 months Other
N=684 (99.3%) N=48 (7.0%) N=241 (35.2%) N=238 (34.8%) N=140 (20.5%) N=17 (2.5%)
18 months (n=1) 5 years (n=2) >10 years (n=1) Unsure (n=4) None (n=5) Depends on severity (n=1) Severity/signs/symptoms are more important (n=3)
Asia Pacific: 42%/31% said 6/12 months Europe: 37%/34% said 6/12 months Latin America: 42% said 12 months* Middle East: 29%/31% said 6/12 months North America: 39%/33% said 6/12 months
Threshold Age 30 years 40 years 50 years 60 years 65 years Other
N=647 (94%) N=8 (1.2%) N=4 (0.6%) N=35 (5.4%) N=152 (23.5%) N=341 (52.7%) N=107 (16.6%)
70 years (n=29) 75 years (n=36) 80 years (n=25) 85 years (n=4) 90 years (n=1) Unsure (n=9) Physiological age is more important than chronological age/patient specific (n=6) None (n=33)
Asia Pacific: 46% said 65 years Europe: 54% said 65 years Latin America: 58% said 65 years Middle East: 48% said 65 years, 37% said 60 years* North America: 42% said 65 years, 35% said “other”* International Agreement
Threshold Severity Score (mJOA) 8 points 10 points 12 points 14 points 16 points Other
N=647 (94%) N=87 (13.5%) N=153 (23.7%) N=267 (41.3%) N=84 (13.0%) N=29 (4.5%) N=27 (4.0%)
0 points (n=1) 5 points (n=1) Unsure (n=13) None (n=2) Unfamiliar with scale (n=10)
Asia Pacific: 37% said 12 points and 30% said 10 points Europe: 43% said 12 points, 8% said “other”* Latin America: 43.4% said 12 points Middle East: 41% said 12 points North America: 43% said 12 points
Smoking Status Is smoking important? Is past smoking important?
N=682 (99%) Yes: 484 (71%) No: 198 (29%) N=683 (99%) No: 415 (61%) Yes: 268 (39%)
N/A Asia Pacific: Similar to entire sample. Europe: 72%* said past smoking status is unimportant. Latin America: 78%/60%* said current/past smoking is important. Middle East: 85%*/53% said current/past smoking is important. North America: 75%* said past smoking is unimportant.
mJOA: modified Japanese Orthopaedic Association. The frequency and percentages of responses are provided for the entire sample. Global differences are highlighted. A * indicates that the proportion of responses was significantly different for that region than for the entire sample.
Professionals from all regions agreed diabetes, psychological co-morbidities,
rheumatologic issues and neuromuscular disorders were important co-morbidities with respect
to outcome prediction. Paralysis was chosen by similar proportions from all regions, with the
exception of Latin America who chose this option less frequently. Latin Americans also believed
that renal dysfunction, respiratory disease and venous disease were more important co-

135
morbidities than the entire sample. The “top-five” lists from all geographies included diabetes
and neuromuscular disorders. Paralysis and stroke were not included in Latin America’s top five
but were instead replaced by respiratory disease and rheumatologic issues. Psychological
disorders were also included in the top five lists of all regions except for Europe which selected
rheumatologic co-morbidities at a greater proportion.
Figure 4-3. Important Co-Morbidities of Outcome Prediction The x-axis reflects the co-morbidity and the y-axis represents the frequency of responses. PAD: peripheral arterial disease.
Signs
There was a clear distinction between the three most and the three least important
signs (Figure 4-4). Fifty-five and 52% of the respondents selected atrophy of intrinsic hand
muscles and broad based unstable gait as the most important signs, respectively. Corticospinal
distribution motor deficits was chosen by 38% of the sample.
When exploring geographic variations, the two signs with the highest proportions of
responses were atrophy of intrinsic hand muscles and broad based unstable gait with
proportions ranging from 0.49-0.62 and 0.42-0.69, respectively. Participants from North
America had a significantly higher number of answers in favor of broad based unstable gait than
the other regions. Corticospinal motor deficit was selected the third most frequently by all
geographies except for the Middle East. Respondents from this region believed that a Positive
0
100
200
300
400
500
600

136
Hoffman sign was more predictive of a worse surgical outcome than corticospinal motor
deficits.
Figure 4-4. The Predictive Value of Myelopathic Signs
Symptoms
Similarly to signs, there were three common symptoms chosen by survey participants
(Figure 4-5). Seventy-six percent of the sample responded that impaired gait was the most
important sign. Clumsy hands and muscular weakness were each selected by 45%.
Figure 4-5. The Predictive Value of Myelopathic Symptoms
From all regions, impaired gait received the greatest number of responses, with a
significantly higher proportion of North Americans (0.86) choosing this sign. Participants from
North America also chose clumsy hands more frequently than the other regions and stated that
weakness was a less important sign. Europeans, on the other hand, suggested that weakness
was a more important sign than clumsy hands.
19%
27%
12%
10%
6%
26%
Total Population
Corticospinal DistributionMotor DeficitsAtrophy of Intrinsic HandMusclesHyperreflexia
Positive Hoffman Sign
Upgoing Plantar Responses
Broad Based Unstable Gait
5%
23%
38%
5%
7%
22%
Total Population
Numb Hands
Clumsy Hands
Impaired Gait
Bilateral Arm Paresthesiae
L'Hermitte's Phenomena
Muscular Weakness
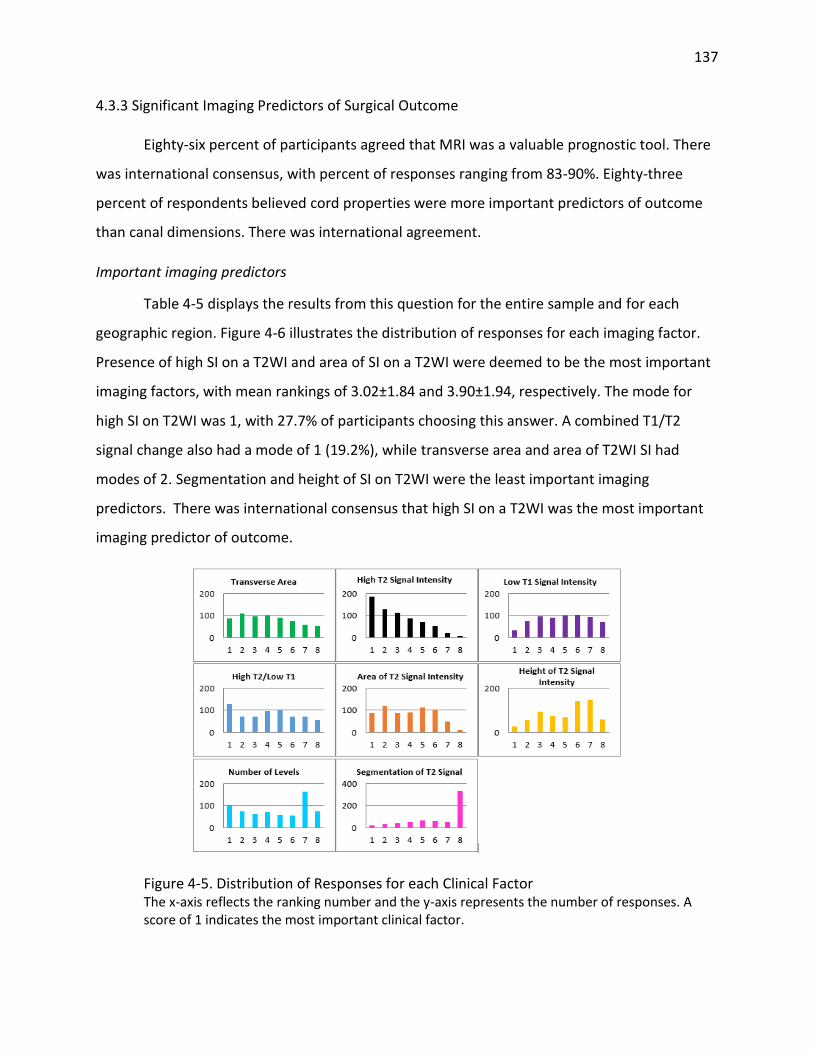
137
4.3.3 Significant Imaging Predictors of Surgical Outcome
Eighty-six percent of participants agreed that MRI was a valuable prognostic tool. There
was international consensus, with percent of responses ranging from 83-90%. Eighty-three
percent of respondents believed cord properties were more important predictors of outcome
than canal dimensions. There was international agreement.
Important imaging predictors
Table 4-5 displays the results from this question for the entire sample and for each
geographic region. Figure 4-6 illustrates the distribution of responses for each imaging factor.
Presence of high SI on a T2WI and area of SI on a T2WI were deemed to be the most important
imaging factors, with mean rankings of 3.02±1.84 and 3.90±1.94, respectively. The mode for
high SI on T2WI was 1, with 27.7% of participants choosing this answer. A combined T1/T2
signal change also had a mode of 1 (19.2%), while transverse area and area of T2WI SI had
modes of 2. Segmentation and height of SI on T2WI were the least important imaging
predictors. There was international consensus that high SI on a T2WI was the most important
imaging predictor of outcome.
Figure 4-5. Distribution of Responses for each Clinical Factor The x-axis reflects the ranking number and the y-axis represents the number of responses. A score of 1 indicates the most important clinical factor.

138
Table 4-5. Important Imaging Predictors of Surgical Outcome: Results for Entire Sample and each Geographic Region
All Europe Asia Pacific Latin America North America Middle East Africa
Transverse Area Mean Mode (%) Number 1 (%)
N=665 4.07±2.14 2 (16.2) N=86 (12.9)
N=193 3.99±2.03 3/4 (17.6) N=24 (12.4)
N=155 4.25±2.27 5 (15.5) N=22 (14.2)
N=141 3.69±2.06 2 (17.7) N=24 (17.0)
N=107 4.44±2.19 4 (15.9) N=11 (10.3)
N=51 4.14±2.06 2 (25.5) N=3 (5.9)
N=9 5.89±1.54 4/5/6/7 (22.2) N=0 (0)
High T2 Signal Change Mean Mode (%) Number 1 (%)
N=665 3.02±1.84 1 (27.7) N=184 (27.7)
N=193 2.97±1.84 1 (31.6) N=61 (31.6
N=155 3.05±1.81 1 (25.2) N=39 (25.2)
N=141 2.79±1.82 1 (31.2) N=44 (31.2)
N=107 3.17±1.88 1 (26.2) N=28 (26.2)
N=51 3.29±2.00 1 (23.5) N=12 (23.5
N=9 2.89±1.69 2 (66.7) N=0 (0)
Low T1 Signal Change Mean Mode (%) Number 1 (%)
N=665 4.82±2.04 6 (15.6) N=32 (4.8)
N=193 4.86±1.86 5 (18.1) N=6 (3.1)
N=155 4.62±2.24 3 (18.1) N=15 (9.7)
N=141 4.86±1.92 4 (20.6) N=3 (2.1)
N=107 4.92±2.22 2 (17.8) N=4 (3.7)
N=51 5.06±2.02 5 (19.6) N=3 (5.9)
N=9 4.11±2.20 3 (44.4) N=0 (0)
T1/T2 Signal Change Mean Mode (%) Number 1 (%)
N=665 4.13±2.27 1 (19.2) N=128 (19.2)
N=193 4.51±2.17* 5 (18.1) N=21 (10.9)
N=155 4.23±2.35 1 (21.3) N=33 (21.3)
N=141 3.86±2.17 1 (19.1) N=27 (19.1)
N=107 3.77±2.35 1 (27.1) N=29 (27.1)
N=51 4.02±2.19 1 (21.6) N=11 (21.6)
N=9 2.56±2.65 1 (66.7) N=6 (66.7)
Area of Signal Change Mean Mode (%) Number 1 (%)
N=664 3.90±1.94 2 (17.9) N=87 (13.1)
N=193 3.84±2.07 2 (22.3) N=29 (15.0)
N=155 3.93±1.78 5 (19.4) N=13 (8.4)
N=141 3.98±1.92 5 (22.7) N=20 (14.2)
N=107 3.65±1.85 2 (20.6) N=16 (15.0)
N=50 4.02±2.10 2/3 (18.0) N=6 (12.0)
N=9 4.89±1.36 4 (55.6) N=0 (0)
Height of Signal Change Mean Mode (%) Number 1 (%)
N=665 5.12±1.98 7 (22.0) N=26 (15.2)
N=193 5.09±2.03 7 (26.4) N=5 (2.6)
N=155 5.17±1.96 6 (22.6) N=6 (3.9)
N=141 5.20±1.93 7 (24.8) N=5 (3.5)
N=107 5.05±1.93 6 (20.6) N=4 (3.7)
N=51 4.98±2.33 6 (21.5) N=6 (11.8)
N=9 5.44±1.24 6 (55.6) N=0 (0)
Number of Levels Mean Mode (%) Number 1 (%)
N=663 4.67±2.43 7 (24.7) N=101 (15.2)
N=192 4.26±2.55 7 (22.9) N=43 (22.4)
N=155 4.64±2.41 7 (23.9) N=22 (14.2)
N=141 5.04±2.33 7 (30.5) N=13 (9.2)
N=107 4.92±2.32 7 (21.5) N=12 (11.2)
N=50 4.46±2.49 7 (22.0) N=10 (20.0)
N=9 5.33±2.5 5 (33.3) N=1 (11.1)
Segmentation Mean Mode (%) Number 1 (%)
N=665 6.27±2.15 8 (49.8) N=21 (3.2)
N=193 6.45±2.05 8 (53.4) N=4 (2.1
N=155 6.10±2.21 8 (48.4) N=5 (3.2
N=141 6.58±1.99 8 (54.6) N=5 (3.5)
N=107 6.09±2.19 8 (43.0) N=3 (2.8)
N=51 5.98±2.20 8 (45.0) N=0 (0)
N=9 4.89±2.98 8 (33.3) N=2 (22.2)
Mean ranking ± standard deviations are given in the second row. Frequencies and percentages of number 1 answers are provided in the fourth row. A * indicates that the mean for that region is significantly different than the mean from the entire sample.

139
4.3.4 Discussion
Based on the opinions of spine care professionals, baseline severity score and duration
of symptoms are the most important predictors of surgical outcome in CSM patients. The
rationale behind these two findings is that both severe and chronic, longstanding compression
of the spinal cord may lead to irreversible histological damage such as myelomalacia,
spongiform changes, microcavitation and necrosis of the grey matter. 215 These findings are
consistent with the literature.
In our systematic review, there was controversy surrounding the predictive value of age.
In this survey, 45% of participants ranked age as 1-4, whereas 55% scored this predictor as 5-8.
This split makes it challenging to resolve the controversy in the literature and to draw
conclusions as to whether older patients have poorer surgical outcomes. Based on these
results, we believe surgeons and other spine care professionals should not discriminate on the
basis of age, especially when the patient is otherwise healthy and fit. Surgeons, however,
should be aware that the elderly may not be able to translate neurological recovery to
functional improvements as well as a younger population and should use this information to
appropriately manage their patients’ expectations.
The purpose of questions 2, 3 and 5 was to determine how to appropriately dichotomize
age, duration of symptoms and baseline severity score for future statistical analyses. There are
no concrete definitions for “old age”, “long duration of symptoms” or “severe myelopathy” to
outline how to separate these continuous variables into specific groups. Since the majority of
survey participants selected 65 as the threshold age, it is reasonable to define “old” as patients
over 65 and “young” as patients under 65 years. This threshold was used by Nagata et al.
(1996), Yamazaki et al. (2003) and Hirai et al. (1991) to split their sample into an elderly and
younger cohort.157, 222, 297 Other studies have arbitrarily used 70208, 298, 299 or 80180 years as the
cut-off value. Given that 17% of participants responded “other,” with a large proportion
specifying 70, 75 or 80 as the threshold, it may also be appropriate to divide the sample into
clusters as was done in a study by Tanaka et al. (1999): group A, 65-74; group B, 75-79; and
group C, ≥80 years.138

140
With respect to duration of symptoms, many previous studies have concluded that
patients with a disease duration greater than 12-months are more likely to have an unfavorable
outcome than those with a shorter duration.147, 149, 158, 297, 300, 301 In this survey, however, a
similar number of respondents chose 6-months and 12-months as the threshold duration of
symptoms above which there is a negative impact on outcome. Since there is no definite
consensus, we recommend dividing a patient population into five groups: <3 months, 3-6
months, 6-12 months, 12-24 months and >24 months.
Finally, professionals agreed that a mJOA of 12 was the threshold preoperative severity
below which there is a negative impact on surgical outcome. This score was defined as the cut-
off between moderate and severe patients by Kadanka et al. (2002)103 and Fehlings et al (2013).
However, since each mJOA score may represent a range of severities, especially at the milder
end of the scale, it may be more appropriate to keep this variable as continuous.
Although smoking status was not ranked highly by spine professionals, a large
proportion of the sample indicated that current smoking status is an important predictor of
outcome. Hilibrand et al. (2001) reported that in CSM patients undergoing multilevel
decompression with bone grafting, the rate of solid osseous union was higher in non-smokers
than smokers.302 The impact of smoking on healing, pseudoarthrosis and wound infections,
however, should be further explored to better define why smoking affects outcome. It is
possible that smoking is a surrogate for socioeconomic status, poorer dietary and lifestyle
choices, and reduced access to post-surgical care.
With respect to co-morbidities, professionals agreed the most important predictors
were diabetes, neurological disease including neuromuscular disorders, stroke and paralysis
and psychological issues. Diabetes has been previously reported on as a predictor by four
studies: two indicated that this co-morbidity is not significantly related to outcome,163, 205
whereas two other studies suggested a significant relationship with outcome,124, 303 With
respect to psychological co-morbidities, Kumar et al. (1999) found that patients in a “poor”
outcome group had greater emotional problems than those in a “good” outcome group.206
Kumar et al. (1999) also noted, however, that it was hard to draw conclusions based on patient-

141
generated outcome measures, like the SF-36. The results from this survey should prompt
further study to determine the prognostic value of diabetes, neurological and psychological co-
morbidities.
The most important signs and symptoms, as ranked by the professionals, were related
to gait dysfunction (broad-based unstable gait, impairment of gait and weakness) or hand
clumsiness (atrophy of intrinsic hand muscles, clumsy hands and weakness). This is consistent
with the findings from the literature.149, 166, 201, 304
The presence of a high SI on T2WI was believed to be the most important imaging
predictor. Although the sole presence or absence of a T2 signal change is insignificantly
associated with outcome, a high signal intensity ratio132, 227-229 or a high signal grade133, 212, 224 on
these images have been reported as valuable negative predictors. These characteristics may
define the amount of irreversible histological damage to the spinal cord and therefore may
indicate recuperative potential.
4.4 Results Part B: Important Clinical and Surgical Predictors of Complications
4.4.1 Summary of Respondents
Nine-hundred and sixteen members of AOSpine International completed this survey,
representing a response rate of 15.4% (916/5,934). Geographically, the greatest number of
participants were from Europe (n=263, 28.17%), followed by Asia Pacific (n=227, 24.78%), Latin
America (n=204, 22.27%), North America (n=112, 12.23%), the Middle East (n=89, 9.72%) with
the lowest representation from Africa (n=15, 1.64%). Figure 4-7 displays the geographical
distribution of respondents.
4.4.2 Complications commonly seen in clinical practice
The first question asked clinicians to choose the two most common complications they
see in their surgical practice. The provided options were pseudoarthrosis, C5 radiculopathy,
dysphagia, dural tear, axial pain, wound infection and postoperative kyphosis. For the purpose
of this question, participants who chose one option or more than two were excluded, leaving a
total of 666 answers to analyze. Axial pain (59.01%) and dysphagia (50.30%) were the two

142
complications seen the most frequently in practice. These findings were consistent across all
regions except for Asia Pacific where C5 radiculopathy was more commonly encountered
(40.48%) than dysphagia (38.10%).
Figure 4-7. Geographical Distribution of Survey Participants: Part B Purple: North America; yellow: Latin America; orange: Europe; pink: Africa; blue: Middle East: Asia Pacific. The red flags represent the number of respondents from each country. Any country in Europe with fewer than 5 participants were not flagged but only colored (Austria, Bosnia and Herzegovina, Bulgaria, Croatia, Denmark, Estonia, Hungary, Ireland, Latvia, Malta, Moldova, Montenegro, Norway, Serbia, Slovakia, Slovenia, Sweden and Ukraine). Barbados (n=1) and Jamaica (n=1) are not on the map.
Other regional differences worth highlighting include 1) C5 radiculopathy was more
frequently seen by surgeons from Asia Pacific (40.48%) than those from North America
(24.18%), Europe (24.47%) and Latin America (28.77%); 2) the percentage of participants that
chose dysphagia was the highest in North America (67.03%) and the lowest in Asia Pacific
(38.10%); 3) no professionals from North America selected dural tear as one of the two most
common complications; and 4) postoperative kyphosis was more common in the Middle East
(21.67%) and Europe (15.96%) than in North America (6.59%). (Figure 4-8).

143
4.4.3 Factors predicting complications
According to sixty-six percent of participants, clinical factors are the most important in
predicting complications. Twenty six percent chose surgical factors and a very small proportion
selected imaging factors (8%).
Figure 4-8. Frequently Seen Surgical Complications across Six Geographic Regions The top bar (black) represents the results from the entire sample (n=666). The other five bars reflect responses of professionals from (top to bottom) North America, Asia Pacific, Europe, Latin America and the Middle East. Differences may reflect variations in definitions of complications across centers or surgical preferences.
4.4.4 Significant Clinical Predictors of Complications
Participants were asked to rank age, co-morbidities, gender, smoking status, baseline
severity score and duration of symptoms in terms of their ability to predict complications.
Figure 4-9 shows the distribution of responses for the entire sample. Table 4-6 displays the
mean ranking and mode for each clinical factor for the entire sample and by geographic region.
The presence of co-morbidities and baseline severity score were the two most important
predictors of complications, with mean rankings of 2.45±1.34 and 2.81±1.54, respectively, and
modes of “1”. Gender and smoking status were relatively unimportant predictors as displayed
by higher mean rankings and modes of 5 (34.37%) and 6 (64.75%), respectively. Although age
was scored as the third most important predictor, 59% of the responses were either 1, 2 or 3
16.22
30.03
50.3
6.91
59.01
24.17
13.36
0 10 20 30 40 50 60 70 80
Pseudoarthrosis
C5 Radiculopathy
Dysphagia
Dural Tear
Axial Pain
Wound-infection
Postoperative Kyphosis
Overall (n=666) North America (n=91) Asia Pacific (n=168)
Europe (n=188) Latin America (n=146) Middle East (n=60)

144
while 41% were 4, 5 or 6, making it difficult to draw definite conclusions about its predictive
value.
The presence of co-morbidities was the most important clinical predictor of
complications across all regions except Asia Pacific, where baseline severity score was ranked as
more important (2.45±1.44). The mean ranking for baseline severity score was second in North
America (2.85±1.38), Europe (2.94±1.59) and the Middle East (2.68±1.54), whereas age was
ranked second in Latin America (3.02±1.45). The mode for baseline severity score was 1 across
all regions except for North America, where a greater percentage of participants selected 3
(25.00%). The mean rankings for age did not vary drastically between regions: 3.02±1.45 in
Latin American to 3.17±1.39 in Europe. Duration of symptoms was scored as the third most
important predictor in Asia Pacific (2.98±1.54), Europe (3.10±1.58), and the Middle East
(2.70±1.46) but was ranked as less important by professionals from North America (3.77±1.39,
mode 5). With respect to smoking status, although the mode was 5 across all regions, the mean
ranking in North America (3.76±1.38) and Latin America (3.80±1.42) were lower than in Asia
Pacific (4.54±1.17), Europe (4.25±1.43) and the Middle East (4.46±1.28). Gender was
consistently the least important predictor of complications (5.15±1.29 to 5.58±0.98).
Figure 4-9. Important Clinical Predictors of Postoperative Complications The red bars indicate the five co-morbidities that professionals agreed were the most important predictors of complications.

145
Co-morbidities
Sixty percent of respondents chose severity of co-morbidity, 28% said type of co-
morbidity and 12% selected number of co-morbidities as the most important co-morbidity
predictor of complications. This trend was consistent across all regions.
Table 4-6. Important Clinical Predictors of Postoperative Complications: Results for Entire Sample and each Geographic Region:
Overall (n=902)
North America (n=112)
Asia Pacific (n=222)
Europe (n=259)
Latin America (n=204)
Middle East (n=84)
Age
3.08±1.40 4 (22.06%)
3.07±1.44 2 (25.00%)
3.01±1.32 3 (28.38%)
3.17±1.39 4 (23.94%)
3.02±1.45 2 (22.55%)
3.10±1.51 4 (27.38%)
Co-morbidities
2.45±1.34* 1 (34.04%)
1.97±1.18† 1 (48.21%)
2.62±1.32 1 (27.93%)
2.38±1.32 1 (36.29%)
2.46±1.41 1 (33.82%)
2.67±1.24 3 (34.52%)
Gender 5.29±1.21* 6 (64.75%)
5.58±0.98† 6 (78.57%)
5.39±1.11 6 (67.12%)
5.15±1.29 6 (57.53%)
5.16±1.37 6 (64.71%)
5.39±0.98 6 (61.90%)
Smoking status
4.18±1.38* 5 (34.37%)
3.76±1.38 5 (36.61%)
4.54±1.17 5 (39.19%)
4.25±1.43 5 (32.05%)
3.80±1.42 5 (28.92%)
4.46±1.28 5 (38.10%)
Baseline severity
2.81±1.54* 1 (27.27%)
2.85±1.38 3 (25.00%)
2.45±1.44† 1 (35.59%)
2.94±1.59 1 (24.71%)
3.08±1.62† 1 (23.53%)
2.68±1.54 1 (30.95%)
Duration of symptoms
3.20±1.57* 2 (26.16%)
3.77±1.39† 5 (25.00%)
2.98±1.54† 2 (29.28%)
3.10±1.58 2 (23.94%)
3.47±1.63† 2 (24.02%)
2.70±1.46† 2 (40.48%)
Mean ranking ± standard deviations are presented in the first row. Modes (% of response) are provided in the second row. A * indicates that this mean is significantly higher or lower (p<0.05) than what is expected from chance alone. A † reflects that the mean ranking for this region is significantly higher or lower (p<0.05) than the mean for the overall sample.
Professionals were asked to choose the five most important co-morbidities with respect
to their ability to predict complications (Figure 4-10). For the purpose of this question,
participants who selected less than or more than five choices were excluded, leaving a total of
806 answers to analyze. The most frequently selected co-morbidity was diabetes which was
chosen by 83.13% of the sample. Respiratory disorders (59.43%), angina/coronary artery
disease (42.43%), rheumatologic issues (42.18%) and myocardial infarct (39.95%) were the next
most important co-morbidities. On the other hand, diseases of the pancreas (0.5%), stomach or
intestine (2.11%) and liver (14.27%) do not increase the risk of complications. In addition,
specific cardiovascular diseases such as venous disease (9.93%), arrhythmia (12.03%),
hypertension (18.36%) and peripheral arterial disease (20.33%) were rated as less important
predictors.

146
Diabetes (77.09% in Europe to 87.94% in Asia Pacific) and respiratory disorders (40% in Middle
East to 66.12% in Latin America) were rated as important predictors of complications across all regions.
All regions also included angina/coronary artery disease in their top-five lists except for the Middle East
where more participants chose myocardial infarct (44%). Forty-six percent of respondents from North
America and Asia Pacific suggested that patients with renal dysfunction are at an increased risk of
surgical complications. Rheumatologic and neuromuscular disorders were included in the top-five lists of
European and Middle Eastern respondents.
Figure 4-10. Co-morbidities Professionals agree Increase the Risk of Postoperative Complications The red bars indicate the five co-morbidities that professionals agreed were the most important predictors of complications.
Given the predictive value of diabetes, a secondary question was developed to
determine which specific complications are more prevalent in diabetics. Based on Figure 4-11,
professionals agreed that patients with diabetes are more likely to experience cardiac
complications (69.75%) and wound infections (95.07%). Fifty-eight percent of the sample also
said that non-unions are more common in diabetic patients. In contrast, respondents believed
that complications such as extensive bleeding (84.66%), C5 radiculopathy (71.95%) and
dysphagia (80.31%) are equally likely in patients with and without diabetes. A less convincing

147
portion of the sample (62.5%) stated that rates of respiratory complications are similar
between patient groups.
Participants from all regions agreed that patients with diabetes are at a greater risk of
wound infections postoperatively (92.34%-98.2%). The majority of respondents from each
region also believed that diabetics are at a higher risk of cardiac complications, although there
was a greater range of percentages (60% in Latin America to 82.41% in North America).
Compared to other regions, a significantly larger percent of professionals from the Middle East
(44%) said that C5 radiculopathy was more common in patients with diabetes. Finally, there
were conflicting responses with respect to non-unions: 63% of North Americans said this
complication was equally common in patients with and without diabetes, whereas 62% and
68% of Latin Americans and Middle Easterns believed non-unions were more prevalent in
diabetics.
Figure 4-11. Differences in Specific Complications between Diabetic and Non-diabetic Patients
Threshold Age
Fifty percent of participants selected 65 as the threshold age above which there is an
increased risk of postoperative complications. Twenty percent chose 60 years and 13% believed
that there was no threshold. Finally, 11% responded “other,” with the majority specifying either
70 (37%), 75 (42%) or 80 (14%) years. Six percent, however, either specified that physiological
69.75
95.07
57.55
80.31
84.66
71.95
62.5
0 10 20 30 40 50 60 70 80 90 100
Dysphagia (n=828)
Extensive Bleeding (n=828)
Cardiac Complications (n=833)
Wound Infections (n=892)
C5 Radiculopathy (n=827)
Respiratory Complications (n=832)
Non-union (n=841)
No Yes
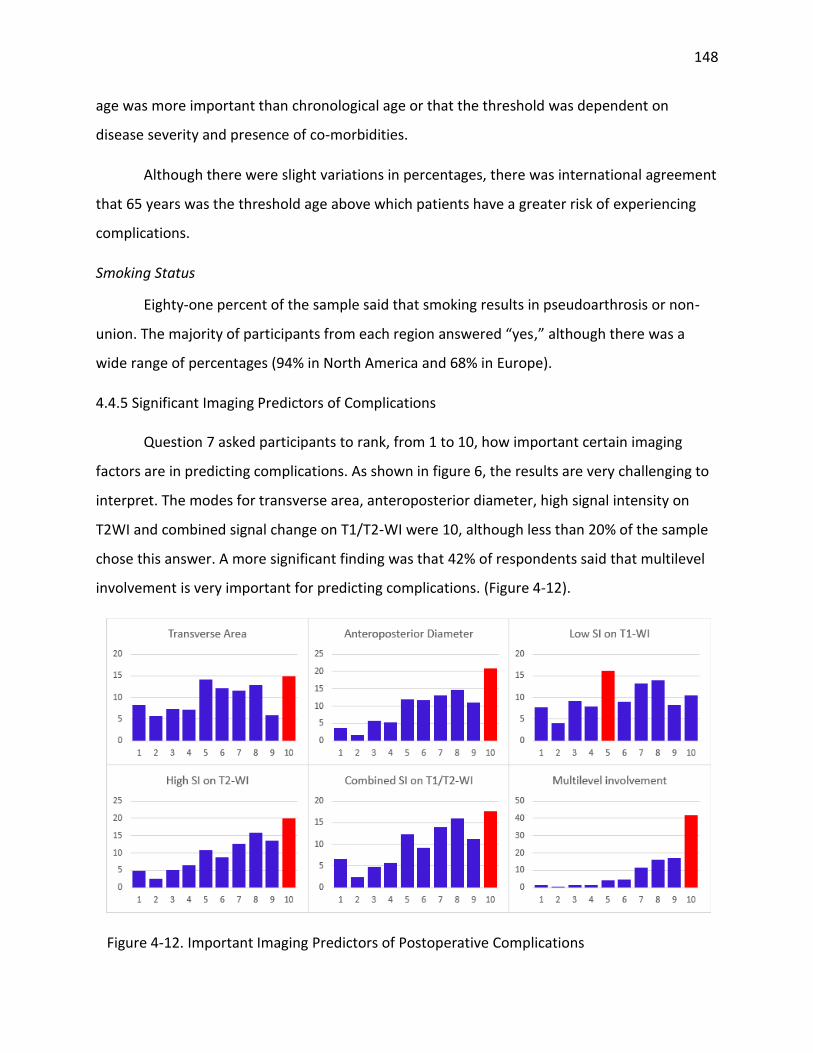
148
age was more important than chronological age or that the threshold was dependent on
disease severity and presence of co-morbidities.
Although there were slight variations in percentages, there was international agreement
that 65 years was the threshold age above which patients have a greater risk of experiencing
complications.
Smoking Status
Eighty-one percent of the sample said that smoking results in pseudoarthrosis or non-
union. The majority of participants from each region answered “yes,” although there was a
wide range of percentages (94% in North America and 68% in Europe).
4.4.5 Significant Imaging Predictors of Complications
Question 7 asked participants to rank, from 1 to 10, how important certain imaging
factors are in predicting complications. As shown in figure 6, the results are very challenging to
interpret. The modes for transverse area, anteroposterior diameter, high signal intensity on
T2WI and combined signal change on T1/T2-WI were 10, although less than 20% of the sample
chose this answer. A more significant finding was that 42% of respondents said that multilevel
involvement is very important for predicting complications. (Figure 4-12).
Figure 4-12. Important Imaging Predictors of Postoperative Complications

149
4.4.6 Significant Surgical Predictors of Complications
Anterior versus Posterior
Participants were asked whether complications are more prevalent following anterior or
posterior surgery or if there is no difference between the two approaches. Forty percent
responded posterior, 29% anterior and 30% said rates are the same. Perceptions varied across
regions: 45% of Europeans and North Americans chose posterior, while only 33% of
respondents from Asia Pacific selected this option. In fact, a larger percentage of professionals
from Asia Pacific argued complications rates were higher following anterior surgery (37%)
(Table 4-7).
Table 4-7. Complication Rates in Anterior vs. Posterior Surgery
Anterior Posterior Same
Overall (n=899) 29.48%* 40.38%* 30.14%*
North America (n=110) 18.18%† 45.45% 36.36%
Asia Pacific (n=222) 36.94%† 33.33%† 29.73%
Europe (n=259) 23.94%† 45.17% 30.89%
Latin America (n=202) 32.67% 38.61% 28.71%
Middle East (n=85) 35.29% 37.65% 27.06%
A * indicates that this percentage is significantly higher or lower (p<0.05) than what is expected from chance alone. A † reflects that the percentage of responses for this region is significantly higher or lower (p<0.05) than the percentage for the overall sample.
Professionals agreed that the types of complications seen in posterior and anterior
surgery are very different: 1) dysphagia (97%) and adjacent segment degeneration (57%) are
more common following anterior surgery; and 2) wound infections (71.48%), axial pain
(64.57%), C5 radiculopathy (59.42%), dural tear (51.85%) and instability (50.9%) are associated
with the posterior approach. There was no consensus whether rates of pseudoarthrosis differ
between anterior (40%) and posterior surgery (36%) (Figure 4-13).
1-Stage versus 2-Stage Surgery
Fifty six percent of respondents said that complications are more prevalent in a 2-stage
anteroposterior surgery than in a single stage anterior or posterior procedure. There was
international agreement (Table 4-8).

150
Figure 4-13. Differences in Specific Complications between Anterior and Posterior Surgery Error bars represent 95% confidence intervals of the proportion of response. Overlapping error bars indicate proportions are not significantly different from one another. All proportions were significantly different (p<0.05) than what is expected from chance alone except for “same” for adjacent segment degeneration and instability and “posterior” for pseudoarthrosis.
Table 4-8. Complication Rates in 1-Stage vs. 2-Stage Surgery
1-stage 2-stage Same
Overall (n=886) 18.96%* 55.76%* 25.28%*
North America (n=111) 11.71% 61.26% 27.03%
Asia Pacific (n=217) 29.03%† 47.00%† 23.96%
Europe (n=253) 14.62% 56.52% 28.85%
Latin America (n=199) 16.08% 61.81% 22.11%
Middle East (n=86) 18.60% 56.98% 24.42%
A * indicates that this percentage is significantly higher or lower (p<0.05) than what is expected from chance alone. A † reflects that the percentage of responses for this region is significantly higher or lower (p<0.05) than the percentage for the overall sample.
Laminectomy and Fusion versus Laminoplasty
Respondents were asked whether complications are more prevalent following
laminectomy and fusion or laminoplasty surgery or if rates are similar between these posterior
techniques. Forty-four percent selected laminectomy and fusion, 20% laminoplasty and 27%
said rates are the same. Perceptions varied across regions: 45% and 43% of surgeons from
North America and Europe, respectively, said there was no difference in complication rates

151
between laminectomy with fusion and laminoplasty. Fifty-two percent of participants from Asia
Pacific, however, said patients undergoing laminectomy with fusion are at a higher risk of
complications than those treated by laminoplasty (Table 4-9).
Table 4-9. Complication Rates between Laminectomy with Fusion and Laminoplasty
Laminectomy and Fusion
Laminoplasty Same
Overall (n=895) 43.69%* 19.66%* 36.65%
North America (n=111) 32.43%† 22.52% 45.05%
Asia Pacific (n=222) 52.25%† 13.51%† 34.23%
Europe (n=256) 37.89% 19.53% 42.58%†
Latin America (n=198) 44.44% 26.26%† 29.29%†
Middle East (n=87) 52.87% 17.24% 29.89%
A * indicates that this percentage is significantly higher or lower (p<0.05) than what is expected from chance alone. A † reflects that the percentage of responses for this region is significantly higher or lower (p<0.05) than the percentage for the overall sample.
With respect to specific complications, professionals believed that 1) instability is more
common following laminoplasty (59.89%); 2) pseudoarthrosis is more prevalent after
laminectomy and fusion (51.55%); and 3) there is no difference in rates of dysphagia (86.07%),
wound infections (71.62%), dural tear (60.34%) or C5 radiculopathy (52.23%) between patients
treated with laminoplasty versus laminectomy with fusion. Fifty percent of participants agreed
adjacent segment degeneration is more common in laminectomy and fusion, whereas 40% said
there is no difference between techniques. Forty-five percent of professionals reported no
difference in rates of axial pain between laminectomy with fusion and laminoplasty. However,
36% argued this complication is higher in laminoplasty (Figure 4-14).
Number of Levels
Fifty-six percent of participants selected three as the threshold number of operative
levels above which there is an increased risk of complications. Thirty-four percent chose greater
than four levels while only 10% selected two as the threshold. There was international
agreement.

152
Figure 4-14. Differences in Specific Complications between Laminectomy with Fusion and Laminoplasty Error bars represent 95% confidence intervals of the proportion of response. Overlapping error bars indicate proportions are not significantly different from one another. All proportions were significantly different (p<0.05) than what is expected from chance alone.
Fusion versus Non-fusion
Participants were asked whether complications are more common following fusion or
non-fusion surgery or if rates were similar between procedures. Thirty-seven percent of the
entire sample selected fusion, 36% non-fusion and 27% said rates are the same. Fifty-one
percent and 48% of respondents from North America and Asia Pacific, respectively, said
complications are more common in fusion surgery. Fifty-one percent of participants from the
Middle East believed non-fusion is associated with a higher risk of complications (Table 4-10).
Table 4-10. Complication Rates between Fusion and Non-Fusion Surgery
Fusion Non-Fusion Same
Overall (n=896) 37.17%* 35.83% 27.01%*
North America (n=111) 51.35%† 18.02%† 30.63%
Asia Pacific (n=222) 47.75%† 30.63% 21.62%
Europe (n=256) 27.73%† 39.06% 33.20%†
Latin America (n=199) 31.66% 41.21% 27.14%
Middle East (n=87) 32.18% 50.57%† 17.24%†
A * indicates that this percentage is significantly higher or lower (p<0.05) than what is expected from chance alone. A † reflects that the percentage of responses for this region is significantly higher or lower (p<0.05) than the percentage for the overall sample.

153
Respondents agreed that the types of complications seen in fusion compared to non-
fusion surgery are very different: 1) instability (80.9%) and axial pain (50.85%) are more
commonly seen in surgery without fusion; and 2) adjacent segment degeneration (65.99%),
instrumentation migration (57.16%), non-union (51.81%) and pseudoarthrosis (55.77%) are
associated with fusion surgery (Figure 8).
Figure 4-15. Differences in Specific Complications between Fusion and Non-Fusion Surgery Error bars represent 95% confidence intervals of the proportion of response. Overlapping error bars indicate proportions are not significantly different from one another. All proportions were significantly different (p<0.05) than what is expected from chance alone except for “non-fusion” for pseudoarthrosis and instability.
4.4.7 Discussion
This study investigates what spine professionals perceive as the most important clinical
and surgical predictors of complications in patients with CSM. Our findings provide insight on
international surgical preferences and how clinicians worldwide anticipate complications. This
knowledge will be used to guide the development of our preliminary complications prediction
model that can quantify a patient’s risk of complications and provide surgeons with a tool to
accurately convey this information to their patients during the surgical consent discussion.
Furthermore, surgeons should be encouraged to design case-specific preventive strategies for
their high-risk patients and ensure adequate monitoring during the perioperative period.

154
It is important to compare our survey results with existing evidence to identify where
there may be gaps between professional opinion and findings in the literature. There are
certain limitations in the methodology of previous complication studies that may account for
discrepancies between surgeons’ perceptions and results from primary research. These include
1) complication rates in prospective studies are generally higher than in retrospective studies;
2) studies where complications are recorded by surgeons have lower rates than studies where
research coordinators are responsible for data collection; and 3) it is unclear what actually
constitutes a complication and how to distinguish between minor and major events. In the
study by Fehlings et al (2013), all adverse events were collected throughout the study period
and then adjudicated by a central panel of investigators as either related to CSM, related to
surgery or unrelated.115 This likely represents the most consistent, unbiased and
comprehensive method of identifying complications in this surgical cohort. However, the
heterogeneity of complications and regional variations in definitions may still affect data
collection and reporting. In the absence of strong literature on this subject, assessment of
professional opinion provides an effective means to determine, discover and evaluate
predictors of complications.
Clinical Predictors
Based on our survey, spine professionals agreed the most important clinical predictor of
complications is the presence of co-morbidities, with severity being more relevant than number
and type of disease. The predictive value of co-morbidities has been assessed by three previous
studies.115, 140, 305 According to Boakye et al (2008), patients with three or more co-morbidities
are twice (95% C.I.: 1.59-2.48) as likely to experience a complication following spinal fusion than
healthy individuals.305 Although a significant finding, this analysis only examined number of co-
morbidities and not severity or type of disease. In a second study, Fehlings et al (2012)
developed a scoring system that summated severity (mild=1, moderate=2, severe=3) across
eight co-morbidity categories, including cardiovascular, neurological and psychiatric
disorders.115 This study found no significant difference in the co-morbidity score of patients
who did and did not suffer a major or minor perioperative complication. In a final study, the
Charlson co-morbidity index was reported as an insignificant predictor of complications.140 Our

155
survey results identify a clear gap between surgeons’ perceptions of predictors and existing
evidence on this topic. Interestingly, the retrospective and prospective studies reported
different associations between co-morbidities and complications.
The diabetes question was designed based on results from previous lumbar spine
studies and a single study by Cook et al (2008) in CSM patients.241, 291-294 According to our
survey, professionals agreed that patients with diabetes are at a higher risk of cardiac
complications and wound infections. These results are consistent with the literature: diabetic
patients are 1.57 (95% C.I.: 1.14-2.16) times more likely to experience complications than
healthy individuals and those with uncontrolled disease are at a 7.46 (95% C.I.: 1.33-47.79)
times greater risk of postoperative infection than patients with controlled diabetes.241
Therefore, the association between diabetes and complications is likely dependent on how well
this co-morbidity is managed; patients with poor glycemic control may be at a higher risk. In
lumbar spine surgery, non-unions were more frequent in patients with diabetes.291 Although
not a convincing majority, 58% of professionals argued that diabetics have higher rates of non-
unions following surgery for CSM.
Age was ranked as the third most important predictor of complications. However, a
score of 3.08±1.40 is not significantly different than what is expected from chance alone.
According to existing literature (two prospective, 1 retrospective study), age is associated with
postoperative complications.115, 140, 305 The rationale behind this finding is that older patients 1)
are more likely to have substantial degenerative pathology and, as such, will require a more
complex surgery; 2) typically have an increased number of co-morbidities; 3) are less tolerant to
surgery; and 4) have reduced physiological reserves to face physical assault.306 In general, older
age is associated with an increased risk of complications; however clinicians must consider a
patient’s physiological age and co-morbidities when evaluating this risk.
Baseline severity score was ranked as an important clinical predictor of complications.307
This finding is inconsistent with results from the prospective AOSpine North American
complications study that reported no association between baseline mJOA score and minor or
major perioperative complications.115 In contrast, baseline severity score is one of the most
156
significant predictors of functional status and neurological outcomes following surgery.308 As a
result, surgeons may perceive myelopathy severity as a significant predictor of complications.
However, there is insufficient evidence in the literature supporting this consensus.
Finally, the majority of surgeons agreed that smoking negatively impacts the healing
process and leads to pseudoarthrosis or non-union. This finding is consistent with results from a
single study by Hilibrand et al (2001): in patients with CSM undergoing multilevel
decompression and interbody grafting, the rate of solid osseous union was higher in
nonsmokers than smokers.302 However, in the AOSpine North America complications study,
there was no difference in rates of complications between smokers and non-smokers.115
Further research is required to evaluate whether smoking is indeed a predictor of
complications.
Surgical Predictors
This survey also aimed to identify significant surgical predictors of complications and
determine relative risks of various approaches and techniques. Patients with CSM may be
treated anteriorly or posteriorly or may undergo a 2-stage circumferential surgery. The
approach chosen by the attending surgeon is dependent on location of compressive forces,
extent of degeneration, age, sagittal alignment, presence of radiculopathy or axial pain and
surgeon’s familiarity with technique.106 With respect to complications, 40% of participants
agreed that complications are more frequent following posterior surgery than anterior surgery.
These results were inconclusive as 30% of professionals specified that rates of complications
are similar in anterior and posterior surgery. It is unlikely that respondents considered
variations in age, extent of pathology and myelopathy severity between approach groups when
selecting their answer. In previous studies, Fehlings et al (2012, 2013) and Ghogawala et al
(2011) reported similar complication rates between patients treated anteriorly and those
treated posteriorly.107, 115, 268 However, these analyses did not necessarily control for significant
confounders (e.g. age and operative duration) and, as a result, comparisons between approach
groups are subject to bias.

157
In our survey, there was agreement that types of complications significantly differ
between surgical approaches. For example, surgeons specified that rates of dysphagia and
adjacent segment degeneration are higher in anterior surgery and wound infections, axial pain,
C5 radiculopathy, dural tears and instability are more common following posterior surgery.
Based on literature findings, there are no significant differences between approaches with
respect to rates of new neurological deficits, C5 radiculopathy or surgical, medical and
irreversible complications.107, 115, 268, 309 In a study by Kristof et al (2009), patients treated by
anterior corpectomy were more likely to experience dysphagia than patients treated by
posterior laminectomy and fusion.309 This finding could not be confirmed by the AOSpine North
America prospective complications study conducted by Fehlings et al (2012); however, wound
infections occurred at a higher frequency in the posterior group (4.7%) than in the anterior
group (0.6%). Evidently, there is little consensus in the literature as to differences in rates of
complications and types of complications between anterior and posterior procedures.
There was consensus that 2-stage circumferential surgery is associated with a higher risk
of complications than either a single-stage anterior or posterior surgery. This conclusion is
supported by Fehlings et al (2012): patients undergoing a combined anteroposterior operation
were 5.3 times (95% C.I.: 1.63-17.26) more likely to experience a major complication
perioperatively than patients treated with a single stage procedure.115 Forty-four percent of
participants either selected higher risk in 1-stage surgery or equal risk between the two
techniques. Given that patients treated with a 2-stage surgery likely have more complex
degenerative pathology, it seems intuitive that this procedure would be associated with higher
risks. These results confirm there is substantial variability in surgeons’ perceptions of surgical
risks and likely inconsistency across clinicians in terms of the information they convey to their
patients.
Forty-four percent of professionals agreed complications are more frequent in
laminectomy with fusion than in laminoplasty. However, 37% argued there is no significant
difference in complication rates between these posterior techniques. According to the
literature, there is no difference between the two groups with respect to overall complication
rates and rates of wound infection, dysphagia, neck pain, cerebrospinal leakage, kyphosis and

158
re-stenosis.115, 276, 310 In addition, in a prospective study by Fehlings et al (2012), there was no
difference in the incidence of C5 radiculopathy between patients undergoing laminectomy with
fusion and those treated by laminoplasty.115 In our survey, surgeons believed instability is more
common following laminoplasty than laminectomy with fusion, likely because fusion is used to
stabilize the spine. This difference of perception is likely due to differences in surgical
preferences and varying skill levels for each procedure.
There were international variations in responses that may reflect regional differences in
management strategies, surgical preferences or expertise and patient demographics. In the
AOSpine International study, the majority of patients from Europe, Asia Pacific and North
America were treated anteriorly, whereas Latin American surgeons preferred the posterior
approach. Interestingly, in our survey, professionals from Asia Pacific specified that patients
undergoing anterior surgery are at a higher risk of complications than those treated posteriorly.
With respect to posterior surgeries, East Asian surgeons likely prefer posterior laminoplasty as
this technique was developed in Japan to address the limitations of laminectomy. Five studies
specifically compared complication rates between anterior decompression and laminoplasty; of
these, four were conducted at sites in Japan and one at a center in China.11, 270, 271, 273, 311 Two
reported a higher incidence of complications in the anterior group than in the laminoplasty
group.11, 311 Specific complications, were not significantly different between groups, including
C5 palsy, bone graft complications and donor site morbidities.273 Professionals from Asia Pacific
also reported higher rates of complications in laminectomy with fusion than in laminoplasty;
this result likely reflects surgical preferences in Asia Pacific. Surgeons from North America and
Latin America agreed complications were more common in fusion surgery than non-fusion
procedures; however, due to increased instability and post-laminectomy kyphosis in non-fusion
surgery, fusion is generally performed to counter these complications.
The results from this study provide insight as to what surgeons’ perceive as the most
important clinical and surgical predictors of complications. Evidently, there is discrepancy
between professional opinion and literature findings, and, in some cases, differences in
perceptions among surgeons. Future prospective cohort studies are required to address this
controversy and properly identify the most significant predictors of complications.
159
Chapter 5: An Overview of the AOSpine CSM-North America and
International Studies
5.1 Introduction
This chapter provides an overview of the AOSpine CSM-North America and International
studies. Both studies were primarily undertaken to evaluate the impact of surgery on
neurological outcomes, functional status and quality of life and to assess its value across the full
range of myelopathy severity. The other primary objective of these studies was to observe
differences in demographics, complications and outcomes between patients treated anteriorly
and those treated posteriorly. These studies also had multiple secondary aims including to
assess differences between laminectomy with fusion and laminoplasty; to identify correlations
between preoperative MRI parameters and baseline clinical examination; and, in the CSM-
International study, to ascertain regional differences in disease causation, patient
demographics, surgical preferences and outcomes.
5.2 Study Design and Inclusion Criteria
Both studies were prospective, multicenter cohort studies that followed patients from
their preoperative visit to 2-years after surgery. A randomized control trial was not feasible in
this patient population; given there is increasing evidence to suggest surgery is effective, it
would be unethical to deny patients surgery for the purpose of this study.
Participating centers were selected following an open call by AOSpine and were
subsequently evaluated to ensure capacity to conduct prospective research, subject availability
and presence of experienced research personnel. All sites were either academic centers or high
volume private practices. Investigators were orthopedic or neurosurgeons who specialized in
spine. Ethical approval was obtained from the internal review boards at all participating sites.
From December 2005 to September 2007, 278 consecutive patients with clinically
diagnosed and image-confirmed CSM were enrolled in the AOSpine CSM-North America study
at one Canadian and 11 American sites. Patients were eligible for this study if they were
referred for surgical consultation to a site’s orthopaedic or neurosurgery department and if

160
they satisfied the following inclusion criteria: i) aged 18 years or older; ii) presenting with
symptomatic CSM with at least one clinical sign of myelopathy; iii) image evidence of spinal
cord compression; and iv) no previous spine surgery. Our definition of CSM was all-
encompassing and included patients with cervical myelopathy secondary to either spondylosis,
disc herniation, OPLL, hypertrophy of the ligamentum flavum, subluxation or a combination of
these degenerative changes. Patients were excluded if they were asymptomatic or if they had
active infection, neoplastic disease, rheumatoid arthritis, trauma, ankylosing spondylitis and
concomitant lumbar stenosis. Full inclusion and exclusion criteria are provided in Table 5-1.
Written consent was obtained for each subject who verbally agreed to participate in this study.
Table 5-1. Inclusion and Exclusion Criteria for Participation in the CSM-North America and CSM-
International Studies
Inclusion Criteria: Subject… Exclusion Criteria: Subject…
Was referred for surgical consultation with symptomatic CSM
Has asymptomatic CSM, active infection, neoplastic disease, rheumatoid arthritis, ankylosing spondylitis, trauma, concomitant lumbar stenosis
Is able and willing to give consent to participate in study
Is a pregnant woman or planning to get pregnant during the study period
Is able and willing to comply with postoperative management program
Has a history of substance abuse (recreational drugs, alcohol)
Can understand and read English at an elementary level
Is a prisoner
>18 years of age Is currently involved in a study with similar purpose
Has one or more of the following symptoms of CSM: Numb hands Clumsy hands Impaired gait Bilateral arm paresthesia L’Hermitte’s phenomena Weakness
Has a disease process that would preclude accurate evaluation (e.g. neuromuscular disorders, significant psychiatric disease)
And one or more of the following signs: Corticospinal distribution motor deficits Atrophy of intrinsic hand muscles Hyperreflexia Positive Hoffman sign Upgoing plantar responses Lower limb spasticity Broad-based unstable gait
Previous surgery for CSM
CSM: cervical spondylotic myelopathy
The recruitment process and inclusion and exclusion criteria for the CSM-International
study were the same as for the North American study. Between October 2007 to January 2011,
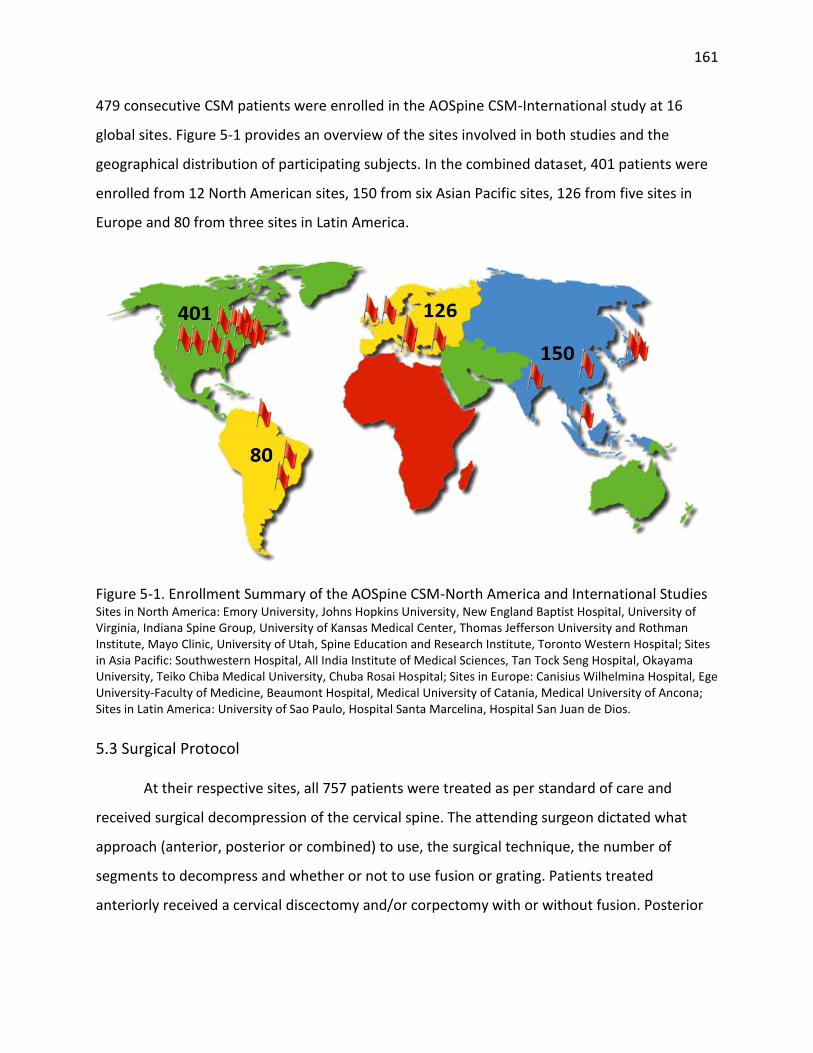
161
479 consecutive CSM patients were enrolled in the AOSpine CSM-International study at 16
global sites. Figure 5-1 provides an overview of the sites involved in both studies and the
geographical distribution of participating subjects. In the combined dataset, 401 patients were
enrolled from 12 North American sites, 150 from six Asian Pacific sites, 126 from five sites in
Europe and 80 from three sites in Latin America.
Figure 5-1. Enrollment Summary of the AOSpine CSM-North America and International Studies Sites in North America: Emory University, Johns Hopkins University, New England Baptist Hospital, University of Virginia, Indiana Spine Group, University of Kansas Medical Center, Thomas Jefferson University and Rothman Institute, Mayo Clinic, University of Utah, Spine Education and Research Institute, Toronto Western Hospital; Sites in Asia Pacific: Southwestern Hospital, All India Institute of Medical Sciences, Tan Tock Seng Hospital, Okayama University, Teiko Chiba Medical University, Chuba Rosai Hospital; Sites in Europe: Canisius Wilhelmina Hospital, Ege University-Faculty of Medicine, Beaumont Hospital, Medical University of Catania, Medical University of Ancona; Sites in Latin America: University of Sao Paulo, Hospital Santa Marcelina, Hospital San Juan de Dios.
5.3 Surgical Protocol
At their respective sites, all 757 patients were treated as per standard of care and
received surgical decompression of the cervical spine. The attending surgeon dictated what
approach (anterior, posterior or combined) to use, the surgical technique, the number of
segments to decompress and whether or not to use fusion or grating. Patients treated
anteriorly received a cervical discectomy and/or corpectomy with or without fusion. Posterior

162
surgeries included laminoplasty or laminectomy with or without fusion. In certain complex
cases, patients were treated with a 2-stage circumferential procedure.
5.4 Data Collection
Using pre-designed case report forms, extensive data was obtained for each patient at
baseline and at 6, 12 and 24 months following surgery, including demographics, surgical
summary, imaging and clinical assessment, medical history and previous conservative
treatments. Functional status and patient reported quality of life were evaluated at each visit
using a variety of scales such as the mJOA, Nurick, NDI, SF-36 and 30-meter walking test.
An AO Clinical Investigation & Documentation representative was responsible for
monitoring these studies and ensuring that data was authentic, accurate and complete and that
the study was conducted in accordance with the protocol. Data was entered into electronic
case report forms through a secure electronic database system and was processed at the
AOSpineNet central data management centre. Data entry was validated by visual inspection
and database programming.
5.4.1 Clinical Variables
Table 5-2 summarizes some of the clinical variables collected as part of the AOSpine
studies. The ones included in this table are relevant to analyses presented in future chapters.
Table 5-2. A Summary of Relevant Clinical Variables collected as part of the CSM-North America
and International Studies
Clinical Variable Summary
Age (Continuous) Age in years at time of surgery
Gender (Male/Female)
-
Body Mass Index (Continuous)
𝐵𝑀𝐼 =𝑚𝑎𝑠𝑠 (𝑘𝑔)
(ℎ𝑒𝑖𝑔ℎ𝑡(𝑚))2
Duration of symptoms (5 categories)
Time between onset of symptoms and surgical intervention: 1: Duration ≤ 3 months 2: 3 months < Duration ≤ 6 months 3: 6 months ≥ Duration ≤ 12 months 4: 12 months ≥ Duration ≤ 24 months 5: Duration > 24 months

163
Co-morbidities (Present/Absent)
For each co-morbidity category, patients were classified as grade 1 (mild decompensation), grade 2 (moderate decompensation) or grade 3 (severe decompensation).
Cardiovascular (Present/Absent)
Myocardial infarct Grade 1: -Old MI by ECG only, age undetermined
Grade 2: -MI>6 months ago
Grade 3: -MI≤6 months ago
Angina/Coronary artery disease
Grade 1: -ECG or stress test evidence or catheterization evidence of coronary disease without symptoms -Angina pectoris not requiring hospitalization -CABG or PTCA (>6 months) -Coronary stent (>6 months)
Grade 2: -Chronic exertional angina -Recent CABG or PTCA (≤6 months) -Recent coronary stent (≤6 months)
Grade 3: -Unstable angina
Congestive heart failure
Grade 1: -CHF with dyspnea which has responded to treatment -Exertional dyspnea -Paroxysmal nocturnal dyspnea
Grade 2: -Hospitalized for CHF>6 months prior -CHF with dyspnea which limits activities
Grade 3: -Hospitalized for CHF within the past 6 months -Ejection fraction <20%
Arrhythmias Grade 1: -Sick Sinus Syndrome
Grade 2: -Ventricular arrhythmia >6 months -Chronic atrial fibrillation or flutter -Pacemaker
Grade 3: -Ventricular arrhythmia ≤6 months
Hypertension Grade 1: -DBP 90-114 mmHg while not taking antihypertensive medications -DBP<90 mmHg while taking antihypertensive medications -Hypertension, not otherwise specified
Grade 2: -DBP 115-129 mmHg -DBP 90-114 mmHg while taking antihypertensive medications -Secondary cardiovascular symptoms: vertigo, epistaxis, headaches
Grade 3: -DBP≥130 mmHg -Severe malignant papilledema or other eye changes -Encephalopathy
Venous disease Grade 1: -Old DVT no longer treated with Coumadin or Heparin
Grade 2: -DVT controlled with Coumadin or heparin -Old PE>6 months
Grade 3: -Recent PE (≤6 months) -Use of venous filter for PEs
Peripheral arterial disease
Grade 1: -Intermittent claudication -Untreated thoracic or abdominal aneurysm (<6 cm) -S/p abdominal or thoracic aortic aneurysm repair
Grade 2: -Bypass or amputation for gangrene or arterial insufficiency >6 months ago -Chronic insufficiency
Grade 3: -Bypass or amputation for gangrene or arterial insufficiency <6 months ago. -Untreated thoracic or abdominal aneurysm (≥6 cm)

164
Respiratory (Present/Absent)
Grade 1: -Restrictive lung disease or COPD with dyspnea which has responded to treatment -FEV1 (66%-80%)
Grade 2: -Restrictive lung disease or COPD† with dyspnea which limits activities. -FEV1 (51%-65%)
Grade 3: -Marked pulmonary insufficiency. -Restrictive lung disease or COPD† with dyspnea at rest despite treatment. -Chronic supplemental O2
-CO2 retention (pCO2 > 50 torr) -Baseline pO2 <50 torr -FEV1 (<50%)
Gastrointestinal (Present/Absent)
Hepatic Grade 1: -Chronic hepatitis or cirrhosis without portal hypertension -Acute hepatitis without cirrhosis -Chronic liver disease manifested on biopsy or persistently elevated bilirubin (>3mg/dl)
Grade 2: -Chronic hepatitis, cirrhosis, portal hypertension with moderate symptoms “compensated hepatic failure”
Grade 3: -Portal hypertension and/or esophageal bleeding ≤6 months (encephalopathy, ascites, jaundice with total bilirubin >2)
Stomach/Intestine Grade 1: -Diagnosis of ulcers treated with medications -Chronic malabsorption syndrome -Inflammatory bowel disease on medication or h/o with complications and/or surgery
Grade 2: -Ulcers require surgery or transfusion of <6 units of blood
Grade 3: -Recent ulcers ≤6 months requiring ≥6 units of blood transfusion
Pancreas Grade 1: -Chronic pancreatitis without complications
Grade 2: -Uncomplicated acute pancreatitis -Chronic pancreatitis with minor complications*
Grade 3: -Acute or chronic pancreatitis with major complications**
End-stage renal disease (Present/Absent)
Grade 1: -Chronic renal insufficiency with creatinine 2-3mg%
Grade 2: -Chronic renal insufficiency with creatinine>3mg% -Chronic dialysis
Grade 3: -Creatinine >3mg% with multi-organ failure, shock or sepsis -Acute dialysis
Diabetes (Present/Absent)
Grade 1: -AODM controlled by oral agents only
Grade 2: -IDDM without complications -Poorly controlled AODM
Grade 3: -Hospitalization ≤6 months for DKA -Diabetes causing end-organ failure
Psychiatric (Present/Absent)
Grade 1: -Major depression or bipolar disorder controlled with medication
Grade 2: -Major depression or bipolar disorder uncontrolled
Grade 3: -Recent suicidal attempt -Active schizophrenia

165
-Schizophrenia controlled with medication
Rheumatologic (Present/Absent)
Grade 1: -Connective tissue disorder on NSAIDS or no treatment
Grade 2: -Connective tissue disorder on steroids or immunosuppressant medications
Grade 3: -Connective tissue disorder with secondary end-organ failure
Neurological (Present/Absent)
Stroke Grade 1: -Stroke with no residual -Past or recent TIA
Grade 2: -Old stroke with neurologic residual
Grade 3: -Acute stroke with significant neurologic deficit
Paralysis Grade 1: -Paraplegia or hemiplegia, ambulatory and providing most of self-care
Grade 2: -Paraplegia or hemiplegia requiring wheelchair, able to do some self-care
Grade 3: -Paraplegia or hemiplegia requiring full support for activities of daily living
Neuromuscular disorders
Grade 1: -MS, Parkinson’s, Myasthenia Gravis, or other chronic neuromuscular disorder, but ambulatory and providing most of self-care
Grade 2: -MS, Parkinson’s, Myasthenia Gravis, or other chronic neuromuscular disorder, but able to do some self-care
Grade 3: -MS, Parkinson’s, Myasthenia Gravis, or other chronic neuromuscular disorder and requiring full support for activities of daily living
Number of co-morbidities (Continuous)
Number of co-existing medical illnesses
Co-morbidity score (Continuous)
Grade 1/mild=1, Grade 2/moderate=2, Grade 3/severe=3: summate disease severity across all co-morbidity categories. If severity was unknown for a particular co-morbidity, a ‘1’ was designated.
Signs (Present/Absent)
Corticospinal distribution motor deficits
Motor paralysis or weakness
Atrophy of intrinsic hand muscles
Thenar and hypothenar muscle wasting
Hyperreflexia Overactive or overresponsive reflexes
Positive Hoffman sign When tapping the nail or flicking the terminal phalanx of the middle or ring finger elicits flexion of the terminal phalanx of the thumb
Babinski Sign When stimulating the sole of the foot with a blunt instrument elicits extension of the hallux
Lower limb spasticity Increased, involuntary, velocity-dependent muscle tone of the lower limbs that causes resistance to motion
Broad-based, unstable gait
A staggering gait in which the patient walks with a wide base
Symptoms (Present/Absent)
Numb hands Loss of sensation or feeling in hands or fingers
Clumsy hands Lacking dexterity and fine motor movements in hands
Impairment of gait Any dysfunction in walking
Bilateral arm paresthesia
Nonspecific numbness and tingling in both arms
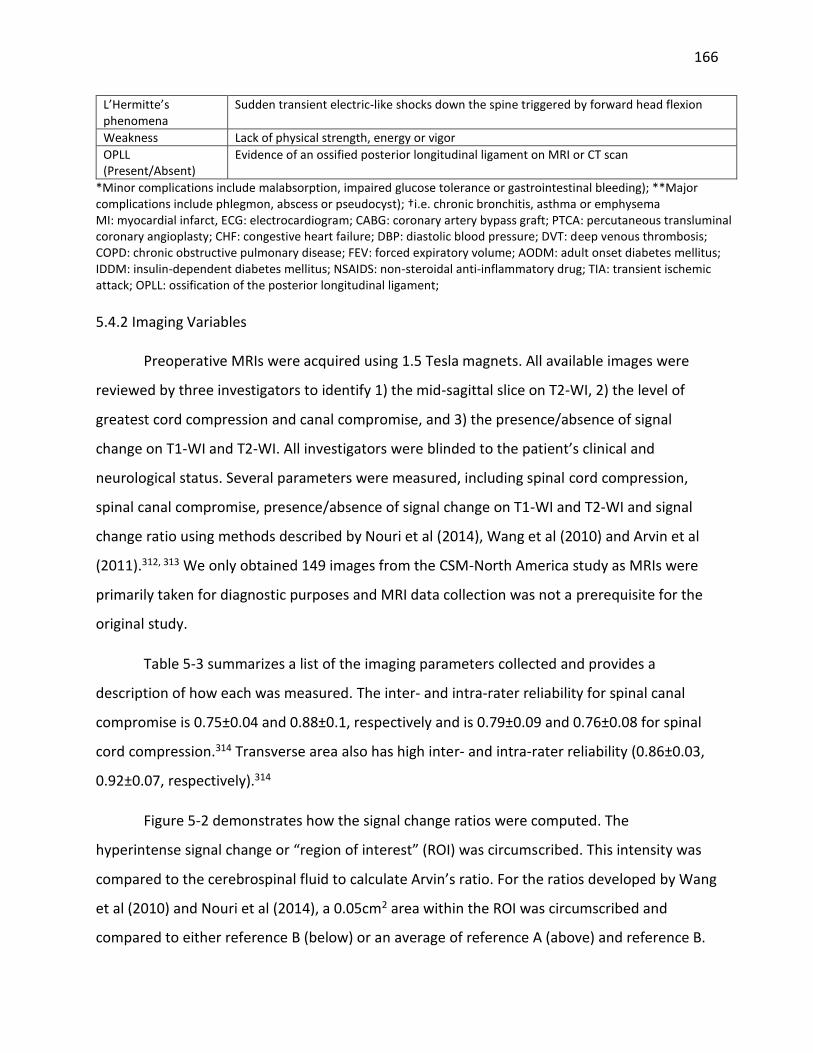
166
L’Hermitte’s phenomena
Sudden transient electric-like shocks down the spine triggered by forward head flexion
Weakness Lack of physical strength, energy or vigor
OPLL (Present/Absent)
Evidence of an ossified posterior longitudinal ligament on MRI or CT scan
*Minor complications include malabsorption, impaired glucose tolerance or gastrointestinal bleeding); **Major complications include phlegmon, abscess or pseudocyst); †i.e. chronic bronchitis, asthma or emphysema MI: myocardial infarct, ECG: electrocardiogram; CABG: coronary artery bypass graft; PTCA: percutaneous transluminal coronary angioplasty; CHF: congestive heart failure; DBP: diastolic blood pressure; DVT: deep venous thrombosis; COPD: chronic obstructive pulmonary disease; FEV: forced expiratory volume; AODM: adult onset diabetes mellitus; IDDM: insulin-dependent diabetes mellitus; NSAIDS: non-steroidal anti-inflammatory drug; TIA: transient ischemic attack; OPLL: ossification of the posterior longitudinal ligament;
5.4.2 Imaging Variables
Preoperative MRIs were acquired using 1.5 Tesla magnets. All available images were
reviewed by three investigators to identify 1) the mid-sagittal slice on T2-WI, 2) the level of
greatest cord compression and canal compromise, and 3) the presence/absence of signal
change on T1-WI and T2-WI. All investigators were blinded to the patient’s clinical and
neurological status. Several parameters were measured, including spinal cord compression,
spinal canal compromise, presence/absence of signal change on T1-WI and T2-WI and signal
change ratio using methods described by Nouri et al (2014), Wang et al (2010) and Arvin et al
(2011).312, 313 We only obtained 149 images from the CSM-North America study as MRIs were
primarily taken for diagnostic purposes and MRI data collection was not a prerequisite for the
original study.
Table 5-3 summarizes a list of the imaging parameters collected and provides a
description of how each was measured. The inter- and intra-rater reliability for spinal canal
compromise is 0.75±0.04 and 0.88±0.1, respectively and is 0.79±0.09 and 0.76±0.08 for spinal
cord compression.314 Transverse area also has high inter- and intra-rater reliability (0.86±0.03,
0.92±0.07, respectively).314
Figure 5-2 demonstrates how the signal change ratios were computed. The
hyperintense signal change or “region of interest” (ROI) was circumscribed. This intensity was
compared to the cerebrospinal fluid to calculate Arvin’s ratio. For the ratios developed by Wang
et al (2010) and Nouri et al (2014), a 0.05cm2 area within the ROI was circumscribed and
compared to either reference B (below) or an average of reference A (above) and reference B.

167
Table 5-3. A Summary of the Imaging Parameters collected using Quantitative Analysis of
Magnetic Resonance Images from Patients enrolled in the CSM-North America Study
MRI Variable Summary
Hyperintensity on T2WI Presence/Absence of a hyperintense signal on a T2-WI
Hypointensity on T1WI Presence/Absence of a hypointense signal on a T1-WI
Combined T1/T2 Signal Change
Presence/Absence of a combined hyperintense signal on a T2-WI and hypointense signal on a T1-WI
Height of T2 signal change
The height of a circumscribed hyperintense signal on a T2-WI Four groups (=0; >0, ≤0.75; >0.75, ≤1.50; >1.50)†
Area of T2 signal change The area of a circumscribed hyperintense signal on a T2-WI Four groups (=0; >0, ≤0.2; >0.2, ≤0.35; >0.35)†
Signal Change Ratio (Nouri et al)
Continuous
SCR =ROI (0.05cm2)
(Ref A + Ref B)/2
ROI is a 0.05cm2 region within a signal change or at the level of maximal cord compression on a T2-WI (Ref A + Ref B)/2 is the average of two signal references at C7/T1 and C2
Signal Change Ratio (Wang et al)
Continuous
SCR =ROI (0.05cm2)
Ref B
ROI is a circumscribed 0.05cm2 region within a signal change or at the level of maximal cord compression on a T2-WI Ref B is a signal reference at C7/T1
Signal Change Ratio (Arvin et al)
Continuous
SCR = (ROI
CSF Ref) X 100
ROI is a region of hyperintensity on a T2-WI Ref B is a CSF signal reference behind the dens
Spinal Canal Compromise
Continuous
SCanalC = (1 – Di
(Da + Db)/2) X 100
Di is the anteroposterior canal diameter at the level of maximum compression Da and Db are the anteroposterior diameters of non-compressed levels from above and below, respectively
Spine Cord Compression Continuous
ScordC = (1 – di
(da + db)/2) X 100
di is the anteroposterior spinal cord diameter at the level of maximum compression da and db are the anteroposterior diameters of non-compressed levels from above and below, respectively
Transverse area Spinal cord surface at site of maximal compression
†Categorization of height and area was based on variable distribution.

168
Figure 5-2. Computing Signal Change Ratios
5.4.3 Surgical Variables
For each patient, the surgeon was required to provide a surgical summary and record
the approach taken, the number of levels decompressed and the operative duration. Table 5-4
describes the surgical variables included in our analyses. The type of surgery varies case by case
and is largely based on location of compression, extent of degenerative pathology and surgical
preference. Operative duration is likely related to surgical expertise and case complexity.
Table 5-4. A Summary of Relevant Surgical Variables collected as part of the AOSpine Studies
Surgical Variables Summary
Operative duration Length of surgery, skin-to-skin time (minutes)
Number of levels The number of cervical levels decompressed by surgery
Type of surgery Anterior (discectomy and/or corpectomy with or without fusion/fixation) Posterior (laminectomy with or without fusion, laminoplasty) Circumferential (anterior and posterior stage)
Number of stages 1-stage (anterior or posterior surgery), 2-stage (anterior and posterior surgery)

169
5.5 Primary Outcome Measure
The mJOA was selected as the primary outcome measure for our study as it is one of the
most commonly used tool to assess functional status in patients with CSM.71 This 18-point scale
is an investigator-administered, CSM-specific index that evaluates upper and lower extremity
function, sensation and micturition (Table 5-5).69
Table 5-5. The modified Japanese Orthopaedic Association Scale
Motor dysfunction score of the upper extremity
0 - Inability to move hands
1 - Inability to eat w/ a spoon, but able to move hands
2 - Inability to button shirt, but able to eat w/ a spoon
3 - Able to button shirt w/ great difficulty
4 - Able to button shirt w/ slight difficulty
5 - No dysfunction
Motor dysfunction score of the lower extremity
0 - Complete loss of motor & sensory function
1 - Sensory preservation w/o ability to move legs
2 - Able to move legs, but unable to walk
3 - Able to walk on flat floor w/a walking aid (cane or crutch)
4 - Able to walk up and/or down stairs w/hand rail
5 - Moderate-to-significant lack of stability, but able to walk up and/or down stairs w/o hand rail
6 - Mild lack of stability but walks w/ smooth reciprocation unaided/
7 - No dysfunction
Sensory dysfunction score of the upper extremities
0 - Complete loss of hand sensation
1 - Severe sensory loss or pain
2 - Mild sensory loss
3 - No sensory loss
Sphincter dysfunction score
0 - Inability to micturate voluntarily
1 - Marked difficulty w/ micturition
2 - Mild-to-moderate difficulty w/ micturition
3 - Normal micturition
The other measures considered for this analysis were the SF-36, the NDI, the Nurick
score and the 30-meter walking test. A detail summary of the advantages and disadvantages of
each outcome measure is shown in Table 5-6.67
The mJOA at 1-year follow-up was not normally distributed in either the CSM-North
America or International datasets: 42.26% of patients had a final mJOA of 17 or 18, with 26.32%
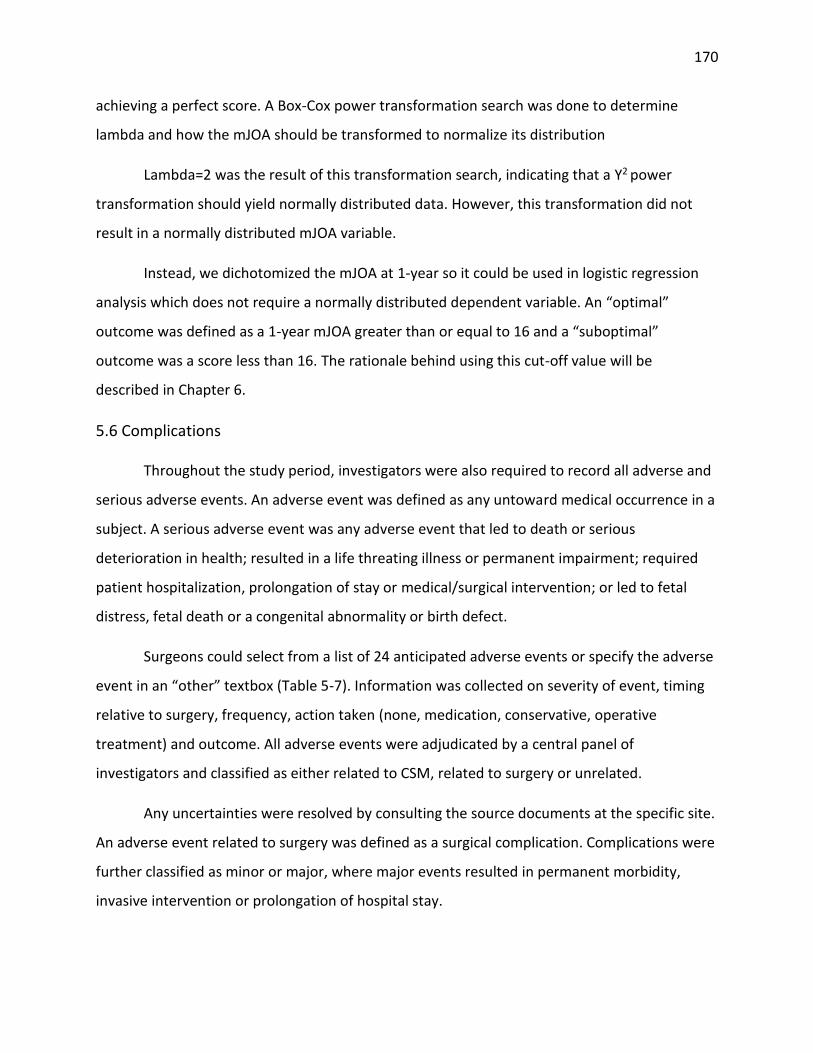
170
achieving a perfect score. A Box-Cox power transformation search was done to determine
lambda and how the mJOA should be transformed to normalize its distribution
Lambda=2 was the result of this transformation search, indicating that a Y2 power
transformation should yield normally distributed data. However, this transformation did not
result in a normally distributed mJOA variable.
Instead, we dichotomized the mJOA at 1-year so it could be used in logistic regression
analysis which does not require a normally distributed dependent variable. An “optimal”
outcome was defined as a 1-year mJOA greater than or equal to 16 and a “suboptimal”
outcome was a score less than 16. The rationale behind using this cut-off value will be
described in Chapter 6.
5.6 Complications
Throughout the study period, investigators were also required to record all adverse and
serious adverse events. An adverse event was defined as any untoward medical occurrence in a
subject. A serious adverse event was any adverse event that led to death or serious
deterioration in health; resulted in a life threating illness or permanent impairment; required
patient hospitalization, prolongation of stay or medical/surgical intervention; or led to fetal
distress, fetal death or a congenital abnormality or birth defect.
Surgeons could select from a list of 24 anticipated adverse events or specify the adverse
event in an “other” textbox (Table 5-7). Information was collected on severity of event, timing
relative to surgery, frequency, action taken (none, medication, conservative, operative
treatment) and outcome. All adverse events were adjudicated by a central panel of
investigators and classified as either related to CSM, related to surgery or unrelated.
Any uncertainties were resolved by consulting the source documents at the specific site.
An adverse event related to surgery was defined as a surgical complication. Complications were
further classified as minor or major, where major events resulted in permanent morbidity,
invasive intervention or prolongation of hospital stay.
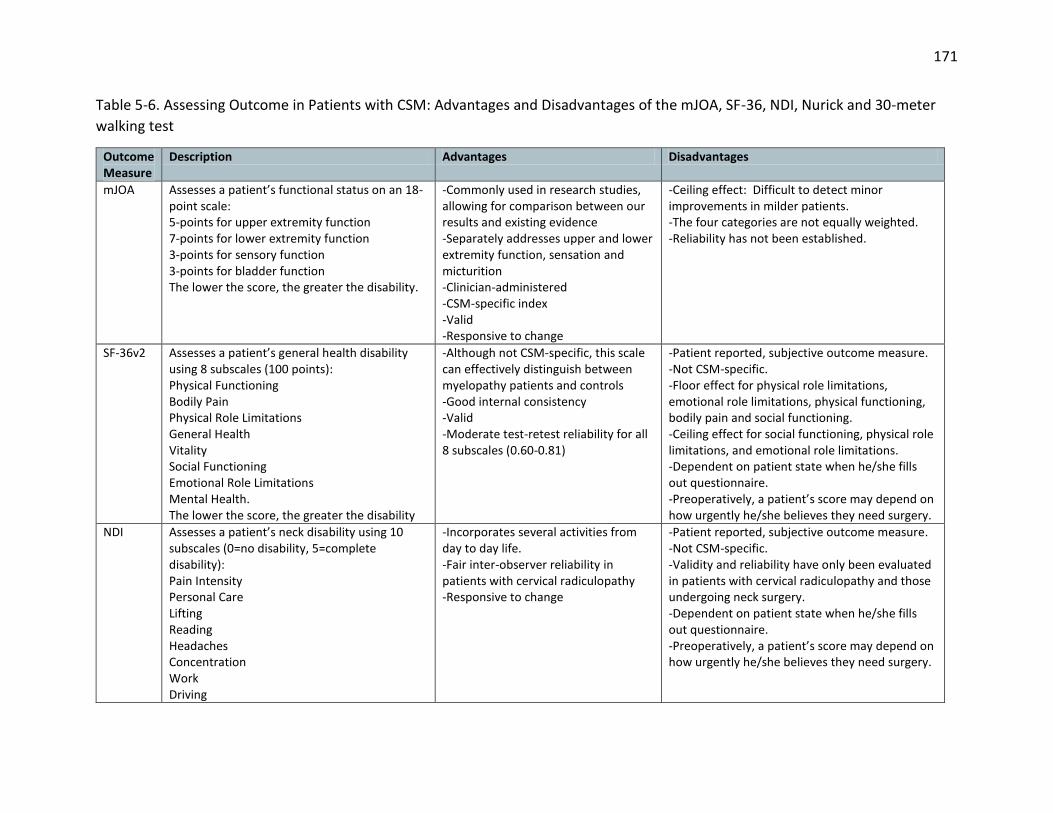
171
Table 5-6. Assessing Outcome in Patients with CSM: Advantages and Disadvantages of the mJOA, SF-36, NDI, Nurick and 30-meter
walking test
Outcome Measure
Description Advantages Disadvantages
mJOA Assesses a patient’s functional status on an 18-point scale: 5-points for upper extremity function 7-points for lower extremity function 3-points for sensory function 3-points for bladder function The lower the score, the greater the disability.
-Commonly used in research studies, allowing for comparison between our results and existing evidence -Separately addresses upper and lower extremity function, sensation and micturition -Clinician-administered -CSM-specific index -Valid -Responsive to change
-Ceiling effect: Difficult to detect minor improvements in milder patients. -The four categories are not equally weighted. -Reliability has not been established.
SF-36v2 Assesses a patient’s general health disability using 8 subscales (100 points): Physical Functioning Bodily Pain Physical Role Limitations General Health Vitality Social Functioning Emotional Role Limitations Mental Health. The lower the score, the greater the disability
-Although not CSM-specific, this scale can effectively distinguish between myelopathy patients and controls -Good internal consistency -Valid -Moderate test-retest reliability for all 8 subscales (0.60-0.81)
-Patient reported, subjective outcome measure. -Not CSM-specific. -Floor effect for physical role limitations, emotional role limitations, physical functioning, bodily pain and social functioning. -Ceiling effect for social functioning, physical role limitations, and emotional role limitations. -Dependent on patient state when he/she fills out questionnaire. -Preoperatively, a patient’s score may depend on how urgently he/she believes they need surgery.
NDI Assesses a patient’s neck disability using 10 subscales (0=no disability, 5=complete disability): Pain Intensity Personal Care Lifting Reading Headaches Concentration Work Driving
-Incorporates several activities from day to day life. -Fair inter-observer reliability in patients with cervical radiculopathy -Responsive to change
-Patient reported, subjective outcome measure. -Not CSM-specific. -Validity and reliability have only been evaluated in patients with cervical radiculopathy and those undergoing neck surgery. -Dependent on patient state when he/she fills out questionnaire. -Preoperatively, a patient’s score may depend on how urgently he/she believes they need surgery.

172
Sleeping Recreation Scores are summated across categories and multiplied by 2 for a total score out of 100. The higher the score the greater the disability.
Nurick Assesses a patient’s myelopathy severity using a 6 point scale: 0-Root involvement without SCD I-signs of SCD without difficulty in walking II-difficulty in walking without effect on employment III-difficulty in walking with effect on full-time employment IV-can walk only with aid or walker V-chair bound or bedridden
-Commonly used in research studies, allowing for comparison between our results and existing evidence -Clinician administered -CSM-specific index -Consists of both impairment and disability components -Valid
-Insensitive scale, difficult to detect improvements. -Solely based on gait impairment and employment status. -Largely weighted towards lower limb function.
30-m Walking Test
Patients begin seated in a chair and are asked to stand up, walk on a flat surface for 15 m, turn around and then walk back. The time required to complete this distance and the number of steps taken are recorded.
-Measures leg function and agility -Quantitative, objective measure -Clinician administered -CSM-specific index -Reliable -Valid -Bridges the gap between impairment and disability
-Exclusively measures lower limb function. -Walking may be impaired because of other reasons. -Some patients are unable to walk due to spinal cord injury.
CSM: cervical spondylotic myelopathy; mJOA: modified Japanese Orthopaedic Association; SF-36v2: short form-36 version 2; NDI: neck disability index; SCD: spinal cord dysfunction
173
Table 5-7. A List and Description of Anticipated Surgery-Related Complications
Complication Description on Case Report Forms
Pseudoarthrosis Non-union
Hardware failure Implant loosening or breakage
Screw malposition Screw in non-tolerable/non-anatomic position (e.g. screw penetrating spinal canal)
C5 radiculopathy Clinical signs and symptoms (w/o confirmatory EMG) of C5 radiculopathy after surgery: C5 dermatome hypoesthesia, diminished or absent bicipital reflex (not present before surgery), postoperative deltoid and/or bicep muscle paresis
Axial pain Nuchal or periscapular pain or neck fatigue
New intractable neck pain Onset or reappearance of cervical pain not responding to oral pain treatment with non-steroid anti-inflammatory drugs, 3 months after surgery
Adjacent segment degeneration
Development of spondylotic changes in proximal or distal segments adjacent to treated segment, evaluated in cervical spine radiographies or MRI
Instability Sagittal plane translation equal to or over 3.5mm between 2 consecutive cervical levels in dynamic or static lateral cervical spine radiography; sagittal plane rotation over 20⁰ between two adjacent levels in dynamic lateral cervical spine radiography; relative sagittal plane angulations over 11⁰ between two adjacent cervical spine levels in static lateral cervical spine radiography, when compared to upper or lower cervical spine levels
Dural tear Intraoperative, iatrogenic dural tear which may or may not require repair
Epidural hematoma Hematoma occurring after surgery in epidural space
Deep infection Infection penetrating or developed under muscular fascia
Superficial infection Infection above muscular fascia
Dysphagia Patient reported difficulty with liquid or solid deglutition
Dysphonia Changes or difficulty in vocal sound production by the patient
Progression of myelopathy Increase of myelopathic signs and symptoms
New radiculopathy Signs and symptoms of other cervical spine root lesion
Perioperative worsening of myelopathy
Signs and symptoms due to cervical myelopathy worsening during the initial 4 week postoperative period
Graft dislodgement/migration
Graft migration shown in follow-up cervical spine radiographs as compared to the immediate postoperative radiography
Graft site pain Patient reported pain at the site of harvesting a bone graft 6 months after surgical treatment
Postoperative kyphosis Increased kyphosis at the operative segment/intervened segment of 5⁰ or more
Cardiopulmonary event Medical diagnosis of heart or lung disease (e.g. myocardial infarction, pulmonary embolism)
Stroke -
Deep venous thrombosis -
Cortical blindness -
Other -
174
Chapter 6: The Minimal Clinically Important Difference of the modified
Japanese Orthopedic Association Score and Establishing a Cut-Off Point
6.1 Introduction
This chapters describes the methodology used to determine the minimal clinically
important difference (MCID) of the mJOA scale and summarizes our results. Furthermore, it
discusses the rationale behind using a cut-off of 16 to distinguish between an “optimal” and
“suboptimal” surgical outcome.
In both the CSM-North America and International studies, surgery was effective at
arresting disease progression and improving neurological outcomes, functional status and
quality of life.315 These improvements were evaluated using a wide variety of functional and
patient-reported outcome measures, including the mJOA, Nurick score, 30-meter walking test,
NDI and SF-36. The changes observed between preoperative and 1-year postoperative status
were statistically significant across all scales (p<0.001); however, for some of the measures, it is
unclear whether these improvements translate to clinically meaningful gains.
The MCID is the smallest change in a treatment outcome that a patient or clinician
would define as meaningful.316-319 For patients with degenerative spine conditions undergoing
cervical spine fusion, the MCID of the NDI is 7.5.320 In the AOSpine CSM-North America study,
patients improved by 8.72 on the NDI following surgery, reflecting substantial improvements in
disability. In terms of change in functional impairment, patients improved, on average, by 2.88
on the mJOA.4 However, since the MCID for the mJOA has yet to be established, investigators
cannot make strong conclusions with respect to meaningful gains in functional status following
surgery. This is a critical knowledge gap since the mJOA has become widely used to assess
treatment outcomes and functional improvements in patients with CSM.
This study aims to estimate the MCID of the mJOA using data from patients enrolled in
the AOSpine CSM-North America and International studies as well as results from a survey of
international spine professionals. This knowledge will enable clinicians to identify meaningful
functional improvements following intervention and will allow for better interpretation of

175
previous research studies that used the mJOA as an outcome measure. A secondary objective
of this study is to establish a cut-off point between an “optimal” and “suboptimal” surgical
outcome that will be used in the prediction studies described in later chapters. This will be done
using the MCID as an anchor and comparing the postoperative mJOA scores of patients who
achieved this MCID and those who did not.
6.2 Methods
6.2.1 Patient Sample
Our sample consisted of 517 symptomatic CSM patients enrolled in either the CSM-
North America or CSM-International study at 26 global sites.
6.2.2 The MCID of the mJOA
We used three different methods to determine the MCID of the mJOA: 1) distribution-
based, 2) anchor-based and 3) professional opinion.
6.2.2.1 Distribution-based methods
Distribution-based methods compare change in outcome to a measure of variability
such as the standard deviation, effect size or standard error of measurement (SEM). The
rationale behind using these methods is to detect how much change between baseline and
post-treatment exceeds what is expected from chance alone. Norman et al (2003) proposed the
standard deviation method and reported that, in patients with chronic disease, estimates of
minimal change approximate half a standard deviation of baseline scores.321 Using our dataset,
the MCID was determined by computing one-half the standard deviation at baseline. We also
calculated the SEM using equation 6-1:
𝑆𝐸𝑀 = 𝑆𝐷 × √(1 − 𝑅) (Equation 6-1)
where SD is the standard deviation of the baseline score and R is the reliability of the mJOA.
The reliability was assumed to be 0.8 as this is the estimate for the JOA.322 A sensitivity analysis
was performed using an estimate of 0.7 and 0.9.

176
6.2.2.2 Anchor-based methods
Anchor-based methods compare changes in the outcome measure to some other
measure of change or an “anchor.” In a study by Carreon et al (2010), the Health Transition
Item of the SF-36 was used as an anchor to determine the MCID of the NDI in a degenerative
spine population.320 The MCID was taken to be the change score from baseline with even
sensitivity and specificity to distinguish between patients who reported their outcome as “the
same as baseline” and those who reported their status as “somewhat better than baseline.”320
According to this study, change scores on the NDI of 7.5 reflect improvements in quality of life
detected by the patient.320 We used this established MCID as an anchor to determine what
changes in functional status translate to minimal improvements identified by the patient.
The sample was divided into four groups: patients who were “worse” (NDI<-7.5),
“unchanged” (-7.5≤NDI<7.5), “slightly improved” (7.5≤NDI<15.0), and “markedly improved”
(NDI≥15). The change in the mJOA between baseline and 12-months was compared between
the “unchanged” and the “slightly improved” groups and taken to be the MCID. ROC analysis
was also performed to compute a discrete value for the MCID by evaluating the threshold Δ in
mJOA (i.e. 1, 2, etc.) that yielded the smallest difference between sensitivity and specificity. In
this context, sensitivity is the proportion of patients who were classified as “slightly improved”
on the NDI score and had a Δ mJOA score above the MCID threshold. Specificity, on the other
hand, is the proportion of patients who were “unchanged” on the NDI and had a mJOA score
below the MCID threshold.
The sample was stratified into patients with mild (mJOA=15-17), moderate (mJOA=12-
14) and severe (mJOA<12) disease based on criteria established by the AOSpine study group.
Our anchor-based methods were repeated for each severity group to evaluate whether the
MCID differs based on the severity of myelopathy.
6.2.2.3 Survey of AOSpine International
The MCID of an outcome measure can also be calculated using consensus or Delphi
methods. By this approach, members of an expert panel are asked to independently define

177
what constitutes a clinically meaningful change. This method was first used by Bellamy et al
(1992) to determine the MCID for a pain assessment scale.323
An English language 2-question survey was created to confirm the MCID obtained using
previously-described methods. An email request to participate in this survey was sent to 5,774
members of AOSpine International with a cover letter outlining the objectives of this study and
an attached link to Survey Monkey (USA, https://www.surveymonkey.com). This link was
available electronically for 60 days, with two reminders sent out during this period.
The two survey questions were 1) In your practice, do you use the mJOA scale to assess
functional status and surgical outcome in patients with CSM? (Yes or No); and 2) In your
opinion, what is the MCID of the mJOA (0.5, 1.0, 1.5, 2.0, 2.5, or 3.0). The results from questions
1 and 2 were reported as frequencies and percentages of responses. The mean and the
standard deviation of the responses from question 2 was also computed.
6.2.3 MCID translated to a cut-off point
The second objective of this study was to define a cut-off value for the mJOA that could
effectively distinguish an “optimal” from a “suboptimal” surgical outcome. This cut-off will be
used in our prediction studies.
Using the results from section 6.2.2, patients were divided into two groups based on
whether or not they achieved the MCID on the mJOA. The average mJOA at 1-year was
computed for each group and the postoperative mJOA of the patients who exhibited clinically
significant improvements (≥MCID) was deemed an appropriate cut-off.
For further validation, the sample was divided at this cut-off. For each patient, the
number of MCIDs gained or lost was calculated by dividing the change in mJOA by our
computed MCID (equation 6-2):
# 𝑜𝑓 𝑀𝐶𝐼𝐷𝑠 𝑙𝑜𝑠𝑡 𝑜𝑟 𝑔𝑎𝑖𝑛𝑒𝑑 =𝑚𝐽𝑂𝐴 𝑎𝑡 1−𝑦𝑒𝑎𝑟−𝑚𝐽𝑂𝐴 𝑎𝑡 𝑏𝑎𝑠𝑒𝑙𝑖𝑛𝑒
𝐶𝑎𝑙𝑐𝑢𝑙𝑎𝑡𝑒𝑑 𝑀𝐶𝐼𝐷 (Equation 6-2)
A score ≥1 was considered improvement; a score ranging from >-1 to <1 was defined as no
change; and a score ≤-1 was considered deterioration. The mean number of MCIDs gained or

178
lost was compared between the two groups (≥cut-off, <cut-off) and the distribution of scores
was visualized. We also compared the mean change in mJOA at 1-year between the two groups.
6.3 Results
Five hundred and seventeen patients had complete mJOA and NDI data at baseline and
at 12-months following surgery. Patients with a preoperative mJOA score of 18 were excluded
from the analysis, as they had no room for improvement. Table 6-1 displays demographic
information, baseline status and 12-months outcome data for the entire sample and for
patients with mild, moderate and severe myelopathy.
Our cohort consisted of 315 men and 202 women, with ages ranging from 21 to 86 years
(mean age: 56.37±11.60). The mean baseline mJOA score was 12.48±2.71. One hundred and
twenty-nine patients were classified as mild (mJOA=15-17) preoperatively, 208 as moderate
(mJOA=12-14) and 180 as severe (mJOA<12). Based on the NDI at 12-months following surgery,
76 (14.70%) patients worsened (NDI<-7.5), 130 (25.15%) were unchanged (-7.5≤NDI<7.5), 87
(16.83%) slightly improved (7.5≤NDI<15) and 224 (43.33) showed marked improvements
(15≤NDI). Patients, on average, improved by 2.48±2.68 (-6-12) on the mJOA and reached a final
postoperative score of 14.96±2.68.
Table 6-1. A Summary of Demographics, Baseline Status and Surgical Outcomes of 517 Patients Enrolled in the AOSpine CSM-North America or CSM-International Multicenter Studies
All (n=517) Mild (mJOA=15-17) (N=129)
Moderate (mJOA=12-14) (N=208)
Severe (mJOA<12) (N=180)
Gender 315 M, 202 F 81 M, 48 F 126 M, 82 F 108 M, 72 F
Age (years) 56.37±11.60 52.32±10.29 55.31±11.31 60.51±11.57
Baseline mJOA 12.48±2.71 15.76±0.78 13.04±0.80 9.48±1.67
mJOA at 1-year 14.96±2.68 16.49±1.88 15.26±2.45 13.50±2.91
Change in mJOA 2.48±2.76 0.73±1.89 2.22±2.21 4.03±3.00
Baseline NDI 38.99±20.24 31.28±16.29 37.12±19.27 46.67±21.34
NDI at 1-year 26.91±20.51 20.36±17.12 26.32±20.60 32.29±21.26
Change in NDI NDI<-7.5 -7.5≤NDI<7.5 7.5≤NDI<15 NDI≥15
12.07±19.35 76 (14.70%) 130 (25.15%) 87 (16.83%) 224 (43.33%)
10.91±17.45 16 (12.40%) 42 (32.56%) 18 (13.95%) 53 (41.09%)
10.80±17.47 32 (15.38%) 53 (25.48%) 38 (18.27%) 85 (40.87%)
14.37±22.38 28 (15.56%) 35 (19.44%) 31 (17.22%) 86 (47.78%)
mJOA: modified Japanese Orthopedic; NDI: neck disability index

179
6.3.1 What is the MCID of the mJOA?
6.3.1.1 Distribution-based methods
The standard deviation of the preoperative mJOA was 2.71. Based on the half standard
deviation method, the MCID is estimated as 1.36. The SEM was calculated as 1.21 using the
following equation:
𝑆𝐸𝑀 = 2.71 × √(1 − 0.8) =1.21 (Equation 6-3)
Using sensitivity estimates of 0.7 and 0.9 for reliability, the SEM-computed MCID was 1.48 and
0.86, respectively.
6.3.1.2 Anchor-based methods
Patients classified as “unchanged” according to the NDI improved on average by
1.56±2.37 on the mJOA, whereas patients who “slightly improved” exhibited an average gain of
2.67±2.50 (Table 6-2). The MCID based on this approach is 1.11 (2.67-1.56). Using ROC analysis,
the discrete value of the mJOA that yielded the smallest difference between sensitivity and
specificity was 2 (Figure 6-1).
Table 6-2. The mJOA Change Scores in Patients Classified as “Worsened,” “Unchanged,”
“Slightly Improved” and “Markedly Improved” based on the NDI.
Change in mJOA
Worsened (NDI<-7.5)
Unchanged (-7.5≤NDI<7.5)
Slightly Improved (7.5≤NDI<15)
Markedly Improved (15≤NDI)
All Patients 1.71±2.87 1.56±2.37 2.67±2.50 3.20±2.82
Mild (mJOA: 15-17)
-0.56±2.34 0.57±1.64 1.00±2.22 1.15±1.67
Moderate (mJOA: 12-14)
1.56±2.37 1.77±2.45 2.21±1.53 2.76±1.94
Severe (mJOA<12)
3.18±2.84 2.43±2.62 4.19±2.34 4.90±3.11
mJOA: modified Japanese Orthopaedic Association scale; NDI: Neck Disability Index; SF-36 PCS: Short-Form-36 Physical Component Score. The minimal clinically important difference (MCID) is 7.5 for the NDI. The difference in ΔmJOA (between baseline and 12-months after surgery) between patients who were “unchanged” and those who “slightly improved” was taken to be the MCID.
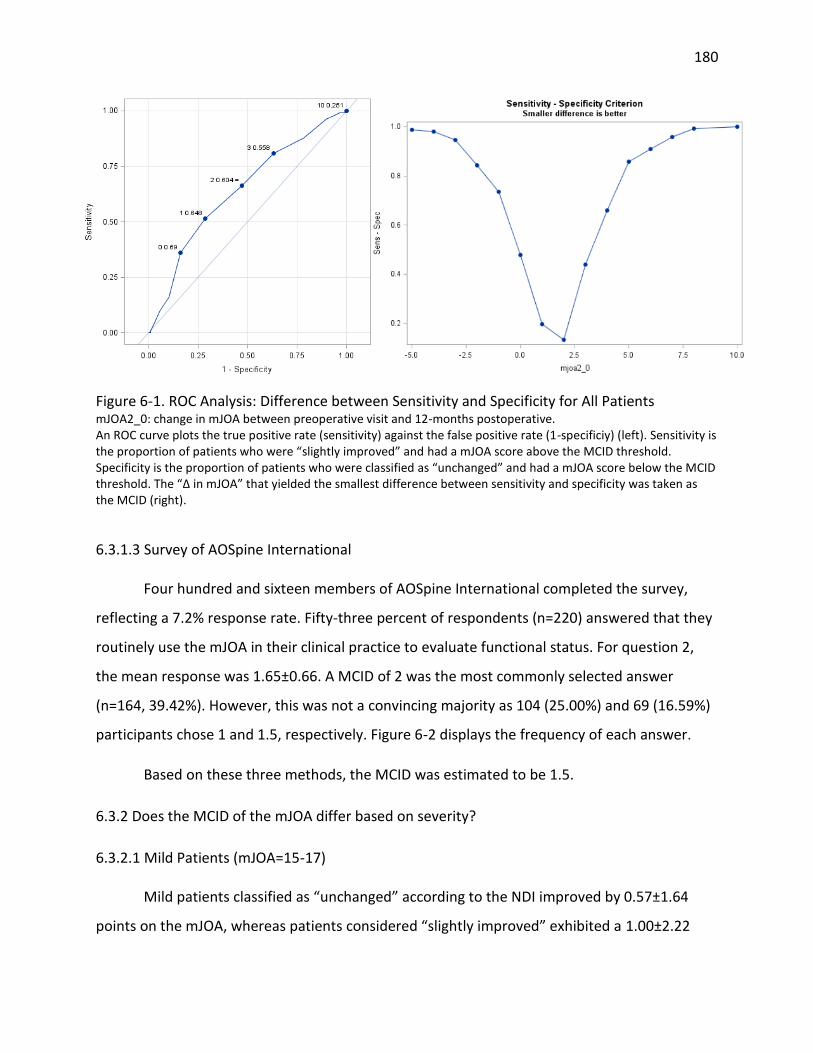
180
Figure 6-1. ROC Analysis: Difference between Sensitivity and Specificity for All Patients mJOA2_0: change in mJOA between preoperative visit and 12-months postoperative. An ROC curve plots the true positive rate (sensitivity) against the false positive rate (1-specificiy) (left). Sensitivity is the proportion of patients who were “slightly improved” and had a mJOA score above the MCID threshold. Specificity is the proportion of patients who were classified as “unchanged” and had a mJOA score below the MCID threshold. The “Δ in mJOA” that yielded the smallest difference between sensitivity and specificity was taken as the MCID (right).
6.3.1.3 Survey of AOSpine International
Four hundred and sixteen members of AOSpine International completed the survey,
reflecting a 7.2% response rate. Fifty-three percent of respondents (n=220) answered that they
routinely use the mJOA in their clinical practice to evaluate functional status. For question 2,
the mean response was 1.65±0.66. A MCID of 2 was the most commonly selected answer
(n=164, 39.42%). However, this was not a convincing majority as 104 (25.00%) and 69 (16.59%)
participants chose 1 and 1.5, respectively. Figure 6-2 displays the frequency of each answer.
Based on these three methods, the MCID was estimated to be 1.5.
6.3.2 Does the MCID of the mJOA differ based on severity?
6.3.2.1 Mild Patients (mJOA=15-17)
Mild patients classified as “unchanged” according to the NDI improved by 0.57±1.64
points on the mJOA, whereas patients considered “slightly improved” exhibited a 1.00±2.22

181
gain (Table 6-2). The MCID based on this difference is 0.43. The change value of the mJOA that
yielded the smallest difference between sensitivity and specificity was 1 for patients with mild
myelopathy (Figure 6-3).
Figure 6-2. Results from a Survey of AOSpine International An electronic survey was distributed to members of AOSpine International to ask “what is the minimal clinically important difference of the modified Japanese Orthopaedic Association scale?” This bar graph summarizes the frequencies of responses. The red bar indicates the most frequently selected answer.
Figure 6-3. ROC Analysis: Difference between Sensitivity and Specificity for Mild Patients mJOA2_0: change in mJOA between preoperative visit and 12-months postoperative.
0
20
40
60
80
100
120
140
160
180
0.5 1 1.5 2 2.5 3
Nu
mb
er
of
Re
spo
nd
en
ts
MCID of the mJOA

182
6.3.2.2 Moderate Patients (mJOA=12-14)
Moderate patients who were “unchanged” on the NDI score improved by 1.77±2.45
points on the mJOA, whereas those classified as “slightly improved” exhibited a 2.21±1.53 gain
(Table 6-2). The MCID based on this difference is 0.44. The difference between sensitivity and
specificity for moderate patients was the lowest at a MCID threshold of 2 (Figure 6-4).
Figure 6-4. ROC Analysis: Difference between Sensitivity and Specificity for Moderate Patients mJOA2_0: change in mJOA between preoperative visit and 12-months postoperative.
6.3.2.3 Severe Patients (mJOA<12)
Severe patients who were “unchanged” on the NDI score improved by 2.43±2.62 points
on the mJOA, whereas those classified as “slightly improved” exhibited a 4.19±2.34 gain (Table
6-2). The MCID based on this difference is 1.76. The difference between sensitivity and
specificity for severe patients was the lowest at a MCID threshold of 3 (Figure 6-5).

183
Figure 6-5. ROC Analysis: Difference between Sensitivity and Specificity for Severe Patients mJOA2_0: change in mJOA between preoperative visit and 12-months postoperative.
6.4 MCID translated to a cut-off point
Patients with a preoperative score of 17 and 18 were excluded as they could not
improve by 1.5 points on the mJOA. The sample was divided into two groups: patients who
exhibited a ΔmJOA ≥1.5 and those who did not (ΔmJOA<1.5).
Of the 490 patients with 1-year follow-up, 329 improved by ≥1.5 points. Postoperative
mJOA at 1-year in this group was 15.82±2.19. In the group of patients (n=161) who did not
improve by at least 1.5 points on the mJOA, the mean mJOA at 1-year was 12.86±2.51. Patients
who reached a score of 16 on the mJOA likely demonstrated clinically significant gains. (Table 6-
3).
The mean number of MCIDs gained was 1.75±1.82. Twenty-nine patients demonstrated
deterioration, 132 stayed the same and 329 showed clinically meaningful improvements.
Patients with a score ≥16 at 1-year follow-up improved by 2.47±1.62 MCIDs, whereas those
with a score <16 did not exhibit clinically significant improvements (# of MCIDs=0.87±1.70). This

184
result is emphasized by a significantly larger change in mJOA in the ≥16 group (3.70±2.42) than
in the <16 group (1.31±2.54) (p<0.0001, t-test). (Table 6-3).
Table 6-3. Establishing a Cut-off to Distinguish between Patients with an “Optimal” and “Suboptimal” Surgical Outcome
ΔmJOA ≥ 1.5 (n=329) ΔmJOA<1.5 (n=161)
mJOA at 1-year 15.82±2.19 12.86±2.51
mJOA at 1-year ≥ 16 (n=264) mJOA at 1-year < 16 (n=253)
# of MCIDs Lost/Gained 2.47±1.62 0.87±1.70
ΔmJOA 3.70±2.42 1.31±2.54
mJOA: modified Japanese Orthopaedic Association; Δ (mJOA at 1-year – mJOA at baseline); 1.5 was taken to be the minimal clinically important difference of the mJOA.
Figure 6-6 illustrates the distribution of the number of MCIDs gained or lost in the ≥16
and <16 groups. It is evident that patients achieving an outcome ≥16 make marked
improvements whereas those with a mJOA <16 at 1-year do not, on average, demonstrate
clinically meaningful gains.
Figure 6-6. The Distribution of the Number of MCIDs Gained or Lost in two Outcome Groups (mJOA≥16 and mJOA<16 at 1-year) mJOA: modified Japanese Orthopedic; MCID: minimal clinically important difference
6.5 Discussion
In this study, we first calculated the MCID of the mJOA using distribution- and anchor-
based methods and then confirmed our estimate by surveying spine professionals from
0
5
10
15
20
25
30
35
40
45
50
-6.67 -3.3 -2 -0.67 0.67 2 3.3 4.67 6 7.3
Freq
uen
cy
Number of MCIDs
mJOA < 16
mJOA ≥ 16

185
AOSpine International. Using distribution-based methods, the MCID was calculated as either
1.36 (standard deviation based) or 1.21 (SEM based). These estimates were higher than what
was computed using anchor-based methods (MCID=1.11) and ROC analysis (MCID=2). Finally,
although 2 was the most commonly selected MCID by spine professionals (29.42%), a range of
1-2 encompassed the opinion of the majority surveyed (81.01%). From these three methods,
we can estimate the MCID of the mJOA to be between 1 and 2 points. This information enables
clinicians to qualify outcomes following surgery as well as interpret results from clinical studies
in terms of minimum clinically important gains rather than statistical significance. For example,
in the AOSpine CSM-North America study, patients improved on average by 2.88 points on the
mJOA. We can now confirm that these changes translate to gains that a patient can identify and
likely reflect substantial improvements in functional status.
There is little consensus as to the optimal way to calculate the MCID. In this study, we
used a wide range of literature-supported methods, including SEM, one half standard deviation,
ROC analysis and professional opinion.316-318, 321 The smallest estimate for MCID was 1.11 and
derived from the anchor approach. ROC analysis yielded the largest estimate of 2 points; this
was the value of ΔmJOA that resulted in the smallest difference between sensitivity and
specificity. The ROC approach is the preferred method for the mJOA as it yields an integer value
for the MCID rather than a decimal number. Since the mJOA is an ordinal scale, a discrete value
for the MCID has greater clinical relevance and applicability for individual patients than a range
or a decimal estimate.
Given the variability of our estimates across methods, we speculated that the MCID of
the mJOA may be dependent on myelopathy severity. This is likely the case as the mJOA
exhibits a strong celling effect at the upper end of the scale and because each point increase is
not of equal weight. For patients with “mild” myelopathy, defined as a mJOA≥15, the MCID was
1 point. This finding has strong face validity as patients with subtle deficits in gait or hand
dexterity are likely to appreciate an improvement by 1 point as this gain could translate to a
perfect or near-perfect score. In contrast, for patients with moderate disease (mJOA=12-14),
the MCID was 2 and for those with severe myelopathy, the MCID was 3. Again these results are
intuitive: patients who are heavily debilitated and have lost social independence would likely

186
require a 2 to 3 point improvement before identifying meaningful gains in functional status and
quality of life. The performance of the logistic regression model between the NDI (improved or
unchanged) and the change in mJOA was much higher for severe and mild patients than it was
for moderate patients. This likely explains the discrepancy between the MCID computed by
anchor-based methods (MCID=0.44) and ROC analysis (MCID=2) for moderate patients.
The mJOA criteria for mild, moderate and severe disease based was developed by the
AOSpine CSM study group for the purpose of the CSM-North America multicenter trial (2005-
2007). These definitions were agreed upon by spine professionals across the continent but
were never validated. Our current findings support that patients who are “mild” (mJOA=15-17)
differ from those who are “moderate” (mJOA=12-14) who differ from those who are “severe”
(mJOA<12) as the MCID of the mJOA increases by 1-point per severity group. This is a first step
to validating these severity definitions.
Our second objective was to determine an appropriate cut-off value for our prediction
model that could effectively distinguish an “optimal” from a “suboptimal” surgical outcome.
This cut-off was defined as 16; on average, patients who improved by 1.5 or more points on the
mJOA reached a final postoperative score of approximately 16. A score of 16 is also in the in-
range of mild impairment and can effectively differentiate between patients with mild
myelopathy and those with substantial residual neurological deficit.
6.6 Strengths and Limitations
This study used a wide range of methods to compute the MCID of the mJOA. Each
technique has certain limitations. The standard deviation method was discovered by Norman et
al (2003) when comparing the MCID estimates from studies that used a variety of assessment
tools. Thirty-two out of 36 studies yielded values that approximated one half a standard
deviation of the baseline score. This finding, although remarkably consistent across studies,
may not be universal and may not apply to the mJOA. The SEM is a superior distribution-based
approach; however, this calculation requires knowledge of the scale’s reliability which has yet
to be established for the mJOA. We used a value of 0.8 as this is the reliability of the JOA, and
also conducted two sensitivity analyses using 0.7 and 0.9 as the estimate. For the anchor-based

187
methods, the MCID of the NDI was used as the “anchor” as this value was also established in a
degenerative spine population. The NDI itself is not highly correlated to the mJOA and is
primarily used to evaluate quality of life in patients with neck pain. Therefore, this scale is
relevant to the neck pain component of CSM but may not be applicable to other neurologic
signs and symptoms. However, since our anchor was the MCID of this scale, we are computing
what changes on the mJOA translate to detectable improvements in quality of life. A final
limitation to this study is the low response rate for our survey, although these methods
primarily served to confirm our previous estimates.
6.7 Conclusion
On average, the MCID of the mJOA is 1.5 points. For milder patients, the threshold
decreases to 1 and for moderate and severe patients, the threshold increases to 2 and 3 points,
respectively. This information can be used by clinicians to identify clinically meaningful
improvements in functional status following surgery. Furthermore, these findings can enable
investigators to better interpret results from previous studies that discuss the impact of surgery
on functional impairment. A score of 16 was deemed to be an appropriate cut-off to distinguish
between patients who achieve clinically important differences and those who do not. This
finding provides rationale for using a score of 16 as a cut-off for logistic regression predictive
modeling.

188
Chapter 7: A Clinical Prediction Model to Determine Outcomes in
Patients with Cervical Spondylotic Myelopathy undergoing Surgical
Treatment: Data from the Prospective, Multicenter AOSpine North
American Study
7.1 Introduction
This chapter summarizes the methodology and results from a study conducted to
develop a North American prediction model. This study represents part 1 of a 4-part study
designed to create a globally-relevant and valid prediction model that could be implemented
into clinical practice.
7.2 Methods
7.2.1 Patient Sample
Our sample consisted of 278 symptomatic CSM patients enrolled in the CSM-North
America study from 12 North American sites.
7.2.2 Statistical Analysis
Continuous predictors were described using means, standard deviations and ranges.
Categorical variables were summarized using percentages. Duration of symptoms was divided
into five groups as this variable could not be transformed without having remaining outliers: 1)
≤3 months, 2) >3, ≤6 months, 3) >6, ≤12 months, 4) >12, ≤24 months, 5) >24 months. Missing
follow-up data and MRI/CT measurements were assumed to be missing at random and were
replaced with a set of plausible values using a multiple imputation procedure with 10 iterations.
As suggested by the Food and Drug Administration, multiple imputation is the preferred
method for handling missing data in a therapeutic trial. Using this procedure, the results are
likely to be less susceptible to bias and more efficient than removing patients with incomplete
variables.324-326
Using imputed data, simple logistic regression analyses were conducted to evaluate the
association between surgical outcome (mJOA≥16, mJOA<16) and various clinical and imaging

189
factors. Predictors that yielded a p-value <0.2 in univariate analyses were evaluated in
multivariate analysis.327 In addition, variables that had a p-value >0.2 but were considered to be
clinically relevant were also assessed in multivariate analysis.
Collinearity of all variables was evaluated by calculating tolerance. Manual backward
stepwise regression was used to determine the best combination of predictors. Variables were
included if they a) were statistically significant (p<0.05); b) enhanced the predictive
performance of the model, as determined by the area under the ROC curve; and/or c) were
considered clinically relevant by existing literature or through author consensus. Logistic
regression was used to formulate the final prediction model and compute odds ratios, 95%
confidence intervals and parameter estimates of each covariate. The prediction equation is
given by equation 7-1:
𝑃 =𝑒
𝛽0+𝛽1𝑋1+𝛽2𝑋2+𝛽3𝑋3+⋯𝛽𝑗𝑋𝑗
1+𝑒𝛽0+𝛽1𝑋1+𝛽2𝑋2+𝛽3𝑋3+⋯𝛽𝑗𝑋𝑗
(Equation 7-1)
where P is the probability of achieving an “optimal” outcome (mJOA≥16), β0 is the estimate of
the intercept and β(1,2,3,j) are the parameter estimates of the predictor variables X(1,2,3,j).
7.2.3 Secondary Analysis
Given the non-normal distribution of our data and the limitations of the mJOA scale,
logistic regression analysis was identified as the best statistical model for this patient
population. Similar steps, however, were taken to create a multiple linear regression model
using postoperative mJOA score at 1-year as the dependent variable.
7.3 Results
7.3.1 Patient Sample
Of the 278 patients, six had a preoperative mJOA score of 18 and were excluded from
the analysis. All 272 patients were assessed preoperatively. Two hundred and seventeen of
these patients (79.78%) were assessed for improvements in functional status at 1-year
following surgery. The other 55 patients either withdrew from the study, did not attend their

190
scheduled appointment or died prior to their 1-year postoperative visit. We imputed missing
transverse area measurements and follow-up scores to obtain a complete dataset. Table 7-1
provides a summary of baseline and follow-up characteristics for the entire study population.
The sample consisted of 160 men (58.85%) and 112 women (41.18%), with ages ranging
from 29 years to 86 years (mean 56.64±11.75 years). Patients presented with a wide range of
preoperative severity (3-17) and a mean baseline mJOA score of 12.71 ± 2.64. The mean
duration of symptoms was 26.14±45.89, with a range from 0.50 to 432 months. With respect to
degenerative diagnosis, 78.68% of patients displayed evidence of spondylosis, 69.49% of disc
herniation and 22.43% of a hypertrophied ligamentum flavum. A minority of patients presented
with OPLL (8.82%) and subluxation (4.78%). The most common signs on clinical assessment
were hyperreflexia (73.43%), a positive Hoffman’s sign (63.47%) and broad-based unstable gait
(52.40%) and the most common symptoms were numb hands (89.30%), clumsy hands (78.60%),
and impaired gait (76.01%).
Table 7-1. Patient Baseline Demographic Information and 1-year Functional Outcomes following
Surgery: CSM-North America Study
Variable Descriptive Statistics
Baseline severity score (mJOA) 12.71±2.64 (3-17)
Age (years) 56.64±11.75 (29-86)
Gender (%) 58.85 M, 41.18 F
Duration of symptoms (n=271) (months) 26.14±45.89 (0.5-432)
Smoker (%) 26.10
Co-morbidities (%) Cardiovascular Respiratory Gastrointestinal Renal Endocrine Psychiatric Rheumatologic Neurological
47.06 13.97 17.65 4.41 21.69 24.26 8.82 9.56
Diagnosis (presence, %) Spondylosis Disc herniation OPLL HLF Congenital stenosis Subluxation Other
78.68 69.49 8.82 22.43 15.81 4.78 2.57
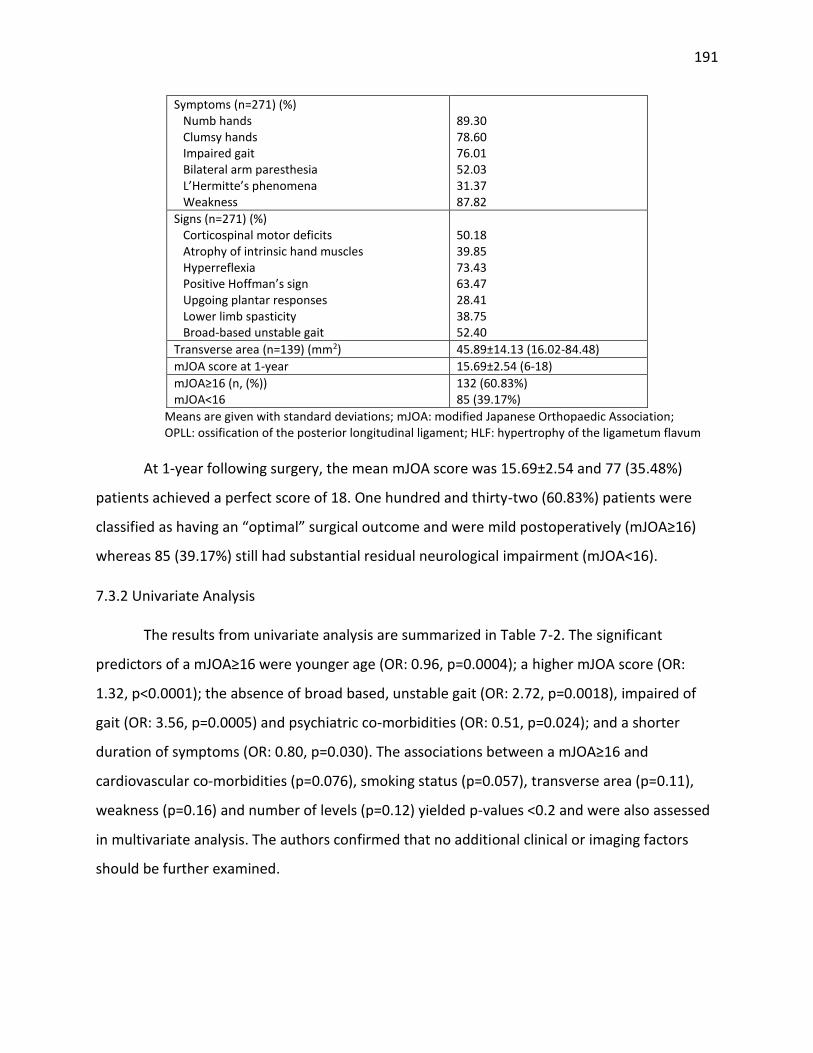
191
Symptoms (n=271) (%) Numb hands Clumsy hands Impaired gait Bilateral arm paresthesia L’Hermitte’s phenomena Weakness
89.30 78.60 76.01 52.03 31.37 87.82
Signs (n=271) (%) Corticospinal motor deficits Atrophy of intrinsic hand muscles Hyperreflexia Positive Hoffman’s sign Upgoing plantar responses Lower limb spasticity Broad-based unstable gait
50.18 39.85 73.43 63.47 28.41 38.75 52.40
Transverse area (n=139) (mm2) 45.89±14.13 (16.02-84.48)
mJOA score at 1-year 15.69±2.54 (6-18)
mJOA≥16 (n, (%)) mJOA<16
132 (60.83%) 85 (39.17%)
Means are given with standard deviations; mJOA: modified Japanese Orthopaedic Association; OPLL: ossification of the posterior longitudinal ligament; HLF: hypertrophy of the ligametum flavum
At 1-year following surgery, the mean mJOA score was 15.69±2.54 and 77 (35.48%)
patients achieved a perfect score of 18. One hundred and thirty-two (60.83%) patients were
classified as having an “optimal” surgical outcome and were mild postoperatively (mJOA≥16)
whereas 85 (39.17%) still had substantial residual neurological impairment (mJOA<16).
7.3.2 Univariate Analysis
The results from univariate analysis are summarized in Table 7-2. The significant
predictors of a mJOA≥16 were younger age (OR: 0.96, p=0.0004); a higher mJOA score (OR:
1.32, p<0.0001); the absence of broad based, unstable gait (OR: 2.72, p=0.0018), impaired of
gait (OR: 3.56, p=0.0005) and psychiatric co-morbidities (OR: 0.51, p=0.024); and a shorter
duration of symptoms (OR: 0.80, p=0.030). The associations between a mJOA≥16 and
cardiovascular co-morbidities (p=0.076), smoking status (p=0.057), transverse area (p=0.11),
weakness (p=0.16) and number of levels (p=0.12) yielded p-values <0.2 and were also assessed
in multivariate analysis. The authors confirmed that no additional clinical or imaging factors
should be further examined.

192
Table 7-2. Univariate Analyses Evaluating the Association between Various Clinical Predictors
and a mJOA Score ≥16 at 1-year following Surgery
Predictor Odds Ratio 95% C.I. p-value
General Characteristics
Baseline severity score (mJOA) 1.32 1.18, 1.48 <0.0001
Age (years) 0.96 0.93, 0.98 0.0004
Duration of symptoms 0.80 0.65, 0.98 0.030
Smoking Status* 0.53 0.27, 1.30 0.057
Co-morbidities (REF=absence)
Psychiatric 0.51 0.29, 0.92 0.024
Cardiovascular* 0.62 0.36, 1.05 0.076
Symptoms (REF=presence)
Impaired gait 3.56 1.75, 7.22 0.0005
Weakness* 1.83 0.78, 4.26 0.16
Signs (REF=presence)
Broad-based unstable gait 2.72 1.47, 5.06 0.0018
Other
Transverse area (mm2)* 1.02 0.995, 1.05 0.11
Number of levels* 0.84 0.68, 1.04 0.12
CI: confidence interval; mJOA: modified Japanese Orthopaedic Association; baseline mJOA: 0-18; symptom duration (1-5): 1) <3 months, 2) >3, ≤6 months, 3) >6, ≤12 months, 4) >12, ≤24 months, 5) >24 months. A * indicates variables that did not have p<0.1 but were included in multivariate analysis because p<0.2
7.3.3 Multivariate Analysis
Table 7-3 displays the final logistic regression model and summarizes the odds ratios,
95% confidence intervals and parameter estimates for each included variable. This model
yielded an area under the ROC area of 0.79 and consisted of six statistically significant clinical
variables and one imaging variable deemed clinically relevant (Figure 7-1). According to the
final model, patients are more likely to achieve a mJOA≥16 if they have a higher preoperative
mJOA score (OR: 1.22, p=0.0084); do not smoke (OR: 0.46, p=0.043), have psychiatric co-
morbidities (OR: 0.33, p=0.0035) or impaired gait (OR: 2.66, p=0.020); are younger in age (OR:
0.97, p=0.017); have a shorter duration of symptoms (OR: 0.78, p=0.048); and have a larger
transverse area (OR: 1.02, p=0.19). The final logistic regression model is given by equation 7-2
𝑃 =𝑒−0.028+(−1.12)𝑃𝑠+(0.20)𝑚𝐽𝑂𝐴0+(−0.035)𝐴+(0.98)𝐼𝐺+(−0.78)𝑆+(−0.25)𝐷𝑆+(0.020)𝑇𝐴
1+𝑒−0.028+(−1.12)𝑃𝑠+(0.20)𝑚𝐽𝑂𝐴0+(−0.035)𝐴+(0.98)𝐼𝐺+(−0.78)𝑆+(−0.25)𝐷𝑆+(0.020)𝑇𝐴 (Equation 7-2)

193
where Ps is presence (2) or absence (1) of psychiatric co-morbidities, mJOA0 is baseline severity
score (0-18); A is age; IG is presence (1) or absence (2) of impaired gait; S is smoker (2) or non-
smoker (1); DS is duration of symptoms (1-5, see methods); and TA is transverse area.
With respect to odds ratios, the odds of a successful outcome i) decrease by 22% when
a patient moves from a shorter to a longer duration of symptoms group (i.e from ≤3 to 3-6
months); ii) are 1.22 times greater for every one point increase in preoperative mJOA; iii)
decreases by 3% for every one year increase in age; iv) are approximately half for patients who
smoke compared to non-smokers; v) are 2.66 times greater for patients without impaired gait;
vi) are 67% lower for patients with depression or bipolar disorder; and vii) are 1.02 times
greater for every one point increase in transverse area (Table 7-3).
Figure 7-1. Receiver Operating Curve for the Final Clinical Prediction Model A ROC curve plots the true positive rate (sensitivity) against the false positive rate (1-specificiy). The predictive performance of this model can be quantified by calculating the area under the ROC curve. An area of 1 indicates a perfect test (100% specific and 100% sensitive), whereas an area of 0.5, displayed by the linear diagonal line, indicates no discriminative value. An area of 0.79 suggests that this model has near excellent discrimination, defined as an area between 0.80-0.90.

194
Table 7-3: A Clinical Prediction Model to Determine Functional Status and Predict an “Optimal” Surgical Outcome (mJOA≥16)
Predictor Odds Ratio 95% C.I. p-value
Psychiatric Disorders (REF=absence) 0.33 0.15-0.69 0.0035
Baseline mJOA 1.22 1.05-1.41 0.0084
Age (years) 0.97 0.94-0.99 0.017
Impairment of Gait (REF=presence) 2.66 1.17-6.06 0.020
Smoking (REF=non-smoker) 0.46 0.21-0.98 0.043
Symptom Duration 0.78 0.61-0.997 0.048
Area (mm2) 1.02 0.99-1.05 0.19
CI: confidence interval; mJOA: modified Japanese Orthopaedic Association; baseline mJOA: 0-18; symptom duration (1-5): 1) <3 months, 2) >3, ≤6 months, 3) >6, ≤12 months, 4) >12, ≤24 months, 5) >24 months
7.3.4 Secondary Analysis
A secondary analysis using linear regression modeling yielded similar results to logistic
regression: the same set of predictors were identified as the most clinically and statistically
significant (Table 7-4). The model had a R2 of 0.26 and is given by equation 7-3:
𝐹𝑖𝑛𝑎𝑙 𝑚𝐽𝑂𝐴 = 14.34 + (−1.23)𝑃𝑠 + (0.21)𝑚𝐽𝑂𝐴0 + (−0.022)𝐴 + (0.96)𝐼𝐺 + (−0.73)𝑆 + (0.024)𝑇𝐴 +
(−0.31)𝐷𝑆 + (0.024)𝑇𝐴 (Equation 7-3)
where Ps is presence (2) or absence (1) of psychiatric co-morbidities, mJOA0 is baseline severity
score (0-18); A is age; IG is presence (1) or absence (2) of impaired gait; S is smoker (2) or non-
smoker (1); DS is duration of symptoms (1-5, see methods); and TA is transverse area.
Table 7-4. Final Linear Regression Model using Postoperative mJOA at 1-year as the Dependent Variable
Predictor β-estimate 95% C.I. of Parameter Estimates
p-value
Psychiatric Disorders β=-1.23 -1.92, -0.55 p=0.0005
Baseline mJOA β=0.21 0.076, 0.34 p=0.0020
Symptom Duration β=-0.31 -0.53, -0.091 p=0.0057
Impairment of Gait β=0.96 0.27, 1.64 p=0.0062
Smoking β=-0.73 -1.45, -0.015 p=0.045
Area (mm2) β=0.024 -0.0031, 0.050 p=0.081
Age (years) β=-0.022 -0.047, 0.0030 p=0.084
CI: confidence interval; mJOA: modified Japanese Orthopaedic Association; baseline mJOA: 0-18; symptom duration (1-5): 1) <3 months, 2) >3, ≤6 months, 3) >6, ≤12 months, 4) >12, ≤24 months, 5) >24 months
195
Similar to the logistic regression model, a higher postoperative mJOA score is associated
with the absence of impaired gait (p=0.0062) and psychiatric co-morbidities (p=0.0005); a
higher baseline mJOA score (p=0.002); younger age (p=0.084); non-smoking (p=0.045); a larger
transverse area (p=0.081); and a shorter duration of symptoms (p=0.0057) (Table 7-4).
7.4 Discussion
This study represents the first prospective, multicenter study and the largest analysis of
important predictors of surgical outcome in patients with symptomatic CSM. These results
should be generalizable to future CSM populations as our sample consisted of patients with a
wide range of ages, baseline severity scores and duration of symptoms as well as an adequate
percentage of patients presenting with various signs, symptoms and co-morbidities.
Based on our results, patients are more likely to achieve an “optimal” surgical outcome
(mJOA≥16) if they have milder myelopathy preoperatively and a shorter duration of symptoms;
are younger; do not smoke; do not have psychiatric disorders or impaired gait; and have a
larger transverse area. These seven variables were included in the final logistic regression
equation that can be used to accurately and objectively quantify a patient’s probability of
obtaining a score ≥16 on the mJOA. The patients who achieve this score will either be
asymptomatic or exhibit mild symptoms of myelopathy and will likely be socially independent.
This is in contrast to patients with a mJOA score <16 who will have substantial residual
neurologic impairment and may require assistance to perform simple, daily activities. Our
prediction model yielded an area under the ROC curve of 0.79, indicating a good ability to
discriminate between patients who will and will not achieve an “optimal” surgical outcome.
The multiple linear regression equation consisted of the same seven predictors as the
logistic regression equation. All of the variables, including transverse area, were statistically
significant (p<0.1). This model is more clinically useful as it allows clinicians to calculate an exact
postoperative mJOA score instead of the odds of achieving a mJOA score ≥16. This model,
however, violates a key assumption of multiple linear regression analysis because the mJOA at
1-year was not normally distributed: 50% of patients had a final mJOA of 17 or 18, with 35%
achieving a perfect score.

196
It is important to interpret our results in the context of existing evidence. Several
previous studies have reported that both baseline severity score and duration of symptoms are
important predictors of surgical outcome.97, 129, 138, 143, 228, 229, 300, 328 The rationale behind these
two findings is that severe and chronic, longstanding compression of the spinal cord may lead
to irreversible histological damage such as cavitation, demyelination and necrosis of the gray
matter.
There is no consensus in the literature as to whether age is a significant predictor of
surgical outcome. Based on this North American prediction study, older patients have a
decreased odds of achieving an “optimal” outcome. We do not, however, recommend that
surgeons discriminate on the basis of age but rather be aware that their elderly patients may
not be able to translate neurological recovery to functional improvement as effectively as their
young patients. Possible explanations for this reduced recovery include 1) the elderly
experience age-related changes of their spinal cord, including a decrease in γ-motorneurons,
number of anterior horn cells and number of myelinated fibers in the corticospinal tracts and
posterior funiculus; 2) older patients are more likely to have co-morbidities that may affect
outcome; and/or 3) the elderly may not be able to effectively conduct all activities on the mJOA
due to these co-morbidities.124, 157, 170, 216, 217 It is important that a clinician distinguish between
a patient’s chronological age and his/her physiological age when predicting surgical outcome. In
general, however, age is associated with poorer surgical outcomes and so the expectations of
elderly patients should be managed accordingly.
This study also found that smokers are less likely to achieve an “optimal” outcome than
non-smokers. Previously, it was suggested that smoking negatively affects outcomes in lumbar
spine surgery as it is correlated with lower rates of fusion and a higher risk of wound infections.
Hilibrand et al. (2001) investigated the impact of smoking in CSM patients following multilevel
anterior cervical decompression with autogenous bone grafting and reported a higher rate of
solid osseous union in non-smokers compared to smokers.302 These increased fusion rates
resulted in better surgical outcomes in the non-smoking population. In our study, however,
there were no significant differences in rates of pseudoarthrosis or non-union between patients
who did and did not smoke. Therefore we do not believe the unfavorable outcome in the

197
smoking population is due to low fusion rates. Instead, we speculate that smoking is a surrogate
for poorer lifestyle choices, lower socioeconomic status and an increased number of co-
morbidities. Further research is required to validate these conclusions and to determine exactly
why smoking leads to unfavorable outcomes.
Single studies have reported that both impaired gait and the presence of psychological
co-morbidities have a negative impact on surgical results. Wang et al. (2003) studied a series of
patients undergoing revision laminectomy following failed ACDF and reported that patients
with more severe gait impairment had a poorer surgical outcome as assessed by the Nurick
score.203 Kumar et al (1999) evaluated the association between emotional and psychological
issues and surgical outcome.206 The major finding of this study was that there was a significantly
greater occurrence of depression, evaluated by the SF-36, in the “poor” outcome group
compared to the “good” outcome group. However, it is challenging to draw conclusions on the
predictive value of psychological co-morbidities based on patient-generated outcome measures
such as the SF-36. Our current study is the first known study to identify a significant association
between clinically diagnosed depression/bipolar disorder and functional outcomes.
The last predictor included in the model was transverse area. In a study by Okada et al
(1993), there was a significant association between preoperative transverse area and recovery
rate in patients with OPLL and CSM.132 This finding is consistent with results from other studies
that suggested transverse area is an important predictor of recovery rate and postoperative
functional status at long-term follow-up.129, 329 In our analysis, however, transverse area was
not significantly associated with outcome. This variable was still included in the final model as it
was identified as a clinically important predictor by all authors based on past experience and
findings from the literature.117
7.5 Study Strengths and Limitations
The data for this analysis was prospectively collected at 12 surgical spine centers across
North America. Since there were multiple recruitment sites, we were able to accrue a sample of
278 patients, which is greater than three times the size of any other CSM prediction study.
Since the patients enrolled were treated surgically at hospitals across the continent, the
198
findings from this study should be more generalizable and applicable to future populations than
conclusions from previous single center studies. One of the major limitations of this study is the
20% drop off rate at 1-year follow-up and the 50% missing transverse area data. The missing
data, however, was accounted for using a multiple imputation procedure as statistically
recommended. Another limitation is the violation of normality in the response variable which
could affect the results of multiple linear regression. Both models will need to be validated on a
second external dataset to confirm their predictive ability in future populations.
7.6 Conclusions
This study represents part 1 of a 4-part study designed to develop a globally valid
prediction model that can be used by clinicians to quantify a patient’s likely surgical outcome
and help manage expectations. Based on this model, patients were more likely to achieve an
“optimal” outcome, or a score ≥ 16 on the mJOA if they were younger; had milder myelopathy
and a shorter duration of symptoms; did not have impaired gait or clinically diagnosed bipolar
or depression; and had a larger transverse area.

199
Chapter 8: A Clinical Prediction Model to Assess Surgical Outcome in
Patients with Cervical Spondylotic Myelopathy: Internal and External
Validation using the Prospective Multicenter AOSpine North American
and International Datasets in 743 Patients
8.1 Introduction
This chapter summarizes the methodology and results from an external validation study
designed to test the predictive performance of our North American model in an international
population. This chapter represents part 2 of our 4-part prediction study.
The prediction rule developed in Chapter 7 cannot be implemented into clinical practice
until its predictive performance is assessed on an independent, external population. This is
referred to as geographic validity and is evaluated by testing the model in a similar sample of
patients (i.e. symptomatic, surgical CSM patients) at institutions in other cities, countries and
even continents. The original prediction model was derived using data from 272 patients
enrolled in the CSM-North America study and therefore reflects the culture, population
characteristics and medical system of North America. There may exist international variations in
the management of CSM that may decrease the generalizability of our model and render it
invalid in regions outside of North America. These include differences in 1) disease definitions
and presentation, 2) average demographics, 3) interpretation of predictors or outcome, 4)
access to care, and 5) management strategies. The following examples provide reasons for why
these differences may or may not affect the predictive performance of our North American
model in an international population.
1) Differences in disease definitions and presentation
In both the North America and International study, the definition of CSM was all-
encompassing and included myelopathy secondary to spondylosis, chronic disc herniation,
OPLL, hypertrophy of the ligamentum flavum, subluxation and congenital stenosis. This broader
definition was used to prevent discrepancies in disease definitions across centers and as a first
step to standardize nomenclature at an international level.3
200
Differences in disease presentation across countries may influence prognosis and result
in disappointing generalizability of our clinical prediction model. Specifically, these include a
higher incidence of OPLL and congenital stenosis in East Asia and a larger proportion of patients
with hypertrophy of the ligamentum flavum in Latin America.18, 330 Several previous studies
have separated their patient sample into groups depending on whether the primary
degenerative diagnosis was CSM, OPLL or disc herniation, whereas others have analyzed the
sample as a whole. To the best of our knowledge, the form of degenerative cervical myelopathy
is not a significant predictor of outcome and therefore differences in disease causation
worldwide should not affect the results of external validation.
2) Differences in demographic characteristics
Regional differences in patient demographics may also influence surgical outcome and
affect the validity of our model. In the CSM-International study, key differences included a
younger population in Asia and Latin America, a longer duration of symptoms in Latin
Americans, and a lower frequency of psychiatric disorders in sites outside of North America.
These regional variations in demographics could result in international differences in prognosis
and impact the external validity of our clinical prediction model.
3) Differences in reliability of predictors and outcome
Measurement error affects the reliability of the predictors and outcome assessment
tools. With respect to our prediction model, age, smoking status and impaired gait are assumed
to be reliable variables. In contrast, psychiatric disorders is a less reliable factor as there may be
cultural reluctance to report mental illness and variations in diagnosis across regions. The
reliability of “duration of symptoms” is unknown; however, the exact symptom duration may
be difficult for a patient to accurately recall and may be influenced by how urgently a patient
believes he needs surgery. Finally, the reliability of the mJOA has not been tested, resulting in
potential measurement biases. Even if the reliability of the English version of the mJOA was
known, the scale’s translatability would need to be evaluated as the International study was
conducted in several different languages.
201
4) Differences in socioeconomic status and access to care
Access to surgical and post-surgical care could affect a patient’s outcome. Patients who
are required to pay for their medical care may be reluctant to see a physician at a milder
disease stage. This means that these patients may present with more severe myelopathy and a
longer duration of symptoms, both of which negatively impact outcome. Post-surgical
rehabilitation is also essential for optimal results and recovery. Again, patients who have less
access to this type of care or who have to pay for it out of pocket may be less likely to follow
the exact post-operative management program.
5) Differences in management strategies
Surgeons have different technical preferences. For example, the anterior approach was
more commonly used by surgeons from Asia, Europe and North America, whereas Latin
American surgeons preferred the posterior approach. With respect to specific posterior
techniques, surgeons in Asia typically performed a laminoplasty instead of a laminectomy with
fusion. Patients in North America had a greater number of operated levels than the other three
regions. Although these differences in management strategies seem significant, surgical
approach, technique and number of decompressed levels are not important predictors of CSM
outcome. Therefore, these differences are not likely to influence prognosis in this setting.
The objective of this study was to assess the internal and external validity of the clinical
prediction rule described in Chapter 7. The external validation was completed using a
prospective cohort of 479 patients enrolled in the AOSpine CSM-International trial from 16
international sites. Given the nature of the derivation and validation datasets, these two studies
represent the largest and most comprehensive evaluation of important clinical predictors of
surgical outcome in patients with CSM.308 The validation of this model will allow it to be
implemented in clinical practice, enabling surgeons to accurately quantify outcome, manage
their patient’s expectations and improve treatment strategies for CSM.

202
8.2 Methods
8.2.1 Patient Sample
Our sample consisted of 479 symptomatic CSM patients participating the CSM-
International study from 16 global sites.
8.2.2 Statistical Analysis
Continuous predictors were summarized using means, standard deviations and ranges.
Categorical variables were described using frequencies. Demographics and surgical outcomes
were compared between the derivation (CSM-North America) and validation (CSM-
International) groups and across four geographical subsamples (Asia, Europe, Latin America and
North America).
Internal validity was assessed using a bootstrap re-sampling procedure with 200
individual bootstrap replicates. The original model was fitted to each replicate and mean odds
ratios and 95% confidence intervals were generated for each predictor. The area under the
receiver operating curve (AUC) was computed across the bootstrap replicates and compared to
the AUC for the original model. A Chi-square test was used to statistically evaluate the
differences in areas. The model is internally valid if the mean odds ratios for the replicates are
contained within the confidence intervals of the original estimates and if there is no significant
difference between the AUCs.
The external validity of the prediction rule was evaluated by determining the
performance of the original model on a second dataset collected from the CSM-International
study. A model’s discrimination refers to how accurately it can distinguish between two groups:
in the case of this study, between patients with a postoperative score ≥16 and those with a
score <16. A model’s calibration reflects how closely the predicted probabilities match the
observed outcomes.
The discrimination of the model was assessed by computing the AUC for the validation
model and statistically comparing it to the AUC for the original model. If there is no significant
difference between the AUCs then we can conclude the model is equally valid internationally as
203
it is in North America. An AUC of 1.0 reflects perfect discrimination and 0.5 indicates zero
discrimination.
The model’s calibration was evaluated by first predicting the probabilities of an
“optimal” outcome and then dividing the patients into groups of ten based on their rank-order.
The mean predicted probability was computed for each group of ten and compared to the
proportion of patients that actually achieved a score ≥16 in that group. The observed versus
predicted probabilities were graphed to create a calibration plot and the slope and y-intercept
were calculated. A calibration plot with a slope of one and a y-intercept of zero represents
perfect calibration.331 The value of the intercept indicates whether the predictions are too high
or too low.332, 333 A slope value smaller than one reflects overfitting and can indicate a need to
shrink regression coefficients.333 The observed:expected ratios of probabilities with 95%
confidence intervals were averaged across the groups to determine whether there was a
significant difference between observed and expected outcomes. Finally the Hosmer-
Lemeshow test was conducted to evaluate the “goodness-of-fit” of the model. The model has
excellent fit in the international population if it has a calibration slope and an
observed:expected ratio close to one and a non-significant goodness of fit test. This indicates
that the model is able to successfully predict outcome in an external population.
The model was then refitted on the CSM-International dataset to examine differences in
parameter estimates, odds ratios, and model performance.334 Differences in the AUC were
compared using a Chi-square test.
8.3 Results
8.3.1 Patient Sample
Of the 479 participants of the CSM-International study, eight had a pre-operative mJOA
score of 18 and were excluded from this analysis. Three hundred and ninety-seven patients
were evaluated at 1-year postoperatively, yielding an overall follow-up rate of 84.5%. Missing
follow-up data were assumed to be missing at random and were replaced with a set of
plausible values using a multiple imputation procedure with ten iterations. This procedure was

204
used as the results are likely to be less susceptible to bias and it is more efficient than removing
patients with incomplete variables.324-326 Table 8-1 provides a summary of relevant baseline
characteristics and 1-year post-operative mJOA scores for the CSM-North America and CSM-
International study populations and for the geographic subsamples of the International dataset.
There was no difference in mean baseline severity score between the CSM-North
America derivation group, the CSM-International validation cohort and the regional subgroups.
North American patients from the CSM-International study were, on average, older
(59.60±11.63) than the derivation group (56.46±11.75) and those from the Asian (54.18±12.13)
and Latin American (54.14±10.81) subsamples were, on average, younger. Similar proportions
of patients smoked and had impaired gait in all groups. Interestingly, the percentage of patients
with psychiatric co-morbidities was significantly smaller in the CSM-International dataset than
in the CSM-North America study: 24% of patients in North America were diagnosed with
depression or bipolar disorder whereas only 7.9% of the international sample had clinically
defined psychiatric disease. Of the 37 patients in the CSM-International population that were
identified as having psychiatric co-morbidities, 31 were from North American sites,
representing a similar prevalence to what was reported in the derivation group (25%). Finally,
with respect to outcome, the mean post-operative score was significantly lower in the
validation population (14.91±2.68) than in the derivation group (15.69±2.54). Patients from
European (14.21±2.75) and Latin American (14.45±2.86) had, on average, a lower postoperative
mJOA score than patients from the derivation group.
8.3.2 Original Model
The original North American prediction model, derived from the CSM-North American
dataset, consisted of seven predictors: baseline mJOA, duration of symptoms, smoking status,
psychiatric co-morbidities, age, impaired gait and transverse area. Based on recent findings
from a systematic review (Chapter 3), transverse area was removed from the model as there is
insufficient evidence supporting its importance as a predictor and because it was also
statistically insignificant in our analysis.335 A summary of the modified model along with odds

205
ratios and 95% confidence intervals for each covariate are provided in Table 8-2. The new
model used to quantify the probability of a mJOA≥16 is presented in equation 8-2:
(Equation 8-2)
where Ps is presence (2) or absence (1) of psychiatric co-morbidities, mJOA0 is baseline severity
score (0-18); A is age; IG is presence (1) or absence (2) of impaired gait; S is smoker (2) or non-
smoker (1); and DS is duration of symptoms (1-5, see chapter 5/7).
Table 8-1. General Characteristics of the CSM-North America and the CSM-International study
Derivation Group (n=272)
Temporal Validation Group
North America Subsample
Europe Subsample
Asia Pacific Subsample
Latin America Subsample
Setting (sites per country or region)
11 United States, 1 Canada
2 North America, 3 Latin America, 6 Asia, 5 Europe
1 United States, 1 Canada
2 Italy, 1 Ireland, 1 Turkey, 1 Netherlands
1 China, 1 India, 1 Singapore, 3 Japan
2 Brazil, 1 Venezuela
Inclusion Period Sept. 2005-Dec. 2007
Oct. 2007- Jan. 2011
Oct. 2007- Jan. 2011
Oct. 2007- Jan. 2011
Oct. 2007- Jan. 2011
Oct. 2007- Jan. 2011
Age (range) 56.46±11.75 (29-86)
56.49±11.92 (21-87)
59.60±11.63 (37-87)*
57.64±11.88 (26-86)
54.18±12.13 (28-86)*
54.14±10.81 (21-78)*
Duration of symptoms (range)
26.14±45.89 (0.5-432)
27.17±34.90 (0.25-240)
28.29±36.60 (0.25-240)
25.16±32.78 (0.5-240)
22.17±35.88 (0.25-182)
38.25±31.38 (1-144)*
Baseline severity score (range)
12.71±2.64 (3-17)
12.41± 2.79 (3-17)
12.26±2.39 (6-17)
12.80±2.87 (6-17)
12.22±2.91 (3-17)
12.38±.02 (4-17)
Psychiatric Disorders† Grade 1 Grade 2 Grade 3 Unspecified
66/206 44 1 0 21
37/432** 33 3 0 1
31/92 27 3 0 1
2/121** 2 0 0 0
3/143** 3 0 0 0
1/76* 1 0 0 0
Smoking Status (Y/N) 71/201 128/343 37/86 38/85 32/116 21/56
Impaired Gait (Y/N) 206/65 362/109 95/28 90/33 114/34 63/14
Postoperative severity score (range)
15.69±2.54 (6-18)
14.91±2.68 (5-18)*
15.29±2.41 (9-18)
14.21±2.75 (6-18)*
15.39±2.63 (6-18)
14.45±2.86 (5-18)*
The derivation group is the sample from the CSM-North American study. The validation group consists of all participants from the CSM-International study. *Means and **proportions were significantly different than in the derivation set. †Grade 1: Major depression or bipolar disorder controlled with medication; grade 2: uncontrolled major depression or bipolar disorder or schizophrenia controlled with medication.
𝑃 =𝑒1.59+(−0.81)𝑃𝑠+(0.19)𝑚𝐽𝑂𝐴0+(−0.036)𝐴+(0.91)𝐼𝐺+(−0.69)𝑆+(−0.27)𝐷𝑆
1 + 𝑒1.59+(−0.81)𝑃𝑠+(0.19)𝑚𝐽𝑂𝐴0+(−0.036)𝐴+(0.91)𝐼𝐺+(−0.69)𝑆+(−0.27)𝐷𝑆

206
8.3.3 Internal Validation
The AUC for the original model was 0.77 (95% CI: 0.711, 0.824) and across the bootstrap
replicates was 0.77 (95% CI: 0.762, 0.772), reflecting good discrimination and internal validity
(Figure 8-1). The chi-square test, assessing the difference between the original and bootstrap
areas, yielded a p-value of 0.99. For each predictor, the mean odds ratios closely approximated
the ratios from the original model. In addition, the 95% confidence intervals generated from
the bootstrapping data were narrow and contained the original odds ratio for each covariate
(Table 8-2). Each variable was equally predictive in the original and bootstrapped models.
Table 8-2. Odds Ratios for Original North American Model and Bootstrap Model
Predictor Original Model Odds Ratio
Original Model 95% Confidence
Bootstrap Odds Ratio
Bootstrap 95% Confidence
Baseline mJOA 1.21 1.07, 1.37 1.21 1.20, 1.22
Duration of symptoms 0.76 0.59, 0.99 0.77 0.75, 0.78
Smoking Status 0.50 0.22, 1.14 0.52 0.49, 0.55
Psychiatric Disorders 0.44 0.22, 0.88 0.45 0.42, 0.47
Age 0.96 0.94, 0.99 0.96 0.96, 0.97
Impaired Gait 2.48 1.10, 5.57 2.48 2.32, 2.65
mJOA: modified Japanese Orthopaedic Association
Figure 8-1. Receiver Operating Curves for Original and Bootstrap Models A ROC curve plots the true positive rate against the false positive rate. An area under the curve of 1 indicates a perfect test, whereas an area of 0.5 (green line) indicates no discriminative ability. The area under the curves for the original (purple) and bootstrap (red) models were not significantly different from each other.

207
8.3.4 External Validation
Figure 8-2. Receiver Operating Curves for the Original North American Model (red) and the Model Validated on the International Population (blue) The area under the curves for both the original and validated models were significantly different from 0.5 but were not significantly different from each other. Both models had adequate discrimination.
The AUC was reduced from 0.77 (95% CI: 0.711, 0.824) to 0.74 (95% CI: 0.691, 0.781)
when the model was fitted on the external validation dataset. Figure 8-2 illustrates the
difference between the two ROC curves.
As displayed by Figure 8-3-A, the original model was well calibrated: the
observed/expected points closely followed the 45⁰ line and the slope was 0.81 with an
intercept of 0.11. The calibration of the model run on the CSM-International dataset was
inferior to that of the original model: the points were more clustered and tended to deviate
upward from the 45⁰ line. Furthermore, the slope was 0.75 and the intercept was 0.23,
indicating that our model predicts a slightly better outcome than what is actually observed.
The observed:expected ratios were very close to one for the original model, with
confidence intervals spanning one (1.02, 95%CI: 0.91, 1.15). This indicates that there was no
significant difference between observed and expected results. For the CSM-I validation set,

208
however, the observed:expected ratio was statistically significant (0.79 (95% CI: 0.72, 0.86)),
indicating discrepancies between observed and expected outcomes. Analysis of goodness-of-fit
by the Hosmer-Lemeshow test suggested that both the original and validated model had good
fit (p>0.05) (Table 8-3).
Figure 8-3: Calibration Plots. A (top): Original model; B (bottom): Validated Model Each red dot reflects the predicted versus observed probability for each group of ten. The vertical stripes at the lower horizontal border represent the predicted probabilities of patients who did not achieve a mJOA≥16. The vertical stripes at the upper horizontal border reflect the predicted probabilities of the patients who achieved a successful surgical outcome. The 45⁰ black line indicates perfect calibration.
y = 0.747x + 0.2295
0
0.1
0.2
0.3
0.4
0.5
0.6
0.7
0.8
0.9
1
0 0.2 0.4 0.6 0.8 1
Pre
dic
ted
Pro
bab
iliti
es
Observed Probabilities
y = 0.8144x + 0.1067
0
0.1
0.2
0.3
0.4
0.5
0.6
0.7
0.8
0.9
1
0 0.2 0.4 0.6 0.8 1
Pre
dic
ted
Pro
bab
iliti
es
Observed Probabilities

209
Table 8-3. Calibration of the Original and CSM-International Validation Models
Observed:Expected Ratio (95% CI)
Calibration Slope, y-intercept
Hosmer-Lemeshow Chi-Square Test (Chi-square, p-value)
Original Model 1.02 (0.91, 1.15) 0.811, 0.11 2.85-12.99 (0.94-0.11)
CSM-I Validation Model 0.79 (0.72, 0.86) 0.75, 0.23 5.09-14.75 (0.75-0.064)
CSM: cervical spondylotic myelopathy; CI: confidence interval
With the exception of smoking status (p=0.097), the odds ratios for the modified original
model were all statistically significant, with 95% confidence intervals that did not span one.
When rerunning the multivariable model on the International dataset, the odds ratios for
baseline severity score (ORCSM-I: 1.26, 95%CI: 1.15, 1.39), age (ORCSM-I: 0.97, 95%CI: 0.95, 0.99),
impairment of gait (ORCSM-I: 2.67, 95%CI: 1.45, 4.92) and smoking status (ORCSM-I: 0.55, 95%CI:
0.34, 0.90) were very similar, with confidence intervals containing the original odds ratio. The
major difference between the original and International models was the impact of psychiatric
co-morbidities (ORCSM-I: 1.00, 95%CI: 0.46, 2.17 versus OROriginal: 0.44, 95%CI: 0.22, 0.88) and
duration of symptoms (ORCSM-I: 0.94, 95%CI: 0.80, 1.11 versus OROriginal: 0.76, 95%CI: 0.59, 0.99).
The odds ratios for these two predictors were not significantly different from one. However,
when comparing the AUC between the two models, there was no significant difference in the
predictive performance (AUCOriginal: 0.77, AUCCSM-I: 0.76, p=0.88). The confidence intervals for
the AUC of the International model contained the area yielded by the original North America
model (Table 8-4).
Table 8-4. Refitting the Original Logistic Regression Model on the CSM-International Sample
Predictor Original Model CSM-International
Odds Ratio (95% CI) Baseline mJOA Duration of symptoms Smoking Status Psychiatric Disorders Age Impaired Gait
1.21 (1.07, 1.37) 0.76 (0.59, 0.99) 0.50 (0.22, 1.14) 0.44 (0.22, 0.88) 0.96 (0.94, 0.99) 2.48 (1.10, 5.57)
1.26 (1.15, 1.39) 0.94 (0.80, 1.11) 0.55 (0.34, 0.90) 1.00 (0.46, 2.17) 0.97 (0.95, 0.99) 2.67 (1.45, 4.92)
p-values Baseline mJOA Duration of symptoms Smoking Status Psychiatric Disorders Age Impaired Gait
0.0026 0.0392 0.0972 0.0202 0.0081 0.0285
<0.0001 0.497 0.0179 0.998 0.0026 0.0017
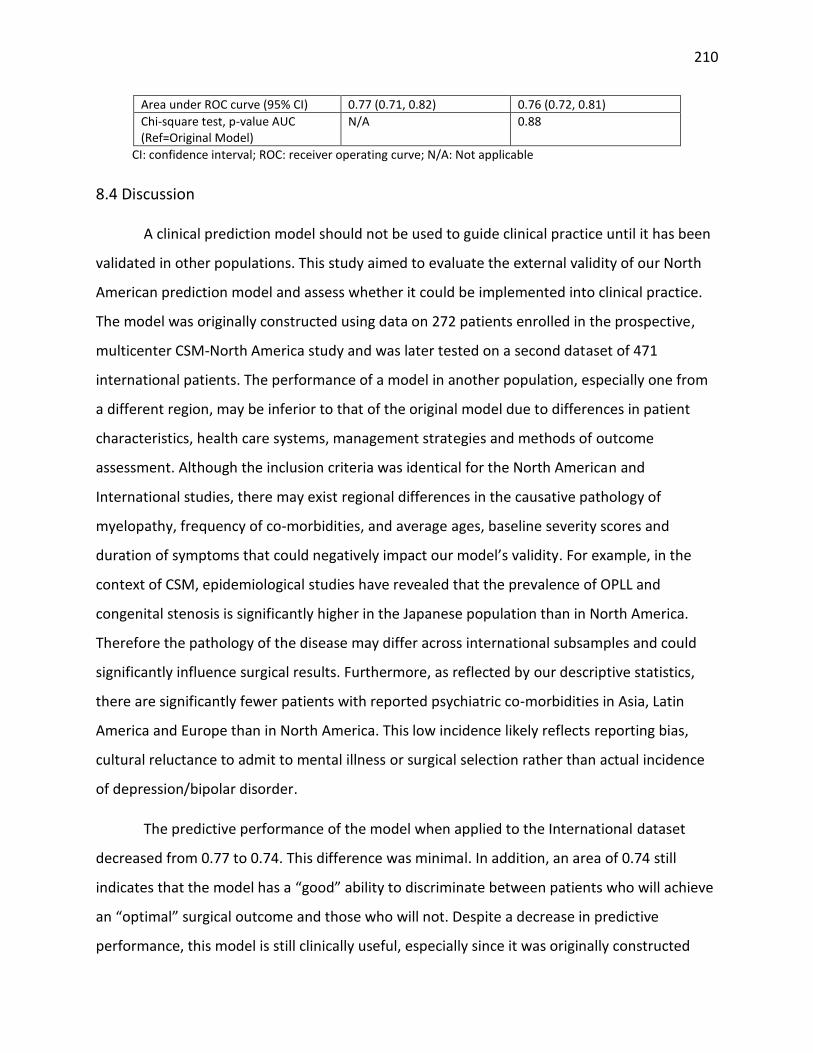
210
Area under ROC curve (95% CI) 0.77 (0.71, 0.82) 0.76 (0.72, 0.81)
Chi-square test, p-value AUC (Ref=Original Model)
N/A 0.88
CI: confidence interval; ROC: receiver operating curve; N/A: Not applicable
8.4 Discussion
A clinical prediction model should not be used to guide clinical practice until it has been
validated in other populations. This study aimed to evaluate the external validity of our North
American prediction model and assess whether it could be implemented into clinical practice.
The model was originally constructed using data on 272 patients enrolled in the prospective,
multicenter CSM-North America study and was later tested on a second dataset of 471
international patients. The performance of a model in another population, especially one from
a different region, may be inferior to that of the original model due to differences in patient
characteristics, health care systems, management strategies and methods of outcome
assessment. Although the inclusion criteria was identical for the North American and
International studies, there may exist regional differences in the causative pathology of
myelopathy, frequency of co-morbidities, and average ages, baseline severity scores and
duration of symptoms that could negatively impact our model’s validity. For example, in the
context of CSM, epidemiological studies have revealed that the prevalence of OPLL and
congenital stenosis is significantly higher in the Japanese population than in North America.
Therefore the pathology of the disease may differ across international subsamples and could
significantly influence surgical results. Furthermore, as reflected by our descriptive statistics,
there are significantly fewer patients with reported psychiatric co-morbidities in Asia, Latin
America and Europe than in North America. This low incidence likely reflects reporting bias,
cultural reluctance to admit to mental illness or surgical selection rather than actual incidence
of depression/bipolar disorder.
The predictive performance of the model when applied to the International dataset
decreased from 0.77 to 0.74. This difference was minimal. In addition, an area of 0.74 still
indicates that the model has a “good” ability to discriminate between patients who will achieve
an “optimal” surgical outcome and those who will not. Despite a decrease in predictive
performance, this model is still clinically useful, especially since it was originally constructed

211
using both statistical and clinical criteria. Although most of the variables included in our
prediction model were statistically significant, the majority were also deemed clinically relevant
by existing evidence in the literature and consensus among professionals. When the model was
rerun on the International dataset, the odds ratio for duration of symptoms was 0.94 and not
significant different than one (p=0.497). However, there is ample evidence suggesting a longer
duration of symptoms is associated with a worse outcome. We therefore suggest that duration
of symptoms should still be included in our international prediction model regardless of its p-
value and that clinicians should always consider this factor when evaluating their patients.
The calibration of the original model was excellent, indicating that the predicted
probabilities closely match the actual outcomes. The Hosmer-Lemeshow test yielded
insignificant results for the model built on the original dataset and on the validation cohort,
reflecting overall “goodness-of-fit.” This demonstrates a strong ability of this clinical prediction
model to accurately predict outcome in future populations.
Based on this study, the key predictors of surgical outcome at a global level are age,
baseline severity score, smoking status and presence of impaired gait. Psychiatric disorders and
duration of symptoms were less important in the international sample than in North America.
This finding, however, is likely due to the low reliability of these two variables and to possible
underreporting of psychiatric disorders in all other locations except for North America. This
knowledge should promote more timely management of CSM, preoperative smoking cessation
and control of co-morbidities and operative intervention on milder patients. In addition, this
information can be used by clinicians to manage their patients’ expectations and provide
counsel where necessary.
8.5 Applying the Model
In a surgical CSM population, a clinical prediction model can be used by surgeons to 1)
manage patients’ expectations; 2) counsel patients and their families about potential treatment
options; 3) identify ways to optimize outcomes; and 4) align their perceptions of outcome with
more objective evidence. In addition, this information can be used by healthcare providers to

212
anticipate future costs and allocate resources according. The following cases highlight how this
clinical prediction model can be used in these four ways to improve patient care.
8.5.1 Managing Expectations
To achieve optimal results, patients must have appropriate and realistic expectations of
their outcome.114, 336-338 Patients who achieve their expected outcome are likely to be more
satisfied with their treatment than those with unrealistic expectations. Expectations are often
dictated by knowledge obtained from healthcare providers, the internet or personal contacts
and may be influenced by psychological factors, educational level and a patient’s trust for his
surgeon.114 A prediction model can help surgeons quantify a patient’s likely outcome and
provide an accurate and objective estimate of how that patient is expected to fare. This will
help manage expectations and ultimately improve overall satisfaction.
The following two cases demonstrate how predicting outcome before surgery can aid in
expectation management.
Case 1: A 49-year old non-smoking male presented with moderate myelopathy (mJOA=14)
secondary to spondylosis, disc herniation and congenital stenosis. This patient had numb and
clumsy hands, muscular weakness, corticospinal motor deficits, hyperreflexia and upgoing
plantar responses. The duration of symptoms was two months. The patient also had coexisting
moderate hypertension, mild respiratory disease and mild diabetes.
Case 2: A 69-year old non-smoking male presented with moderate myelopathy (mJOA=13)
secondary to spondylosis, disc herniation and hypertrophied ligamentum flavum. This patient
had numb and clumsy hands, impaired gait, muscular weakness, corticospinal distribution
motor deficits, hyperreflexia, positive Hoffman sign, upgoing plantar responses and broad-
based unstable gait. The duration of symptoms was 120 months. The patient had a mild stroke.
(Figure 8-4).

213
Figure 8-4. Applying the Clinical Prediction Model in a Surgical Setting: Case 2
Based on our prediction model, case 1 has a 92.7% probability of improving to a mJOA
score ≥16 whereas case 2 only has a 41.0% chance of achieving this outcome. These patients
should be managed differently during the surgical consent process. A surgeon should inform
both patients that they are likely to improve following surgery but should notify case 2 that he
will still have residual neurological impairment. This information will help manage case 2’s
expectations and will likely improve his overall satisfaction. With respect to actual outcomes,
case 1 was neurologically normal postoperatively (mJOA=18) whereas case 2 improved from 13
to 15 but did not reach a score ≥16.
8.5.2 Counseling Patients
Patients with mild myelopathy with few symptoms may be hesitant to undergo surgery.
This prediction model can be used to counsel these patients and convince them that surgery is
likely their best treatment option. A surgeon can inform concerned patients that they have a
progressive, degenerative spine disease and that their outcome of surgery is optimal if they are
operated on earlier and at a milder disease stage.

214
Case 3 provides an example how a surgeon can use a clinical prediction rule to counsel patients
during the surgical consent process.
Case 3: A 53-year old non-smoking male presented with mild myelopathy (mJOA=17)
secondary to spondylosis and disc herniation. This patient had numb and clumsy hands,
bilateral arm paresthesia, muscular weakness and atrophy of intrinsic hand muscles. The
duration of symptoms was four months. The patient had unspecified endocrine co-morbidities.
(Figure 8-5).
Figure 8-5. Applying the Clinical Prediction Model in a Surgical Setting: Case 3
This case is an example of a patient who has mild myelopathy, a short duration of
symptoms and an excellent surgical prognosis. However, he may be reluctant to consent to
neurosurgery for such mild symptoms. This prediction rule can help surgeons counsel this
patient and inform him that if we wait to operate, his symptoms will likely progress and his
outcome will be suboptimal.

215
8.5.3. Influencing Practice
In order for this prediction model to influence practice, we must distinguish between
the variables clinicians have control over and those that cannot be changed. In our prediction
model, the only predictor that is unchangeable is a patient’s age. The other five factors can be
modified:
1) Duration of Symptoms: A longer duration of symptoms is associated with a worst
postoperative outcome. However, this can be changed if clinicians choose to operate
earlier on CSM patients rather than waiting for the disease to progress. This requires
early disease recognition at the level of primary care physicians and early referral for
surgical consultations by either neurologists, rheumatologists or general practitioners.
There should also be an increased emphasis at the medical school level on how to
identify patients with CSM and differentiate between it and other diagnoses such as
carpal tunnel syndrome, multiple sclerosis and vitamin B12 deficiency.48
2) Baseline Severity Score: More severe preoperative myelopathy is predictive of a worse
outcome. This too can be changed through early detection of CSM and by choosing to
operate on milder patients.
3) Smoking Status: It is unclear why smokers have a worse postoperative outcome
compared to non-smokers. Possible explanations include that smoking results in
decreased fusion rates302 and poor healing capacity or that it is a surrogate for lower
socioeconomic status, poorer dietary choices and less access to postsurgical care.
Although the reasoning behind this predictor is unclear, surgeons should still promote
smoking cessation prior to surgery to optimize outcomes.
4) Psychiatric Disorders: Patients with depression or bipolar disorder do not perform as
well following surgery. Some surgeons will preselect their patients based on their
mental state and will choose not to operate on those with psychiatric co-morbidities.
Given the impact on outcome, it may be valuable to ensure that these disorders are
controlled or improved prior to operation.

216
5) Impaired Gait: Impaired gait typically reflects a more severe state of myelopathy and is
predictive of a worse outcome. This factors is related to duration of symptoms and
baseline severity score: if a patient is operated on earlier and at a milder stage, he/she
would likely not have progressed to presenting with more severe symptoms of gait
dysfunction.
From this example, it is clear that clinical prediction models can influence practice,
inform policy changes and impact medical school curriculum. In the context of CSM, it is
essential that clinicians be able to identify this disease at early stages and that surgeons
consider operating on milder patients with a shorter duration of symptoms.
8.5.4 Aligning Surgeon Perceptions with Objective Evidence
Surgeons often have different perceptions as to how a patient will fare following
surgery. As the surgeon often influences a patient’s expectations, it is important that his
estimate of outcome is based on objective evidence and is as accurate as possible. A clinical
prediction rule can help a surgeon predict outcome and use this information during the surgical
consent discussion. Case 4 provides an example of how a clinical prediction rule is useful in this
regard.
Case 4: A 45-year old non-smoking male presented with moderate myelopathy (mJOA=14)
secondary to spondylosis and disc herniation. This patient had numb and clumsy hands,
impaired gait, muscular weakness and atrophy of intrinsic hand muscles. The duration of
symptoms was 60 months. The patient had coexisting mild respiratory disease. (Figure 8-6).
For each patient, the surgeon was asked how he expected the subject to do following
surgical intervention: improve from baseline status, remain the same or worsen. For case 4, the
surgeon believed the subject would be the same as baseline. Our prediction model predicted an
83.2% chance the patient would achieve a score ≥16 and therefore improve by at least two
points on the mJOA. The patient did indeed improve following surgery and was neurologically
normal at 1-year follow-up. This example demonstrates how a prediction rule can align
surgeons’ perceptions with more objective evidence.

217
Figure 8-6. Applying the Clinical Prediction Model in a Surgical Setting: Case 4
8.6 Strengths and Limitations
The major strength of this study is that the case report forms for the CSM-North
American and CSM-International studies were identical. Data for the variables included in the
original model were available for all patients enrolled in the CSM-International study. This
enabled validation to be done without having to develop proxy variables.331 The presence of 12
North American and 14 International recruitment sites allowed for the accrual of 272 patients
for model building and internal validation and 471 patients for external validation. These large
sample sizes, the consecutive recruitment pattern and the prospective nature of the datasets
distinguish this current study from other past CSM studies. Finally, the presence of ongoing
external monitoring for both the International and North American studies has ensured
collection of high quality and reliable data.
One of the limitations associated with our data was that we were not able to test the
validity of the model in each geographic subsample due to a low frequency of psychiatric co-
morbidities at sites outside of North America. This low prevalence could be due to
underreporting and poor reliability of this variable or may reflect sociocultural perceptions of
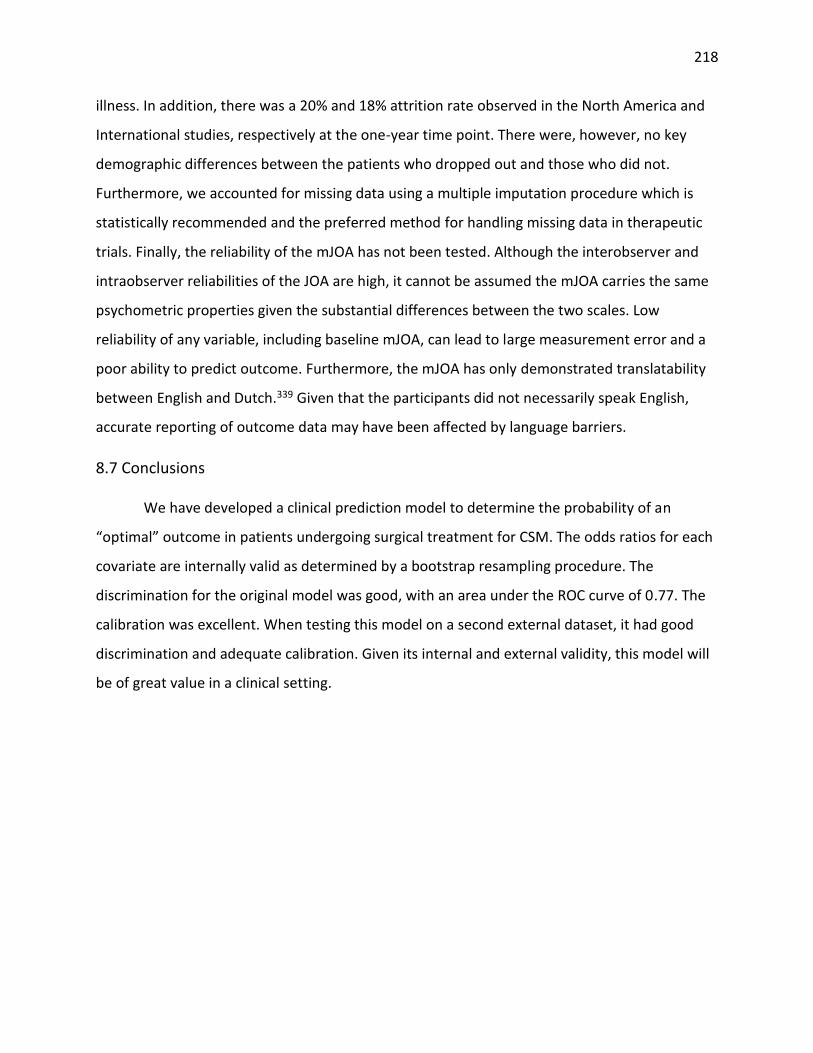
218
illness. In addition, there was a 20% and 18% attrition rate observed in the North America and
International studies, respectively at the one-year time point. There were, however, no key
demographic differences between the patients who dropped out and those who did not.
Furthermore, we accounted for missing data using a multiple imputation procedure which is
statistically recommended and the preferred method for handling missing data in therapeutic
trials. Finally, the reliability of the mJOA has not been tested. Although the interobserver and
intraobserver reliabilities of the JOA are high, it cannot be assumed the mJOA carries the same
psychometric properties given the substantial differences between the two scales. Low
reliability of any variable, including baseline mJOA, can lead to large measurement error and a
poor ability to predict outcome. Furthermore, the mJOA has only demonstrated translatability
between English and Dutch.339 Given that the participants did not necessarily speak English,
accurate reporting of outcome data may have been affected by language barriers.
8.7 Conclusions
We have developed a clinical prediction model to determine the probability of an
“optimal” outcome in patients undergoing surgical treatment for CSM. The odds ratios for each
covariate are internally valid as determined by a bootstrap resampling procedure. The
discrimination for the original model was good, with an area under the ROC curve of 0.77. The
calibration was excellent. When testing this model on a second external dataset, it had good
discrimination and adequate calibration. Given its internal and external validity, this model will
be of great value in a clinical setting.

219
Chapter 9: Does Magnetic Resonance Imaging Improve the Predictive
Performance of our Validated Clinical Prediction Rule
9.1 Introduction
This chapter provides an overview of the methodology and results of a study that
explored the predictive value of MRI. This chapter is part 3 of our 4-part prediction study.
MRI is the globally accepted method of evaluating patients with CSM as it can determine
the severity of degenerative changes, quantify the degree of cord compression due to canal
stenosis and detect any intrinsic spinal cord abnormalities.33, 34 Furthermore, MRI can
effectively distinguish between CSM and other pathologies such as epidural abscesses,
neoplasms and demyelinating plaques.32
In addition to its diagnostic utility, MRI may play a role as a prognostic indicator for
CSM. In our survey of AOSpine International members, 86% of spine professionals agreed that
MRI is valuable in predicting surgical outcome in these patients.340 Furthermore, our systematic
review341 reported that a hyperintense signal on a T2WI is a valuable predictor when used in
combination with a hypointense signal on a T1WI; as a ratio comparing compressed versus non-
compressed segments; or as a ratio of T2 to T1 signal change.341 In contrast, certain anatomical
measurements were not associated with outcome, including compression ratio at the level of
maximum spinal cord compression (MSCC) or transverse area.
In a study by Nouri et al (2014), a model was developed to predict an “optimal” surgical
outcome (mJOA≥16) using only MRI parameters and preoperative myelopathy severity. This
model was constructed using a subset (n=102) of patients enrolled in the CSM-North America
study and included a hypointense signal change on T1-WI (OR: 0.242, p=0.029), maximum canal
compromise (MCC) (OR: 0.94, p=0.005) and baseline mJOA (OR: 1.74, p<0.001). The area under
the receiver operating curve was 0.845 which is higher than the discriminative ability of our
original North American prediction model. Given these findings, we hypothesized that there
may be potential to further improve the validity of our prediction model by incorporating

220
certain imaging factors. This study aims to determine whether the addition of MRI parameters
enhances the predictive performance of our original, validated model.
9.2 Methods
9.2.1 Patient Sample
We were only able to obtain images for 149 of the 278 patients as MRI data collection
was not a prerequisite for the original CSM-North America study. Of these 149 patients, 35
were excluded due to incompatible imaging formats, imaging artifacts/poor image quality and
other factors preventing quantitative analysis. Ninety-nine patients were evaluated at 1-year
postoperatively and comprised the cohort for this analysis (Figure 9-1).
Figure 9-1. An Overview of our Patient Sample derived from the CSM-North America Study
9.2.2 Statistical Analysis
The validity of the original model on the smaller dataset (n=99) was evaluated by
computing the AUC and comparing this value to the area of the original model. Each MRI
parameter was added to the model individually and the AUC and 95% confidence intervals were

221
computed. This area was compared to the area of the original model using a simple Chi-square
test. A p-value <0.05 indicates that the discriminative ability of the model with the imaging
variable is significantly greater than that of the original model with only clinical predictors. ROC
curves were plotted to visualize the contribution of each MRI parameter to the predictive
performance of the original model.
9.3 Results
Our cohort consisted of 61 men (61.62%) and 38 women (38.38%), with ages ranging
from 29 to 86 years (mean age=55.88±11.73). Patients had a wide range of preoperative
severities (mJOA=5-18), and a mean baseline mJOA score of 12.86±2.80. Sixty-eight percent of
patients displayed a hyperintense region on a T2-WI, whereas only 27% had a hypointense
signal on a T1-WI. Average signal change ratios ranged from 0.43±0.13 using Arvin’s criteria to
1.50±0.42 using Wang’s criteria. The mean MSCC was 33.78%±15.35% and MCC was
48.55%±13.22%. Table 9-1 presents a complete summary of demographic and imaging
information for these patients. As illustrated by Figure 9-2, sixty percent achieved an outcome
≥16 and were either asymptomatic or mild post-operatively, whereas 40% still had substantial
residual neurological impairment (mJOA<16).
Figure 9-2. Summary of Functional Outcome at 1-year Post-Surgery Red indicates a score of greater than or equal to 16 (60%) and blue represents a score less than 16 (40%).
0
5
10
15
20
25
30
35
8 10 11 12 13 14 15 16 17 18
Freq
uen
cy
mJOA at 1-year postoperatively

222
Table 9-1. Demographic and MRI Information of a Subset of 99 Patients Enrolled in the CSM-
North America Study
Variable Descriptive Statistics
General Characteristics
Baseline severity score (mJOA) (n=99) 12.86±2.80 (5-18)
Age (n=99) (years) 55.88±11.73 (29-86)
Gender (n=99) (%) 61.62 M, 38.38 F
Duration of Symptoms (n=99) (months) 28.60±35.82 (2-240)
Imaging Characteristics
T1-hypointensity (n=93) (%) 26.88 Y, 73.12 N
T2-hyperintensity (n=96) (%) 67.71 Y, 32.29 N
Combined T1/T2 signal (n=87) (%) 29.89 Normal/Normal 45.98 Normal/High 24.14 Low/High
Height (cm) of T2 signal change (n=96) (%) I: height = 0 II: 0 < height ≤ 0.75 III: 0.75 < height ≤ 1.50 IV: 1.50 < height
32.29 20.83 21.88 25.00
Area (cm2) of T2 signal change (n=96) (%) I: area = 0 II: 0 < area ≤ 0.2 III: 0.2 < area ≤ 0.35 IV: 0.35 < area
32.29 30.21 21.88 15.63
Wang’s Ratio (n=96) 1.50±0.42 (0.91-3.10)
Arvin’s Ratio (n=96) 0.43±0.13 (0.21-0.92)
Aria’s Ratio (n=96) 1.43±0.38 (0.90-2.97)
Spinal Canal Compromise (n=94) (%) 48.55±13.22 (16.12-75.33)
Spinal Cord Compression (n=94) (%) 33.78±15.35 (-4.60-64.86)
The original model was valid on the subsample and had an AUC of 0.811 (95% C.I.:
0.726, 0.896). The predictive performance of the original model was compared to that of
secondary models that included various imaging parameters. There were no significant
differences in the AUCs between the original model and those that included T2 hyperintensity,
T1 hypointensity, combined T1/T2 signal change, SCR, height or area of T2 signal hyperintensity,
MSCC and MCC (p=0.81-0.99). The largest improvement in discrimination was seen after height
of T2 signal hyperintensity was added to the original model (AUC: 0.826, 95% C.I.: 0.743-0.908,
1.5%). The addition of Wang’s SCR improved the predictive performance of the original model
by 1.2% to yield an AUC of 0.823 (95% C.I.: 0.739-0.907). Anatomic characteristics, such as
MSCC (-0.3%) and MCC (-1.5%) did not contribute to the discrimination of the original model.

223
Table 9-2 provides details on the AUC, 95% confidence intervals and the percent change in
predictive performance of each modified model. Figures 9-3, 9-4, 9-5 and 9-6 illustrate the
differences in ROC curves between models.
Table 9-2. Predictive Performance of Original Model with the Addition of Various MRI Parameters
MRI Parameter Predictive Performance of Model (AUC)
95% Confidence Intervals of AUC
Change from Original Model AUC=0.811
P-value from Chi-square test
Cord Properties
T1-hypointensity 0.815 0.728-0.902 0.4% 0.95
T2-hyperintensity 0.815 0.729-0.901 0.4% 0.95
Combined T1/T2 signal 0.811 0.720-0.901 0.0% 0.99
Height of T2 signal change 0.826 0.743-0.908 1.5% 0.81
Area of T2 signal change 0.824 0.740-0.907 1.3% 0.84
Wang’s Ratio 0.823 0.739-0.907 1.2% 0.84
Arvin’s Ratio 0.813 0.727-0.899 0.2% 0.98
Nouri’s Ratio 0.819 0.734-0.904 0.8% 0.90
Anatomic Characteristics
MCC 0.796 0.704-0.887 -1.5% 0.81
MSCC 0.808 0.718-0.898 -0.3% 0.96
MCC: maximum canal compromise; MSCC: maximum spinal cord compression
Figure 9-3. ROC Curves of Original Model + T2 Hyperintensity, T1-Hypointensity or Combined
T1/T2 Signal Change

224
Figure 9-4. ROC Curves of Original Model + Height or Area of T2 Signal Change
Figure 9-5. ROC Curves of Original Model + Spinal Canal Compromise or Spinal Cord
Compression
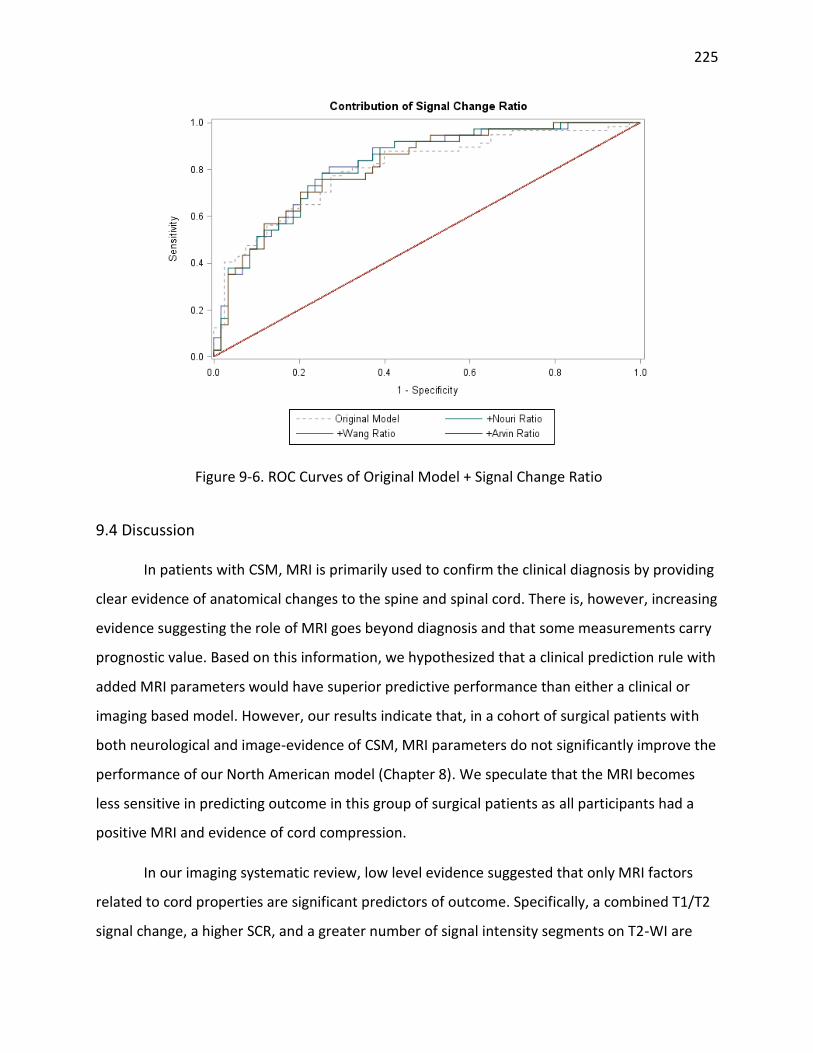
225
Figure 9-6. ROC Curves of Original Model + Signal Change Ratio
9.4 Discussion
In patients with CSM, MRI is primarily used to confirm the clinical diagnosis by providing
clear evidence of anatomical changes to the spine and spinal cord. There is, however, increasing
evidence suggesting the role of MRI goes beyond diagnosis and that some measurements carry
prognostic value. Based on this information, we hypothesized that a clinical prediction rule with
added MRI parameters would have superior predictive performance than either a clinical or
imaging based model. However, our results indicate that, in a cohort of surgical patients with
both neurological and image-evidence of CSM, MRI parameters do not significantly improve the
performance of our North American model (Chapter 8). We speculate that the MRI becomes
less sensitive in predicting outcome in this group of surgical patients as all participants had a
positive MRI and evidence of cord compression.
In our imaging systematic review, low level evidence suggested that only MRI factors
related to cord properties are significant predictors of outcome. Specifically, a combined T1/T2
signal change, a higher SCR, and a greater number of signal intensity segments on T2-WI are

226
negatively associated with surgical outcome across several measurement scales. The rationale
behind these findings is that larger and more intense signal changes reflect severe, irreversible
histological damage, including cystic necrosis, secondary syrinx, myelomalacia and cavitation. In
this study, the two predictors that showed the greatest increase in predictive performance
were Wang’s SCR and height of T2-WI signal change. Although these results confirm the
findings of the systematic review, the marginal improvements in the AUCs were not statistically
significantly.
In a recent publication, Nouri et al (2014) determined that a model combining T1-WI
hypointensity, MCC and baseline mJOA had a very good (AUC=0.845) ability to predict outcome
at 6-months following surgery. Furthermore, according to a likelihood ratio test, this model was
superior to a model with only baseline severity score, concluding MRI has a significant role in
predicting outcome. While our current findings do not support these results, it remains
plausible that a combination of the strongest clinical and imaging predictors may provide
comparable or even superior performance to what has been individually reported by Tetreault
and Nouri. On the other hand, it is also possible that outcome prediction using these sets of
parameters reaches a ceiling with respect to discriminative ability.
A number of factors may prevent perfect or near perfect prediction in this setting. These
include 1) the heterogeneity of the CSM population, especially with respect to disease
presentation and causation; 2) the potential of surgical technique and complications to directly
influence surgical outcome; 3) the unknown reliability of certain factors, including myelopathy
severity, various MRI parameters and duration of symptoms; and 4) the use of a single outcome
measure (mJOA) to determine functional status. For future prediction analysis, some of these
factors can be addressed. We suggest all measurements are assessed for reliability and more
sensitive and specific outcome measures are used in addition to the mJOA, such as the GRASSP
or gait analysis.71, 342
It is also possible that additional predictive performance may be garnered from other
preoperative parameters that were not assessed in this study. In particular, up and coming MRI
techniques, such as DTI,239, 343 micro-vascular blood flow, functional MRI and magnetization

227
transfer will provide better evaluation of the pathobiology of the spinal cord and an increased
sensitivity to detect histological changes. For example, damage to white matter tracts can be
identified by a DTI before a high signal change appears on a T2WI. In terms of prognostic
importance, fractional anisotropy values and fiber tract ratios have shown significant
correlation to surgical outcome341. The evaluation of CSM patients in upright positions and
using dynamic/kinetic MRI techniques may also be interesting to explore344. In addition, Class II
evidence suggests that SSEPs may have a role in predicting surgical outcome in CSM patients.116
Therefore, we recommend that future studies consider inclusion of more sensitive imaging
modalities as well as electrophysiological measurements.
The results of this study are not intended to devalue the role of MRI. Ultimately, it is the
primary imaging modality used to confirm a clinical diagnosis of CSM and to depict the
presence and extent of spinal canal narrowing, compression of the spinal cord and
degenerative changes of bone and soft tissue structures. Therefore, the inability of MRI
parameters to significantly improve the predictive performance of our original model does not
diminish its overall clinical value but suggests that, alternatively, more sensitive techniques are
necessary to uncover additional prognostic value.
9.5 Strengths and Limitations
This study explored both qualitative (presence/absence of signal change) and
quantitative imaging factors (height, area and ratios of signal change). The reviewer who
analyzed each MRI was blinded to the neurological and functional status of each patient,
reducing potential sources of bias. Finally, since our clinical prediction model was externally
validated, we could truly evaluate the predictive value of each added MRI parameter.
There are several limitations that need to be taken into consideration. First, our cohort
was only a subset of patients enrolled in the original CSM-North America study. Second, in the
study by Nouri et al (2014), MRI factors were predictive of outcome at 6-months and may be
less significant at 1-year despite the fact that patients are typically stable between 6-months
and 1-year following surgery. Furthermore, the sample only involved patients who were
clinically diagnosed with CSM and treated surgically. Since all participants had a positive image,

228
the MRI becomes less sensitive in detecting abnormalities and therefore in predicting outcome.
Lastly, the reliability of some MRI measures is unknown; therefore findings of no significance
may be due to unreliability rather than a reflection of actual predictive value.
9.6 Conclusions
In a preselected sample of surgical patients, with both neurological and image-evidence
of CSM, MRI parameters do not significantly add to the predictive performance of our clinical
prediction model. It remains plausible however, that combinations of the strongest clinical and
MRI predictors may yield a prediction model of comparable or superior efficacy. Therefore, our
findings indicate that our clinical prediction rule and the MRI prediction model developed by
Nouri et al (2014) should be employed independently, and their collective results used for
prognostic guidance and surgical consultation.

229
Chapter 10: A Clinical Prediction Rule for Functional Outcomes in
Patients Undergoing Surgery for Cervical Spondylotic Myelopathy:
Analysis of an International AOSpine Prospective Multicentre Dataset of
757 Subjects
10.1 Introduction
This chapter summarizes the methodology and results of part 4 of our 4-part prediction
study.
In part 1, we designed a clinical prediction rule to predict surgical outcomes in patients
with CSM using data on 272 patients enrolled in the prospective, multicenter AOSpine CSM-
North America study. This model was developed to distinguish between patients with mild
myelopathy at 1-year postoperatively (mJOA≥16) and those with substantial residual
neurological impairment (mJOA<16). Based on this model, patients were more likely to achieve
a score ≥16 if they were younger; had a shorter duration of symptoms and milder myelopathy;
did not smoke; and did not have depression/bipolar disorder or impaired gait. In part two, the
external validity of this prediction rule was examined using data from 479 participants of the
AOSpine CSM-International study. This model proved to be externally valid; however, it was
also evident that certain predictors were more relevant in North America than they were
globally. The most significant of these was the presence of psychiatric disorders which was
highly significant in the North American study but was irrelevant in the International study. This
was because there was a low reported incidence of depression and bipolar at sites outside of
North America, reflecting actual incidence, surgical selection bias or cultural reluctance to
report mental illness.
In the first two studies, other limitations were identified. One of the major concerns was
that the model was better suited to predict outcome in moderate (mJOA=12-14) and mild
(mJOA=15-18) myelopathic patients. In severe cases (mJOA<12), patients may exhibit
substantial improvements on the mJOA but are less likely to achieve a final score of 16 at 1-year
postoperatively. These patients would be classified as having a “suboptimal” outcome even if
their gains in functional status were clinically significant. It is the aim of this current study to

230
address certain limitations in our prediction rule and to refine the original model to increase its
global validity.
10.2 Methods
10.2.1 Patient Sample
Our sample consisted of 757 patients enrolled in either the CSM-North America or CSM-
International study from 26 global sites.
10.2.2 Statistical Analysis
Continuous predictors were summarized using means, standard deviations and ranges.
Categorical variables were described using percentages. Univariate log-binomial regression
analyses were conducted to assess the relationship between various clinical factors and our
primary outcome measure and to estimate relative risks. Predictors that yielded a p-value <0.2
in univariate analysis were further examined in multivariate analysis. Variables that were
considered clinically relevant but had a p-value >0.2 were also assessed in multivariate analysis.
Multicollinearity evaluated by calculating tolerance. Modified Poisson regression using
robust error variances was used to create the final multivariate model and compute the relative
risk for each predictor. Variables were included in the final model if they were statistically
significant (p<0.05) and/or deemed clinically important by existing literature. Logistic regression
analysis was run on the final model to obtain a receiver operating characteristic curve (ROC). A
ROC curve plots the true positive rate against the false positive rate. The area under the curve
(AUC) indicates the predictive performance of the model: an area of 1 reflects a test with 100%
specificity and 100% sensitivity, whereas an area of 0.5 indicates no discriminative value.
These methods were repeated for just severe patients (mJOA<12) using a cut-off mJOA
score at 1-year of 12 (mJOA≥12, mJOA<12). A sensitivity analysis was also conducted defining
“severe” myelopathy as <11.

231
10.3 Results
10.3.1 Patient Sample
Four-hundred and seventy-nine patients were enrolled in the CSM-International study
and 278 in the CSM-North America study at 26 global sites (Figure 10-1). Of these 757
participants, 14 had a perfect preoperative mJOA score of 18 and were excluded from this
analysis. Six hundred and fourteen patients attended their 1-year follow-up visit and were
evaluated for improvements in functional status (82.6%).
Figure 10-1. Summary of Participating Subjects and Predictors Evaluated in this Study Predictors bolded in red were significant in the CSM-North America prediction study. Duration of symptoms 1) <3 months, 2) >3, ≤6 months, 3) >6, ≤12 months, 4) >12, ≤24 months, 5) >24 months; comorbidity score: mild disease=1, moderate disease=2, severe disease=3, the total score summates severity across all co-morbidity categories; symptoms, signs and co-morbidities were either present or absent. mJOA16: the number of patients who did/did not achieve a score of 16 on the mJOA at 1-year postoperative. mJOA12: the number of patients who did/did not achieve a score of 12 on the mJOA at 1-year postoperative. Change: 1-year postoperative mJOA – baseline mJOA
Our cohort consisted of 463 (62.31%) men and 280 (37.69%) women, with an average
age of 56.48±11.85 years (range 21-87 years). Patients exhibited a wide range of myelopathy

232
severities from 3 to 17 points on the mJOA scale and a mean score of 12.52±2.74. One hundred
and ninety-three patients presented with mild (mJOA: 15-17) myelopathy, 296 with moderate
(mJOA: 12-14) and 254 with severe (mJOA<12) disease. With respect to degenerative diagnosis,
77.25% of patients displayed evidence of spondylosis, 71.74% of disc herniation and 24.23% of
a hypertrophied ligamentum flavum. A smaller percentage of patients presented with OPLL
(21.13%) and subluxation (5.79%). The mean duration of symptoms was 26.79±39.25 months,
with a range from 0.25 to 432 months. The most common signs on clinical assessment were
hyperreflexia (77.90%), corticospinal distribution motor deficits (62.80%) and a positive
Hoffman’s sign (62.67%) and the most common symptoms were numb hands (89.49%),
weakness (82.88%) and gait impairment (76.55%).
At 1-year follow-up, the mean mJOA score was 15.18±2.67, reflecting significant
improvements in functional status compared to baseline. Three hundred and twenty-four
(52.77%) patients achieved a score of 16 or greater and were mild postoperatively whereas 290
(47.23%) patients still had substantial residual neurological impairment (mJOA<16). The
majority of patients improved to a score greater than or equal to 12 (90.07%); however, 9.93%
still suffered from severe myelopathy postoperatively. Table 10-1 displays the demographic
information and 1-year outcomes for the entire cohort and for the severe patients (mJOA<12).
10.3.2 Predicting a mJOA score ≥16
10.3.2.1 Univariate Analysis:
Based on univariate analysis, the significant predictors of a mJOA≥16 were a higher
baseline mJOA score (RR: 1.15, 95%C.I.: 1.12-1.18); younger age (RR: 0.84, 95%C.I.: 0.80-0.88);
non-smoking status (RR: 0.82, 95%C.I.: 0.68-0.99); absence of cardiovascular co-morbidities (RR:
0.71, 95%C.I.: 0.60-0.84); a lower co-morbidity score (RR: 0.89, 95%C.I.: 0.83-0.94); absence of
clumsy hands (RR: 0.77, 95%C.I.: 0.66-0.89), impaired gait (RR: 0.57, 95%C.I.: 0.50-0.65),
bilateral arm paresthesia (RR: 0.82, 95%C.I.: 0.71-0.95) and general weakness (RR: 0.70,
95%C.I.: 0.60-0.81); and absence of corticospinal motor deficits (RR: 0.71, 95%C.I: 0.61-0.82),
hyperreflexia (RR: 0.83, 95%C.I.: 0.70-0.97), upgoing plantar responses (RR: 0.75, 95%C.I.: 0.63-
0.89), lower limb spasticity (RR: 0.72, 95%C.I.: 0.61-0.84) and broad-based unstable gait (RR:

233
0.57, 95%C.I.: 0.49-0.66). The associations between this outcome and duration of symptoms,
gastrointestinal and endocrine co-morbidities, l’Hermitte’s phenomena and atrophy of intrinsic
hand muscles yielded p-values <0.20 and were evaluated in multivariate analysis. No other
variables with p-values >0.20 were deemed clinically significant and were not examined further.
(Table 10-2).
Table 10-1. Patient Baseline Demographic Information and 1-year Functional Outcomes following surgery for CSM
Variable Total Sample Severe Patients (mJOA<12)
Baseline severity score (mJOA) 12.52±2.74 (3-17) 9.42±1.67 (3-11)
Age (years) 56.48±11.85 (21-87) 60.09±12.06 (28-86)
Gender (male) 463 (62.31%) 153 (60.24%)
Duration of symptoms (months) 26.79±39.25 (0.25-432) 24.43±33.30 (0.25-240)
Smoker 199 (26.78%) 71 (27.95%)
Co-morbidities Co-morbidity Score Cardiovascular Respiratory Gastrointestinal Renal Endocrine Psychiatric Rheumatologic Neurological
459 (61.78%) 1.45±1.82 (0-13) 334 (44.95%) 80 (10.77%) 120 (16.15%) 22 (2.96%) 135 (18.17%) 103 (13.86%) 38 (5.11%) 47 (6.33%)
172 (67.72%) 1.77±1.99 (0-13) 141 (55.51%) 29 (11.42%) 35 (13.78%) 11 (4.33%) 55 (21.65%) 30 (11.81%) 18 (7.09%) 21 (8.27%)
Diagnosis Spondylosis Disc herniation OPLL HLF Subluxation
574 (77.25%) 533 (71.74%) 157 (21.13%) 180 (24.23%) 43 (5.79%)
204 (80.31%) 178 (70.08%) 57 (22.44%) 73 (28.74%) 17 (6.69%)
Symptoms (n=742) Numb hands Clumsy hands Impaired gait Bilateral arm paresthesia L’Hermitte’s phenomena General weakness
664 (89.49%) 556 (74.93%) 568 (76.55%) 422 (56.87%) 198 (26.68%) 615 (82.88%)
240 (94.86%) 225 (88.93%) 244 (96.44%) 169 (66.80%) 74 (39.25%) 235 (92.89%)
Signs (n=742) Corticospinal motor deficits Atrophy of intrinsic hand muscles Hyperreflexia Positive Hoffman’s sign Upgoing plantar responses Lower limb spasticity Broad-based unstable gait
406 (62.80%) 268 (36.12%) 578 (77.90%) 465 (62.67%) 266 (35.85%) 353 (47.57%) 442 (59.57%)
196 (77.47%) 120 (47.43%) 207 (81.82%) 168 (66.40%) 124 (49.01%) 161 (63.64%) 209 (82.61%)
mJOA score at 1-year 15.18±2.66 (5-18) 13.73±2.90 (5-18)

234
mJOA≥16 (n, (%)) mJOA<16
324 (52.77%) 290 (47.23%)
64 (31.84%) 137 (68.16%)
mJOA≥12 (n, (%)) mJOA<12
553 (90.07%) 61 (9.93%)
154 (76.62%) 47 (23.38%)
Continuous variables are described using means ± standard deviations and ranges. Baseline categorical variables are summarized as frequencies and percentages. Follow-up scores are given as frequencies and percentages. mJOA: modified Japanese Orthopaedic Association; OPLL: ossification of the posterior longitudinal ligament; HLF: hypertrophy of the ligamentum flavum.
Table 10-2. Univariate Analyses Evaluating the Association between Various Clinical Predictors and a mJOA Score ≥16 at 1-year following Surgery
Predictor
Relative Risk
95% C.I.
p-value
Baseline severity score (mJOA) 1.15 1.12, 1.18 <0.0001
Age (by decade)* 0.84 0.80, 0.88 <0.0001
Gender (REF=Female) 0.91 0.78, 1.06 0.21
Duration of symptoms† 0.96 0.91, 1.01 0.14
Smoking status (REF=No) 0.82 0.68, 0.99 0.038
Co-morbidity Score Co-morbidities (REF=absence) Cardiovascular Respiratory Gastrointestinal Renal Endocrine Psychiatric Rheumatologic Neurological
0.89 0.79 0.71 0.80 1.15 1.01 0.82 0.93 0.91 0.84
0.83, 0.94 0.68, 0.92 0.60, 0.84 0.60, 1.07 0.95, 1.38 0.62, 1.63 0.66, 1.03 0.74, 1.16 0.64, 1.31 0.59, 1.20
<0.0001 0.0017 <0.0001 0.13 0.14 0.96 0.091 0.51 0.63 0.34
Symptoms (REF=absence) Numb hands Clumsy hands Impaired gait Bilateral arm paresthesia L’Hermitte’s phenomena General weakness
0.91 0.77 0.57 0.82 0.87 0.70
0.73, 1.13 0.66, 0.89 0.50, 0.65 0.71, 0.95 0.72, 1.04 0.60, 0.81
0.39 0.0007 <0.0001 0.0094 0.14 <0.0001
Signs (REF=absence) Corticospinal motor deficits Atrophy of intrinsic hand muscles Hyperreflexia Positive Hoffman’s sign Upgoing plantar responses Lower limb spasticity Broad-based unstable gait
0.71 0.90 0.83 0.92 0.75 0.72 0.57
0.61, 0.82 0.76, 1.05 0.70, 0.97 0.79, 1.07 0.63, 0.89 0.61, 0.84 0.49, 0.66
<0.0001 0.18 0.020 0.30 0.0011 <0.0001 <0.0001
Co-morbidity score is comprised of both number and severity of co-morbidities. A 1-point increase reflects either
an increase in disease severity or number of co-morbidities. Relative risk for each variable was calculated using log-
binomial regression. *Relative risk for age is by decade. †Relative risk for duration of symptoms is by group (1) <3
months, 2) >3, ≤6 months, 3) >6, ≤12 months, 4) >12, ≤24 months, 5) >24 months). C.I.: confidence interval; mJOA:
modified Japanese Orthopedic Association

235
10.3.2.2 Multivariate Analysis
The final model consisted of six statistically significant and clinically relevant predictors:
baseline severity score (RR: 1.11, 95%C.I.: 1.07-1.15), impaired gait (RR: 0.76, 95%C.I.: 0.66-
0.88), age (RR: 0.91, 95%C.I.: 0.85-0.96), co-morbidity score (RR: 0.93, 95%C.I.: 0.88-0.98),
smoking status (RR: 0.78, 95%C.I.: 0.65-0.93) and duration of symptoms (RR: 0.95, 95%C.I.:
0.90-0.99). (Table 10-3).
Based on relative risks, the probability of achieving a score ≥16 on the mJOA i) decreases
by 5% when a patient has an increased duration of symptoms (i.e moves from the ≤3 month to
the 3-6 month group); ii) is 1.11 times greater for each point increase in baseline mJOA score;
iii) decreases by 9% for every decade increase in age; iv) decreases by 7% for each one point
increase in co-morbidity score (either an increase in disease severity or number of co-
morbidities); v) decreases by 24% when a patient presents with gait impairment (versus no
impairment); and vi) decreases by 22% when a patient smokes. The AUC for this model was
0.77 (95%C.I.: 0.73, 0.80), reflecting good discriminative ability.
Table 10-3. Final Clinical Prediction Model to Determine Functional Status (mJOA≥16) at 1-year
following Surgery
Predictor Relative Risk 95% C.I. p-value
Baseline severity score (mJOA) 1.11 1.07, 1.15 <0.0001
Impaired gait (REF=absence) 0.76 0.66, 0.88 0.0002
Age 0.91 0.85, 0.96 0.0015
Co-morbidity score 0.93 0.88, 0.98 0.0067
Smoking status (REF=non-smoker) 0.78 0.65, 0.93 0.0056
Duration of symptoms 0.95 0.90, 0.99 0.029
This model serves to distinguish between patients with mild myelopathy postoperatively (mJOA≥16) and those with substantial residual neurological impairment (mJOA<16). Relative risk for each covariate was computed using Poisson regression. Baseline severity score: 0-18 points; age is per decade; co-morbidity score is comprised of both number and severity of co-morbidities; duration of symptoms 1) <3 months, 2) >3, ≤6 months, 3) >6, ≤12 months, 4) >12, ≤24 months, 5) >24 months. C.I.: confidence intervals; mJOA: modified Japanese Orthopedic Association.
10.3.3 Predicting a mJOA score ≥12
10.3.3.1 Univariate Analysis
Baseline severity score (RR: 1.07, 95%C.I.: 1.02-1.13), hyperreflexia (RR: 0.83, 95%C.I.:
0.72-0.96), lower limb spasticity (RR: 0.75, 95%C.I.: 0.65-0.86), and age (RR: 0.97, 95%C.I.: 0.95-

236
0.99) were significant predictors of a mJOA≥12 following univariate analysis. The relationships
between a score ≥12 and duration of symptoms, co-morbidity score, cardiovascular and
respiratory co-morbidities, numb hands, bilateral arm paresthesia, L’Hermitte’s phenomena,
positive Hoffman’s sign and broad-based unstable gait also yielded p-values <0.20 and were
further evaluated. No other variables with p-values >0.20 were deemed clinically significant and
were not examined in multivariate analysis. (Table 10-4).
Table 10-4. Univariate Analyses Evaluating the Association between Various Clinical Predictors
and a mJOA score ≥12 at 1-year following Surgery in Patients with Severe CSM (mJOA<12).
Predictor Relative Risk 95% C.I. p-value
Baseline Severity Score 1.07 1.02, 1.13 0.010
Age* 0.97 0.95, 0.99 0.0014
Gender (REF=Female) 0.98 0.84, 1.14 0.81
Duration of symptoms† 0.96 0.92, 1.01 0.087
Smoking status (REF=non-smoker) 1.00 0.85, 1.19 0.97
Co-morbidities (REF=absence) Co-morbidity Score Cardiovascular Respiratory Gastrointestinal Renal Endocrine Psychiatric Rheumatologic Neurological
0.97 0.96 0.89 0.79 0.95 1.15 1.05 0.94 0.93 0.98
0.83, 1.14 0.92, 1.01 0.76, 1.03 0.56, 1.12 0.74, 1.21 0.87, 1.51 0.88, 1.25 0.72, 1.23 0.66, 1.30 0.73, 1.31
0.72 0.10 0.12 0.18 0.67 0.32 0.59 0.67 0.66 0.88
Symptoms (REF=absence) Numb hands Clumsy hands Impaired gait Bilateral arm paresthesia L’Hermitte’s phenomena Weakness
0.83 0.93 0.87 0.90 0.84 0.92
0.68, 1.02 0.75, 1.15 0.66, 1.14 0.77, 1.04 0.70, 1.02 0.73, 1.17
0.080 0.50 0.32 0.15 0.087 0.51
Signs (REF=absence) Corticospinal motor deficits Atrophy of intrinsic hand muscles Hyperreflexia Positive Hoffman’s sign Upgoing plantar responses Lower limb spasticity Broad-based unstable gait
0.93 1.03 0.83 0.88 0.94 0.75 0.89
0.79, 1.10 0.89, 1.20 0.72, 0.96 0.76, 1.03 0.80, 1.09 0.65, 0.86 0.75, 1.06
0.40 0.68 0.010 0.10 0.40 <0.0001 0.19
Co-morbidity score is comprised of both number and severity of co-morbidities. A 1-point increase reflects either an increase in disease severity or number of co-morbidities. Relative risk for each variable was calculated using log-binomial regression. *Relative risk for age is by decade. †Relative risk for duration of symptoms is by group (1) <3 months, 2) >3, ≤6 months, 3) >6, ≤12 months, 4) >12, ≤24 months, 5) >24 months). C.I.: confidence interval; mJOA: modified Japanese Orthopedic Association
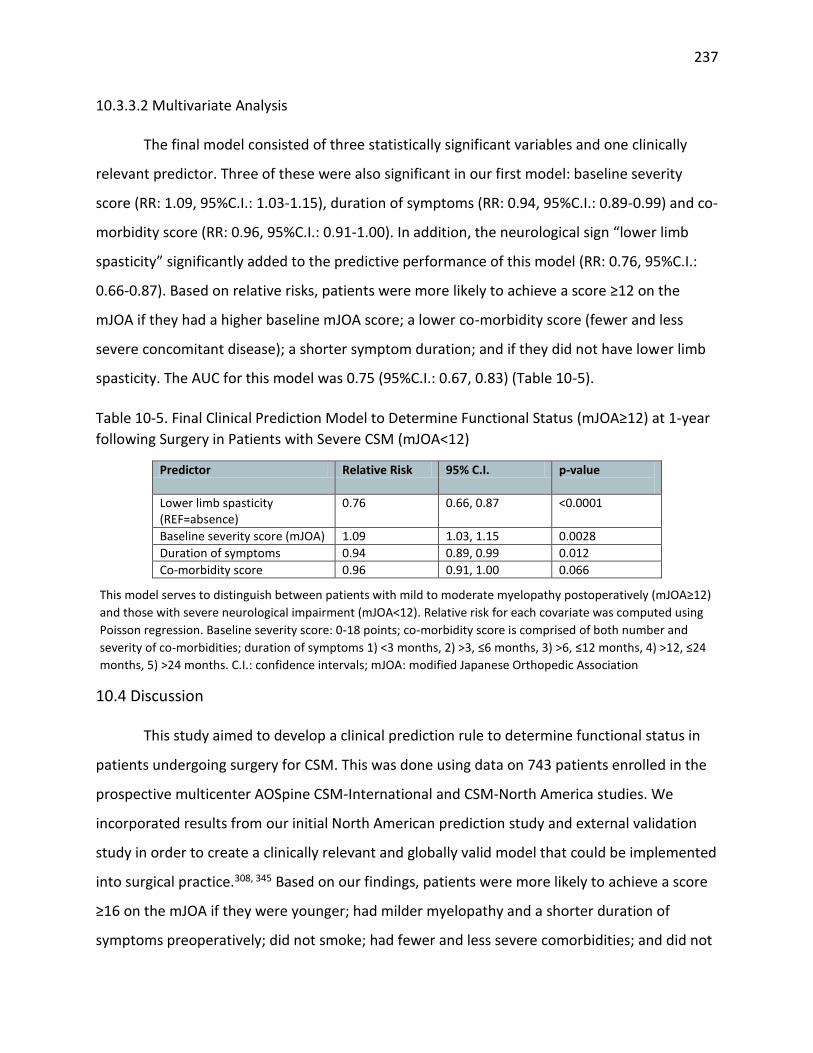
237
10.3.3.2 Multivariate Analysis
The final model consisted of three statistically significant variables and one clinically
relevant predictor. Three of these were also significant in our first model: baseline severity
score (RR: 1.09, 95%C.I.: 1.03-1.15), duration of symptoms (RR: 0.94, 95%C.I.: 0.89-0.99) and co-
morbidity score (RR: 0.96, 95%C.I.: 0.91-1.00). In addition, the neurological sign “lower limb
spasticity” significantly added to the predictive performance of this model (RR: 0.76, 95%C.I.:
0.66-0.87). Based on relative risks, patients were more likely to achieve a score ≥12 on the
mJOA if they had a higher baseline mJOA score; a lower co-morbidity score (fewer and less
severe concomitant disease); a shorter symptom duration; and if they did not have lower limb
spasticity. The AUC for this model was 0.75 (95%C.I.: 0.67, 0.83) (Table 10-5).
Table 10-5. Final Clinical Prediction Model to Determine Functional Status (mJOA≥12) at 1-year
following Surgery in Patients with Severe CSM (mJOA<12)
Predictor Relative Risk 95% C.I. p-value
Lower limb spasticity (REF=absence)
0.76 0.66, 0.87 <0.0001
Baseline severity score (mJOA) 1.09 1.03, 1.15 0.0028
Duration of symptoms 0.94 0.89, 0.99 0.012
Co-morbidity score 0.96 0.91, 1.00 0.066
This model serves to distinguish between patients with mild to moderate myelopathy postoperatively (mJOA≥12)
and those with severe neurological impairment (mJOA<12). Relative risk for each covariate was computed using
Poisson regression. Baseline severity score: 0-18 points; co-morbidity score is comprised of both number and
severity of co-morbidities; duration of symptoms 1) <3 months, 2) >3, ≤6 months, 3) >6, ≤12 months, 4) >12, ≤24
months, 5) >24 months. C.I.: confidence intervals; mJOA: modified Japanese Orthopedic Association
10.4 Discussion
This study aimed to develop a clinical prediction rule to determine functional status in
patients undergoing surgery for CSM. This was done using data on 743 patients enrolled in the
prospective multicenter AOSpine CSM-International and CSM-North America studies. We
incorporated results from our initial North American prediction study and external validation
study in order to create a clinically relevant and globally valid model that could be implemented
into surgical practice.308, 345 Based on our findings, patients were more likely to achieve a score
≥16 on the mJOA if they were younger; had milder myelopathy and a shorter duration of
symptoms preoperatively; did not smoke; had fewer and less severe comorbidities; and did not

238
present with impaired gait. This model was similar to the one constructed in the North
American population except that the predictor “psychiatric disorders” was replaced with a co-
morbidity score that summarizes overall preoperative health status. Depression and bipolar
disease had a greater predictive value in the North American population because the reported
incidence was significantly higher among these patients than in our international sample. These
differences may indicate regional variations in actual incidence but likely reflect either surgical
selection bias or cultural reluctance to admit to mental illness. Regardless, this low incidence in
populations outside of North America decreases the global validity of this predictor. Instead, we
developed a co-morbidity score to summarize a patient’s overall preoperative general health
status. This score comprises both number of co-morbidities as well as severity of disease. This
predictor was statistically significant in our model and contributed to its overall predictive
performance.
Along with co-morbidity score, the prediction model consisted of age, symptom
duration, preoperative myelopathy severity, smoking status and impaired gait. Elderly patients
may have a reduced ability to translate neurologic recovery into functional improvements.
Potential explanations are 1) the elderly experience modifications to their spinal cord, including
a decrease in γ-motorneurons, number of anterior horn cells and number of myelinated fibers
in the corticospinal tracts and posterior funiculus; 2) as CSM is a progressive disease, older
patients are likely to have more substantial degenerative pathology and may require a more
complex surgery; 3) older patients tend to have reduced physiological reserves and
unassociated co-morbidities that may affect outcome.124, 170, 216, 217 We do not, however,
recommend that surgeons discriminate on the basis of chronological age but instead consider a
patient’s physiological age and co-existing co-morbidities. In general, however, age is
associated with reduced postoperative recovery and so the expectations of elderly patients
should be managed accordingly.
A longer duration of symptoms is significantly associated with a poor surgical outcome.
Chronic compression of the spinal cord for a prolonged duration can result in irreversible
histological changes including cystic necrosis, cavitation and syrinx formation.215 215 Surgical
decompression may not be able to reverse all of these changes and, as a result, patients will not

239
achieve optimal recovery. It is therefore essential that primary care physicians are able to
recognize key signs and symptoms of CSM, differentiate between this disease and other
mimicking diagnoses (ex. bilateral carpal tunnel syndrome, multiple sclerosis, and amyotrophic
lateral sclerosis), identify patients at high risk of disease progressive and refer patients early for
surgical consultation. This is especially critical given recent reports surrounding the natural
history of the disease. According to a recent systematic review, between 20 to 60% of patients
with symptomatic CSM will deteriorate over time without surgical intervention.19 As patients
progress, they will exhibit an increase in functional impairment, a decrease in social
independence and more deleterious signs and symptoms such as impaired gait and lower limb
spasticity.346 According to our model, both a severer mJOA score and gait dysfunction are
significant predictors of a worse surgical outcome. This finding confirms the need to detect
these patients at earlier disease stages. Furthermore, surgeons may choose to operate on
milder cases rather than waiting for these patients to progress to a severity where they will no
longer achieve optimal results.
This model is not intended to identify patients who will benefit more from surgery than
from non-operative management. Rather, it serves to predict outcomes in patients with
progressive, symptomatic myelopathy who have failed previous conservative management. A
randomized control trial is required to evaluate the relative efficacy of conservative versus
surgical treatment; however, it would be unethical to deny surgery to patients with
symptomatic progressive myelopathy.
Smokers were also less likely to achieve a score ≥16 on the mJOA at 1-year follow-up.
Although previous studies have suggested that smoking results in higher rates of non-fusion
and wound infections, there were no significant differences between smokers and non-smokers
with respect to these complications in our cohort.302 Instead, we speculate that smoking is a
surrogate for unhealthy lifestyle, presence of co-morbidities, lower socioeconomic status and
poorer dietary choices. All of these variables could impact a patient’s clinical outcomes and
recovery, compliance with postoperative management programs and access to post-surgical
care. Further research is required to confirm these hypotheses; however, until this is done,
smokers should be encouraged to stop their habit prior to surgery.

240
This prediction model can effectively discriminate between patients who will achieve an
“optimal” outcome at 1-year postoperatively and those who will not. Predicting a mJOA score
of ≥16 is clinically relevant and especially useful to manage expectations. Although patients
often ask about their chances of improvement, they also want to know whether surgery will
result in greater social independence, an ability to perform day to day activities and the
resolution of their more deleterious signs and symptoms. A score of ≥16 translates to minimal
impairment and functional independence and thus predicting this score is meaningful to
patients. This information should be used by surgeons during the surgical consent discussion to
manage expectations and to counsel concerned patients and their families as to potential
treatment options. Based on two recent studies, preoperative expectations, and whether or not
they are met through treatment, is a significant predictor of overall satisfaction.347 It is
therefore imperative that clinicians use our quantitative prediction tool to more objectively
convey prognostic information and give the patient a better understanding of how he/she
should expect to fare following intervention.
This current study also addresses another limitation from the CSM-North America study.
Patients with severe myelopathy (mJOA<12) have a significantly lower probability of achieving a
score ≥16 on the mJOA. It is unjust to classify a patient who improves from a score of 8 to a
score of 14 as having a “suboptimal” outcome. We developed a second prediction model for
these patients to evaluate their probability of improving to a score ≥12 on the mJOA. Based on
our findings, the most significant predictors of this outcome were baseline severity score,
duration of symptoms, co-morbidity score and lower limb spasticity. Interestingly, even in
patients with severe disease, the earlier surgeons intervene, the better patients are likely to do.
Overall health status is also critical to a patients’ surgical success; specifically, severe
myelopathic patients in good cardiovascular health are expected to fare better than those with
concomitant cardiovascular disease.
10.5 Conclusions
Based on this study results, patients were more likely to achieve a score ≥16 on the
mJOA if they were younger; had milder myelopathy and a shorter duration of symptoms

241
preoperatively; did not smoke; had fewer and less severe co-morbidities; and did not present
with gait dysfunction. This information can be used by clinicians to manage patients’
expectations and counsel concerned patients as to potential treatment options. Furthermore,
the results from this study emphasize the importance of accurately detecting CSM at a mild
disease state and referring these patients for early surgical consultation.

242
Chapter 11: Clinical and Surgical Predictors of Complications following
Surgery for the Treatment of Cervical Spondylotic Myelopathy: Results
from the Prospective AOSpine International study of 479 Patients
11.1 Introduction
This chapter summarizes the methodology and results from a study designed to
evaluate significant clinical and surgical predictors of perioperative complications.
Surgery, although proven highly effective, is not risk free and is associated with
complications in 11 to 38% of patients. The majority of these are transient, non-neurological
and do not require invasive intervention or prolonged hospital stay. Regardless, surgical
complications still taint a patient’s overall perception of surgery and may often involve
postoperative management, additional follow-up visits and increased associated costs.
Therefore, surgeons should better anticipate these complications, institute preventative
strategies, and closely monitor their patients in the perioperative period.
Predicting intraoperative and postoperative complications is an increasingly important
area of research. In our systematic review of the literature, older age and a longer operative
duration were predictive of overall perioperative complications and a two-stage
anteroposterior procedure was a significant predictor of major complications. Furthermore, low
evidence suggested an association between a diagnosis of OPLL and the occurrence of C5 root
palsy. Other clinical, imaging and surgical factors were not identified as significant predictors.
Further investigation is required to support these conclusions and to develop a complications
prediction model that could objectively identify “high-risk” patients. This knowledge can help
surgeons develop case-specific pre- and post-operative management strategies and inform
patients of their relative risks and benefits during the consent discussion. Furthermore, this
information will enable health care providers to better anticipate hospital utilization costs,
allocate sufficient resources and implement optimal rehabilitation plans.

243
This study has two aims: 1) to characterize and quantify perioperative complications in
patient undergoing surgery for the treatment of CSM and 2) to identify important clinical and
surgical predictors of complications and to develop a prediction rule.
11.2 Methods
11.2.1 Patient Sample
Our sample consisted of 479 patients enrolled in the CSM-International study from 16
global sites.
11.2.2 Statistical Analysis
The objective of this analysis was to determine significant clinical and surgical predictors
of perioperative complications. Perioperative complications were defined as surgery-related
events occurring with 30 days of surgery.
Descriptive statistics were computed for all clinical and surgical variables. Continuous
predictors were described using means, standard deviations and ranges. Categorical variables
were summarized using percentages. The incidence of perioperative complications was
quantified and the frequency of each type of complication was calculated.
Simple logistic regression analyses were conducted to evaluate the association between
various clinical and surgical factors and perioperative complications. Predictors that yielded a p-
value of <0.20 in univariate analyses were included in multivariate analysis. Based on our
systematic review and a survey of spine care professionals, variables that had a p-value of >0.20
but were considered clinically important were also evaluated in multivariate analysis.
Collinearity of all variables was assessed by calculating tolerance. Manual backward
stepwise logistic regression was used to determine the best combination of surgical and clinical
predictors. Variables were included in the final model if they a) contributed significantly to the
predictive performance of the model, as evaluated by the area under the receiver operating
curve; b) were statistically significant; and/or c) were clinically relevant based on existing
literature or results from an international survey of spine care professionals. Methods like these
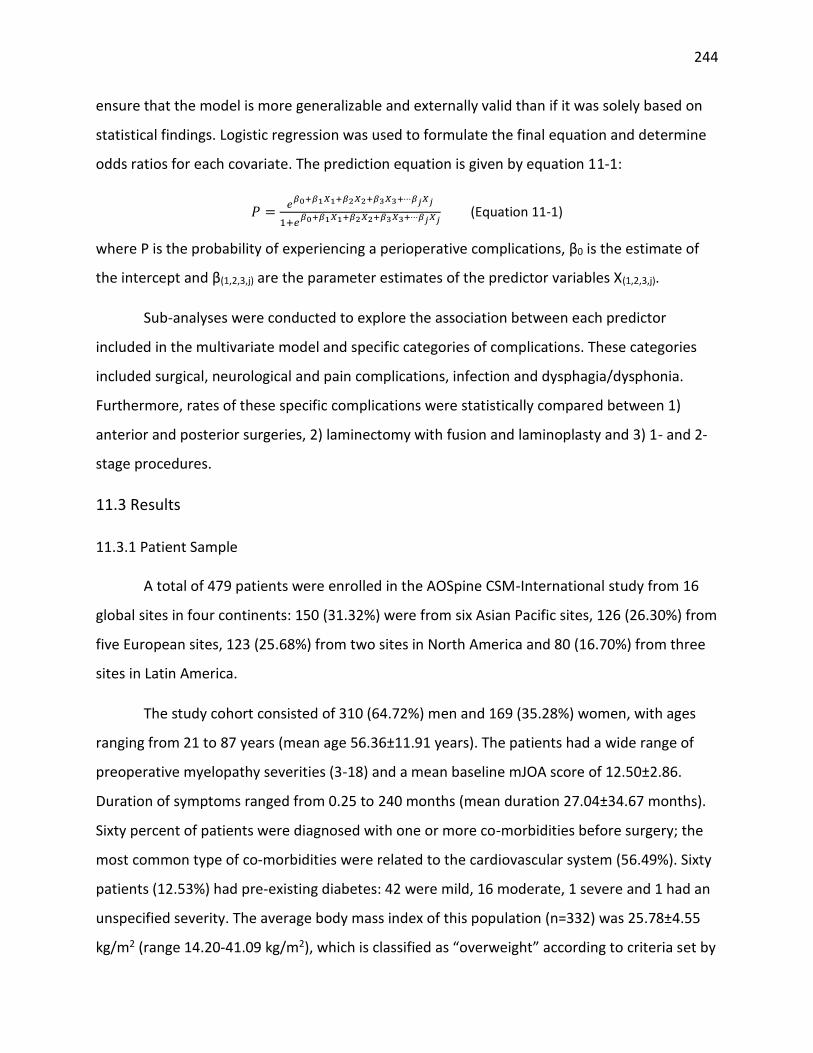
244
ensure that the model is more generalizable and externally valid than if it was solely based on
statistical findings. Logistic regression was used to formulate the final equation and determine
odds ratios for each covariate. The prediction equation is given by equation 11-1:
𝑃 =𝑒
𝛽0+𝛽1𝑋1+𝛽2𝑋2+𝛽3𝑋3+⋯𝛽𝑗𝑋𝑗
1+𝑒𝛽0+𝛽1𝑋1+𝛽2𝑋2+𝛽3𝑋3+⋯𝛽𝑗𝑋𝑗
(Equation 11-1)
where P is the probability of experiencing a perioperative complications, β0 is the estimate of
the intercept and β(1,2,3,j) are the parameter estimates of the predictor variables X(1,2,3,j).
Sub-analyses were conducted to explore the association between each predictor
included in the multivariate model and specific categories of complications. These categories
included surgical, neurological and pain complications, infection and dysphagia/dysphonia.
Furthermore, rates of these specific complications were statistically compared between 1)
anterior and posterior surgeries, 2) laminectomy with fusion and laminoplasty and 3) 1- and 2-
stage procedures.
11.3 Results
11.3.1 Patient Sample
A total of 479 patients were enrolled in the AOSpine CSM-International study from 16
global sites in four continents: 150 (31.32%) were from six Asian Pacific sites, 126 (26.30%) from
five European sites, 123 (25.68%) from two sites in North America and 80 (16.70%) from three
sites in Latin America.
The study cohort consisted of 310 (64.72%) men and 169 (35.28%) women, with ages
ranging from 21 to 87 years (mean age 56.36±11.91 years). The patients had a wide range of
preoperative myelopathy severities (3-18) and a mean baseline mJOA score of 12.50±2.86.
Duration of symptoms ranged from 0.25 to 240 months (mean duration 27.04±34.67 months).
Sixty percent of patients were diagnosed with one or more co-morbidities before surgery; the
most common type of co-morbidities were related to the cardiovascular system (56.49%). Sixty
patients (12.53%) had pre-existing diabetes: 42 were mild, 16 moderate, 1 severe and 1 had an
unspecified severity. The average body mass index of this population (n=332) was 25.78±4.55
kg/m2 (range 14.20-41.09 kg/m2), which is classified as “overweight” according to criteria set by

245
the World Health Organization. The most common diagnosis was spondylosis (75.99%) but a
large number of patients also had disc herniation (72.65%), OPLL (28.18%) and hypertrophy of
the ligamentum flavum (25.47%) (Table 11-1).
With respect to surgical technique, 57.74% of patients were treated anteriorly and
39.96% posteriorly. A minority (2.30%) underwent a two-stage anteroposterior surgery. The
mean number of levels decompressed was 3.66±1.28 (range: 1-7) and the mean operative
duration was 178.07±80.20 minutes (range: 45.00-495.00 minutes).
Table 11-1. General Characteristics, Signs and Symptoms, Co-Morbidities, Diagnosis and Surgical Summary of CSM patients enrolled in the CSM-International Study
Variable Descriptive Statistics
Baseline severity score (mJOA) 12.50±2.86 (3-18)
Age (years) 56.36±11.91 (21-87)
Gender (%) 64.72 M, 35.28 F
Duration of symptoms (n=477) (months) 27.04±34.67 (0.25-240)
Smoking (%) 27.35 Y, 72.65 N
Body Mass Index (n=332) (kg/m2) 25.78±4.55 (14.20-41.09)
Co-morbidities (n=477-479) (%) Cardiovascular (%) Respiratory (%) Gastrointestinal (%) Diabetes (%) Psychiatric (%) Rheumatologic (%) Co-morbidity score Number of co-morbidities
59.83 43.51 8.81 15.09 12.53 7.97 2.94 1.38±1.74 (0-13) 1.19±1.30 (0-6)
Diagnosis (%) Spondylosis Disc Herniation OPLL HLF Subluxation
75.99 72.65 28.18 25.47 6.26
Surgical Approach (%) Anterior (one-stage) Posterior (one-stage) Circumferential (two-stages)
57.74 39.96 2.30
Operative duration (mins) 178.07±80.20 (45-495)
Number of decompressed levels 3.66±1.28 (1-7)
Means are given with standard deviations. Categorical variables are described using frequencies. mJOA: modified Japanese Orthopaedic Association; OPLL: ossification of the posterior longitudinal ligament; HLF: hypertrophy of the ligamentum flavum

246
11.3.2 Complications
Seventy-eight patients experienced 89 complications, yielding an overall incidence of
16.25%. Sixty-eight patients had a single complication, nine had two and one experienced
three. Thirty-four (38.20%) of these complications occurred on the day of surgery. The most
common complications were dysphagia (4.38%), dural tear (2.92%) and superficial infection
(2.09%). Very few patients suffered from hardware failure (0.21%), graft dislodgement (0.21%)
or graft pain (0.21%) within the perioperative period. With respect to neurological
complication, 4 (0.84%) patients had C5 radiculopathy, 3 (0.63%) suffered perioperative
worsening of myelopathy, 3 (0.63%) exhibited symptoms of new radiculopathy and 1 (0.21%)
experienced progression of myelopathy (0.21%). Figure 11-1 provides an overview of the types
of complications experienced by patients enrolled in the CSM-International study. The majority
of these were defined as minor and did not result in permanent morbidity, prolongation of
hospital stay or invasive intervention. Furthermore, these complications did not affect
functional or neurological status at 1-year: patients who experienced a complication improved
on average by 2.13±2.60 on the mJOA, whereas patients without a perioperative complication
improved by 2.48±2.74 (p=0.33).
11.3.3 Univariate Analysis
11.3.3.1 Clinical Factors
Patients with complications were on average older (57.91±10.90 years) and had a higher
BMI (26.71±4.57 kg/m2) compared to patients without complications (56.06±12.09 years,
25.60±4.54 kg/m2), although these relationships did not reach statistical significance (age, OR:
1.01, p=0.21; BMI, OR: 1.05, p=0.10). Patients with more severe myelopathy (OR: 0.94, p=0.14)
or a longer duration of symptoms (OR: 1.14, p=0.14) were not at a higher risk of experiencing a
complication perioperatively. Univariately, the major clinical risk factors for perioperative
complications were a diagnosis of OPLL (OR: 1.65, p=0.055), a greater number of co-morbidities
preoperatively (OR: 1.32, p=0.0018), a higher co-morbidity score (OR: 1.19, p=0.0060), diabetes
(OR: 2.83, p=0.0008) and co-exiting cardiovascular (OR: 1.64, p=0.046) and gastrointestinal
disorders (OR: 1.92, p=0.034). Of the cardiovascular diseases, hypertension was associated with

247
the greatest risk of complications (OR: 1.74, p=0.026). Smoking status and gender were not
predictive of complications (Table 11-2).
Figure 11-1. An Overview of the Types of Complications experienced by CSM Patients in the Perioperative Period. Red: surgical complications; blue: neurological complications; green: pain-related; purple: infection; orange:
dysphagia and dysphonia; black: other complications. DVT: deep venous thrombosis.
Table 11-2. Univariate Analysis assessing the Relationship between Various Clinical Factors and Perioperative Complications
Clinical Predictor
Odds Ratio
95% C.I.
p-value
Gender (REF=male) 1.18 0.71, 1.94 0.52
Age 1.01 0.99, 1.03 0.21
Duration of symptoms 1.14 0.96, 1.36 0.14*
Smoking (REF=non-smoker) 1.22 0.72, 2.07 0.46
Body Mass Index (n=332) 1.05 0.99, 1.12 0.10*
Baseline severity score (mJOA) 0.94 0.86, 1.02 0.14*
OPLL (REF=other forms of DCM) 1.65 0.99, 2.74 0.055
Co-morbidities (REF=absence) 2.03 1.18, 3.47 0.01
Number of co-morbidities 1.32 1.11, 1.56 0.0018
Co-morbidity score 1.19 1.05, 1.34 0.0060
Cardiovascular (REF=absence) 1.64 1.01, 2.68 0.046
Respiratory (REF=absence) 1.69 0.79, 3.59 0.18*
Gastrointestinal (REF=absence) 1.92 1.05, 3.49 0.034
Diabetes (REF=absence) 2.83 1.54, 5.20 0.0008
Psychiatric (REF=absence) 0.17 0.50, 2.76 0.72
Rheumatologic (REF=absence) 0.85 0.19, 3.87 0.83
CI: confidence interval; mJOA: modified Japanese Orthopedic Association; DCM: degenerative cervical myelopathy
0 5 10 15 20 25
Other
Cardiopulmonary event
DVT
Dysphonia
Dysphagia
Deep infection
Superficial infection
Graft site pain
New neck pain
Perioperative worsening of myelopathy
New radiculopathy
Progression of myelopathy
C5 radiculopathy
Graft dislodgement
Dural tear
Screw malposition
Hardware failure
Pseudoarthrosis
Number of Patients

248
11.3.3.2 Surgical Factors
There was no significant difference in complication rates between patients treated
anteriorly (8.99%) and those treated posteriorly (6.42%) (p=0.88). Patients undergoing a two-
stage circumferential surgery, however, were at a greater risk of perioperative complications
than patients treated with either a single-stage anterior or posterior surgery (OR: 6.58,
p=0.0023). Patients with complications had a greater number of decompressed levels
(3.90±1.33) than those without complications (3.62±1.26), although this relationship did not
reach statistical significance (p=0.075). Finally, a longer operative duration was a significant
predictor of perioperative complications (OR: 1.005, p=0.0002) (Table 11-3).
Table 11-3. Univariate Analysis assessing the Relationship between Various Surgical Factors and Perioperative Complications
Surgical Predictor Odds Ratio 95% C.I. p-value
Anterior vs. Posterior (REF=anterior) 1.04 0.62, 1.73 0.88
1-stage vs. 2-stage (REF=1-stage) 6.58 1.96, 22.14 0.0023
Operative duration 1.005 1.003, 1.008 0.0002
Number of decompressed levels 1.19 0.98, 1.43 0.075
CI: confidence interval
11.3.4 Multivariate Analysis
Assessment of tolerance indicated collinearity between cardiovascular co-morbidities,
co-morbidity score and the number of co-morbidities. We evaluated each of these three
predictors independently in multivariate analysis rather than choosing one. The final logistic
regression model consisted of one statistically significant clinical variable, one significant
surgical variable and two factors that approached significance and were deemed clinically
relevant. According to the final model, patients were at an increased risk of perioperative
complications if they had a diagnosis of OPLL (OR: 1.75, p=0.040), concomitant diabetes (OR:
1.96, p=0.060), a greater number of co-morbidities (OR: 1.20, p=0.069) and a longer operative
duration (OR: 1.005, p=0.0015) (Table 11-4).
Equation 11-2 displays the final logistic regression model:
𝑃 =𝑒−4.30+0.67(𝐷𝑖𝑎𝑏𝑒𝑡𝑒𝑠)+0.0048(𝑂𝑝𝑒𝑟𝑎𝑡𝑖𝑣𝑒 𝑑𝑢𝑟𝑎𝑡𝑖𝑜𝑛)+0.56(𝑂𝑃𝐿𝐿)+0.18(𝑁𝑢𝑚𝑏𝑒𝑟)
1+𝑒−4.30+0.67(𝐷𝑖𝑎𝑏𝑒𝑡𝑒𝑠)+0.0048(𝑂𝑝𝑒𝑟𝑎𝑡𝑖𝑣𝑒 𝑑𝑢𝑟𝑎𝑡𝑖𝑜𝑛)+0.56(𝑂𝑃𝐿𝐿)+0.18(𝑁𝑢𝑚𝑏𝑒𝑟) (Equation 11-2)
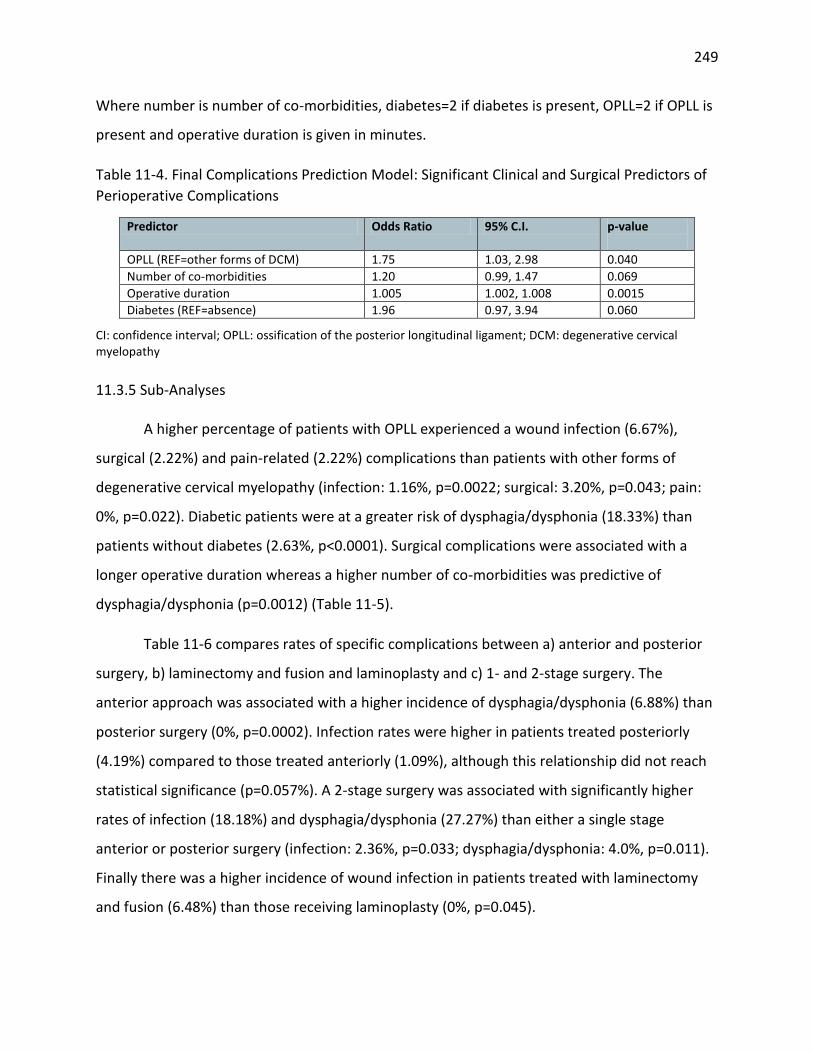
249
Where number is number of co-morbidities, diabetes=2 if diabetes is present, OPLL=2 if OPLL is
present and operative duration is given in minutes.
Table 11-4. Final Complications Prediction Model: Significant Clinical and Surgical Predictors of
Perioperative Complications
Predictor Odds Ratio 95% C.I. p-value
OPLL (REF=other forms of DCM) 1.75 1.03, 2.98 0.040
Number of co-morbidities 1.20 0.99, 1.47 0.069
Operative duration 1.005 1.002, 1.008 0.0015
Diabetes (REF=absence) 1.96 0.97, 3.94 0.060
CI: confidence interval; OPLL: ossification of the posterior longitudinal ligament; DCM: degenerative cervical myelopathy
11.3.5 Sub-Analyses
A higher percentage of patients with OPLL experienced a wound infection (6.67%),
surgical (2.22%) and pain-related (2.22%) complications than patients with other forms of
degenerative cervical myelopathy (infection: 1.16%, p=0.0022; surgical: 3.20%, p=0.043; pain:
0%, p=0.022). Diabetic patients were at a greater risk of dysphagia/dysphonia (18.33%) than
patients without diabetes (2.63%, p<0.0001). Surgical complications were associated with a
longer operative duration whereas a higher number of co-morbidities was predictive of
dysphagia/dysphonia (p=0.0012) (Table 11-5).
Table 11-6 compares rates of specific complications between a) anterior and posterior
surgery, b) laminectomy and fusion and laminoplasty and c) 1- and 2-stage surgery. The
anterior approach was associated with a higher incidence of dysphagia/dysphonia (6.88%) than
posterior surgery (0%, p=0.0002). Infection rates were higher in patients treated posteriorly
(4.19%) compared to those treated anteriorly (1.09%), although this relationship did not reach
statistical significance (p=0.057%). A 2-stage surgery was associated with significantly higher
rates of infection (18.18%) and dysphagia/dysphonia (27.27%) than either a single stage
anterior or posterior surgery (infection: 2.36%, p=0.033; dysphagia/dysphonia: 4.0%, p=0.011).
Finally there was a higher incidence of wound infection in patients treated with laminectomy
and fusion (6.48%) than those receiving laminoplasty (0%, p=0.045).

250
11.4 Applying the Model to Two Cases
Case 1: A 54-year old non-smoking female presented with moderate myelopathy (mJOA=12)
secondary to spondylosis and disc herniation. This patient had bilateral arm paresthesia,
L’Hermitte’s phenomena, atrophy of intrinsic hand muscles and a broad-based unstable gait.
The duration of symptoms was reported as 50 months. The patient also had coexisting mild
depression. She was treated with a 3-level anterior discectomy with fusion and her operative
duration was 160 minutes.
Case 2: A 78-year old non-smoking male presented with severe myelopathy (mJOA=7)
secondary to spondylosis. This patient had numb and clumsy hands, impaired gait, weakness,
corticospinal distribution motor deficits, hyperreflexia, lower limb spasticity and broad-based
unstable gait. The duration of symptoms was reported as 72 months. The patient also had
concomitant moderate hypertension, moderate diabetes and severe coronary arterial disease.
He was treated with a 6-level posterior laminectomy and fusion and his operative duration was
420 minutes.
Figure 11-2. Applying the Complications Prediction Model in a Surgical Setting: Case 1

251
Table 11-5. The Association between Important Predictors and Specific Type of Complications
Table 11-6. The Relationship between Type of Complications and Surgical Approach, Number of Stages and Posterior Technique
Means were compared using the appropriate t-test and frequencies using the Chi-square test. LAMP: laminoplasty; LMF: laminectomy with fusion; OPLL: ossification of the posterior longitudinal ligament. Surgical: pseudoarthrosis, hardware failure, screw malposition, dural dear; Neurological: C5 radiculopathy, progression of myelopathy, new radiculopathy, perioperative worsening of myelopathy; Pain: new neck pain, graft pain; Infection: superficial or deep wound infection
Type of Complication
Present? OPLL p-value
Diabetes p-value Operative Duration
p-value
Number of Co-morbidities
p-value
Yes No Yes No
Surgical Yes 7.41% 3.20% 0.043 0% 5.01% 0.092 176.1±79.26 0.017 1.191.31 0.63
No 92.59% 96.80% 100% 94.99% 221.9±89.60 1.00±1.10
Neurological Yes 1.48% 2.33% 0.73 3.33% 1.91% 0.36 176.8±79.07 0.068 1.18±1.30 0.78
No 98.52% 97.67% 96.67% 98.09% 236.5±112.0 1.40±1.58
Pain Yes 2.22% 0% 0.022 0% 0.72% 1.00 178.3±80.32 0.49 1.19±1.30 0.060
No 97.78% 100% 100% 99.28% 146.7±56.86 0
Infection Yes 6.67% 1.16% 0.0022 6.67% 2.15% 0.067 177.8±80.12 0.75 1.17±1.30 0.12
No 93.33% 98.84% 93.33% 97.85% 185.9±85.80 1.62±1.19
Dysphagia, dysphonia
Yes 4.44% 4.65% 0.92 18.33% 2.63% <0.0001 177.6±79.45 0.88 1.14±1.26 0.0012
No 95.56% 95.35% 81.67% 97.37% 188.0±95.97 2.23±1.69
Type of Complication Present? Approach p-value Stages p-value Posterior Technique p-value
Anterior Posterior 1-Stage 2-Stage LAMP LMF
Surgical Yes 4.35% 4.19% 0.93 4.18% 9.09% 0.39 2.99% 4.63% 0.71
No 95.65% 95.81% 95.72% 90.91% 97.01% 95.37%
Neurological Yes 1.09% 3.66% 0.10 2.14% 0% 1.00 1.49% 4.63% 0.41
No 98.91% 96.34% 97.86% 100% 98.51% 95.37%
Pain Yes 0.72% 0.52% 1.00 0.64% 0% 0.79
No 99.28% 99.48% 99.36% 100%
Infection Yes 1.09% 4.19% 0.057 2.36% 18.18% 0.033 0% 6.48% 0.045
No 98.91% 95.81% 97.64% 81.82% 100% 93.52%
Dysphagia, dysphonia Yes 6.88% 0% 0.0002 4.07% 27.27% 0.011 2.99% 6.48% 0.48
No 93.12% 100% 95.93% 72.73% 97.01% 93.52%

252
Using equation 2, case 1 had a 10.69% (95%C.I.: 7.71-14.65%) probability of
experiencing a complication whereas case 2 had a much greater risk (P=58.42%, 95%C.I.: 37.02-
77.05%). Case 2 should be informed of this risk during the surgical consent process and his
attending surgeon should develop a case-specific preventative plan. Furthermore, case 2 should
be closely monitored in the postoperative period.
11.5 Discussion
This study aimed to first identify key clinical and surgical predictors of perioperative
complications in patients with CSM and then to develop a complications prediction rule. Based
on our results, patients were at a higher risk of perioperative complications if they had a
greater number of co-morbidities, coexisting diabetes, myelopathy secondary to OPLL and a
longer operative duration. This model can help a surgeon identify patients who are at an
increased risk of experiencing a complication and encourage them to modify their surgical
strategies accordingly. For example, patients at a higher risk of 1) dysphagia/dysphonia (i.e.
those with a greater number of co-morbidities or diabetes) should be evaluated preoperatively
by speech pathologists to ensure no subclinical dysphagia, 2) wound infections (i.e. those with
OPLL) should receive vancomycin treatment to reduce this risk; 3) neurological complications
may be given neuroprotective agents or monitored using intraoperative evoked potential
recordings. Furthermore, surgeons can use this knowledge to discuss the risks and benefits of
surgery with their patients during the consent process and to ensure appropriate monitoring
and management in the postoperative period. Furthermore, health care providers can use a
patient’s relative risk to anticipate hospital utilization costs, allocate resources accordingly and
optimize postoperative recovery.
This study has also identified key differences in the complication profile between the
anterior and posterior approach, laminectomy with fusion and laminoplasty and 1- and 2-stage
surgery. Based on our findings, 1) the anterior approach is associated with higher rates of
dysphagia/dysphonia; 2) there is a higher incidence of infection in patients treated by
laminectomy and fusion; and 3) 2-stage procedures are accompanied by increased risk of
infection and dysphagia/dysphonia. This knowledge will inform surgeons of the likely

253
complications associated with each procedure and allow them to implement appropriate
intraoperative preventive strategies as well as effective postoperative management plan.
This model was first conceptually developed using evidence from the literature and
results from a survey of 916 spine professionals from AOSpine International. These methods
will serve to improve the generalizability and validity of this prediction rule in future
populations.
Our results must be interpreted in the context of existing literature. With respect to co-
existing diseases, a single study assessed complication rates between patients with and without
diabetes while controlling for several key confounders including age and number of fused
levels.218 According to Cook et al (2008), patients with diabetes were at a higher risk of cardiac
complications (OR: 1.57, p=0.01) and “other complications” (OR: 1.54, p=0.01) than patients
without diabetes. In addition, cardiac complications (OR: 2.82, p=0.03), hematomas (OR: 5.13,
p<0.01) and postoperative infection (OR: 7.46, p=0.02) were more common in patients with
uncontrolled diabetes than those with controlled disease.218 In surgical lumbar studies, diabetes
was also a significant risk factor of non-unions and wound infections.291-294 Based on our survey
results, spine professionals agreed that a patient’s general preoperative health status was a
significant predictor of perioperative complications. Specifically, if a patient had co-existing
diabetes, he/she would be at a greater risk of perioperative complications, cardiac
complications, and wound infections.
Several studies explored various clinical and imaging risk factors of upper extremity
palsy following surgical decompression247, 254, 256, 261, 348, 349; however, only two of these
conducted a well-powered multivariate analysis.242, 243 In our systematic review of the
literature, low level evidence suggested that patients with a diagnosis of OPLL were at a higher
risk of developing upper extremity or C5 nerve palsy postoperatively. Low level evidence,
however, indicates low confidence that the evidence reflects the true effect and that further
research is likely to change the confidence in the estimate of effect or the estimate itself. In the
CSM-International study, there were no significant differences in rates of neurological
complications (p=0.73) or, more specifically, C5 radiculopathy (p=0.32) between diagnosis
254
groups. Potential explanations for this discrepancy include differences in definitions across
studies, small sample sizes or reporting differences between investigator- and coordinator-
collected data. Patients with OPLL, however, had a higher incidence of wound infection
(p=0.0022), pain-related complications (p=0.022) and surgical complications (p=0.043) than
patients with other forms of DCM. Possible explanations for these increased rates include that
the surgery for OPLL is technically challenging and that the ossification process often involves
the dura.
Finally, moderate evidence suggests that operative duration is associated with
perioperative complications. This surgical variable is a surrogate for case complexity as patients
with increased degenerative pathology will likely undergo a longer surgery or possibly a two-
stage circumferential procedure. In addition, a longer operative duration is associated with
higher rates of infection following surgery.
The non-significant findings in this current study also confirm the results of existing
literature. Based on our analysis, there was no difference in overall complication rates between
patients treated anteriorly and those treated posteriorly. This conclusion is in line with the
results from the CSM-North America study that identified no significant differences in overall
rates of perioperative complications between approach groups.115 Studies by Ghogawala et al
(2011) and Kristof et al (2009) also reported similar rates of complications between posterior
laminectomy and either anterior discectomy or corpectomy.268, 269 Baseline severity score,
smoking status, duration of symptoms and gender were also not significant predictors of
complications in this study. According to our systematic review of the literature, there is
moderate evidence confirming no relationship between gender and complications and low
evidence suggesting baseline myelopathy severity, smoking status and preoperative duration of
disease are not associated with perioperative complications.
Imaging factors were not evaluated in this study but will be a topic of future research.
Lubelski et al (2014) developed a model to predict C5 palsy following decompression surgery
using preoperative anatomic measurements from magnetic resonance images (MRI).350 Based
on this study, a combination of anteroposterior diameter, foraminal diameter and cord-lamina
255
angle could accurately identify (95%) patients who would experience symptoms of C5
radiculopathy postoperatively. This high discriminative ability provides strong evidence that
imaging factors do play a significant role in predicting neurological complications and likely
overall complication rates. Imagama et al (2010) also reported that nerve root palsy is
associated with a smaller width of the intervertebral foramen of C5 and a higher degree of
anterior protrusion of its superior articular process.254 In addition, several studies have
recognized that a larger occupying ratio of OPLL is significantly predictive of upper extremity
paresis246 and of major intraoperative blood loss.244 Other factors have been reported as
insignificant predictors of complications: preoperative lordosis,248, 254 signal intensity on a T2-
weighted MRI251, 254, C2-C7 angle and cervical curvature.249, 351 Future prospective research,
however, is required to truly evaluate the predictive value of these MRI factors.
11.6 Strengths and Limitations
To date, this study represents the largest prospective analysis of important clinical and
surgical predictors of complications and the first one using international data. The major
limitations of this study are that there are no standardized definitions of complications and that
surgeons often have different perceptions of what constitutes a surgery-related event. In this
study, all adverse events were collected throughout the study and classified as either related to
CSM, related to surgery or unrelated by a central panel of investigators. These investigators
were blinded to the patients’ demographic information, surgical summary and neurological
status. This method like reflects the most consistent, unbiased and comprehensive method of
identifying complications in a surgical cohort; however, regional variations in definitions may
still affect data collection and reporting.
11.7 Conclusions
The main focus of this study was to evaluate predictors of overall perioperative
complications in patients undergoing surgery for CSM. Based on our model, patients were at a
higher risk of complications if they had a greater number of co-morbidities, co-existing
diabetes, a diagnosis of myelopathy secondary to OPLL and a longer operative duration. This
knowledge can be used by surgeons to objectively quantify a patient’s risk of complications and

256
discuss these risks during the surgical consent process. Furthermore, surgeons should use this
information to institute case-specific preventative plans and to strategize appropriate
postoperative care. Future studies will focus on predicting neurological complications as well as
major complications that require reoperation.

257
Chapter 12: Summary of Findings, General Discussion, Thesis
Limitations and Future Directions
12.1. An Overview: Predicting Surgical Outcome
There is an increasing need for clinicians to accurately and objectively quantify a
patient’s likely surgical outcome in order to appropriately manage patient expectations and
improve overall satisfaction. In the United States of America, recent legislative developments
require clinicians to incorporate patient satisfaction into their assessment of overall treatment
outcomes.352 Centers for Medicare and Medicaid services (CMS), hospitals and insurance
providers are searching for ways to better evaluate care and have identified patient satisfaction
as a major component and predictor of overall quality.352 As a result, as part of a CMS hospital
inpatient value-based purchasing program, Medicare reimbursements are increasingly linked to
patient satisfaction. Furthermore, as of 2013, CMS have provided “value-based” incentive
payments to acute care hospitals according to, in part, patient satisfaction surveys.353
Patient satisfaction is not solely based on clinical outcomes and can be strongly
influenced by several other factors, including the politeness of the staff, the cleanliness of the
facilities, surgical wait times and the physician’s communication skills. Furthermore, according
to a study by Hamilton et al (2013), preoperative expectations, and whether or not they are
met through treatment, is also a significant predictor of overall satisfaction.347
Expectations are “the yardstick by which our patients measure the course of recovery,
occurrence of complications and the outcome.”354
Patients’ expectations, however, are often influenced by anecdotal evidence provided
by friends and family, information obtained from the internet and various news sources and
past surgical experiences. The attending surgeon must use the consent discussion as an
opportunity to outline risks and benefits of the procedure, provide accurate outcome
information and correctly manage patients’ expectations. However, these expectations are also
affected by how the patient understands the information provided by the surgeon and how
he/she translates it into “actionable beliefs.”354 This is further dependent on several extraneous

258
factors such as mental state, attitude and individual or cultural values and, as such, patients
may form different expectations than those the surgeon is attempting to communicate.
In this thesis, we hypothesized that a quantitative tool used to predict surgical outcome
can help a surgeon more effectively convey prognostic information and give the patient a
better understanding of how he/she should expect to fare following intervention. Patients’
expectations will therefore be more appropriately managed and, accordingly, overall
satisfaction will likely improve. There is also substantial variability across centers with respect
to the conversations surgeons have with their patients during the preoperative visit. It is
imperative that guidelines are developed to standardize the prognostic information clinicians
provide their patients at the time of surgical consent. A quantitative tool can ensure that
consistent, accurate and objective information is being conveyed to these patients and can help
align surgeons’ perceptions of outcomes across hospitals, regions and even countries.
The first objective of our thesis was to evaluate important clinical and imaging
predictors of functional status at 1-year following surgery. As presented in Chapters 3 and 4, a
systematic review and a survey of international spine professionals were conducted to develop
a theoretical framework for a prediction model. Although numerous studies have examined the
predictive value of various clinical factors, only 24 used a multivariate analysis and controlled
for potential confounders. The majority of these were retrospective cohort studies and had
several methodological flaws. In addition, a variety of outcome measures or forms of outcome
measures were used, preventing easy comparison across studies and effective synthesis of the
evidence. Very few conclusions could be made as to significant clinical predictors of outcome.
The baseline level of evidence for most associations started at “low” and was further
downgraded as effect estimates or confidence intervals of these estimates were not reported.
However, based on the consistency of results across studies, we concluded that durations of
symptom and preoperative myelopathy severity score are significant predictors of surgical
outcome as longstanding and chronic compression of the spinal cord can lead to irreversible
histological damage. This review identified several knowledge gaps and confirmed the need for
a prospective multicenter prediction study.

259
In systematic review B, we aimed to identify significant imaging predictors of outcome.
We focused on studies that conducted a multivariate analysis and controlled for two of the
following three covariates: age, baseline severity score and duration of symptoms. Again, there
was a paucity of information in the form of high quality prospective studies with well powered
statistical analyses. In addition, the methodology used to measure certain imaging parameters
varied across studies, emphasizing the need to develop quantitative guidelines for the
assessment of MRI. In general, based on our review, factors that could distinguish between
irreversible and reversible damage were the most important predictors of outcome. The
rationale behind this finding is that, if cord compression results in mild damage such as edema
or ischemia, then surgical decompression can reverse these histological changes. The key
imaging predictors of surgical outcome were combined T1/T2 signal change; signal change ratio
comparing compressed vs. non-compressed segments or T2 vs. T1 intensity; and the number of
SI segments. A combined T1/T2 signal change, a higher signal change ratio and multilevel SI are
all indicative of severe, irreversible damage to the spinal cord, including cystic necrosis,
secondary syrinx and cavitation.
The survey of AOSpine International was used to bridge the gap between current
practice and existing evidence. Based on our results, spine professionals agreed and confirmed
that baseline severity score and duration of symptoms are the most significant predictors of
outcome. Similar to our systematic review, there was a lack of consensus surrounding the
predictive value of age. Finally, although smoking status was not ranked highly by spine
professionals, a large proportion of the sample indicated that current smoking status does carry
prognostic value.
Spine professionals agreed that MRI was a valuable prognostic tool and that cord
properties were more important predictors of outcome than canal dimensions. However, it was
also evident that clinicians did not know what specific parameters of the MRI should be
measured for outcome prediction. The presence of high SI on a T2WI was deemed to be the
most important imaging factor and had the highest mean ranking. However, based on our
systematic review, a high SI on T2WI reflects a broad spectrum of compressive pathologies and
a wide range of recuperative potentials. T2WI SI is non-specific and may indicate either

260
reversible damage including edema and ischemia or irreversible changes similar to T1WI, such
as necrosis, myelomalacia and cavitation. If the SI reflects more minor pathological changes
that will likely diminish post-surgery, then it is not an important prognostic factor. There is a
definite need to address this discrepancy between literature findings and professional opinion
and to establish how clinicians should use the MRI as a prognostic tool.
The results from the systematic review and survey guided the development of our
clinical prediction model (Figure 12-1). We first constructed a preliminary model using data on
278 patients enrolled in the CSM-North America study at 12 North American sites.
Postoperative mJOA at 1-year was selected as the primary outcome measure as this assessment
tool addresses all components of CSM and is routinely used to evaluate functional status in
these patients. The mJOA was dichotomized for the purpose of logistic regression analysis and a
score of 16 was deemed an appropriate cut-off to distinguish between patients with mild
myelopathy postoperatively and those with substantial residual neurologic impairment. This
cut-off was also validated using the MCID of the mJOA as an anchor: patients who improved by
greater than or equal to the MCID scored, on average, 15.82±2.19 and demonstrated
significantly larger gains in functional status. Predicting a score ≥16 is also clinically relevant and
especially useful to manage expectations. Although patients often ask about their chances of
improvement, they also want to know whether surgery will result in greater social
independence, an ability to perform day to day activities and the resolution of their more
deleterious signs and symptoms. A score ≥16 on the mJOA translates to mild impairment and
functional independence and thus predicting this score is meaningful for patients.
Based on the North American model, patients were more likely to achieve a score ≥16 if they
were milder preoperatively and had a shorter duration of symptoms; were younger; did not
smoke; and did not have co-existing psychiatric disorders or impaired gait. These findings
provide additional support to the results from our systematic review and survey and confirm
that patients with severe degenerative changes and chronic, longstanding compression of the
cord have less recuperative potential due to irreversible histological damage. It is necessary
that primary care physicians accurately detect CSM at early disease stages, differentiate
between it and mimicking diagnoses and refer these patients immediately for surgical

261
consultation. A first step to ensure timely management of CSM is to better educate medical
students to identify key indicators of CSM on the MRI and physical examination and effectively
rule out differential diagnoses such as carpal tunnel syndrome, MS, ALS and vitamin B
deficiency. Furthermore, guidelines for CSM management need to be developed and shared
among primary care physicians, neurologist and rheumatologists to outline that patients should
be referred to a neurosurgeon or orthopaedic surgeon upon diagnosis. In addition to duration
of symptoms and baseline severity score, impaired gait is also a significant predictor of
outcome. This result provides further incentive for early diagnosis and referral as 20-60% of
patients with symptomatic CSM will deteriorate over time and exhibit signs and symptoms of
gait impairment. At this point in the disease progression, it is difficult to guarantee a patient will
experience optimal recovery following surgery.
Figure 12-1. A Theoretical Framework of the Prediction Model The dependent variable is functional status at 1-year follow-up as assessed by the mJOA (rounded-edge rectangular box). The key predictors or independent variables are contained in rectangular boxes and are connected to the outcome by one-directional black arrows. The thickened arrows represent a confirmed relationship between duration of symptoms and baseline severity score and surgical outcome. Red arrows indicate potential confounders:

262
Older patients were less likely to achieve a score ≥16 on the mJOA. This finding will help
resolve the controversy surrounding age and will contribute to the overall body of evidence as
it is based on results from a level I prospective cohort study with a follow-up rate ≥80%. We do
not, however, recommend that surgeons discriminate on the basis of age but rather be aware
that their elderly patients may not be able to translate neurologic recovery into functional
improvements as effectively as their younger patients. Potential explanations for this reduced
recovery include 1) the elderly experience age-related changes in their spinal cord, including a
decrease in γ-motorneurons, number of anterior horn cells and number of myelinated fibers in
the corticospinal tracts and posterior funiculus; 2) as CSM is a progressive disease, older
patients are likely to have more substantial degenerative pathology and may require a more
complex surgery; and 3) older patients are more likely to have reduced physiological reserves
and unassociated co-morbidities that may affect outcome. It is important that a clinician
distinguish between a patient’s chronological age and his/her physiological age when predicting
surgical outcome. In general, however, age is associated with poorer surgical outcomes and so
the expectations of elderly patients should be managed accordingly.
Smoking was also a negative predictor of outcome. Although previous studies have
suggested that smoking results in higher rates of non-fusion and wound infections, there were
no significant differences in our cohort between smokers and non-smokers with respect to
these complications. Instead, we speculate that smoking is a surrogate for an unhealthy
lifestyle, presence of co-morbidities, lower socioeconomic status and poorer dietary choices. All
of these variables could impact a patient’s clinical outcomes and recovery, compliance with
rehabilitation programs and access to post-surgical care. Further research is required to confirm
these hypotheses; however, until this is done, smokers should be encouraged to stop their
habit prior to surgery.
Finally, patients with depression and bipolar disorders were less likely to achieve an
“optimal” surgical outcome. Preoperative mental state has been strongly associated with
surgical outcomes following other forms of neuro- and orthopedic surgeries, including total
knee replacement, lumbar discectomy and revision surgery for adjacent segment degeneration,
recurrent stenosis and pseudoarthrosis.355, 356 Our study is the first prospective study to report

263
that patients with controlled, type I psychiatric disorders are more likely to have a suboptimal
outcome. It is essential that clinicians carefully evaluate a patient’s mental status and take
record of prior or current use of anti-depressants. Some patients may have undiagnosed
psychiatric disorders; the Zung depression scale or other similar tools may be useful to evaluate
a patient’s preoperative depression status. Surgeons may recommend that these patients seek
counseling prior to intervention in order to improve outcomes, recovery and treatment
satisfaction.
The original model demonstrated good predictive performance and had strong internal
validity. However, since the model was developed using patients from North America, it truly
reflects the demographics, disease characteristics, medical system and management strategies
of North America. Consequently, performance of the model must be assessed on an external
population to test its value in a different setting and determine whether it can be implemented
into clinical practice. Our model was externally validated using data on 479 patients enrolled in
CSM-International study from 16 global sites. Although the model proved to be valid, certain
clinical factors were identified as more significant predictors in North America than in global
settings. The most important of these was psychiatric disorders: depression and bipolar disease
had a greater predictive value in the North American population because the reported
incidence was significantly higher among these patients than in our international sample. These
differences may indicate regional variations in actual incidence but likely reflect either surgical
selection bias or cultural reluctance to admit to mental illness. Regardless, this low incidence in
populations outside of North America decreases the global validity of this predictor. For our
final, global prediction model, we developed a co-morbidity score to summarize a patient’s
overall preoperative general health status. This score is comprised of both number of co-
morbidities as well as severity of disease. This predictor was statistically significant in our model
and contributed to its overall predictive performance.
In chapter 9, we evaluated whether certain MRI parameters would enhance the
predictive performance of our validated clinical prediction rule. Given the results of our
systematic review, we hypothesized that signal change ratio, combined T1/T2 signal change or
number of SI segments (extent of signal change) would improve the discriminative ability of our

264
model. Signal change ratio and height of signal change were the two factors that increased the
AUC the most, although these improvements were not statistically significant. Ultimately, in our
cohort of surgical patients with both neurological and image-evidence of CSM, MRI parameters
did not significantly improve the performance of our North American model. We speculate that
the MRI becomes less sensitive in predicting outcome in this group of surgical patients as all
participants had a positive MRI and evidence of cord compression. The results of this study are
not intended to devalue the role of MRI but rather suggest that, alternatively, more sensitive
techniques are necessary to uncover additional prognostic value.
In conclusion, the main predictors of an “optimal” outcome are a younger age; milder
preoperative myelopathy; a shorter duration of symptoms; non-smoking; absence of impaired
gait; and better general health status as evaluated by number and severity of co-morbidities.
Our final global prediction model can be implemented into clinical practice as a quantitative
tool used to predict a patient’s likely surgical outcome.
12.2 An Overview: Predicting Complications
Surgeons must also inform patients as to their risk of surgical complications during the
consent discussion.
“Informed patients are a lot more understanding…”
Dr. Hecht, an orthopaedic surgeon at Mount Sinai hospital in New York City, discussed the need
to appropriately manage a patient’s expectations of surgical complications at the Annual
Meeting of the Cervical Spine Research Society. In the United States of America, the
consequences for poorly communicating this information are far more substantial than in
Canada. A patient who is unaware of his/her risk and subsequently suffers a complication is
more likely to be dissatisfied with their surgery regardless of other clinical outcomes. Given the
“pay-per-performance” policies in the United States, there may be financial implications for
neglecting to inform a patient of their complication risk. Furthermore, in addition to being
dissatisfied, patients who experience a complication may choose to file a claim and sue their
265
surgeon for medical malpractice. Interestingly, medical claims for spine surgery represent the
highest compensation payments and defense costs out of all forms of orthopaedic surgery.357
The second objective of this thesis was to evaluate important clinical and surgical
predictors of complications and to develop a preliminary prediction model to quantify patient
risk. Such a tool will help surgeons identify high risk patients and allow them to more effectively
and accurately communicate this risk to their patients. Accordingly, patients will have a better
understanding of their surgical risks and benefits; appreciate the thoroughness of the surgeon,
thereby enhancing the ever-so important patient-physician relationship; and be less surprised
and likely to file a medical claim if a complication occurs. In addition, knowledge of a patient’s
complication risk can help surgeons develop and institute case-specific preventative plans and
strategize postoperative care. Furthermore, surgeons should also be encouraged to closely
monitor their high risk patients in the perioperative period and educate them to recognize
future signs of complications. Finally, health care providers can use this information to
anticipate future hospital utilization costs and allocate resources accordingly.
Similar to our outcome study, we conducted a systematic review and surveyed
international spine professionals to first develop a conceptual complications model. Based on
our systematic review, older patients are less tolerant to surgery and are at a higher risk of
complications due to poorer overall health status, co-morbidities and reduced physiological
reserves. A longer operative duration and a two-stage surgery are also important predictors of
outcome as both reflect substantial degenerative pathology and increased case complexity. In
addition, patients with OPLL are at a higher risk of C5 nerve root palsy than patients with other
forms of DCM.
There was discrepancy between literature findings and surgeons’ perceptions of
important predictors of complications. According to spine professionals, the presence of co-
morbidities is the most important risk factor of perioperative complications; specifically, there
is a significant association between diabetes and various types of complications including
wound infections, cardiac complications and non-unions. In our literature review, low level
evidence, based on the findings of two prospective cohort studies, suggested co-morbidities are

266
not predictive of perioperative complications. Cook et al (2008), however, determined that
patients with diabetes (compared to non-diabetics) are at a higher risk of cardiac complications
and those with uncontrolled disease are more likely to experience hematomas and
postoperative wound infections. With respect to surgical predictors, professionals supported
some of the results from our review and agreed that 2-stage surgeries are associated with
higher rates of complications than single stage surgeries. A prospective cohort study is required
to address controversy in the literature and among professionals and to properly define the
most critical predictors of complications.
Our model was developed using data on 479 patients participating in the CSM-
International study. Each investigator was responsible for recording all adverse events that
occurred throughout the study period. Some of these included a fall in the postoperative ward,
a nose bleed, an intraoperative cardiopulmonary, C5 nerve root palsy or pseudoarthrosis. These
adverse events were collected by a data processing center and adjudicated by a panel of
physicians as either related to CSM, related to surgery or unrelated. Any discrepancies across
the panel were resolved by consulting the source documents as well as the attending surgeons.
These methods ensured that complication definitions were standardized and that only “real”
surgery-related events were included in our analyses. Based on our model, patients were at a
higher risk of perioperative complications if they had a greater number of co-morbidities,
coexisting diabetes, myelopathy secondary to OPLL and a longer operative duration. This model
represents a first step to quantifying a patient’s risk of surgical complications. Future studies
are required to validate this model and assess predictors of specific complications such as C5
nerve root palsy, progression of myelopathy and wound infections.
12.3 Thesis Limitations
This thesis combines evidence from existing literature, professional opinion and
statistical findings to develop a clinical and complications prediction rule using prospectively
collected data. Given our high follow-up rate (>80%), our prognostic cohort studies reflect level
1 evidence according to criteria set by the Journal of Bone and Joint Surgery. One of the
limitations of this thesis is the 15-20% attrition rate at 1-year follow-up. For parts 1 and 2 of our

267
outcomes prediction study, we accounted for this missing data using a multiple imputation
procedure as is statistically recommended. This is the preferred method for handling missing
data and is less susceptible to bias than removing patients with incomplete variables. In
addition, there were no significant demographic differences between patients who did and did
not attend their follow-up visit. Regardless, complete datasets would have been preferred for
our analyses. In the complications analysis, a significant proportion of BMI data was missing; as
a result, we were unable to effectively evaluate its predictive value. Patients with a high BMI
may be malnourished, have coexisting co-morbidities such as hypertension and diabetes and
may be more challenging to operate on. All of these factors may increase a patient’s risk of
complications; unfortunately we were unable to include this factor in our model due to missing
data. MRI collection was not a prerequisite for the CSM-North America study and so we were
only able to obtain useable images for 114 patients (41%). Fortunately, this was all that was
needed to evaluate whether MRI parameters contributed to the overall predictive performance
of our model.
It is necessary to know the reliability of our variables before forming strong conclusions
about their predictive value. With respect to our final model, age, impaired gait and smoking
status were assumed to be reliable predictors. On the other hand, the reliability of duration of
symptoms is unknown; however, the exact symptom duration may be difficult for a patient to
accurately recall and may be influenced by how urgently a patient believes he/she needs
surgery. To mitigate recall bias, we divided duration of symptoms into five groups (≤3 months;
>3, ≤6 months; >6, ≤12 months; >12, ≤24 months; >24 months); a patient only has to estimate
within three months of their actual duration. The reliability of our co-morbidity score is also
unknown and may be affected by cultural variations in diagnoses such as psychiatric disorders
and in prescription habits. Finally, the reliability of the mJOA has not been tested, resulting in
potential measurement biases. Even if the reliability of the English version of the mJOA was
known, the scale’s translatability would need to be evaluated as the International study was
conducted in several different languages. Various MRI parameters have also not been validated
or assessed for reliability.

268
Surgeons have different perceptions of complications. For example, some surgeons
believe that every patient treated anteriorly will suffer “dysphagia” whereas others do not
classify “trouble swallowing” as a complication but rather a normal event after anterior
operation. To account for this variation, a panel of physicians sorted through all adverse events
and classified each as related or unrelated to surgery based on specific criteria.
As specified in Chapter 10, we also identified a limitation in our final prediction model: it
was more efficient at predicting outcome in mild and moderate patients than in severe
patients. It is unjust to classify a patient who improves from 8 to 13 on the mJOA as having a
“suboptimal” outcome. To rectify this problem, we developed a second prediction model and
used a score of 12 as our cut-off for regression analysis. Interestingly, an outcome ≥12 was also
predicted by a higher baseline severity score, a shorter duration of symptoms and better
general health status. A final limitation is the ceiling effect of the mJOA. Future studies should
use more sensitive scales that can detect improvements in milder disease states.
12.4 Future Directions
12.4.1 Standardizing Nomenclature
The definition of CSM needs to be internationally standardized and expanded to
encompass all forms of degenerative myelopathies including OPLL. There is controversy in the
literature as to whether OPLL should be characterized under the same term as CSM or if it
should be considered a separate entity. OPLL typically occurs in younger patients, is more
prevalent in the Japanese population and is suspected to have a familial predisposition and
genetic association.358 Given that the occurrence and progression of OPLL is tied to the aging of
the spine, and because it presents with similar signs and symptoms as CSM, we believe it is
reasonable to include both CSM and OPLL under the single term “degenerative cervical
myelopathy.” This definition encompasses both osteoarthritic changes including spondylosis,
disc herniation and facet arthropathy as well as ligamentous aberrations such as hypertrophy or
calcification of the ligamentum flavum and OPLL.

269
12.4.2 The Reliability of the mJOA and MRI Factors
All psychometric properties have been established for the mJOA except for its reliability.
Currently, we are evaluating the intra-rater reliability by having two independent assessors
score the same CSM patient preoperatively. We will then calculate the intraclass correlation
coefficient for the association between the scores of the two raters. A detailed instruction
sheet is provided to each evaluator that outlines precisely how the mJOA should be measured.
The reliability of the MRI parameters must also be determined. We hope to recruit
approximately five neurosurgical or orthopedic spine fellows to assess the intra-rater reliability
of 1) identifying the mid-sagittal slide, 2) anatomical measurements such as the transverse
area, maximal canal compromise and cord compression, 3) the presence and absence of signal
change on both the T1-WI and T2-WI, and 4) signal change ratios. The inter-rater reliability of
these parameters can also be calculated by having the same reviewer re-measure each MRI at a
later time.
12.4.3 Guidelines for the Management of CSM
A team, led by Dr. Fehlings, is currently working on developing guidelines for the
management of CSM to ensure adequate patient support, appropriate treatment strategies and
optimal outcomes. We intend for these guidelines to appeal to a broad audience and, as such,
will involve experts from all specialties that encounter patients with CSM, including
neurosurgeons, orthopedic surgeons, neurologists, rheumatologists, physiatrists and
rehabilitation specialists. The introduction of these guidelines will serve as a way to define the
disease and relevant nomenclature, discuss the incidence of CSM and its global and regional
burden and highlight the differential diagnoses.
These guidelines will focus on three key topics:
1) How to diagnosis CSM and effectively quantify impairment in this population?
a. What are the “gold standard” diagnostic tests that should be used to identify
CSM?
b. What are the best tools to evaluate impairment in this population?

270
2) How to manage patients with evidence of myelopathy?
a. What is the natural history of CSM?
b. Is non-operative intervention effective for the treatment of CSM?
c. Is surgery effective for the treatment of CSM?
d. What is the role of preoperative severity and duration of symptoms on
treatment outcomes? Howe should patients with mild myelopathy be managed?
Should surgical treatment be prescribed for mild patients?
3) How to manage minimally symptomatic cervical degenerative disease?
a. How should clinicians manage patients with minimally symptomatic cervical
degenerative disease but image evidence of cord compression? What are the
predictors of neurological deterioration and progression? How do we effectively
monitor these patients?
b. Is non-operative treatment effective in these patients?
12.4.4 Predicting Surgical Outcomes
In this thesis, we have summarized the most significant predictors of surgical outcome
and have developed a globally relevant and valid tool that can be implemented into clinical
practice. The next step is to create a smart phone application that clinicians can readily use to
quantify a patient’s probability of an “optimal” outcome by simply plugging in information on a
patient’s age, duration of symptoms, baseline severity score, smoking status, gait dysfunction
and general health status. This would be easier than having to use the lengthy equation
presented in Chapter 10. We also need to encourage surgeons to use our model in a clinical
setting as a decision-making aid and as a means to manage expectations, individualize
preoperative counseling and improve satisfaction. To do this, we need to promote our “app” at
key international neurosurgical and spine conferences.
A future study should test the hypothesis that our prediction model can improve overall
satisfaction by accurately managing expectations. To do this, I propose a randomized controlled
trial in which, for 50% of the sample, we would quantify a patient’s likely outcome using our
model and share these results with the patient during the surgical consent discussion. The

271
remaining 50% of patients would have a regular patient-surgeon conversation and would not
receive an estimate of their outcome. Data will be collected at 1-year on patient satisfaction
and compared between the two groups.
12.4.5 Predicting Complications
For our complications model, the next step in to evaluate its external validity. However,
before this is done, definitions of complications need to be standardized across surgeons and
centers. At the Annual Meeting of the Cervical Spine Research Society, Justin Smith highlighted
that some of the key issues in the collection of complication data include 1) prospective
collection has higher rates than retrospective collection; 2) studies where complications are
recorded by surgeons have lower rates than studies where research coordinators are
responsible for data collection; and 3) it is unclear what actually constitutes a complication and
how to distinguish between minor and major events. In our complications study, all adverse
events were collected throughout the study and then adjudicated by a central panel of
investigators as related to CSM, related to surgery or unrelated. This likely represents the most
consistent, unbiased and comprehensive method of identifying complications in a CSM surgical
cohort. However, the heterogeneity of complications and regional variations in definitions may
still affect data collection and reporting.
At the 2014 Annual Meeting of the Cervical Spine Research Society, Dr. Justin Smith
proposed a classification system to better define surgical complications. Once this is done, we
can conduct another prospective complications study to validate our prediction model. Future
studies should also consider malnourishment using albumin as a marker, BMI and imaging
factors as predictors of perioperative complications.
In CSM, there are several types of complications categories (Figure 12-2). Given the
heterogeneity of complications, it is necessary to explore important predictors of specific types
of complications such as hardware failure, progression of myelopathy, dural tear and C5
radiculopathy. We speculate that significant predictors will vary depending on what
complication is used as the dependent variable. For some of these, it will also be critical to
incorporate various imaging findings.
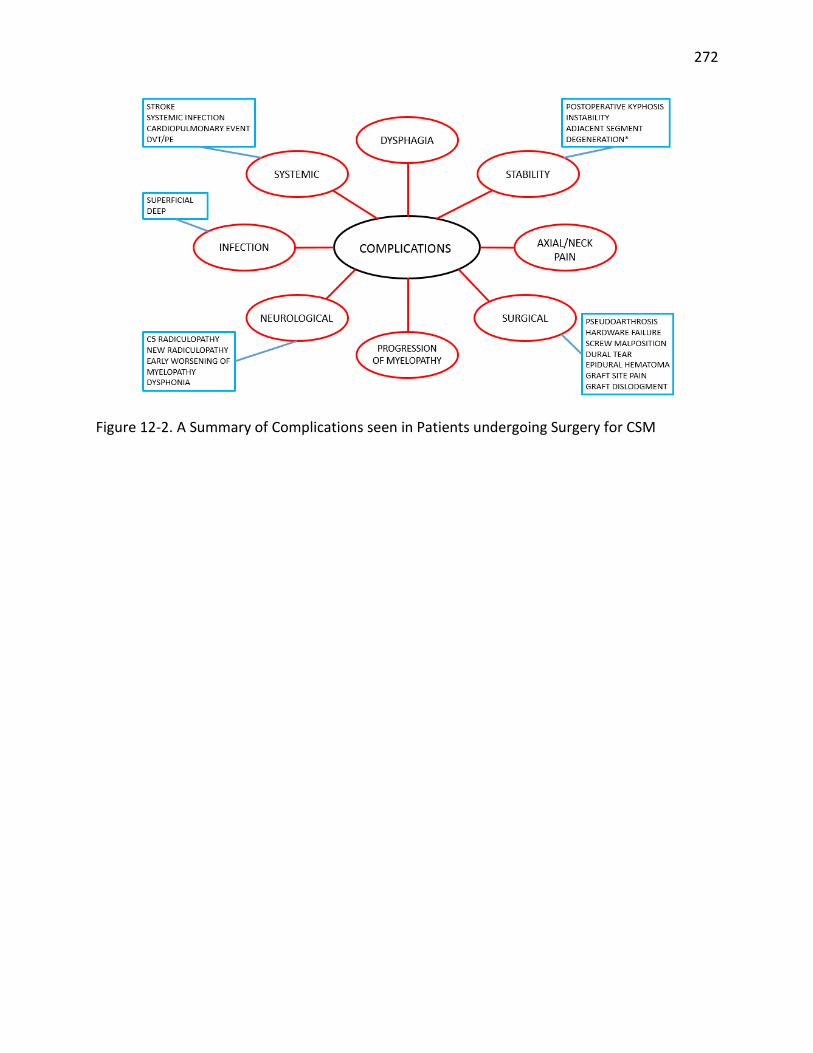
272
Figure 12-2. A Summary of Complications seen in Patients undergoing Surgery for CSM

273
Publications Arising from this Thesis
Chapter 1: Derived from Tetreault L, Goldstein CL, Arnold P, Harrop J, Hilibrand A, Nouri A, Fehlings MG. Degenerative Cervical Myelopathy: A Spectrum of Related Disorders Affecting the Aging Spine (Neurosurgery) Kim HJ, Tetreault L, Massicotte EM, Arnold PM, Skelley AC, Brodt ED, Riew KD. Differential diagnosis for cervical spondylotic myelopathy: literature review (Spine) Singh A, Tetreault L, Casey A, Laing R, Statham P, Fehlings MG. A Summary of assessment tools for patients suffering from cervical spondylotic myelopathy: a systematic review on validity, reliability and responsiveness (European Spine Journal) Chapter 2: Derived from Tetreault L, Le D, Cote P, Fehlings MG. The Importance of Clinical Prediction Rules and External Validation: A commentary using an example in surgical patients with cervical spondylotic myelopathy (Evidence Based Spine Journal) Chapter 3: Derived from Tetreault L, Karpova A, Fehlings MG. Predictors of outcome in patients with degenerative cervical myelopathy undergoing surgical treatment: results of a systematic review (European Spine Journal) Tetreault L, Dettori JR, Wilson JR, Singh A, Nouri A, Fehlings MG, Brodt ED, Jacobs WB. Systematic review of magnetic resonance imaging characteristics that affect treatment decision making and predict clinical outcome in patients with cervical spondylotic myelopathy (Spine) Tetreault L, Ibrahim A, Côté P, Singh A, Fehlings MG. A Systematic Review of Clinical and Surgical Predictors of Complications following Surgery for Degenerative Cervical Myelopathy (JNS: Spine) Chapter 4: Derived from Tetreault L, Nouri A, Singh A, Fawcett M, Fehlings MG. Predictors of outcome in patients with cervical spondylotic myelopathy undergoing surgical treatment: A survey of members from AOSpine International (World Neurosurgery)

274
Tetreault L, Singh A, Nater A, Fawcett M, Fehlings MG. An Assessment of Key Predictors of Perioperative Complications in Patients with Cervical Spondylotic Myelopathy Undergoing Surgical Treatment: Results from a Survey of 916 AOSpine International Members (World Neurosurgery) Chapter 6: Derived from Tetreault L, Nouri A, Côté P, Fehlings MG. The Minimal Clinically Important Difference of the modified Japanese Orthopaedic Association Scale in Patients with Degenerative Cervical Myelopathy undergoing Surgical Intervention (Spine) Chapter 7: Derived from Tetreault L, Kopjar B, Vaccaro A, Yoon ST, Arnold PM, Massicotte EM, Fehlings MG. A clinical prediction model to determine outcomes in patients with cervical spondylotic myelopathy undergoing surgical treatment: Data from the prospective, multicenter AOSpine North America study (Journal of Bone and Joint Surgery) Chapter 8: Derived from Tetreault L, Côté P, Kopjar B, Arnold P, Fehlings MG. A Clinical Prediction Model to Assess Surgical Outcome in Patients with Cervical Spondylotic Myelopathy: Internal and External Validation using the Prospective Multlicenter AOSpine North American and International Datasets (The Spine Journal) Chapter 9: Derived from Tetreault L, Nouri A, Côté P, Zamorano JJ, Dalzell K, Fehlings MG. Does Magnetic Resonance Imaging Improve the Predictive Performance of a Validated Clinical Prediction Rule Used to Evaluate Surgical Outcome in Patients with Cervical Spondylotic Myelopathy (Spine) Chapter 10: Derived from Tetreault L, Kopjar B, Côté P, Arnold P, Fehlings MG. A Clinical Prediction Rule for Functional Outcomes in Patients Undergoing Surgery for Degenerative Cervical Myelopathy: Analysis of the International AOSpine Prospective Multicentre Dataset of 757 Subjects (Journal of Bone and Joint Surgery) Chapter 11: Derived from Tetreault L, Tan G, Kopjar B, Côté P, Arnold P, Nugaeva N, Fehlings MG. Clinical and Surgical Predictors of Complications following Surgery for the Treatment of Cervical Spondylotic Myelopathy: Results from the Multicenter, Prospective AOSpine International study on 479 Patients (Under Review – Neurosurgery)

275
Chapter 12: Derived from Tetreault L, Le D, Cote P, Fehlings MG. The Importance of Clinical Prediction Rules and External Validation: A commentary using an example in surgical patients with cervical spondylotic myelopathy (Evidence Based Spine Journal)
276
References 1. Kalsi-Ryan S, Karadimas SK, Fehlings MG. Cervical Spondylotic Myelopathy: The Clinical Phenomenon and the Current Pathobiology of an Increasingly Prevalent and Devastating Disorder. Neuroscientist 2012. 2. Tracy JA, Bartleson BJ. Cervical spondylotic myelopathy. Neurologist 2010; 16(3): 176-87. 3. Fehlings MG, Tetreault LA, Wilson JR, Skelly AC. Cervical spondylotic myelopathy: current state of the art and future directions. Spine (Phila Pa 1976) 2013; 38(22 Suppl 1): S1-8. 4. Fehlings MG, Wilson JR, Kopjar B, et al. Efficacy and Safety of Surgical Decompression in Patients with Cervical Spondylotic Myelopathy: Results of the AOSpine North America Prospective Multi-Center Study. J Bone Joint Surg Am 2013; 95(18): 1651-8. 5. Cheung WY, Arvinte D, Wong YW, Luk KD, Cheung KM. Neurological recovery after surgical decompression in patients with cervical spondylotic myelopathy - a prospective study. Int Orthop 2008; 32(2): 273-8. 6. Gok B, Sciubba DM, McLoughlin GS, et al. Surgical treatment of cervical spondylotic myelopathy with anterior compression: a review of 67 cases. J Neurosurg Spine 2008; 9(2): 152-7. 7. Latimer M, Haden N, Seeley HM, Laing RJ. Measurement of outcome in patients with cervical spondylotic myelopathy treated surgically. British journal of neurosurgery 2002; 16(6): 545-9. 8. Al-Tamimi YZ, Guilfoyle M, Seeley H, Laing RJ. Measurement of long-term outcome in patients with cervical spondylotic myelopathy treated surgically. Eur Spine J 2013; 22(11): 2552-7. 9. Ebersold MJ, Pare MC, Quast LM. Surgical treatment for cervical spondylitic myelopathy. J Neurosurg 1995; 82(5): 745-51. 10. Casha S, Engelbrecht HA, DuPlessis SJ, Hurlbert RJ. Suspended laminoplasty for wide posterior cervical decompression and intradural access: results, advantages, and complications. J Neurosurg Spine 2004; 1(1): 80-6. 11. Edwards CC, 2nd, Heller JG, Murakami H. Corpectomy versus laminoplasty for multilevel cervical myelopathy: an independent matched-cohort analysis. Spine 2002; 27(11): 1168-75. 12. Singh A, Tetreault L, Kalsi-Ryan S, Nouri A, Fehlings MG. Global prevalence and incidence of traumatic spinal cord injury. Clin Epidemiol 2014; 6: 309-31. 13. Baptiste DC, Fehlings MG. Pathophysiology of cervical myelopathy. Spine J 2006; 6(6 Suppl): 190S-7S. 14. Snell R. Clinical Anatomy by Systems: Lippincott Williams & Wilkins; 2007. 15. Tracy J, Bartleson J. Cervical spondylotic myelopathy. The neurologist 2010; 16(3): 176-87. 16. Kalsi-Ryan S, Karadimas S, Fehlings M. Cervical spondylotic myelopathy: the clinical phenomenon and the current pathobiology of an increasingly prevalent and devastating disorder. The Neuroscientist : a review journal bringing neurobiology, neurology and psychiatry 2013; 19(4): 409-21. 17. Galbusera F, van Rijsbergen M, Ito K, Huyghe JM, Brayda-Bruno M, Wilke HJ. Ageing and degenerative changes of the intervertebral disc and their impact on spinal flexibility. Eur Spine J 2014. 18. Inamasu J, Guiot BH, Sachs DC. Ossification of the posterior longitudinal ligament: An update on its biology, epidemiology, and natural history. Neurosurgery 2006; 58(6): 1027-38. 19. Karadimas S, Erwin W, Ely C, Dettori J, Fehlings M. Pathophysiology and natural history of cervical spondylotic myelopathy. Spine 2013; 38(22 Suppl 1): 36. 20. Karadimas SK, Gatzounis G, Fehlings MG. Pathobiology of cervical spondylotic myelopathy. European spine journal : official publication of the European Spine Society, the European Spinal Deformity Society, and the European Section of the Cervical Spine Research Society 2014. 21. Karadimas S, Moon E, Yu W-R, et al. A novel experimental model of cervical spondylotic myelopathy (CSM) to facilitate translational research. Neurobiology of disease 2013; 54: 43-58.

277
22. Karadimas S, Gialeli C, Klironomos G, et al. The role of oligodendrocytes in the molecular pathobiology and potential molecular treatment of cervical spondylotic myelopathy. Current medicinal chemistry 2010; 17(11): 1048-58. 23. Yu W, Liu T, Kiehl T-R, Fehlings M. Human neuropathological and animal model evidence supporting a role for Fas-mediated apoptosis and inflammation in cervical spondylotic myelopathy. Brain : a journal of neurology 2011; 134(Pt 5): 1277-92. 24. Moon E, Karadimas S, Yu W-R, Austin J, Fehlings M. Riluzole attenuates neuropathic pain and enhances functional recovery in a rodent model of cervical spondylotic myelopathy. Neurobiology of disease 2014; 62: 394-406. 25. Ernst CW, Stadnik TW, Peeters E, Breucq C, Osteaux MJC. Prevalence of annular tears and disc herniations on MR images of the cervical spine in symptom free volunteers. European Journal of Radiology 2005; 55(3): 409-14. 26. Nakashima H, Yukawa Y, Suda K, Yamagata M, Ueta T, Kato F. Abnormal Findings on Magnetic Resonance Images of the Cervical Spines in 1,211 Asymptomatic Subjects. Spine (Phila Pa 1976) 2015. 27. Matsumoto M, Fujimura Y, Suzuki N, et al. MRI of cervical intervertebral discs in asymptomatic subjects. The Journal of bone and joint surgery British volume 1998; 80(1): 19-24. 28. Kato F, Yukawa Y, Suda K, Yamagata M, Ueta T. Normal morphology, age-related changes and abnormal findings of the cervical spine. Part II: Magnetic resonance imaging of over 1,200 asymptomatic subjects. Eur Spine J 2012; 21(8): 1499-507. 29. Wilson JR, Barry S, Fischer DJ, et al. Frequency, timing, and predictors of neurological dysfunction in the nonmyelopathic patient with cervical spinal cord compression, canal stenosis, and/or ossification of the posterior longitudinal ligament. Spine (Phila Pa 1976) 2013; 38(22 Suppl 1): S37-54. 30. New P, Cripps R, Bonne Lee B. Global maps of non-traumatic spinal cord injury epidemiology: towards a living data repository. Spinal Cord 2014; 52(2): 97-109. 31. Nouri A, Tetreault L, Singh A, Karadimas S, Fehlings M. Degenerative Cervical Myelopathy: Epidemiology, Genetics and Pathogenesis Spine 2015. 32. Harrop JS, Naroji S, Maltenfort M, et al. Cervical myelopathy: A clinical and radiographic evaluation and correlation to cervical spondylotic myelopathy. Spine 2010; 35(6): 620-4. 33. Nagata K, Kiyonaga K, Ohashi T, Sagara M, Miyazaki S, Inoue A. Clinical value of magnetic resonance imaging for cervical myelopathy. Spine 1990; 15(11): 1088-96. 34. Sun Q, Hu H, Zhang Y, et al. Do intramedullary spinal cord changes in signal intensity on MRI affect surgical opportunity and approach for cervical myelopathy due to ossification of the posterior longitudinal ligament? Eur Spine J 2011; 20(9): 1466-73. 35. Houser OW, Onofrio BM, Miller GM, Folger WN, Smith PL. Cervical spondylotic stenosis and myelopathy: evaluation with computed tomographic myelography. Mayo Clin Proc 1994; 69(6): 557-63. 36. Aminoff M. Electrodiagnosis in clinical neurology. Philadelphia: Elsevier Churchill-Livingstone; 2005. 37. Kimura J. Electrodiagnosis in diseases of nerve and muscle: Principles and practice. New York: Oxford University Press; 2001. 38. Clark CR, Benzel EC, Currier BL, et al. The Cervical Spine. Philadelphia, PA: Lippincott Williams & Wilkins; 2005. 39. Longo D, Fauci A, Kasper D, et al. Harrison's Principles of Internal Medicine. New York, NY: McGraw-Hill; 2011. 40. Pasinetti GM, Ungar LH, Lange DJ, et al. Identification of potential CSF biomarkers in ALS. Neurology 2006; 66(8): 1218-22. 41. Ranganathan S, Williams E, Ganchev P, et al. Proteomic profiling of cerebrospinal fluid identifies biomarkers for amyotrophic lateral sclerosis. J Neurochem 2005; 95(5): 1461-71.
278
42. Brettschneider J, Widl K, Schattauer D, Ludolph AC, Tumani H. Cerebrospinal fluid erythropoietin (EPO) in amyotrophic lateral sclerosis. Neurosci Lett 2007; 416(3): 257-60. 43. Tsuboi Y, Kakimoto K, Akatsu H, Daikuhara Y, Yamada T. Hepatocyte growth factor in cerebrospinal fluid in neurologic disease. Acta Neurol Scand 2002; 106(2): 99-103. 44. Wilms H, Sievers J, Dengler R, Bufler J, Deuschl G, Lucius R. Intrathecal synthesis of monocyte chemoattractant protein-1 (MCP-1) in amyotrophic lateral sclerosis: further evidence for microglial activation in neurodegeneration. J Neuroimmunol 2003; 144(1-2): 139-42. 45. Norgren N, Rosengren L, Stigbrand T. Elevated neurofilament levels in neurological diseases. Brain Res 2003; 987(1): 25-31. 46. Epstein NE, Epstein JA, Carras R. Coexisting cervical spondylotic myelopathy and bilateral carpal tunnel syndromes. J Spinal Disord 1989; 2(1): 36-42. 47. Witt JC, Stevens JC. Neurologic disorders masquerading as carpal tunnel syndrome: 12 cases of failed carpal tunnel release. Mayo Clin Proc 2000; 75(4): 409-13. 48. Kim HJ, Tetreault LA, Massicotte EM, et al. Differential diagnosis for cervical spondylotic myelopathy: literature review. Spine (Phila Pa 1976) 2013; 38(22 Suppl 1): S78-88. 49. Yue WM, Tan SB, Tan MH, Koh DC, Tan CT. The Torg--Pavlov ratio in cervical spondylotic myelopathy: a comparative study between patients with cervical spondylotic myelopathy and a nonspondylotic, nonmyelopathic population. Spine 2001; 26(16): 1760-4. 50. Takamiya Y, Nagata K, Fukuda K, Shibata A, Ishitake T, Suenaga T. Cervical spine disorders in farm workers requiring neck extension actions. J Orthop Sci 2006; 11(3): 235-40. 51. Chen IH, Liao KK, Shen WY. Measurement of cervical canal sagittal diameter in Chinese males with cervical spondylotic myelopathy. Zhonghua yi xue za zhi = Chinese medical journal; Free China ed 1994; 54(2): 105-10. 52. Bednarik J, Kadanka Z, Dusek L, et al. Presymptomatic spondylotic cervical myelopathy: an updated predictive model. Eur Spine J 2008; 17(3): 421-31. 53. Shimomura T, Sumi M, Nishida K, et al. Prognostic factors for deterioration of patients with cervical spondylotic myelopathy after nonsurgical treatment. Spine 2007; 32(22): 2474-9. 54. Barnes MP, Saunders M. The effect of cervical mobility on the natural history of cervical spondylotic myelopathy. J Neurol Neurosurg Psychiatry 1984; 47(1): 17-20. 55. Hukuda S, Xiang LF, Imai S, Katsuura A, Imanaka T. Large vertebral body, in addition to narrow spinal canal, are risk factors for cervical myelopathy. J Spinal Disord 1996; 9(3): 177-86. 56. Okada Y, Ikata T, Katoh S, Yamada H. Morphologic analysis of the cervical spinal cord, dural tube, and spinal canal by magnetic resonance imaging in normal adults and patients with cervical spondylotic myelopathy. Spine (Phila Pa 1976) 1994; 19(20): 2331-5. 57. Golash A, Birchall D, Laitt RD, Jackson A. Significance of CSF area measurements in cervical spondylitic myelopathy. Br J Neurosurg 2001; 15(1): 17-21. 58. Oshima Y, Seichi A, Takeshita K, et al. Natural course and prognostic factors in patients with mild cervical spondylotic myelopathy with increased signal intensity on T2-weighted magnetic resonance imaging. Spine (Phila Pa 1976) 2012; 37(22): 1909-13. 59. Yoshimatsu H, Nagata K, Goto H, et al. Conservative treatment for cervical spondylotic myelopathy. prediction of treatment effects by multivariate analysis. Spine J 2001; 1(4): 269-73. 60. Wilson JR, Patel AA, Brodt ED, Dettori JR, Brodke DS, Fehlings MG. The Genetics and Heritability of Cervical Spondylotic Myelopathy and Ossification of the Posterior Longitudinal Ligament: Results of a Systematic Review. Spine (Phila Pa 1976) 2013. 61. Patel AA, Spiker WR, Daubs M, Brodke DS, Cannon-Albright LA. Evidence of an inherited predisposition for cervical spondylotic myelopathy. Spine 2012; 37(1): 26-9. 62. Tanikawa E, Furuya K, Nakajima H. Genetic study on ossification of posterior longitudinal ligament. The Bulletin of Tokyo Medical and Dental University 1986; 33(3): 117-28.

279
63. Terayama K. Genetic studies on ossification of the posterior longitudinal ligament of the spine. Spine (Phila Pa 1976) 1989; 14(11): 1184-91. 64. Holly LT, Matz PG, Anderson PA, et al. Functional outcomes assessment for cervical degenerative disease. J Neurosurg Spine 2009; 11(2): 238-44. 65. Laing RJ. Measuring outcome in neurosurgery. Br J Neurosurg 2000; 14(3): 181-4. 66. Singh A, Gnanalingham KK, Casey AT, Crockard A. Use of quantitative assessment scales in cervical spondylotic myelopathy - Survey of clinician's attitudes. Acta Neurochir (Wien) 2005; 147(12): 1235-8. 67. Singh A, Tetreault L, Casey A, Laing R, Statham P, Fehlings MG. A summary of assessment tools for patients suffering from cervical spondylotic myelopathy: a systematic review on validity, reliability and responsiveness. Eur Spine J 2013. 68. Benzel EC, Lancon J, Kesterson L, Hadden T. Cervical laminectomy and dentate ligament section for cervical spondylotic myelopathy. J Spinal Disord 1991; 4(3): 286-95. 69. Kopjar B, Tetreault L, Kalsi-Ryan S, Fehlings M. Psychometric properties of the modified Japanese orthopaedic association scale in patients with cervical spondylotic myelopathy. Spine (Phila Pa 1976) 2015; 40(1): E23-8. 70. Nurick S. The pathogenesis of the spinal cord disorder associated with cervical spondylosis. Brain 1972; 95(1): 87-100. 71. Kalsi-Ryan S, Singh A, Massicotte EM, et al. Ancillary outcome measures for assessment of individuals with cervical spondylotic myelopathy. Spine 2013; 38(22 Suppl 1): 22. 72. Singh A, Crockard HA. Quantitative assessment of cervical spondylotic myelopathy by a simple walking test. Lancet 1999; 354(9176): 370-3. 73. Singh A, Crockard HA. Comparison of seven different scales used to quantify severity of cervical spondylotic myelopathy and post-operative improvement. J Outcome Meas 2001; 5(1): 798-818. 74. Pietrobon R, Coeytaux RR, Carey TS, Richardson WJ, DeVellis RF. Standard scales for measurement of functional outcome for cervical pain or dysfunction: a systematic review. Spine (Phila Pa 1976) 2002; 27(5): 515-22. 75. Cleland JA, Fritz JM, Whitman JM, Palmer JA. The reliability and construct validity of the Neck Disability Index and patient specific functional scale in patients with cervical radiculopathy. Spine (Phila Pa 1976) 2006; 31(5): 598-602. 76. Hurwitz EL, Morgenstern H, Vassilaki M, Chiang LM. Adverse reactions to chiropractic treatment and their effects on satisfaction and clinical outcomes among patients enrolled in the UCLA Neck Pain Study. J Manipulative Physiol Ther 2004; 27(1): 16-25. 77. MacDermid JC, Walton DM, Avery S, et al. Measurement properties of the neck disability index: a systematic review. J Orthop Sports Phys Ther 2009; 39(5): 400-17. 78. Nederhand MJ, Ijzerman MJ, Hermens HJ, Turk DC, Zilvold G. Predictive value of fear avoidance in developing chronic neck pain disability: consequences for clinical decision making. Arch Phys Med Rehabil 2004; 85(3): 496-501. 79. Riddle DL, Stratford PW. Use of generic versus region-specific functional status measures on patients with cervical spine disorders. Phys Ther 1998; 78(9): 951-63. 80. Vernon H, Mior S. The Neck Disability Index: a study of reliability and validity. J Manipulative Physiol Ther 1991; 14(7): 409-15. 81. Young IA, Cleland JA, Michener LA, Brown C. Reliability, construct validity, and responsiveness of the neck disability index, patient-specific functional scale, and numeric pain rating scale in patients with cervical radiculopathy. Am J Phys Med Rehabil 2010; 89(10): 831-9. 82. Bolton JE. Sensitivity and specificity of outcome measures in patients with neck pain: detecting clinically significant improvement. Spine (Phila Pa 1976) 2004; 29(21): 2410-7; discussion 8.
280
83. Kopjar B. The SF-36 health survey: a valid measure of changes in health status after injury. Inj Prev 1996; 2(2): 135-9. 84. Brazier JE, Harper R, Jones NM, et al. Validating the SF-36 health survey questionnaire: new outcome measure for primary care. BMJ 1992; 305(6846): 160-4. 85. Bland JM, Altman DG. Statistical methods for assessing agreement between two methods of clinical measurement. Lancet 1986; 1(8476): 307-10. 86. Baron R, Elashaal A, Germon T, Hobart J. Measuring outcomes in cervical spine surgery: Think twice before using the SF-36. Spine 2006; 31(22): 2575-84. 87. Guilfoyle MR, Seeley H, Laing RJ. The Short Form 36 health survey in spine disease - Validation against condition-specific measures. Br J Neurosurg 2009; 23(4): 401-5. 88. King JT, Jr., Roberts MS. Validity and reliability of the Short Form-36 in cervical spondylotic myelopathy. J Neurosurg 2002; 97(2 Suppl): 180-5. 89. King JT, Jr., Tsevat J, Moossy JJ, Roberts MS. Preference-based quality of life measurement in patients with cervical spondylotic myelopathy. Spine 2004; 29(11): 1271-80. 90. King JT, Jr., McGinnis KA, Roberts MS. Quality of life assessment with the medical outcomes study short form-36 among patients with cervical spondylotic myelopathy. Neurosurgery 2003; 52(1): 113-20; discussion 21. 91. Latimer M, Haden N, Seeley HM, Laing RJ. Measurement of outcome in patients with cervical spondylotic myelopathy treated surgically. Br J Neurosurg 2002; 16(6): 545-9. 92. Thakar S, Christopher S, Rajshekhar V. Quality of life assessment after central corpectomy for cervical spondylotic myelopathy: comparative evaluation of the 36-Item Short Form Health Survey and the World Health Organization Quality of Life-Bref. J Neurosurg Spine 2009; 11(4): 402-12. 93. Nakashima H, Yukawa Y, Ito K, et al. Validity of the 10-s step test: prospective study comparing it with the 10-s grip and release test and the 30-m walking test. Eur Spine J 2011; 20(8): 1318-22. 94. Revanappa KK, Rajshekhar V. Comparison of Nurick grading system and modified Japanese Orthopaedic Association scoring system in evaluation of patients with cervical spondylotic myelopathy. Eur Spine J 2011; 20(9): 1545-51. 95. Rajshekhar V, Muliyil J. Patient perceived outcome after central corpectomy for cervical spondylotic myelopathy. Surg Neurol 2007; 68(2): 185-90; discussion 90-1. 96. Vitzthum HE, Dalitz K. Analysis of five specific scores for cervical spondylogenic myelopathy. Eur Spine J 2007; 16(12): 2096-103. 97. King JT, Jr., Moossy JJ, Tsevat J, Roberts MS. Multimodal assessment after surgery for cervical spondylotic myelopathy. J Neurosurg Spine 2005; 2(5): 526-34. 98. Yonenobu K, Abumi K, Nagata K, Taketomi E, Ueyama K. Interobserver and intraobserver reliability of the japanese orthopaedic association scoring system for evaluation of cervical compression myelopathy. Spine 2001; 26(17): 1890-4; discussion 5. 99. Deyo RA, Diehr P, Patrick DL. Reproducibility and responsiveness of health status measures. Statistics and strategies for evaluation. Control Clin Trials 1991; 12(4 Suppl): 142S-58S. 100. Karadimas SK, Erwin WM, Ely CG, Dettori JR, Fehlings MG. Pathophysiology and natural history of cervical spondylotic myelopathy. Spine (Phila Pa 1976) 2013; 38(22 Suppl 1): S21-36. 101. Rhee JM, Shamji MF, Erwin WM, et al. Nonoperative management of cervical myelopathy: a systematic review. Spine (Phila Pa 1976) 2013; 38(22 Suppl 1): S55-67. 102. Kadanka Z, Bednarik J, Novotny O, Urbanek I, Dusek L. Cervical spondylotic myelopathy: conservative versus surgical treatment after 10 years. Eur Spine J 2011; 20(9): 1533-8. 103. Kadanka Z, Mares M, Bednanik J, et al. Approaches to spondylotic cervical myelopathy: conservative versus surgical results in a 3-year follow-up study. Spine 2002; 27(20): 2205-10; discussion 10-1.

281
104. Sampath P, Bendebba M, Davis JD, Ducker TB. Outcome of patients treated for cervical myelopathy: A prospective, multicenter study with independent clinical review. Spine 2000; 25(6): 670-6. 105. Lad SP, Patil CG, Berta S, Santarelli JG, Ho C, Boakye M. National trends in spinal fusion for cervical spondylotic myelopathy. Surg Neurol 2009; 71(1): 66-9. 106. Lawrence BD, Shamji MF, Traynelis VC, et al. Surgical management of degenerative cervical myelopathy: a consensus statement. Spine (Phila Pa 1976) 2013; 38(22 Suppl 1): S171-2. 107. Fehlings MG, Barry S, Kopjar B, et al. Anterior versus posterior surgical approaches to treat cervical spondylotic myelopathy: outcomes of the prospective multicenter AOSpine North America CSM study in 264 patients. Spine (Phila Pa 1976) 2013; 38(26): 2247-52. 108. Haynes RB, Sackett, D.L., Guyatt, G.H., Tugwell, P. Clinical Epidemiology: How to Do Clinical Practice Research. 3 ed: Lippincott WIlliams & Wilkins. 109. Knaus WA, Draper EA, Wagner DP, Zimmerman JE. APACHE II: a severity of disease classification system. Crit Care Med 1985; 13(10): 818-29. 110. Kamath PS, Kim WR. The model for end-stage liver disease (MELD). Hepatology 2007; 45(3): 797-805. 111. van Middendorp JJ, Hosman AJ, Donders AR, et al. A clinical prediction rule for ambulation outcomes after traumatic spinal cord injury: a longitudinal cohort study. Lancet 2011; 377(9770): 1004-10. 112. Wilson JR, Grossman RG, Frankowski RF, et al. A clinical prediction model for long-term functional outcome after traumatic spinal cord injury based on acute clinical and imaging factors. J Neurotrauma 2012; 29(13): 2263-71. 113. Wilson JR, Arnold PM, Singh A, Kalsi-Ryan S, Fehlings MG. Clinical prediction model for acute inpatient complications after traumatic cervical spinal cord injury: a subanalysis from the Surgical Timing in Acute Spinal Cord Injury Study. J Neurosurg Spine 2012; 17(1 Suppl): 46-51. 114. Davidson D, Noonan VK, Dvorak MF, Zhang H, Fisher CG. The impact of patient expectations on outcome following treatment for spinal trauma: Part 1: What are spine surgeons telling their patients? Spine (Phila Pa 1976) 2010; 35(19): 1807-11. 115. Fehlings MG, Smith JS, Kopjar B, et al. Perioperative and delayed complications associated with the surgical treatment of cervical spondylotic myelopathy based on 302 patients from the AOSpine North America Cervical Spondylotic Myelopathy Study. J Neurosurg Spine 2012; 16(5): 425-32. 116. Holly LT, Matz PG, Anderson PA, et al. Clinical prognostic indicators of surgical outcome in cervical spondylotic myelopathy. J Neurosurg Spine 2009; 11(2): 112-8. 117. Karpova A, Arun R, Cadotte DW, et al. Assessment of spinal cord compression by magnetic resonance imaging - Can it predict surgical outcomes in degenerative compressive myelopathy? A systematic review. Spine 2013; 38(16): 1409-21. 118. Wright JG, Swiontkowski MF, Heckman JD. Introducing levels of evidence to the journal. J Bone Joint Surg Am 2003; 85-A(1): 1-3. 119. Atkins D, Best D, Briss PA, et al. Grading quality of evidence and strength of recommendations. BMJ 2004; 328(7454): 1490. 120. West S, King V, Carey TS, et.al. Systems to Rate the Strength of Scientific Evidence. Evidence Report/Technology Assessment No. 47 (Prepared by the Research Triangle Institute-University of North Carolina Evidence-based Practice Center, Contract No. 290-97-0011). Agency for Healthcare Research and Quality, Rockville, MD; 2002. 121. Hirabayashi K, Miyakawa J, Satomi K, Maruyama T, Wakano K. Operative results and postoperative progression of ossification among patients with ossification of cervical posterior longitudinal ligament. Spine 1981; 6(4): 354-64.

282
122. Yamazaki T, Yanaka K, Sato H, Uemura K, Tsukada A, Nose T. Cervical spondylotic myelopathy: surgical results and factors affecting outcome with special reference to age differences. Neurosurgery 2003; 52(1): 122-6; discussion 6. 123. Naruse T, Yanase M, Takahashi H, et al. Prediction of clinical results of laminoplasty for cervical myelopathy focusing on spinal cord motion in intraoperative ultrasonography and postoperative magnetic resonance imaging. Spine 2009; 34(24): 2634-41. 124. Kim HJ, Moon SH, Kim HS, et al. Diabetes and smoking as prognostic factors after cervical laminoplasty. Journal of Bone and Joint Surgery - Series B 2008; 90(11): 1468-72. 125. Chen CJ, Lyu RK, Lee ST, Wong YC, Wang LJ. Intramedullary high signal intensity on T2-weighted MR images in cervical spondylotic myelopathy: prediction of prognosis with type of intensity. Radiology 2001; 221(3): 789-94. 126. Fujimura Y, Nishi Y, Chiba K, Nakamura M, Hirabayashi K. Multiple regression analysis of the factors influencing the results of expansive open-door laminoplasty for cervical myelopathy due to ossification of the posterior longitudinal ligament. Arch Orthop Trauma Surg 1998; 117(8): 471-4. 127. Kato Y, Iwasaki M, Fuji T, Yonenobu K, Ochi T. Long-term follow-up results of laminectomy for cervical myelopathy caused by ossification of the posterior longitudinal ligament. J Neurosurg 1998; 89(2): 217-23. 128. Koyanagi T, Hirabayashi K, Satomi K, Toyama Y, Fujimura Y. Predictability of operative results of cervical compression myelopathy based on preoperative computed tomographic myelography. Spine 1993; 18(14): 1958-63. 129. Morio Y, Teshima R, Nagashima H, Nawata K, Yamasaki D, Nanjo Y. Correlation between operative outcomes of cervical compression myelopathy and mri of the spinal cord. Spine 2001; 26(11): 1238-45. 130. Zhang YZ, Shen Y, Wang LF, Ding WY, Xu JX, He J. Magnetic resonance T2 image signal intensity ratio and clinical manifestation predict prognosis after surgical intervention for cervical spondylotic myelopathy. Spine 2010; 35(10): E396-E9. 131. Zhang P, Shen Y, Zhang YZ, Ding WY, Wang LF. Significance of increased signal intensity on MRI in prognosis after surgical intervention for cervical spondylotic myelopathy. J Clin Neurosci 2011; 18(8): 1080-3. 132. Okada Y, Ikata T, Yamada H, Sakamoto R, Katoh S. Magnetic resonance imaging study on the results of surgery for cervical compression myelopathy. Spine 1993; 18(14): 2024-9. 133. Shin JJ, Jin BH, Kim KS, Cho YE, Cho WH. Intramedullary high signal intensity and neurological status as prognostic factors in cervical spondylotic myelopathy. Acta Neurochir (Wien) 2010; 152(10): 1687-94. 134. Wada E, Yonenobu K, Suzuki S, Kanazawa A, Ochi T. Can intramedullary signal change on magnetic resonance imaging predict surgical outcome in cervical spondylotic myelopathy? Spine 1999; 24(5): 455-61; discussion 62. 135. Iwasaki M, Okuda S, Miyauchi A, et al. Surgical strategy for cervical myelopathy due to ossification of the posterior longitudinal ligament: Part 1: Clinical results and limitations of laminoplasty. Spine 2007; 32(6): 647-53. 136. Chibbaro S, Benvenuti L, Carnesecchi S, et al. Anterior cervical corpectomy for cervical spondylotic myelopathy: experience and surgical results in a series of 70 consecutive patients. J Clin Neurosci 2006; 13(2): 233-8. 137. Iwasaki M, Kawaguchi Y, Kimura T, Yonenobu K. Long-term results of expansive laminoplasty for ossification of the posterior longitudinal ligament of the cervical spine: more than 10 years follow up. J Neurosurg 2002; 96(2 Suppl): 180-9. 138. Tanaka J, Seki N, Tokimura F, Doi K, Inoue S. Operative results of canal-expansive laminoplasty for cervical spondylotic myelopathy in elderly patients. Spine 1999; 24(22): 2308-12.

283
139. Uchida K, Nakajima H, Sato R, et al. Multivariate analysis of the neurological outcome of surgery for cervical compressive myelopathy. J Orthop Sci 2005; 10(6): 564-73. 140. Furlan JC, Kalsi-Ryan S, Kailaya-Vasan A, Massicotte EM, Fehlings MG. Functional and clinical outcomes following surgical treatment in patients with cervical spondylotic myelopathy: a prospective study of 81 cases. Journal of Neurosurgery Spine 2011; 14(3): 348-55. 141. Choi S, Lee SH, Lee JY, et al. Factors affecting prognosis of patients who underwent corpectomy and fusion for treatment of cervical ossification of the posterior longitudinal ligament: Analysis of 47 patients. Journal of Spinal Disorders and Techniques 2005; 18(4): 309-14. 142. Rajshekhar V, Kumar CSS. Functional outcome after central corpectomy in poor-grade patients with cervical spondylotic myelopathy or ossified posterior longitudinal ligament. Neurosurgery 2005; 56(6): 1279-84. 143. Suri A, Chabbra RPS, Mehta VS, Gaikwad S, Pandey RM. Effect of intramedullary signal changes on the surgical outcome of patients with cervical spondylotic myelopathy. Spine J 2003; 3(1): 33-45. 144. Chiles BW, 3rd, Leonard MA, Choudhri HF, Cooper PR. Cervical spondylotic myelopathy: patterns of neurological deficit and recovery after anterior cervical decompression. Neurosurgery 1999; 44(4): 762-9; discussion 9-70. 145. Park YS, Nakase H, Kawaguchi S, Sakaki T, Nikaido Y, Morimoto T. Predictors of outcome of surgery for cervical compressive myelopathy: Retrospective analysis and prospective study. Neurol Med Chir (Tokyo) 2006; 46(5): 231-8. 146. Singh A, Crockard HA, Platts A, Stevens J. Clinical and radiological correlates of severity and surgery-related outcome in cervical spondylosis. J Neurosurg 2001; 94(2 Suppl): 189-98. 147. Heidecke V, Rainov NG, Marx T, Burkert W. Outcome in Cloward anterior fusion for degenerative cervical spinal disease. Acta Neurochir (Wien) 2000; 142(3): 283-91. 148. Arnold H, Feldmann U, Missler U. Chronic spondylogenic cervical myelopathy. A critical evaluation of surgical treatment after early and long-term follow-up. Neurosurg Rev 1993; 16(2): 105-9. 149. Bertalanffy H, Eggert HR. Clinical long-term results of anterior discectomy without fusion for treatment of cervical radiculopathy and myelopathy. A follow-up of 164 cases. Acta Neurochir (Wien) 1988; 90(3-4): 127-35. 150. Chagas H, Domingues F, Aversa A, Fonseca ALV, De Souza JM. Cervical spondylotic myelopathy: 10 Years of prospective outcome analysis of anterior decompression and fusion. Surg Neurol 2005; 64(SUPPL. 1): S30-S5. 151. Cheng SC, Yen CH, Kwok TK, Wong WC, Mak KH. Anterior spinal fusion versus laminoplasty for cervical spondylotic myelopathy: a retrospective review. J 2009; 17(3): 265-8. 152. Holly LT, Moftakhar P, Khoo LT, Shamie AN, Wang JC. Surgical outcomes of elderly patients with cervical spondylotic myelopathy. Surg Neurol 2008; 69(3): 233-40. 153. Lyu RK, Tang LM, Chen CJ, Chen CM, Chang HS, Wu YR. The use of evoked potentials for clinical correlation and surgical outcome in cervical spondylotic myelopathy with intramedullary high signal intensity on MRI. J Neurol Neurosurg Psychiatry 2004; 75(2): 256-61. 154. Masaki Y, Yamazaki M, Okawa A, et al. An analysis of factors causing poor surgical outcome in patients with cervical myelopathy due to ossification of the posterior longitudinal ligament: anterior decompression with spinal fusion versus laminoplasty. J Spinal Disord Tech 2007; 20(1): 7-13. 155. Matsuda Y, Shibata T, Oki S, Kawatani Y, Mashima N, Oishi H. Outcomes of surgical treatment for cervical myelopathy in patients more than 75 years of age. Spine 1999; 24(6): 529-34. 156. Naderi S, Ozgen S, Pamir MN, Ozek MM, Erzen C. Cervical spondylotic myelopathy: surgical results and factors affecting prognosis. Neurosurgery 1998; 43(1): 43-9; discussion 9-50. 157. Nagata K, Ohashi T, Abe J, Morita M, Inoue A. Cervical myelopathy in elderly patients: clinical results and MRI findings before and after decompression surgery. Spinal Cord 1996; 34(4): 220-6.
284
158. Satomi K, Ogawa J, Ishii Y, Hirabayashi K. Short-term complications and long-term results of expansive open-door laminoplasty for cervical stenotic myelopathy. Spine J 2001; 1(1): 26-30. 159. Sinha S, Jagetia A. Bilateral open-door expansive laminoplasty using unilateral posterior midline approach with preservation of posterior supporting elements for management of cervical myelopathy and radiculomyelopathy - Analysis of clinical and radiological outcome and surgical technique. Acta Neurochir (Wien) 2011; 153(5): 975-84. 160. Ahn JS, Lee JK, Kim BK. Prognostic factors that affect the surgical outcome of the laminoplasty in cervical spondylotic myelopathy. Clin 2010; 2(2): 98-104. 161. Arnasson O, Carlsson CA, Pellettieri L. Surgical and conservative treatment of cervical spondylotic radiculopathy and myelopathy. Acta Neurochir (Wien) 1987; 84(1-2): 48-53. 162. Bishara SN. The posterior operation in treatment of cervical spondylosis with myelopathy: a long-term follow-up study. J Neurol Neurosurg Psychiatry 1971; 34(4): 393-8. 163. Chen Y, Guo Y, Chen D, Wang X, Lu X, Yuan W. Long-term outcome of laminectomy and instrumented fusion for cervical ossification of the posterior longitudinal ligament. Int Orthop 2009; 33(4): 1075-80. 164. Fessler RG, Steck JC, Giovanini MA. Anterior cervical corpectomy for cervical spondylotic myelopathy. Neurosurgery 1998; 43(2): 257-65; discussion 65-7. 165. Gok B, McLoughlin GS, Sciubba DM, et al. Surgical management of cervical spondylotic myelopathy with laminectomy and instrumented fusion. Neurol Res 2009; 31(10): 1097-101. 166. Gregorius FK, Estrin T, Crandall PH. Cervical spondylotic radiculopathy and myelopathy. A long-term follow-up study. Arch Neurol 1976; 33(9): 618-25. 167. Hamanishi C, Tanaka S. Bilateral multilevel laminectomy with or without posterolateral fusion for cervical spondylotic myelopathy: relationship to type of onset and time until operation. J Neurosurg 1996; 85(3): 447-51. 168. Hamburger C, Buttner A, Uhl E. The cross-sectional area of the cervical spinal canal in patients with cervical spondylotic myelopathy. Correlation of preoperative and postoperative area with clinical symptoms. Spine 1997; 22(17): 1990-4; discussion 5. 169. Handa Y, Kubota T, Ishii H, Sato K, Tsuchida A, Arai Y. Evaluation of prognostic factors and clinical outcome in elderly patients in whom expansive laminoplasty is performed for cervical myelopathy due to multisegmental spondylotic canal stenosis. A retrospective comparison with younger patients. J Neurosurg 2002; 96(2 Suppl): 173-9. 170. Hasegawa K, Homma T, Chiba Y, Hirano T, Watanabe K, Yamazaki A. Effects of surgical treatment for cervical spondylotic myelopathy in patients > or = 70 years of age: a retrospective comparative study. J Spinal Disord Tech 2002; 15(6): 458-60. 171. Houten JK, Cooper PR. Laminectomy and posterior cervical plating for multilevel cervical spondylotic myelopathy and ossification of the posterior longitudinal ligament: effects on cervical alignment, spinal cord compression, and neurological outcome. Neurosurgery 2003; 52(5): 1081-7; discussion 7-8. 172. Huang RC, Girardi FP, Poynton AR, Cammisa Jr FP. Treatment of multilevel cervical spondylotic myeloradiculopathy with posterior decompression and fusion with lateral mass plate fixation and local bone graft. J Spinal Disord Tech 2003; 16(2): 123-9. 173. Hukuda S, Mochizuki T, Ogata M, Shichikawa K, Shimomura Y. Operations for cervical spondylotic myelopathy. A comparison of the results of anterior and posterior procedures. J Bone Joint Surg Br 1985; 67(4): 609-15. 174. Kawaguchi Y, Kanamori M, Ishihara H, Ohmori K, Abe Y, Kimura T. Pathomechanism of myelopathy and surgical results of laminoplasty in elderly patients with cervical spondylosis. Spine 2003; 28(19): 2209-14.

285
175. Koc RK, Menku A, Akdemir H, Tucer B, Kurtsoy A, Oktem IS. Cervical spondylotic myelopathy and radiculopathy treated by oblique corpectomies without fusion. Neurosurg Rev 2004; 27(4): 252-8. 176. Lee TT, Manzano GR, Green BA. Modified open-door cervical expansive laminoplasty for spondylotic myelopathy: operative technique, outcome, and predictors for gait improvement. J Neurosurg 1997; 86(1): 64-8. 177. Lu J, Wu X, Li Y, Kong X. Surgical results of anterior corpectomy in the aged patients with cervical myelopathy. Eur Spine J 2008; 17(1): 129-35. 178. Mastronardi L, Elsawaf A, Roperto R, et al. Prognostic relevance of the postoperative evolution of intramedullary spinal cord changes in signal intensity on magnetic resonance imaging after anterior decompression for cervical spondylotic myelopathy. J Neurosurg Spine 2007; 7(6): 615-22. 179. Matsuoka T, Yamaura I, Kurosa Y, Nakai O, Shindo S, Shinomiya K. Long-term results of the anterior floating method for cervical myelopathy caused by ossification of the posterior longitudinal ligament. Spine 2001; 26(3): 241-8. 180. Nagashima H, Dokai T, Hashiguchi H, et al. Clinical features and surgical outcomes of cervical spondylotic myelopathy in patients aged 80 years or older: a multi-center retrospective study. Eur Spine J 2011; 20(2): 240-6. 181. Naderi S, Alberstone CD, Rupp FW, Benzel EC, Baldwin NG. Cervical spondylotic myelopathy treated with corpectomy: technique and results in 44 patients. Neurosurg 1996; 1(6): e5; discussion 1 p following e5. 182. Ryu JS, Chae JW, Cho WJ, Chang H, Moon MS, Kim SS. Cervical myelopathy due to single level prolapsed disc and spondylosis: A comparative study on outcome between two groups. Int Orthop 2010; 34(7): 1011-5. 183. Saunders RL, Bernini PM, Shirreffs Jr TG, Reeves AG. Central corpectomy for cervical spondylotic myelopathy: A consecutive series with long-term follow-up evaluation. J Neurosurg 1991; 74(2): 163-70. 184. Singh A, Choi D, Crockard A. Use of walking data in assessing operative results for cervical spondylotic myelopathy: long-term follow-up and comparison with controls. Spine 2009; 34(12): 1296-300. 185. Suzuki A, Misawa H, Simogata M, Tsutsumimoto T, Takaoka K, Nakamura H. Recovery process following cervical laminoplasty in patients with cervical compression myelopathy: prospective cohort study. Spine 2009; 34(26): 2874-9. 186. Wiberg J. Effects of surgery on cervical spondylotic myelopathy. Acta Neurochir (Wien) 1986; 81(3-4): 113-7. 187. Wohlert L, Buhl M, Eriksen EF, et al. Treatment of cervical disc disease using Cloward's technique. III. Evaluation of cervical spondylotic myelopathy in 138 cases. Acta Neurochir (Wien) 1984; 71(1-2): 121-31. 188. Guidetti B, Fortuna A. Long-term results of surgical treatment of myelopathy due to cervical spondylosis. J Neurosurg 1969; 30(6): 714-21. 189. Nagashima H, Morio Y, Yamashita H, Yamane K, Teshima R. Clinical features and surgical outcomes of cervical myelopathy in the elderly. Clin Orthop 2006; 444: 140-5. 190. Ogawa Y, Toyama Y, Chiba K, et al. Long-term results of expansive open-door laminoplasty for ossification of the posterior longitudinal ligament of the cervical spine. J Neurosurg Spine 2004; 1(2): 168-74. 191. Agrawal D, Sharma BS, Gupta A, Mehta VS. Efficacy and results of expansive laminoplasty in patients with severe cervical myelopathy due to cervical canal stenosis. Neurol India 2004; 52(1): 54-8. 192. Iencean SM. Alternating cervical laminoplasty for cervical spondylotic myelopathy. J Bone Joint Surg Br 2007; 89(5): 639-41. 193. Kim YJ, Oh SH, Yi HJ, Kim YS, Ko Y, Oh SJ. Myelopathy caused by soft cervical disc herniation: Surgical results and prognostic factors. Journal of Korean Neurosurgical Society 2007; 42(6): 441-5.

286
194. Moussa AH, Nitta M, Symon L. The results of anterior cervical fusion in cervical spondylosis. Review of 125 cases. Acta Neurochir (Wien) 1983; 68(3-4): 277-88. 195. Phillips DG. Surgical treatment of myelopathy with cervical spondylosis. J Neurol Neurosurg Psychiatry 1973; 36(5): 879-84. 196. Scardino FB, Rocha LP, Barcelos ACES, Rotta JM, Botelho RV. Is there a benefit to operating on patients (bedridden or in wheelchairs) with advanced stage cervical spondylotic myelopathy? Eur Spine J 2010; 19(5): 699-705. 197. Sinha S, Jagetia A. Bilateral open-door expansive laminoplasty using unilateral posterior midline approach with preservation of posterior supporting elements for management of cervical myelopathy and radiculomyelopathy--analysis of clinical and radiological outcome and surgical technique. Acta Neurochir (Wien) 2011; 153(5): 975-84. 198. Emery SE, Bohlman HH, Bolesta MJ, Jones PK. Anterior cervical decompression and arthrodesis for the treatment of cervical spondylotic myelopathy. Two to seventeen-year follow-up. J Bone Joint Surg Am 1998; 80(7): 941-51. 199. Kumar GRV, Rea GL, Mervis LJ, McGregor JM. Cervical spondylotic myelopathy: Functional and radiographic long-term outcome after laminectomy and posterior fusion. Neurosurgery 1999; 44(4): 771-8. 200. Chung SS, Lee CS, Chung KH. Factors affecting the surgical results of expansive laminoplasty for cervical spondylotic myelopathy. Int Orthop 2002; 26(6): 334-8. 201. Alafifi T, Kern R, Fehlings M. Clinical and MRI predictors of outcome after surgical intervention for cervical spondylotic myelopathy. J Neuroimaging 2007; 17(4): 315-22. 202. Kiris T, Kilincer C. Cervical spondylotic myelopathy treated by oblique corpectomy: a prospective study. Neurosurgery 2008; 62(3): 674-82; discussion -82. 203. Wang MY, Green BA. Laminoplasty for the treatment of failed anterior cervical spine surgery. Neurosurg 2003; 15(3): E7. 204. Magnaes B, Hauge T. Surgery for myelopathy in cervical spondylosis: safety measures and preoperative factors related to outcome. Spine 1980; 5(3): 211-4. 205. Kawaguchi Y, Matsui H, Ishihara H, Gejo R, Yasuda T. Surgical outcome of cervical expansive laminoplasty in patients with diabetes mellitus. Spine 2000; 25(5): 551-5. 206. Kumar VG, Rea GL, Mervis LJ, McGregor JM. Cervical spondylotic myelopathy: functional and radiographic long-term outcome after laminectomy and posterior fusion. Neurosurgery 1999; 44(4): 771-7; discussion 7-8. 207. Hamanishi C, Tanaka S. Bilateral multilevel laminectomy with or without posterolateral fusion for cervical spondylotic myelopathy: Relationship to type of onset and time until operation. J Neurosurg 1996; 85(3): 447-51. 208. Handa Y, Kubota T, Ishii H, Sato K, Tsuchida A, Arai Y. Evaluation of prognostic factors and clinical outcome in elderly patients in whom expansive laminoplasty is performed for cervical myelopathy due to multisegmental spondylotic canal stenosis. A retrospective comparison with younger patients. J Neurosurg 2002; 96(2 SUPPL.): 173-9. 209. Hamburger C, Buttner A, Uhl E. The cross-sectional area of the cervical spinal canal in patients with cervical spondylotic myelopathy: Correlation of preoperative and postoperative area with clinical symptoms. Spine 1997; 22(17): 1990-5. 210. Lee TT, Manzano GR, Green BA. Modified open-door cervical expansive laminoplasty for spondylotic myelopathy: Operative technique, outcome, and predictors for gait improvement. J Neurosurg 1997; 86(1): 64-8. 211. Chagas H, Domingues F, Aversa A, Vidal Fonseca AL, de Souza JM. Cervical spondylotic myelopathy: 10 years of prospective outcome analysis of anterior decompression and fusion. Surg Neurol 2005; 64 Suppl 1: S1:30-5; discussion S1:5-6.
287
212. Chen CJ, Lyu RK, Lee ST, Wong YC, Wang LJ. Intramedullary high signal intensity on T2-weighted MR images in cervical spondylotic myelopathy: Prediction of prognosis with type of intensity. Radiology 2001; 221(3): 789-94. 213. Lyu RK, Tang LM, Chen CJ, Chen CM, Chang HS, Wu YR. The use of evoked potentials for clinical correlation and surgical outcome in cervical spondylotic myelopathy with intramedullary high signal intensity on MRI. Journal of Neurology, Neurosurgery and Psychiatry 2004; 75(2): 256-61. 214. Singh A, Crockard HA, Platts A, Stevens J. Clinical and radiological correlates of severity and surgery-related outcome in cervical spondylosis. J Neurosurg 2001; 94(2 SUPPL.): 189-98. 215. Tetreault LA, Karpova A, Fehlings MG. Predictors of outcome in patients with degenerative cervical spondylotic myelopathy undergoing surgical treatment: results of a systematic review. Eur Spine J 2013. 216. Cheng S-c, Yen C-h, Kwok TK, Wong W-c, Mak K-h. Anterior spinal fusion versus laminoplasty for cervical spondylotic myelopathy: a retrospective review. J 2009; 17(3): 265-8. 217. Matsuda Y, Shibata T, Oki S, Kawatani Y, Mashima N, Oishi H. Outcomes of surgical treatment for cervical myelopathy in patients more than 75 years of age. Spine 1999; 24(6): 529-34. 218. Cook C, Tackett S, Shah A, et al. Diabetes and perioperative outcomes following cervical fusion in patients with myelopathy. Spine 2008; 33(8): E254-E60. 219. Setzer M, Vrionis FD, Hermann EJ, Seifert V, Marquardt G. Effect of apolipoprotein E genotype on the outcome after anterior cervical decompression and fusion in patients with cervical spondylotic myelopathy: Clinical article. Journal of Neurosurgery: Spine 2009; 11(6): 659-66. 220. Park Y-S, Nakase H, Kawaguchi S, Sakaki T, Nikaido Y, Morimoto T. Predictors of outcome of surgery for cervical compressive myelopathy: retrospective analysis and prospective study. Neurol Med Chir (Tokyo) 2006; 46(5): 231-8; discussion 8-9. 221. Setzer M, Vrionis FD, Hermann EJ, Seifert V, Marquardt G. Effect of apolipoprotein E genotype on the outcome after anterior cervical decompression and fusion in patients with cervical spondylotic myelopathy. J Neurosurg Spine 2009; 11(6): 659-66. 222. Yamazaki T, Yanaka K, Sato H, et al. Cervical spondylotic myelopathy: Surgical results and factors affecting outcome with special reference to age differences. Neurosurgery 2003; 52(1): 122-6. 223. Nakashima H, Yukawa Y, Ito K, et al. Prediction of lower limb functional recovery after laminoplasty for cervical myelopathy: focusing on the 10-s step test. Eur Spine J 2012; 21(7): 1389-95. 224. Vedantam A, Jonathan A, Rajshekhar V. Association of magnetic resonance imaging signal changes and outcome prediction after surgery for cervical spondylotic myelopathy. J Neurosurg Spine 2011; 15(6): 660-6. 225. Kim HJ, Moon SH, Kim HS, et al. Diabetes and smoking as prognostic factors after cervical laminoplasty. Journal of Bone & Joint Surgery - British Volume 2008; 90(11): 1468-72. 226. Suda K, Abumi K, Ito M, Shono Y, Kaneda K, Fujiya M. Local kyphosis reduces surgical outcomes of expansive open-door laminoplasty for cervical spondylotic myelopathy. Spine 2003; 28(12): 1258-62. 227. Wang L-F, Zhang Y-Z, Shen Y, et al. Using the T2-weighted magnetic resonance imaging signal intensity ratio and clinical manifestations to assess the prognosis of patients with cervical ossification of the posterior longitudinal ligament. J Neurosurg Spine 2010; 13(3): 319-23. 228. Zhang Y-Z, Shen Y, Wang L-F, Ding W-Y, Xu J-X, He J. Magnetic resonance T2 image signal intensity ratio and clinical manifestation predict prognosis after surgical intervention for cervical spondylotic myelopathy. Spine 2010; 35(10): E396-9. 229. Zhang P, Shen Y, Zhang Y-Z, Ding W-Y, Wang L-F. Significance of increased signal intensity on MRI in prognosis after surgical intervention for cervical spondylotic myelopathy. J Clin Neurosci 2011; 18(8): 1080-3. 230. Tracy JA, Bartleson JD. Cervical spondylotic myelopathy. Neurologist 2010; 16(3): 176-87.

288
231. Fernandez de Rota JJ, Meschian S, Fernandez de Rota A, Urbano V, Baron M. Cervical spondylotic myelopathy due to chronic compression: the role of signal intensity changes in magnetic resonance images. J Neurosurg Spine 2007; 6(1): 17-22. 232. Yagi M, Ninomiya K, Kihara M, Horiuchi Y. Long-term surgical outcome and risk factors in patients with cervical myelopathy and a change in signal intensity of intramedullary spinal cord on magnetic resonance imaging: Clinical article. Journal of Neurosurgery: Spine 2010; 12(1): 59-65. 233. Budzik J-F, Balbi V, Le Thuc V, Duhamel A, Assaker R, Cotten A. Diffusion tensor imaging and fibre tracking in cervical spondylotic myelopathy. Eur Radiol 2011; 21(2): 426-33. 234. Kara B, Celik A, Karadereler S, et al. The role of DTI in early detection of cervical spondylotic myelopathy: a preliminary study with 3-T MRI. Neuroradiology 2011; 53(8): 609-16. 235. Kerkovsky M, Bednarik J, Dusek L, et al. Magnetic resonance diffusion tensor imaging in patients with cervical spondylotic spinal cord compression: correlations between clinical and electrophysiological findings. Spine 2012; 37(1): 48-56. 236. Lee JW, Kim JH, Park JB, et al. Diffusion tensor imaging and fiber tractography in cervical compressive myelopathy: preliminary results. Skeletal Radiol 2011; 40(12): 1543-51. 237. Demir A, Ries M, Moonen CTW, et al. Diffusion-weighted MR imaging with apparent diffusion coefficient and apparent diffusion tensor maps in cervical spondylotic myelopathy. Radiology 2003; 229(1): 37-43. 238. Jones JG, Cen SY, Lebel RM, Hsieh PC, Law M. Diffusion Tensor Imaging Correlates with the Clinical Assessment of Disease Severity in Cervical Spondylotic Myelopathy and Predicts Outcome following Surgery. AJNR Am J Neuroradiol 2013; 34(2): 471-8. 239. Nakamura M, Fujiyoshi K, Tsuji O, et al. Clinical significance of diffusion tensor tractography as a predictor of functional recovery after laminoplasty in patients with cervical compressive myelopathy. J Neurosurg Spine 2012; 17(2): 147-52. 240. Boakye M, Patil CG, Santarelli J, Ho C, Tian W, Lad SP. Cervical spondylotic myelopathy: complications and outcomes after spinal fusion. Neurosurgery 2008; 62(2): 455-61; discussion 61-2. 241. Cook C, Tackett S, Shah A, et al. Diabetes and perioperative outcomes following cervical fusion in patients with myelopathy.[Erratum appears in Spine (Phila Pa 1976). 2009 Oct 15;34(22):2470-2]. Spine 2008; 33(8): E254-60. 242. Hasegawa K, Homma T, Chiba Y. Upper extremity palsy following cervical decompression surgery results from a transient spinal cord lesion. Spine 2007; 32(6): E197-202. 243. Kaneyama S, Sumi M, Kanatani T, et al. Prospective study and multivariate analysis of the incidence of C5 palsy after cervical laminoplasty. Spine 2010; 35(26): E1553-8. 244. Kato S, Chikuda H, Seichi A, Ohtsu H, Kimura A, Toyama Y. Radiographical risk factors for major intraoperative blood loss during laminoplasty in patients with ossification of the posterior longitudinal ligament. Spine 2012; 37(25): E1588-93. 245. Kato M, Nakamura H, Konishi S, et al. Effect of preserving paraspinal muscles on postoperative axial pain in the selective cervical laminoplasty. Spine 2008; 33(14): E455-E9. 246. Kimura A, Seichi A, Hoshino Y, et al. Perioperative complications of anterior cervical decompression with fusion in patients with ossification of the posterior longitudinal ligament: a retrospective, multi-institutional study. J Orthop Sci 2012; 17(6): 667-72. 247. Meyer SA, Wu JC, Mummaneni PV. Laminoplasty outcomes: is there a difference between patients with degenerative stenosis and those with ossification of the posterior longitudinal ligament? Neurosurg 2011; 30(3): E9. 248. Minoda Y, Nakamura H, Konishi S, et al. Palsy of the C5 nerve root after midsagittal-splitting laminoplasty of the cervical spine. Spine 2003; 28(11): 1123-7. 249. Liu T, Zou W, Han Y, Wang Y. Correlative study of nerve root palsy and cervical posterior decompression laminectomy and internal fixation. Orthopedics 2010; 33(8).
289
250. Komagata M, Nishiyama M, Endo K, Ikegami H, Tanaka S, Imakiire A. Prophylaxis of C5 palsy after cervical expansive laminoplasty by bilateral partial foraminotomy. Spine Journal 2004; 4(6): 650-5. 251. Chen Y, Chen D, Wang X, Guo Y, He Z. C5 palsy after laminectomy and posterior cervical fixation for ossification of posterior longitudinal ligament. J Spinal Disord Tech 2007; 20(7): 533-5. 252. Chen Y, Chen D, Wang X, et al. Significance of segmental instability in cervical ossification of the posterior longitudinal ligament and treated by a posterior hybrid technique. Arch Orthop Trauma Surg 2013; 133(2): 171-7. 253. Chiba K, Toyama Y, Matsumoto M, Maruiwa H, Watanabe M, Hirabayashi K. Segmental motor paralysis after expansive open-door laminoplasty. Spine 2002; 27(19): 2108-15. 254. Imagama S, Matsuyama Y, Yukawa Y, et al. C5 palsy after cervical laminoplasty: a multicentre study. J Bone Joint Surg Br 2010; 92(3): 393-400. 255. Greiner-Perth R, Elsaghir H, Bohm H, El-Meshtawy M. The incidence of C5-C6 radiculopathy as a complication of extensive cervical decompression: own results and review of literature. Neurosurg Rev 2005; 28(2): 137-42. 256. Uematsu Y, Tokuhashi Y, Matsuzaki H. Radiculopathy after laminoplasty of the cervical spine. Spine 1998; 23(19): 2057-62. 257. Yoshida M, Tamaki T, Kawakami M, et al. Does reconstruction of posterior ligamentous complex with extensor musculature decrease axial symptoms after cervical laminoplasty? Spine 2002; 27(13): 1414-8. 258. Guigui P, Benoist M, Deburge A. Spinal deformity and instability after multilevel cervical laminectomy for spondylotic myelopathy. Spine 1998; 23(4): 440-7. 259. Kaptain GJ, Simmons NE, Replogle RE, Pobereskin L. Incidence and outcome of kyphotic deformity following laminectomy for cervical spondylotic myelopathy. J Neurosurg 2000; 93(2 Suppl): 199-204. 260. Suk KS, Kim KT, Lee JH, Lee SH, Lim YJ, Kim JS. Sagittal alignment of the cervical spine after the laminoplasty. Spine 2007; 32(23): E656-E60. 261. Motosuneya T, Maruyama T, Yamada H, Tsuzuki N, Sakai H. Long-term results of tension-band laminoplasty for cervical stenotic myelopathy: a ten-year follow-up. J Bone Joint Surg Br 2011; 93(1): 68-72. 262. Ohnari H, Sasai K, Akagi S, Iida H, Takanori S, Kato I. Investigation of axial symptoms after cervical laminoplasty, using questionnaire survey. Spine J 2006; 6(3): 221-7. 263. Sasai K, Saito T, Ohnari H, et al. Microsurgical posterior herniotomy with en bloc laminoplasty: alternative method for treating cervical disc herniation. J Spinal Disord Tech 2005; 18(2): 171-7. 264. Kumar GS, Rajshekhar V. Acute graft extrusion following central corpectomy in patients with cervical spondylotic myelopathy and ossified posterior longitudinal ligament. J Clin Neurosci 2009; 16(3): 373-7. 265. Matsumoto M, Watanabe K, Tsuji T, et al. Risk factors for closure of lamina after open-door laminoplasty. J Neurosurg Spine 2008; 9(6): 530-7. 266. Wang HQ, Mak KC, Samartzis D, et al. "Spring-back" closure associated with open-door cervical laminoplasty. Spine J 2011; 11(9): 832-8. 267. Okawa A, Sakai K, Hirai T, et al. Risk factors for early reconstruction failure of multilevel cervical corpectomy with dynamic plate fixation. Spine 2011; 36(9): E582-E7. 268. Ghogawala Z, Martin B, Benzel EC, et al. Comparative effectiveness of ventral vs dorsal surgery for cervical spondylotic myelopathy. Neurosurgery 2011; 68(3): 622-30; discussion 30-1. 269. Kristof RA, Kiefer T, Thudium M, et al. Comparison of ventral corpectomy and plate-screw-instrumented fusion with dorsal laminectomy and rod-screw-instrumented fusion for treatment of at least two vertebral-level spondylotic cervical myelopathy. Eur Spine J 2009; 18(12): 1951-6.

290
270. Hosono N, Yonenobu K, Ono K. Neck and shoulder pain after laminoplasty. A noticeable complication. Spine 1996; 21(17): 1969-73. 271. Koakutsu T, Morozumi N, Ishii Y, et al. Anterior decompression and fusion versus laminoplasty for cervical myelopathy caused by soft disc herniation: a prospective multicenter study. J Orthop Sci 2010; 15(1): 71-8. 272. Liu T, Yang HL, Xu YZ, Qi RF, Guan HQ. ACDF with the PCB cage-plate system versus laminoplasty for multilevel cervical spondylotic myelopathy. Journal of Spinal Disorders and Techniques 2011; 24(4): 213-20. 273. Sakaura H, Hosono N, Mukai Y, Ishii T, Iwasaki M, Yoshikawa H. Long-term outcome of laminoplasty for cervical myelopathy due to disc herniation: A comparative study of laminoplasty and anterior spinal fusion. Spine 2005; 30(7): 756-9. 274. Chen Y, Liu X, Chen D, Wang X, Yuan W. Surgical strategy for ossification of the posterior longitudinal ligament in the cervical spine. Orthopedics 2012; 35(8): e1231-7. 275. Woods BI, Hohl J, Lee J, Donaldson IW, Kang J. Laminoplasty versus laminectomy and fusion for multilevel cervical spondylotic myelopathy. Clinical Orthopaedics and Related Research 2011; 469(3): 688-95. 276. Yang L, Gu Y, Shi J, et al. Modified plate-only open-door laminoplasty versus laminectomy and fusion for the treatment of cervical stenotic myelopathy. Orthopedics 2013; 36(1): e79-87. 277. Cheng L, Nie L, Li M, Huo Y, Pan X. Superiority of the Bryan() disc prosthesis for cervical myelopathy: a randomized study with 3-year followup. Clin Orthop 2011; 469(12): 3408-14. 278. Lin Q, Zhou X, Wang X, Cao P, Tsai N, Yuan W. A comparison of anterior cervical discectomy and corpectomy in patients with multilevel cervical spondylotic myelopathy. Eur Spine J 2012; 21(3): 474-81. 279. Song KJ, Lee KB, Song JH. Efficacy of multilevel anterior cervical discectomy and fusion versus corpectomy and fusion for multilevel cervical spondylotic myelopathy: A minimum 5-year follow-up study. Eur Spine J 2012; 21(8): 1551-7. 280. Hosono N, Sakaura H, Mukai Y, Fujii R, Yoshikawa H. C3-6 laminoplasty takes over C3-7 laminoplasty with significantly lower incidence of axial neck pain. Eur Spine J 2006; 15(9): 1375-9. 281. Hosono N, Sakaura H, Mukai Y, Yoshikawa H. The source of axial pain after cervical laminoplasty-C7 is more crucial than deep extensor muscles. Spine 2007; 32(26): 2985-8. 282. Katsumi K, Yamazaki A, Watanabe K, Ohashi M, Shoji H. Can prophylactic bilateral C4/C5 foraminotomy prevent postoperative C5 palsy after open-door laminoplasty?: a prospective study. Spine 2012; 37(9): 748-54. 283. Kawaguchi Y, Kanamori M, Ishiara H, Nobukiyo M, Seki S, Kimura T. Preventive measures for axial symptoms following cervical laminoplasty. J Spinal Disord Tech 2003; 16(6): 497-501. 284. Park JH, Roh SW, Rhim SC, Jeon SR. Long-term outcomes of 2 cervical laminoplasty methods: midline splitting versus unilateral single door. J Spinal Disord Tech 2012; 25(8): E224-9. 285. Sakaura H, Hosono N, Mukai Y, Oshima K, Iwasaki M, Yoshikawa H. Preservation of the nuchal ligament plays an important role in preventing unfavorable radiologic changes after laminoplasty. J Spinal Disord Tech 2008; 21(5): 338-43. 286. Sakaura H, Hosono N, Mukai Y, Fujimori T, Iwasaki M, Yoshikawa H. Preservation of muscles attached to the C2 and C7 spinous processes rather than subaxial deep extensors reduces adverse effects after cervical laminoplasty. Spine 2010; 35(16): E782-6. 287. Tsuji T, Asazuma T, Masuoka K, et al. Retrospective cohort study between selective and standard C3-7 laminoplasty. Minimum 2-year follow-up study. Eur Spine J 2007; 16(12): 2072-7. 288. Xia Y, Xia Y, Shen Q, Li H, Xu T. Influence of hinge position on the effectiveness of expansive open-door laminoplasty for cervical spondylotic myelopathy. J Spinal Disord Tech 2011; 24(8): 514-20.

291
289. Carreon LY, Puno RM, Dimar IJR, Glassman SD, Johnson JR. Perioperative Complications of Posterior Lumbar Decompression and Arthrodesis in Older Adults. Journal of Bone and Joint Surgery - Series A 2003; 85(11): 2089-92. 290. Deyo RA, Cherkin DC, Loeser JD, Bigos SJ, Ciol MA. Morbidity and mortality in association with operations on the lumbar spine. The influence of age, diagnosis, and procedure. J Bone Joint Surg Am 1992; 74(4): 536-43. 291. Glassman SD, Alegre G, Carreon L, Dimar JR, Johnson JR. Perioperative complications of lumbar instrumentation and fusion in patients with diabetes mellitus. Spine J 2003; 3(6): 496-501. 292. Fang A, Hu SS, Endres N, Bradford DS. Risk factors for infection after spinal surgery. Spine (Phila Pa 1976) 2005; 30(12): 1460-5. 293. Simpson JM, Silveri CP, Balderston RA, Simeone FA, An HS. The results of operations on the lumbar spine in patients who have diabetes mellitus. Journal of Bone and Joint Surgery (American Volume) 1993; 75(12): 1823-9. 294. Bendo JA, Spivak J, Moskovich R, Neuwirth M. Instrumented posterior arthrodesis of the lumbar spine in patients with diabetes mellitus. American Journal of Orthopedics (Belle Mead, NJ) 2000; 29(8): 617-20. 295. Yonenobu K, Hosono N, Iwasaki M, Asano M, Ono K. Laminoplasty versus subtotal corpectomy. A comparative study of results in multisegmental cervical spondylotic myelopathy. Spine 1992; 17(11): 1281-4. 296. Yonenobu K, Hosono N, Iwasaki M, Asano M, Ono K. Neurologic complications of surgery for cervical compression myelopathy. Spine 1991; 16(11): 1277-82. 297. Hirai O, Kondo A, Aoyama I, Nin K. [Anterior decompression surgery of aged patients with cervical myelopathy]. No Shinkei Geka 1991; 19(11): 1017-23. 298. Kawaguchi Y, Kanamori M, Ishihara H, Ohmori K, Abe Y, Kimura T. Pathomechanism of myelopathy and surgical results of laminoplasty in elderly patients with cervical spondylosis. Spine 2003; 28(19): 2209-14. 299. Lu J, Wu X, Li Y, Kong X. Surgical results of anterior corpectomy in the aged patients with cervical myelopathy. Eur Spine J 2008; 17(1): 129-35. 300. Suzuki A, Misawa H, Simogata M, Tsutsumimoto T, Takaoka K, Nakamura H. Recovery process following cervical laminoplasty in patients with cervical compression myelopathy: Prospective cohort study. Spine 2009; 34(26): 2874-9. 301. Sunago K. [Long-term follow-up results of cervical spondylotic myelopathy--more than 5 years post-operatively--]. Nippon Geka Hokan 1982; 51(6): 995-1024. 302. Hilibrand AS, Fye MA, Emery SE, Palumbo MA, Bohlman HH. Impact of smoking on the outcome of anterior cervical arthrodesis with interbody or strut-grafting. J Bone Joint Surg Am 2001; 83-A(5): 668-73. 303. Choi S, Lee S-H, Lee J-Y, et al. Factors affecting prognosis of patients who underwent corpectomy and fusion for treatment of cervical ossification of the posterior longitudinal ligament: analysis of 47 patients. J Spinal Disord Tech 2005; 18(4): 309-14. 304. Chiles IBW, Leonard MA, Choudhri HF, Cooper PR. Cervical spondylotic myelopathy: Patterns of neurological deficit and recovery after anterior cervical decompression. Neurosurgery 1999; 44(4): 762-70. 305. Boakye M, Patil CG, Santarelli J, Ho C, Tian W, Lad SP. Cervical spondylotic myelopathy: Complications and outcomes after spinal fusion. Neurosurgery 2008; 62(2): 455-61. 306. Tetreault LA, Karpova A, Fehlings MG. Predictors of outcome in patients with degenerative cervical spondylotic myelopathy undergoing surgical treatment: results of a systematic review. Eur Spine J 2013.

292
307. Tetreault LA, Nouri A, Singh A, Fawcett M, Fehlings MG. Predictors of Outcome in Patients with Cervical Spondylotic Myelopathy undergoing Surgical Treatment: A Survey of Members from AOSpine International. World Neurosurg 2013. 308. Tetreault L KB, Vaccaro A, Yoon ST, Arnold P, Massicotte EM, Fehlings MG. A Clinical Prediction Model to Determine Outcomes in Patients with Cervical Spondylotic Myelopathy undergoing Surgical Treatment: Data from the Prospective, Multicenter AOSpine North American Study. Journal of Bone & Joint Surgery 2013; In Press. 309. Kristof RA, Kiefer T, Thudium M, et al. Comparison of ventral corpectomy and plate-screw-instrumented fusion with dorsal laminectomy and rod-screw-instrumented fusion for treatment of at least two vertebral-level spondylotic cervical myelopathy. Eur Spine J 2009; 18(12): 1951-6. 310. Woods BI, Hohl J, Lee J, Donaldson W, 3rd, Kang J. Laminoplasty versus laminectomy and fusion for multilevel cervical spondylotic myelopathy. Clin Orthop Relat Res 2011; 469(3): 688-95. 311. Liu T, Yang HL, Xu YZ, Qi RF, Guan HQ. ACDF with the PCB cage-plate system versus laminoplasty for multilevel cervical spondylotic myelopathy. Journal of Spinal Disorders & Techniques 2011; 24(4): 213-20. 312. Wang LF, Zhang YZ, Shen Y, et al. Using the T2-weighted magnetic resonance imaging signal intensity ratio and clinical manifestations to assess the prognosis of patients with cervical ossification of the posterior longitudinal ligament. J Neurosurg Spine 2010; 13(3): 319-23. 313. Arvin B, Kalsi-Ryan S, Karpova A, et al. Postoperative magnetic resonance imaging can predict neurological recovery after surgery for cervical spondylotic myelopathy: A prospective study with blinded assessments. Neurosurgery 2011; 69(2): 362-8. 314. Karpova A, Arun R, Davis AM, et al. Reliability of quantitative magnetic resonance imaging methods in the assessment of spinal canal stenosis and cord compression in cervical myelopathy. Spine (Phila Pa 1976) 2013; 38(3): 245-52. 315. Fehlings MG WJ, Kopjar B, Yoon S, Arnold P, Massicotte EMM, Vaccaro A, Brodke DS, Shaffrey C, Smith JS, Woodward E, Banco RJ, Chapman J, Janssen M, Bono C, Sasso R, Dekutoski M, Gokaslan ZL. Efficacy and Safety of Surgical Decompression in Patients with Cervical Spondylotic Myelopathy: Results of the AOSpine North America Multi-Centre Study. Journal of Bone & Joint Surgery 2013; In press. 316. Parker SL, Mendenhall SK, Shau DN, et al. Minimum clinically important difference in pain, disability, and quality of life after neural decompression and fusion for same-level recurrent lumbar stenosis: understanding clinical versus statistical significance. J Neurosurg Spine 2012; 16(5): 471-8. 317. Parker SL, Mendenhall SK, Shau D, et al. Determination of minimum clinically important difference in pain, disability, and quality of life after extension of fusion for adjacent-segment disease. J Neurosurg Spine 2012; 16(1): 61-7. 318. Copay AG, Glassman SD, Subach BR, Berven S, Schuler TC, Carreon LY. Minimum clinically important difference in lumbar spine surgery patients: a choice of methods using the Oswestry Disability Index, Medical Outcomes Study questionnaire Short Form 36, and pain scales. Spine J 2008; 8(6): 968-74. 319. Liu S, Schwab F, Smith JS, et al. Likelihood of reaching minimal clinically important difference in adult spinal deformity: a comparison of operative and nonoperative treatment. The Ochsner journal 2014; 14(1): 67-77. 320. Carreon LY, Glassman SD, Campbell MJ, Anderson PA. Neck Disability Index, short form-36 physical component summary, and pain scales for neck and arm pain: the minimum clinically important difference and substantial clinical benefit after cervical spine fusion. Spine J 2010; 10(6): 469-74. 321. Norman GR, Sloan JA, Wyrwich KW. Interpretation of changes in health-related quality of life: the remarkable universality of half a standard deviation. Medical care 2003; 41(5): 582-92. 322. Yonenobu K, Abumi K, Nagata K, Taketomi E, Ueyama K. Interobserver and intraobserver reliability of the japanese orthopaedic association scoring system for evaluation of cervical compression myelopathy. Spine (Phila Pa 1976) 2001; 26(17): 1890-4; discussion 5.

293
323. Bellamy N, Carette S, Ford PM, et al. Osteoarthritis antirheumatic drug trials. III. Setting the delta for clinical trials--results of a consensus development (Delphi) exercise. The Journal of rheumatology 1992; 19(3): 451-7. 324. Harrell FE. Regression Modeling Strategies with Applications to Linear Models, Logistic Regression and Survival Analysis New York: Springer-Verlag; 2001. 325. Little R. Regression with missing X's: a review. J Am Stat Assoc 1992; 88: 125-34. 326. Rubin DB. Expert Report on Multiple Imputation, 2006. 327. Altman DG. Practical Statistics for Medical Research. First ed. London Chapman & Hall; 1991. 328. Rajshekhar V, Kumar GSS. Functional outcome after central corpectomy in poor-grade patients with cervical spondylotic myelopathy or ossified posterior longitudinal ligament. Neurosurgery 2005; 56(6): 1279-84; discussion 84-5. 329. Fukushima T, Ikata T, Taoka Y, Takata S. Magnetic resonance imaging study on spinal cord plasticity in patients with cervical compression myelopathy. Spine 1991; 16(10 Suppl): S534-8. 330. Matsunaga S, Sakou T. Ossification of the posterior longitudinal ligament of the cervical spine: Etiology and natural history. Spine 2012; 37(5): E309-E14. 331. Abbasi A, Peelen LM, Corpeleijn E, et al. Prediction models for risk of developing type 2 diabetes: systematic literature search and independent external validation study. BMJ 2012; 345: e5900. 332. Altman DG, Vergouwe Y, Royston P, Moons KG. Prognosis and prognostic research: validating a prognostic model. BMJ 2009; 338: b605. 333. Steyerberg EW, Vickers AJ, Cook NR, et al. Assessing the performance of prediction models: a framework for traditional and novel measures. Epidemiology 2010; 21(1): 128-38. 334. Bleeker SE, Moll HA, Steyerberg EW, et al. External validation is necessary in prediction research: a clinical example. J Clin Epidemiol 2003; 56(9): 826-32. 335. Tetreault LA, Dettori JR, Wilson JR, et al. Systematic review of magnetic resonance imaging characteristics that affect treatment decision making and predict clinical outcome in patients with cervical spondylotic myelopathy. Spine 2013; 38(22 Suppl 1): S89-110. 336. Hsieh MO, Kagle JD. Understanding patient satisfaction and dissatisfaction with health care. Health Soc Work 1991; 16(4): 281-90. 337. Williams S, Weinman J, Dale J, Newman S. Patient expectations: what do primary care patients want from the GP and how far does meeting expectations affect patient satisfaction? Fam Pract 1995; 12(2): 193-201. 338. McGregor AH, Hughes SP. The evaluation of the surgical management of nerve root compression in patients with low back pain: Part 2: patient expectations and satisfaction. Spine (Phila Pa 1976) 2002; 27(13): 1471-6; discussion 6-7. 339. Bartels RH, Verbeek AL, Benzel EC, Fehlings MG, Guiot BH. Validation of a translated version of the modified Japanese orthopaedic association score to assess outcomes in cervical spondylotic myelopathy: an approach to globalize outcomes assessment tools. Neurosurgery 2010; 66(5): 1013-6. 340. Tetreault LA, Nouri A, Singh A, Fawcett M, Fehlings MG. Predictors of outcome in patients with cervical spondylotic myelopathy undergoing surgical treatment: a survey of members from AOSpine International. World neurosurgery 2013; 81(3-4): 623-33. 341. Tetreault LA, Dettori JR, Wilson JR, et al. Systematic review of magnetic resonance imaging characteristics that affect treatment decision making and predict clinical outcome in patients with cervical spondylotic myelopathy. Spine 2013; 38(22 Suppl 1): 110. 342. Singh A, Tetreault L, Casey A, Laing R, Statham P, Fehlings MG. A summary of assessment tools for patients suffering from cervical spondylotic myelopathy: a systematic review on validity, reliability and responsiveness. European spine journal : official publication of the European Spine Society, the European Spinal Deformity Society, and the European Section of the Cervical Spine Research Society 2013.

294
343. Jones JG, Cen SY, Lebel RM, Hsieh PC, Law M. Diffusion tensor imaging correlates with the clinical assessment of disease severity in cervical spondylotic myelopathy and predicts outcome following surgery. AJNR American journal of neuroradiology 2013; 34(2): 471-8. 344. Jinkins JR, Dworkin JS, Damadian RV. Upright, weight-bearing, dynamic-kinetic MRI of the spine: initial results. Eur Radiol 2005; 15(9): 1815-25. 345. Tetreault L, Côté P, Kopjar B, Arnold P, Fehlings MG. A Clinical Prediction Model to Assess Surgical Outcome in Patients with Cervical Spondylotic Myelopathy: Internal and External Validation using the Prospective Multicenter AOSpine North American and International Datasets of 743 Patients. Spine J 2014. 346. Matz PG, Anderson PA, Holly LT, et al. The natural history of cervical spondylotic myelopathy. J Neurosurg Spine 2009; 11(2): 104-11. 347. Hamilton DF, Lane JV, Gaston P, et al. What determines patient satisfaction with surgery? A prospective cohort study of 4709 patients following total joint replacement. BMJ Open 2013; 3(4). 348. Minoda Y, Nakamura H, Konishi S, et al. Palsy of the C5 nerve root after midsagittal-splitting laminoplasty of the cervical spine. Spine 2003; 28(11): 1123-7. 349. Suk KS, Kim KT, Lee JH, Lee SH, Lim YJ, Kim JS. Sagittal alignment of the cervical spine after the laminoplasty. Spine 2007; 32(23): E656-60. 350. Lubelski D, Derakhshan A, Nowacki AS, et al. Predicting C5 palsy via the use of preoperative anatomic measurements. Spine J 2014; 14(9): 1895-901. 351. Komagata M, Nishiyama M, Endo K, Ikegami H, Tanaka S, Imakiire A. Prophylaxis of C5 palsy after cervical expansive laminoplasty by bilateral partial foraminotomy. Spine Journal: Official Journal of the North American Spine Society 2004; 4(6): 650-5. 352. Hospital Inpatient Value-Based Purchasing Program. In: Services HaH, editor.; 2011. p. 26490-547. 353. Morris B, Jahangir A, Sethi M. Patient Satisfaction: An Emerging Health Policy Issue: What the orthopaedic surgeon needs to know. AAOS Now. 2013. 354. Jayasankar S. Patient expectations: How do they matter? AAOS Now. 2009. 355. Adogwa O, Carr K, Fatemi P, et al. Psychosocial factors and surgical outcomes: are elderly depressed patients less satisfied with surgery? Spine (Phila Pa 1976) 2014; 39(19): 1614-9. 356. Adogwa O, Parker SL, Shau DN, et al. Preoperative Zung depression scale predicts patient satisfaction independent of the extent of improvement after revision lumbar surgery. Spine J 2013; 13(5): 501-6. 357. Fox B, Richardson W. Medical Liability: The Spine Surgery Perspective. (accessed. 358. Smith ZA, Buchanan CC, Raphael D, Khoo LT. Ossification of the posterior longitudinal ligament: pathogenesis, management, and current surgical approaches. A review. Neurosurg 2011; 30(3): E10.