Significant Features of High-Strength Steel Weld Metal
11
Significant Features of High-Strength Steel Weld Metal Microstructures Optimal combinations of microstructure and mechanical properties are identified for high-strength steel submerged arc weld metal BY P. T. OLDLAND, C. W. RAMSAY, D. K. MATLOCK AND D. L. OLSON ABSTRACT. Microstructural changes with heat input during submerged arc welding of a high-strength, low-carbon, 5 wt-% nickel Cr-Mo steel were evaluated with both optical and transmission electron microscopy (TEM), and the results were correlated with mechanical properties. A classification scheme was developed to identify the complex microstructural fea- tures observed in the TEM analysis of high-strength steel weld metal. An increase in heat input from 1 to 4 MJ/m (25 to 100 kj/in.), decreased the strength, increased the ductility and the toughness, and caused the weld metal microstruc- ture to change from autotempered mar- tensite to a mixture of martensite, bainite, and retained austenite. An optimal com- bination of microstructure and properties was identified, and the potential for mod- ifying the consumable compositions to produce this structure over a wide range of heat inputs was discussed, based on continuous cooling transformation be- havior. Introduction The economical utilization of high- strength steels with yield strengths great- er than 690 MPa (100 ksi) in fabricated structures depends on the use of high- heat-input welding processes, proper selection of welding consumables, and preheat and postweld heat treatment procedures. Significant literature on the welding of high-strength steel exists, but much of this work is focused on the heat-affected zone microstructure and properties (Refs. 1-6). There is only limit- ed literature on the microstructure and properties of high-strength-steel weld metal (Refs. 7-10). P. T. OLDLAND, C. W. RAMSAY, D. K. MAT- LOCK and D. L. OLSON are with the Center for Welding Research, Colorado School of Mines, Golden, Colo. Paper presented at the 69th Annual AWS Meeting, held April 17-22, 1988, in New Orleans, La. The submerged arc welding process has been successfully applied (Ref. 11) to lower-strength "ferritic" steels with yield strengths less than 690 MPa in the 1 to 4 MJ/m (25 to 100 kj/in.) heat input range. In contrast, submerged arc welding of high-strength steels with heat inputs greater than 2 MJ/m (50 kj/in.) does not yet consistently produce weldments with acceptable combinations of strength and toughness (Ref. 11). To extend the usable heat input ranges for submerged arc welding of high-strength steels, a quanti- tative characterization of the microstruc- ture and mechanical properties is required. A fundamental understanding of the influence of heat input on the microstructure and properties of high- strength-steel weld metal will lead to increased utilization of these materials. Variations in high-strength-steel weld metal microstructures and properties are primarily due to two factors: the cooling rate and the weld metal composition. The cooling rate experienced by the weld metal deposit is controlled by a combination of heat input and heat extraction. The heat extraction from the weld pool depends on joint geometry, plate thickness, and extent of preheat. The rate of heat extraction increases with an increase in plate thickness or a decrease in the preheat temperature. The weld metal composition is depen- dent on base metal and electrode wire compositions, dilution, and the pyromet- allurgical chemical reactions in the weld- KEY W O R D S High-Strength Steel HY-130 Steel Welds Weld Microstructures Submerged Arc Welding Emission Spectrometer ARL Spectrometer Optical Metallography Martensite + Bainite Fractography ing arc. The final microstructures in steel weld deposits result from austenitic decomposition, either through the nucle- ation and growth of ferrite and bainite or through the athermal transformation to martensite, which can be modified by a variety of precipitation reactions (Ref. 12). Previous studies have shown that weld metals with yield strengths less than 560 MPa (80 ksi) consist primarily of ferrite, while weld metals with yield strengths greater than 690 MPa (100 ksi) consist primarily of martensite and bainite (Refs. 13-15). In this paper, a detailed analysis of effects of heat input on micro- structural development in high-strength- steel weld metal is presented. Experimental Procedure A low-carbon, 5 wt-% nickel Cr-Mo high-strength steel was received in the form of 51-mm (2-in.) thick plate, and welds were prepared with two welding wires, identified as wire 1 and wire 2, and one commercial basic welding flux. Com- plete chemical analyses of the base metal and welding wires are presented in Table 1. The nominal composition of the flux used in this study is listed in Table 2. Single-pass, bead-on-plate weldments were prepared by the submerged arc welding process over a heat input range of 1.2 to 3.7 MJ/m (30 to 93 kj/in.) for five test series. Series I and ll weldments were produced on 300- X 51- X 19-mm (12- X 2- X 0.75-in.) coupons using elec- trode wires 1 and 2. These initial weld- ments were used in a screening process to determine the compositional stability, hardness, and microstructural changes occurring with changes in heat input. Series III weldments, which were used for the majority of this study, were produced on 690- X 76- X 51-mm (27- X 3- X 2- in.) coupons with a 6.5-mm-deep (0.25- in.) 60-deg included angle groove, using electrode wire 1. The larger coupons were used to provide a significant heat sink. However, the cooling rate in the laboratory coupons may be less than would be obtained in full-size structures. 158-s | APRIL 1989
Transcript of Significant Features of High-Strength Steel Weld Metal

Significant Features of High-Strength Steel Weld Metal Microstructures
Optimal combinations of microstructure and mechanical properties are identified for high-strength steel submerged
arc weld metal
BY P. T. OLDLAND, C. W. RAMSAY, D. K. MATLOCK AND D. L. OLSON
ABSTRACT. Microstructural changes with heat input during submerged arc welding of a high-strength, low-carbon, 5 wt-% nickel Cr-Mo steel were evaluated with both optical and transmission electron microscopy (TEM), and the results were correlated with mechanical properties. A classification scheme was developed to identify the complex microstructural features observed in the TEM analysis of high-strength steel weld metal. An increase in heat input from 1 to 4 MJ/m (25 to 100 kj/in.), decreased the strength, increased the ductility and the toughness, and caused the weld metal microstructure to change from autotempered martensite to a mixture of martensite, bainite, and retained austenite. An optimal combination of microstructure and properties was identified, and the potential for modifying the consumable compositions to produce this structure over a wide range of heat inputs was discussed, based on continuous cooling transformation behavior.
Introduction
The economical utilization of high-strength steels with yield strengths greater than 690 MPa (100 ksi) in fabricated structures depends on the use of high-heat-input welding processes, proper selection of welding consumables, and preheat and postweld heat treatment procedures. Significant literature on the welding of high-strength steel exists, but much of this work is focused on the heat-affected zone microstructure and properties (Refs. 1-6). There is only limited literature on the microstructure and properties of high-strength-steel weld metal (Refs. 7-10).
P. T. OLDLAND, C. W. RAMSAY, D. K. MAT-LOCK and D. L. OLSON are with the Center for Welding Research, Colorado School of Mines, Golden, Colo.
Paper presented at the 69th Annual AWS Meeting, held April 17-22, 1988, in New Orleans, La.
The submerged arc welding process has been successfully applied (Ref. 11) to lower-strength "ferritic" steels with yield strengths less than 690 MPa in the 1 to 4 MJ/m (25 to 100 kj/in.) heat input range. In contrast, submerged arc welding of high-strength steels with heat inputs greater than 2 MJ/m (50 kj/in.) does not yet consistently produce weldments with acceptable combinations of strength and toughness (Ref. 11). To extend the usable heat input ranges for submerged arc welding of high-strength steels, a quantitative characterization of the microstructure and mechanical properties is required. A fundamental understanding of the influence of heat input on the microstructure and properties of high-strength-steel weld metal will lead to increased utilization of these materials.
Variations in high-strength-steel weld metal microstructures and properties are primarily due to two factors: the cooling rate and the weld metal composition. The cooling rate experienced by the weld metal deposit is controlled by a combination of heat input and heat extraction. The heat extraction from the weld pool depends on joint geometry, plate thickness, and extent of preheat. The rate of heat extraction increases with an increase in plate thickness or a decrease in the preheat temperature. The weld metal composition is dependent on base metal and electrode wire compositions, dilution, and the pyromet-allurgical chemical reactions in the weld-
KEY W O R D S
High-Strength Steel HY-130 Steel Welds Weld Microstructures Submerged Arc Welding Emission Spectrometer ARL Spectrometer Optical Metallography Martensite + Bainite Fractography
ing arc. The final microstructures in steel weld deposits result from austenitic decomposition, either through the nucleation and growth of ferrite and bainite or through the athermal transformation to martensite, which can be modified by a variety of precipitation reactions (Ref. 12). Previous studies have shown that weld metals with yield strengths less than 560 MPa (80 ksi) consist primarily of ferrite, while weld metals with yield strengths greater than 690 MPa (100 ksi) consist primarily of martensite and bainite (Refs. 13-15). In this paper, a detailed analysis of effects of heat input on micro-structural development in high-strength-steel weld metal is presented.
Experimental Procedure
A low-carbon, 5 wt-% nickel Cr-Mo high-strength steel was received in the form of 51-mm (2-in.) thick plate, and welds were prepared with two welding wires, identified as wire 1 and wire 2, and one commercial basic welding flux. Complete chemical analyses of the base metal and welding wires are presented in Table 1. The nominal composition of the flux used in this study is listed in Table 2. Single-pass, bead-on-plate weldments were prepared by the submerged arc welding process over a heat input range of 1.2 to 3.7 MJ/m (30 to 93 kj/in.) for five test series. Series I and ll weldments were produced on 300- X 51- X 19-mm (12- X 2- X 0.75-in.) coupons using electrode wires 1 and 2. These initial weldments were used in a screening process to determine the compositional stability, hardness, and microstructural changes occurring with changes in heat input. Series III weldments, which were used for the majority of this study, were produced on 690- X 76- X 51-mm (27- X 3- X 2-in.) coupons with a 6.5-mm-deep (0.25-in.) 60-deg included angle groove, using electrode wire 1. The larger coupons were used to provide a significant heat sink. However, the cooling rate in the laboratory coupons may be less than would be obtained in full-size structures.
158-s | APRIL 1989

Table 1—Chemical Compositions of the 5 wt-% Nickel Cr-Mo High-Strength-Steel Base Metal, Welding Wires and Flux
Material C Mn Si P S Ni M o Cr Cu
Base plate Wire 1 Wire 2
0.09 0.076 0.093
0.72 1.55 1.71
0.28 0.39 0.24
0.007 0.004 0.006
0.003 0.002 0.004
4.85 2.47 2.10
0.41 0.80 0.63
0.55 0.73 1.02
0.15 0.031 0.047
0.080 0.003 0.010
0.005 0.016 0.010
Table 2—Nominal Chemical Composition of Submerged Arc Welding Flux in wt-%
Flux
Si02
10.7
AI2O3
17.2
MgO
31.7
MnO
6.6
CaO
1.1
T i 0 2
0.86
CaF2
24.1
Na 2 0
0.78
Fe203
1.9
C
0:35
The w e l d g r o o v e was necessary t o p ro vide enough we ld bead for mechanical testing and to yield approx imate ly the same dilutions obta ined in Series I and II we ldments . Addi t ional w e l d metal p ro duced in Series III was used for Series IV and V in an a t tempt t o simulate the effects of reheat ing o f we ld metal dur ing multipass we ld ing . This was accomplished by heat treat ing t w o sets o f Charpy V-no tch samples fo r 1 min at 688° and 8 3 2 ° C (1270° and 1529°F), for Series IV and V , respectively, f o l l o w e d by air cool ing. D iamond pyramid hardness measurements w e r e made on the t e m pered we ld metal and the Series III we ld metal for compar ison. These tempered specimens w e r e b roken at temperatures near the duct i le-to-br i t t le transit ion t e m peratures of the un tempered welds .
Chemical analyses of the as-received base plate and the we ld metal of Series I, II, III, IV and V w e r e obta ined using an ARL emission spect rometer (for the elements manganese, sil icon, phosphorus, nickel, m o l y b d e n u m , ch rom ium, copper , vanad ium and ti tanium) and w i t h a Leco interstitial combus t ion analyzer (for carbon and sulfur).
We ldmen ts p roduced in Series I, II and III w e r e evaluated w i t h standard opt ical metal lographic methods to characterize b o t h the macrostructure and microstructure o f each w e l d . The w e l d metal specimens w e r e sect ioned transverse to the we ld ing d i rect ion, m o u n t e d , and mechanically pol ished th rough 0.05 pm AI2O3 p o w d e r . Several special etchants w e r e used in this study, and it was de termined that LePera's e tch (Ref. 16) revealed details o f the solidif ication structure that w e r e not observable w i t h standard Nital steel etchants. The LePera's and Nital etchants, the etching p rocedu re , and their ef fect on the microstructure are presented in Table 3. The samples w e r e e tched w i th LePera's e tch, analyzed, repol ished, e tched w i th Nital, and analyzed again. Longitudinal sections w e r e p repared in the Series III we ldments near the centerl ine t o obta in , a long w i th the transverse micrographs, a three-dimensional v i e w of the w e l d metal
microstructures. Series III specimens used fo r opt ical microscopy w e r e analyzed using a scanning electron microscope w i t h energy dispersive x-ray spec t rome-try. Series III we ld metal specimens, wh ich w e r e analyzed w i t h the transmission elect ron microscope, w e r e punched f r o m wafers of we ld metal cut transverse to the we ld ing d i rect ion. These wafers w e r e pol ished w i t h a tw in- je t electropol isher in 5 vo l -% perchlor ic acid, and 95 vo l -% acetic acid solut ion at 13°C (55°F).
Hardness measurements w e r e made on the transverse sections of Series I, II and III we lds using the Rockwel l hardness tester. Mechanical testing of the Series III we lds consisted o f tensile testing of flat a l l -weld-metal tensile bars in accordance w i t h ASTM standards (Ref. 17), w i th a reduced gage section o f 25 X 6.3 X 3.7 m m ( 1 X 0 . 2 5 X 0 . 1 4 in.), and Charpy V-no tch toughness testing. ASTM standard 5-mm-thick (0.2-in.) subsized Charpy specimens (Ref. 18) w e r e machined f r o m Series III, IV and V welds . The notches w e r e or iented to cause crack propagat ion along the w e l d center l ine in the we ld ing d i rect ion.
Fracture surfaces of Series III Charpy V-no tch samples b roken at — 196°C (—321 °F) w e r e analyzed using energy dispersive x-ray spect romet ry on the
scanning e lect ron microscope. The features o f the f racture surfaces we re then compared to the we ld metal microstructures. A quali tat ive analysis of some inclusions present on the f racture surfaces was conduc ted dur ing this study.
Results
Compositional Stability
The w e l d metal chemical composi t ions and delta quantit ies fo r Series I, II and III are listed in Table 4. The data in Table 4 include the series number , heat input, and di lut ion fo r each we ld specimen as calculated directly f r o m measurements of bead geomet ry . Here, the di lut ion was held to a range of 45 to 55%.
The composi t ional stability of the w e l d deposi t was evaluated using the delta quant i ty (Ref. 19). The delta quant i ty is the d i f ference b e t w e e n the analytical (measured) w e l d metal composi t ion and the pred ic ted (calculated) w e l d metal compos i t ion , based on di lut ion of the e lect rode w i re and the me l ted base met al. The delta quanti ty directly reflects the chemical reactions occurr ing during weld ing. A posit ive delta quant i ty for an element indicates that the element was added t o the w e l d poo l f r o m the flux. A
Table 3—Summary of Special Etchants, Etching Procedure and the Etching Effect on the Weld Metal Microstructure
Etchant Procedure
Nital 2% nitric in methanol. Swab at room temperature for approximately 45 seconds.
LePera's 1% sodium metabisulfate in distilled water plus 4% picric acid in ethanol, mixed in a 1:1 volume ratio. The specimen should be etch-polished using 4% picral to remove all the disturbed metal (approximately three etch-polished sequences are sufficient). The etchant is then mixed and the specimen is immediately immersed for 5-10 seconds.
Effect on Microstructure
Etches grain boundaries. Highlights second phase, such as martensite, and bainite.
Martensite appears white, bainite appears black, ferrite appears tan (or gray). Shows coring of solidification structure in weld metal.
W E L D I N G RESEARCH SUPPLEMENT 1159-s
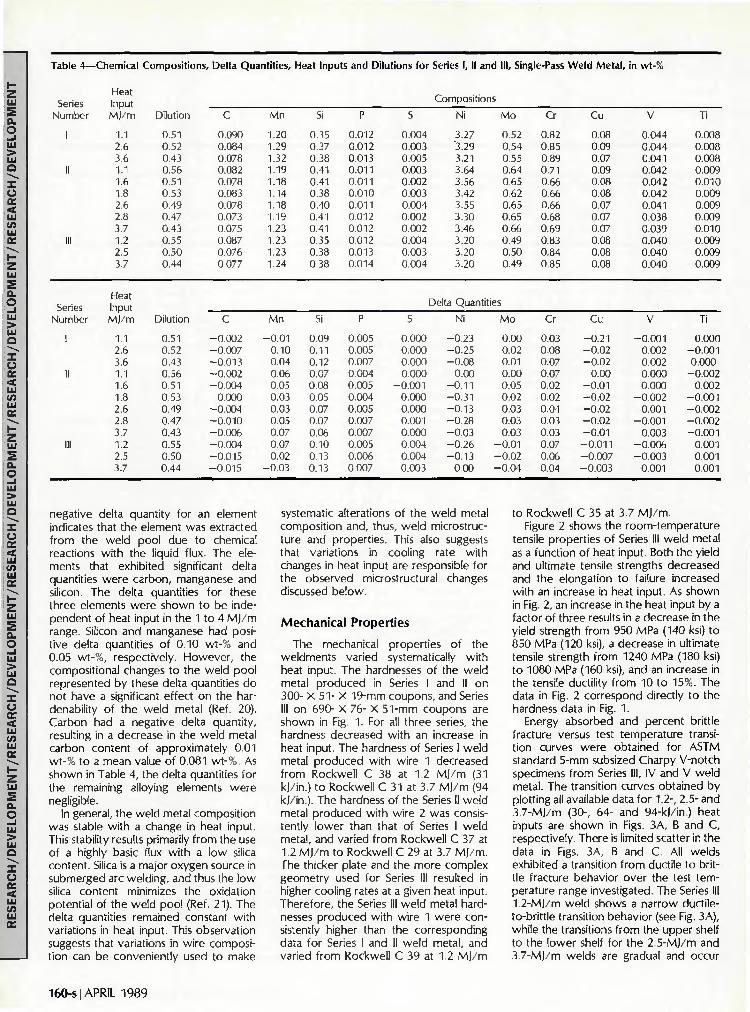
Table 4 -
Series Number
1
II
HI
Series Number
1
II
III
-Chemical
Heat Input MJ/m
1.1 2.6 3.6 1.1 1.6 1.8 2.6 2.8 3.7 1.2 2.5 3.7
Heat Input MJ/m
1.1 2.6 3.6 1.1 1.6 1.8 2.6 2.8 3.7 1.2 2.5 3.7
Compositions, Delta Quantities,
Dilution
0.51 0.52 0.43 0.56 0.51 0.53 0.49 0.47 0.43 0.55 0.50 0.44
Dilution
0.51 0.52 0.43 0.56 0.51 0.53 0.49 0.47 0.43 0.55 0.50 0.44
c 0.090 0.084 0.078 0.082 0.078 0.083 0.078 0.073 0.075 0.087 0.076 0.077
C
-0.002 -0.007 -0.013 -0.002 -0.004
0.000 -0.004 -0 .010 -0.006 -0.004 -0.015 -0.015
Mn
1.20 1.29 1.32 1.19 1.18 1.14 1.18 1.19 1.23 1.23 1.23 1.24
Mn
-0 .01 0.10 0.04 0.06 0.05 0.03 0.03 0.05 0.07 0.07 0.02
-0 .03
Heat Inpul
Si
0.35 0.37 0.38 0.41 0.41 0.38 0.40 0.41 0.41 0.35 0.38 0.38
Si
0.09 0.11 0.12 0.07 0.08 0.05 0.07 0.07 0.06 0.10 0.13 0.13
s and Dilutions for Series I, II and III, Sing
P
0.012 0.012 0.013 0.011 0.011 0.010 0.011 0.012 0.012 0.012 0.013 0.014
P
0.005 0.005 0.007 0.004 0.005 0.004 0.005 0.007 0.007 0.005 0.006 0.007
S
0.004 0.003 0.005 0.003 0.002 0.003 0.004 0.002 0.002 0.004 0.003 0.004
Compositions
Ni
3.27 '3.29 3.21 3.64 3.56 3.42 3.55 3.30 3.46 3.20 3.20 3.20
Mo
0.52 0.54 0.55 0.64 0.65 0.62 0.65 0.65 0.66 0.49 0.50 0.49
Delta Quantities
S
0.000 0.000 0.000 0.000
-0 .001 0.000 0.000 0.001 0.000 0.004 0.004 0.003
Ni
-0 .23 -0 .25 -0 .08
0.00 -0 .11 -0 .31 -0 .13 -0 .28 -0 .03 -0 .26 -0 .13
0.00
Mo
0.00 0.02 0.01 0.00 0.05 0.02 0.03 0.03 0.03
-0.01 -0.02 -0.04
e-Pass Weld Metal,
Cr
0.82 0.85 0.89 0.71 0.66 0.66 0.66 0.68 0.69 0.83 0.84 0.85
Cr
0.03 0.08 0.07 0.07 0.02 0.02 0.04 0.03 0.03 0.07 0.06 0.04
Cu
0.08 0.09 0.07 0.09 0.08 0.08 0.07 0.07 0.07 0.08 0.08 0.08
Cu
-0 .21 -0 .02 -0 .02
0.00 -0 .01 -0 .02 -0 .02 -0 .02 -0 .01 -0 .011 -0.007 -0.003
in wt-%
V
0.044 0.044 0.041 0.042 0.042 0.042 0.041 0.038 0.039 0.040 0.040 0.040
V
-0 .001 0.002 0.002 0.000 0.000
-0.002 0.001
-0 .001 0.003
-0.006 -0.003
0.001
Ti
0.008 0.008 0.008 0.009 0.010 0.009 0.009 0.009 0.010 0.009 0.009 0.009
Ti
0.000 -0 .001 0.000
-0.002 0.002
-0 .001 -0.002 -0.002 -0 .001
0.001 0.001 0.001
negative delta quantity for an element indicates that the element was extracted from the weld pool due to chemical reactions with the liquid flux. The elements that exhibited significant delta quantities were carbon, manganese and silicon. The delta quantities for these three elements were shown to be independent of heat input in the 1 to 4 MJ/m range. Silicon and manganese had positive delta quantities of 0.10 wt-% and 0.05 wt-%, respectively. However, the compositional changes to the weld pool represented by these delta quantities do not have a significant effect on the hardenability of the weld metal (Ref. 20). Carbon had a negative delta quantity, resulting in a decrease in the weld metal carbon content of approximately 0.01 wt-% to a mean value of 0.081 wt-%. As shown in Table 4, the delta quantities for the remaining alloying elements were negligible.
In general, the weld metal composition was stable with a change in heat input. This stability results primarily from the use of a highly basic flux with a low silica content. Silica is a major oxygen source in submerged arc welding, and thus the low silica content minimizes the oxidation potential of the weld pool (Ref. 21). The delta quantities remained constant with variations in heat input. This observation suggests that variations in wire composition can be conveniently used to make
systematic alterations of the weld metal composition and, thus, weld microstructure and properties. This also suggests that variations in cooling rate with changes in heat input are responsible for the observed microstructural changes discussed below.
Mechanical Properties
The mechanical properties of the weldments varied systematically with heat input. The hardnesses of the weld metal produced in Series I and II on 300- X 51- X 19-mm coupons, and Series III on 690- X 76- X 51-mm coupons are shown in Fig. 1. For all three series, the hardness decreased with an increase in heat input. The hardness of Series I weld metal produced with wire 1 decreased from Rockwell C 38 at 1.2 MJ/m (31 kj/in.) to Rockwell C 31 at 3.7 MJ/m (94 kj/in.). The hardness of the Series ll weld metal produced with wire 2 was consistently lower than that of Series I weld metal, and varied from Rockwell C 37 at 1.2 MJ/m to Rockwell C 29 at 3.7 MJ/m. The thicker plate and the more complex geometry used for Series III resulted in higher cooling rates at a given heat input. Therefore, the Series III weld metal hardnesses produced with wire 1 were consistently higher than the corresponding data for Series I and II weld metal, and varied from Rockwell C 39 at 1.2 MJ/m
to Rockwell C 35 at 3.7 MJ/m. Figure 2 shows the room-temperature
tensile properties of Series ill weld metal as a function of heat input. Both the yield and ultimate tensile strengths decreased and the elongation to failure increased with an increase in heat input. As shown in Fig. 2, an increase in the heat input by a factor of three results in a decrease in the yield strength from 950 MPa (140 ksi) to 850 MPa (120 ksi), a decrease in ultimate tensile strength from 1240 MPa (180 ksi) to 1080 MPa (160 ksi), and an increase in the tensile ductility from 10 to 15%. The data in Fig. 2 correspond directly to the hardness data in Fig. 1.
Energy absorbed and percent brittle fracture versus test temperature transition curves were obtained for ASTM standard 5-mm subsized Charpy V-notch specimens from Series III, IV and V weld metal. The transition curves obtained by plotting all available data for 1.2-, 2.5- and 3.7-MJ/m (30-, 64- and 94-kJ/in.) heat inputs are shown in Figs. 3A, B and C, respectively. There is limited scatter in the data in Figs. 3A, B and C. All welds exhibited a transition from ductile to brittle fracture behavior over the test temperature range investigated. The Series III 1.2-MJ/m weld shows a narrow ductile-to-brittle transition behavior (see Fig. 3A), while the transitions from the upper shelf to the lower shelf for the 2.5-MJ/m and 3.7-MJ/m welds are gradual and occur
160-sl APRIL 1989

45
40
UJ
x u § 35 Uj CO LU
o rx <
30
25
— i 1 1 1 1 r HIGH STRENGTH STEEL WELD METAL
o D •
SERIES SERIES SERIES
I II III
WIRE WIRE WIRE
1 2 1
_l_ _l_
1.0 1.5 2.0 2.5 3.0
HEAT INPUT (MJ/m) 3.5 4.0
Fig. 1 — Rockwell C hardness as a function of heat input for Series I and II single-pass welds produced on 300- X 51- X 19-mm coupons, and for Series III single-pass welds produced on 690- X 76- X 51-mm coupons
1400
1200
1000
800
600
400
HOO 1.0
HIGH STRENGTH STEEL WELD METAL SERIES I I I
• ULTIMATE TENSILE STRENGTH • 0.2% YIELD STRENGTH A TOTAL ELONGATION
20.0
1 5 . 0
2.0 3.0
1 0 . 0
5.0 0
cn LU
a. <
HEAT INPUT (MJ/m)
Fig. 2 —Ultimate tensile strength, 0.2% offset yield strength, and total elongation to failure as a function of heat input for Series III single-pass weld metal
over a range of approximately 100°C (180° F), as shown in Figs. 3B and C, respectively.
To interpret the data shown in Fig. 3, a ductile-to-brittle transistion temperature (DBTT) is defined at 15 J (11 ft-lb) absorbed energy. The fracture appearance transition temperature (FATT) is defined to be at 50% brittle fracture. The 15-J DBTT for Series III weld metal decreases with increasing heat input from - 7 0 ° C (-94°F) at 1.2 MJ/m to -133°C (—207°F) at 2.5 MJ/m and increases slightly to -113°C (-171 °F) at 3.7 MJ/m. Similarly, the 50% FATT decreased with increasing heat input from —90°C (-130°F) at 1.2 MJ/m to -120°C (-184°F) at 2.5 MJ/m and increased slightly to -104°C (-155°F) at 3.7 MJ/m. These trends are shown in Figs. 3A, B and C. The upper-shelf absorbed energy for Series III weld metal, shown in Figs. 3A, B and C, increased from 22 J (16 ft-lb) at 1.2 MJ/m to 32 J (24 ft-lb) at 2.5 MJ/m, and to 34 J (25 ft-lb) at 3.7 MJ/m. The lower shelf of absorbed energy of Series III weld metal remained fairly constant with heat input, 2 J (1.5 ft-lb) at 1.2 MJ/m and 3.7 MJ/m, and 3 J (2 ft-lb) at 2.5 MJ/m.
Series IV and V specimens were tested to determine the effects of reheating on the weld metal mechanical properties. The diamond pyramid hardnesses for Series 111, IV and V as a function of heat
input are shown in Fig. 4. Reheating the weld metal decreases the hardness in all cases. The hardness of Series IV weld metal, heated to 688°C (1270°F), decreases with increasing heat input. This softening corresponds to an aging treatment for steel when heated in the sub-critical temperature range, below the Ac-i. The Series V weld metal hardness increases with increasing heat input. This is due to a secondary strengthening effect occurring in the weld metal, possibly from recrystallization when heated to 832°C (1530°F), in the intercritical temperature range, between the Ac-| and the AC3. Also, austenite formed during inter
critical annealing may transform on cooling to martensite or bainite, producing strengthening.
The effects of reheating on the ductile-to-brittle transition behavior of the weld metal as described by either DBTT or the FATT were also analyzed. The partial transition curves for the reheated weld metal for 1.2-, 2.5- and 3.7-MJ/m heat inputs are shown in Figs. 3A, B, and C, respectively. The DBTT and FATT in Series IV and V are summarized in Table 5 for the 1.2-, 2.5- and 3.7-MJ/m weld metal. The DBTT and FATT are also listed in Table 5 for the Series III, nonreheated weld metal, for reference. Most of the
Table 5—Summary of Ductile-to-Brittle Transition Temperatures (DBTT) and Fracture Appearance Transition Temperatures (FATT)<a>
Series
IV
Property
DBTT (°C)
FATT (°C)
1.2
-50 (-70) -40
(-90)
Heat Input (MJ/m) 2.5
- 1 1 5 ( -133) - 1 0 0
(-120)
3.7
- 1 2 8 (-113)
- 9 5 (-104)
v DBTT (°C)
FATT (°C)
-78 (-70) -68 (-90)
-120 (-133) -95
(-120)
-104 (-113) -80
(-104)
(a) Reheated specimens, Series IV and V, single-pass weld metal produced at 1.2, 2.5 and 3.7 MJ/m, and as-welded Series III weld metal at corresponding heat inputs, in parentheses for reference.
WELDING RESEARCH SUPPLEMENT 1161-s

M B
Z ll
£ i. D _i JJ > 3 --. E 'J* r <* XI n xi E -•».
-7
40
35
30
R 25 m cr
° -~ cn 2 0 CB
5 15 UJ z ^ 10
5
-100 -50 0
TEMPERATURE (°C)
40
35
30
cn 20
cr LU
15
HIGH STRENGTH STEEL
WELD METAL
HEAT INPUT = 2 . 5 MJ/m
10
0 I -250
SERIES NUMBER
III IV V
HEAT TREATMENT
NONE B8B°C B32°C
O • a • A A
ENERGY O O A ABSORBED
PERCENT BRITTLE FRACTURE • • A
100
75
50
25
0
UJ DC
cr CD
-200 -150 -100 -50 0
TEMPERATURE (°C)
50 100 150
B
40
35
30
• 25
cn 20
CD 15 cr
10
1 1 1—
HIGH STRENGTH STEEL
WELD METAL
HEAT INPUT = 3 . 7 MJ/m
SERIES NUMBER
III IV V
HEAT TREATMENT
NONE 688°C 832°C
O • "• • A A
ENERGY OD A ABSORBED
PERCENT BRITTLE FRACTURE •• A
100
75
50
25
cr 3
UJ CL
-250 -200 -150 -100 -50
TEMPERATURE
50 100 150
<°C)
Fig. 3-Energy absorbed and percent brittle fracture versus test temperature transition curves for Series III single-pass weld metal produced at various heat inputs. A - 1.2 MJ/m; B — 2.5 MJ/m; C-3.7 MJ/m
specimens showed an increase in the DBTT and FATT when reheated. The 1.2-MJ/m weld metal was affected most when reheated to 688°C, Series IV, which caused the DBTT to increase 20°C (36 °F) and the FATT to increase 50° C .(90CF). Two combinations of reheating temperature and heat input caused a decrease in the DBTT. The 1.2-MJ/m weld metal DBTT decreased 8°C (14°F) when reheated to 832°C, Series V, while the FATT increased 22°C (39°F) in the same specimens. This situation also occurred in the 3.7-MJ/m weld metal when reheated to 688 °C, Series IV. The weld metal DBTT decreased 15°C (27°F), while the FATT increased 9°C (16°F) when reheated.
The fracture surfaces of the Series III Charpy specimens broken in the upper shelf region of the transition curves showed fully ductile fracture. Decreasing the test temperature through the transition zone caused the fracture to be mixed between ductile and brittle modes until the lower shelf was reached and brittle fracture occurred alone. The fracture surfaces of the 1.2-, 2.5- and 3.7-MJ/m weld samples broken at -196°C (—321 °F), lower shelf, were evaluated with scanning electron microscopy and energy dispersive x-ray spectrometry. The fracture surfaces were compared to the weld metal microstructures. Figure 5 shows the fractographs and the corresponding micrographs of the weld metal at the same magnifications. The weld samples broken at —196°C have brittle fractures with a quasi-cleavage fracture mode. This type of fracture is identified by the flat facets caused by brittle fracture, shown in gray on the fractographs, with very-small tear ridges where ductile fracture occurred, the white network on the fractographs. In general, the fracture surface roughness increased with increasing heat input. The low-heat-input weld, 1.2 MJ/m, exhibits a fairly flat fracture surface with large facets and small steps, as shown in Fig. 5A, corresponding to the large packets with different orientations shown in Fig. 5B. Also shown in Fig. 5A is an arrow oriented parallel to the solidification growth direction. A series of tear ridges, observed parallel to the arrow, indicate that the fracture morphology was controlled by the solidification structure. The 2.5-MJ/m weld metal has a very irregular fracture surface with small facet faces and more tear ridges, shown in Fig. 5C, corresponding to the interlocking or "basket-weave" type structure, shown in Fig. 5D. The fracture surface of the 3.7-MJ/m weld, shown in Fig. 5E, closely resembles that seen in the 2.5-MJ/m weld metal fracture surface, i.e., very irregular with more tear ridge area than that found in the 1.2-MJ/m weld. Figure 5F shows the microstructure of the 3.7-MJ/m weld and the "basket-weave"
162-s|APRIL 1989

type structure. Qualitative analysis, using scanning
electron microscopy and energy dispersive x-ray spectrometry of some of the inclusions on the fracture surfaces of the 1.2- and 2.5-MJ/m welds discussed previously, revealed that the inclusions were all spherical and exhibited several different compositions. The inclusions in the 1.2-MJ/m weld contained large amounts of aluminum and smaller amounts of sulfur, manganese, titanium and iron. Three compositional groups of inclusions were identified on the 2.5-MJ/m weld. One group contained large amounts of aluminum with iron and very small amounts of manganese. A second group consisted almost entirely of manganese and iron. A third group consisted primarily of manganese with small amounts of titanium and sulfur.
Optical Microscopy
Optical microscopy of the Series III welds was performed. Metallographic specimens were prepared in both the transverse and longitudinal directions of weld metal produced at each of the three heat inputs to obtain a three-dimensional representation of the microstructure. The resulting micrographs are presented in Figs. 6 through 8 for the 1.2-, 2.5- and 3.7-MJ/m heat input welds, respectively. Each figure includes a three-dimensional micrograph for specimens etched in Nital (A) and LePera's etch (B). Also included is a schematic drawing illustrating the metallographic specimen orientation.
The transformed structure, as revealed by the Nital etchant and presented in Figs. 6A, 7A and 8A, is very fine and consists primarily of martensite and bainite. The microstructure of the 1.2-MJ/m weld is lath martensite, shown in Fig. 6A, while in the 2.5- and 3.7-MJ/m welds a mixed microstructure is present. Evaluation of the 2.5- and 3.7-MJ/m microstructures in Figs. 7A and 8A in conjunction with the SEM micrographs of these weld metals, shown in Figs. 5D and F, shows the presence of a basket-weave structure with star shapes beginning at inclusions, suggesting the occurrence of nucleation events. In the SEM micrographs, ferrite laths are present, originating from intragranular nucleation sites. These intragranular ferrite laths are also observed in the light micrographs. The appearance of these laths, oriented in several directions and originating from one nucleation site, is similar to acicular ferrite (Ref. 22).
The solidification structure was revealed through the use of LePera's etch. LePera's etch delineates solidification segregation associated with the cored cellular structure. In Figs. 6B, 7B and 8B, the solidification microstructures of the 1.2-, 2.5- and 3.7-MJ/m weld metals, respectively, are shown. The effect of the
450 . HIGH STRENGTH STEEL WELD METAL
400
250
SERIES NUMBER III IV V
HEAT TREATMENT NONE 68B°C 832°C
• •
1.0 2.0 3.0 HEAT INPUT (MJ/m)
Fig. 4 —Diamond pyramid hardness as
| a function of heat . - input for Series III, IV ' and V single-pass
weld metal
Fig. 5 — SEM fractographs of 5-mm subsizedCharpy V-notch specimens broken at— 196°Cand the corresponding SEM micrographs of Nital-etched samples of Series III single-pass weld metal. A and B- 1.2 MJ/m; C and D-2.5 MJ/m; E and F-3.7 MJ/m
Ui
S Q. o _ l LU
>
X o tr < tn
Z ui S Q.
o > ui O -^ X u tr < UJ
tn UJ
tr K-Z UJ
£ Q. o _ l UJ
>
o CE < Ul tn m tr z Ui
s Q. o - J Ui
> Ui Q O tr < Ui to Ui tr \-z Ui £ a. o
> Ui o
o IE < Ui tn Ui CE
WELDING RESEARCH SUPPLEMENT j 163-s

(a)
1.2 MJ /m
20 urn
2% Nital Etch 1.2 MJ /m LaPera 's E tch B
Fig. 6 — Three-dimensional optical micrograph showing transformed microstructure. A, and solidification segregation, B, of Series III single-pass weld metal produced a 1.2 Ml/m, and a schematic drawing showing the orientation of metallography specimens. A—2% Nital etch; B — LePera's etch
\ ,
(a) 20 pm
2.5 M J / m 2% Nital Etch
Fig. 7— Three-dimensional optical micrograph showing transformed microstructure, A, and solidification segregation, B, of Series III single-pass weld metal produced at 2.5 Ml/m, and a schematic drawing showing the orientation of metallography specimens. A—2% nital etch; B —LePera's etch
164-s | APRIL 1989

\ l
(a) 20 um
3.7 MJ/m 2% Nital Etch
Fig. 8 — Three-dimensional optical micrograph showing transformed microstructure, A, and solidification segregation, B, of Series III single-pass weld metal produced at 3.7 MJ/m, and a schematic drawing showing the orientation of metallography performed. A—2% Nital etch; B —LePera's etch
40
35
30
25 E
20 CJ < Q.
15 _J LU CJ
10
1.0
-i 1 1 1 r
HIGH STRENGTH STEEL WELD METAL
0 D
•
SERIES I SERIES II SERIES III
WIRE 1 WIRE 2 WIRE 1
, i i
2 .0 3.0
HEAT INPUT (MJ/m)
4 .0
Fig. 9 — Cell spacing as a function of heat input for Series I, ll and 111 single-pass weld metal
LePera's etchant causes the higher alloy content intercellular region to appear dark gray and the lower alloy content cell cores to appear light gray. Evaluation of these solidification structures revealed that the cell spacing in the Series III weld metal varied with heat input. The cell spacings of Series I and II weld metal were measured in addition to Series III weld metal as a function of heat input, and are shown in Fig. 9. For all three series, the cell spacing increased with heat input. The cell spacing of Series III weld metal increased from 12 to 29 yum with an increase in heat input from 1.2 to 3.7 MJ/m. The cell spacings of Series I and II for any given heat input are significantly greater than that shown for Series III weld metal, corresponding to the slower cooling rates experienced in the Series I and II coupons during the welding operation. In Fig. 8B, the degree of contrast between the high and low solute regions in the high-heat-input weld is much less than in the 1.2- or 2.5-MJ/m weld metals, shown in Figs. 6B and 7B. This suggests a less severe degree of compositional variation between the cell cores and intercellular regions in the 3.7-MJ/m weld than in the 1.2- or 2.5-MJ/m welds. However, it has been shown that compositional differences between the cell cores and intercellular region (the first and last metal to
solidify, respectively) are a function of the bulk weld metal composition and are independent of the solidification rate (Ref. 23).
Transmission Electron Microscopy
Transmission electron microscopy (TEM) performed on the Series III weld metal indicated that the weld metal is, in general, composed of a mixed micro-structure of martensite, bainite and retained austenite. The microstructural constituents were identified according to the classification scheme illustrated in Fig. 10, which was developed from a review of TEM studies performed on wrought steel plate (Ref. 24). In Fig. 10, representative micrographs illustrating the main features of the primary microstructural constituents found in high-strength-steel weld metals are presented. Characteristics delineating differences in the structure are outlined below.
As shown in Fig. 10A, autotempered lath martensite typically has several characteristic features: 1) it has highly dislocated ferrite laths; 2) it has at least two variants in orientation of the temper carbides; and 3) intralath deformation twins are often present, along with the presence of two or more variants of the laths, producing a "weaved" structure with
one variant dominating. A bainitic structure, shown in Fig. 10B,
is a nucleation and growth product. The ferrite laths nucleate via a shear transformation, having a Kurdyumov-Sachs or Nishiyama-Wasserman orientation relationship between the austenite and the bainitic ferritic (Ref. 25). The laths grow rapidly, forming semicoherent interfaces. This occurs at many sites along the prior austenite grain boundary, producing a group of similarly oriented, finely spaced ferrite laths (Ref. 26). As the laths thicken and lengthen, the carbon content of the interlath austenite increases and one of three different possible structures will develop, depending on the transformation temperature and cooling rate. Carbide particles nucleate and grow in the austenite between the ferrite laths, forming interlath carbide particles and producing what is known as upper bainite. In another possible case, the austenite can become stable, due to enrichment via carbon partitioning, and form a stable film between ferrite laths. In the third possible case, carbide precipitates nucleate and grow within the ferrite lath at the advancing interface, producing intralath carbide particles and the structure known as lower bainite. This nucleation and growth process results in a bainitic structure, as shown in Fig. 10B, which is not as
WELDING RESEARCH SUPPLEMENT 1165-s

Fig. 10— TEM micrographs of high-strength steel single-pass weld metal showing classification scheme used to identify important characteristics of microstructures: A — Autotempered lath martensite; B — bainite; C —retained austenite (labeled A)
Fig. 11- TEM micrographs of base plate and Series III single-pass welds showing quenched and tempered martensite in baseplate: A —Autotempered martensite in the 1.2-Mj/m weld metal; B — lath martensite, bainite, and retained austenite; C and D — in the 2.5-MJ/m weld metal; and E and F—in the 3.7-MJ/m weld metal
highly dislocated as the martensite shown in Fig. 10A. Lower bainite contains a single variant of the precipitated carbide particles, often oriented at 60 deg to the ferrite lath (Ref. 25), as well as a single variant of the laths. Comparison of Figs. 10A and B reveals that, while the micro-structures of martensite and bainite may at first seem very similar, major differences in the structure are observable.
Retained austenite can exist along with either martensite or bainite, or with both. As shown in Fig. 10C, the retained austenite, labeled A, is characteristically low in dislocation density and, due to a difference in the thinning characteristics of the austenite and the surrounding matrix, has a different contrast than the martensite or bainite. Conclusive determination of the presence of retained austenite requires the use of electron diffraction to index the face centered cubic lattice.
Transmission electron micrographs of the baseplate and the Series III welds are presented in Fig. 11. The base metal plate was in the quenched and tempered condition. The TEM micrograph shows highly dislocated lath martensite and rounded, elongated temper carbides oriented in three different variants, as shown in Fig. 11A. The microstructure of the Series III weld metal produced at 1.2-MJ/m heat input was found to be autotempered lath martensite and is shown in Fig. 11B. Also shown in Fig. 11B are deformation twins originating along the lath boundary, a high dislocation density, and temper carbides with twofold orientation variants. The 2.5-MJ/m Series III weld metal is composed of a microstructure containing lath martensite, bainite, and retained austenite, and representative micrographs are presented in Figs. 11C and D. Figure 11C shows lath martensite, with two lath variants and a high dislocation density. Bainite was also found in this weld metal, as seen in Fig. 11D. Note the single variant of the laths, and the characteristi-
166-s | APRIL 1989

cally low dislocation density when compared to the martensite of Fig. 11C. No interlath or intralath carbide particles are evident in the bainite of Fig. 11D. This indicates that either the particles are so small they are not resolvable or an enriched film of retained austenite is present between the laths. Further investigation is required to determine which is the case. The microstructure of the 3.7-MJ/m Series III weld parallels the micro-structure of the 2.5-MJ/m Series III weld. Shown in Figs. 11E and F are representative examples of martensite and bainite from 3.7-MJ/m Series III welds. As shown below, limited amounts of ferrite associated with inclusions were present in the 3.7-MJ/m weld.
TEM evaluation of the Series III welds revealed that the 1.2-MJ/m weld metal has a microstructure composed of autotempered lath martensite. The 2.5- and 3.7-MJ/m Series III welds are similar and are a mixed microstructure or autotempered lath martensite, bainite, interlath retained austenite, and limited amounts of inclusion nucleated ferrite.
Preliminary investigation of the effect of weld metal inclusions on the transformation microstructure, using the TEM, revealed that in some cases, the inclusions have an effect on the microstructure, producing intragranular nucleation of ferrite, while in other cases the inclusions have no effect. A specific example is illustrated in Fig. 12, which shows two TEM photomicrographs of weld metal produced at 2.5 MJ/m (Fig. 12A) and 3.7 MJ/m (Fig. 12B), each having an inclusion. The inclusion in the 2.5-MJ/m weld metal appears to have had no effect in the surrounding microstructure, which is bainite. The 3.7-MJ/m weld metal inclusion appears to have served as the nucleation site for several ferrite laths. Thus, the microstructure in this 3.7-MJ/m heat input weld metal is bainite, ferrite and martensite.
Fig. 12— TEM photomicrographs showing the effects of inclusions in the single-pass weld metal microstructure: A —Series 111 2.5-Mf/m weld; B —Series III 3.7-MJ/m weld
essentially constant with heat input. In addition, reheating after welding decreased the weld metal toughness in comparison to the as-welded properties.
Structural designs usually specify minimum requirements of weld metal strength and toughness. To maximize the heat input that results in acceptable mechanical properties, the microstructural constituents that produce the properties must first be identified. This investigation identified the specific features of the high-strength-steel weld metal micro-structural constituents so that proper property-structure relationships result. With these results, modifications to the welding consumables must be made so that the desired microstructure develops over a wider range of heat inputs. To illustrate the implications of this study, assume that a particular design required properties that were developed in the 2.5-MJ/m weld, with a yield strength of 950 MPa (138 ksi) and a ductility of 13%, but produced at heat input ranges of 1 to 4 MJ/m. The microstructure developed at 2.5 MJ/m consisted of a mixture of autotempered martensite with some bainite, an amount sufficient to break up
the large martensite colonies, producing a material with an effective colony size that is significantly less than the austenite grain size.
To interpret microstructural development in weld metal, consider the schematic continuous cooling transformation (CCT) diagram shown in Fig. 13. Based on the microstructural analysis discussed above, Fig. 13 represents the transformation behavior of the weld metal in this study. In addition, cooling curves representative of the three primary heat inputs—1.2, 2.5 and 3.7 MJ/m —are shown. The highest cooling rate, analogous to the 1.2-MJ/m weld, is shown to intersect only the martensite start curve. The medium cooling rate, 2.5-MJ/m weld, intersects the nose of the bainite curve, while the slowest cooling rate for the highest heat input intersects the ferrite nose and the bainite curve at longer times. To produce a given set of micro-structural constituents over a wider range of heat inputs, the weld metal chemical composition must be modified to shift the relative positions of the phase boundaries on the CCT diagram so that a wider range of cooling rates intersect the same phase fields. For example, an increase in
Discussion
An increase in heat input was shown to produce systematic changes in both properties and microstructures of high-strength-steel weld metal. With an increase in heat input, the strength decreased, toughness increased, and the microstructure changed from a primarily martensitic structure to a mixed structure of martensite, bainite and retained austenite, with limited amounts of inclusion-nucleated ferrite at the highest heat input. Associated with the transition in transformation-controlled microstructural constituents, the cell spacing also increased with heat input. As revealed by the delta quantity analysis, the microstructural changes with heat input occurred without a change in weld metal composition, as the composition of the weld pool was
rr 3 < a:
LU
LOW MEDIUM (HEAT INPUT)
HIGH
Fig. 13 —Schematic of continuous cooling transformation (CCT) curve of weld metal produced in Series III
log time
WELDING RESEARCH SUPPLEMENT 1167-s

the average carbon equivalent (Ref. 24) wi l l stabilize the austenite, resulting in a shift of the bainite and ferr i te regions to longer t imes. W e l d metal inclusions, wh ich are k n o w n to nucleate ferr i te in lower-strength-steel w e l d metal (Ref. 27), w e r e s h o w n to have a mixed effect o n the deve lopment of microstructures in high-strength-steel w e l d metal . The extent t o wh i ch the posit ions of the phase boundaries can be mod i f ied is undef ined and is the focus of an ongo ing research p rogram (Ref. 28). Howeve r , it is apparent that in addi t ion to the carbon equivalent, the inclusion concentrat ions must be l imited to cont ro l the posi t ion of the ferr i te f ield. The challenge, as ident if ied in this study, is to deve lop f lux-wire combinat ions that mod i fy the cont inuous cool ing t ransformat ion behavior t o p roduce stable microstructures of martensite w i t h some bainite over a w ider range o f cool ing rates.
Conclusions
1) W e l d metal composi t ions in l o w -carbon, 5 w t - % nickel C r - M o high-strength steel are insensitive to heat input in submerged arc we ld ing w h e n a highly basic flux w i th a l o w oxygen potent ia l is uti l ized.
2) A n increase in heat input results in a decrease in yield strength, ult imate tensile strength and hardness, and an increase in toughness and ducti l i ty.
3) The change in microstructure w i t h an increase in heat input in the w e l d metal of a l ow-ca rbon 5 w t - % nickel C r - M o steel develops as the result o f a decrease in the cool ing rate associated w i t h an increase in heat input. The micro-structure changes f r o m au to tempered martensite at the lowest heat input t o a complex mixture of martensi te, bainite and retained austenite at the higher heat inputs.
4) For an opt imal balance o f strength and toughness, a mixed microstructure of au to tempered martensite w i t h some bainite is requi red.
A ckno wledgments
The authors acknowledge the research support p rov ided by the Of f i ce of Naval
Research. The assistance of R. A. M c G r e w in foi l preparat ion and TEM operat ion is greatly apprec iated.
References
1. Hrivnak, I. 1978. The mutual relationship and interdependence of developments in steel metallurgy and welding technology. Welding in the World 16 (7): 130-151.
2. Ikama, H., Oshige, H., and Tanque, T. 1980. Effect of martensite-austenite constituent on HAZ toughness of a high strength steel. Transactions of Japan Welding Society 11 (2): 50-59.
3. Suzuki, H. 1983. Root cracking and maximum hardness in high-strength steel welds. IIW Doc. IX-1280-83.
4. Dolby, R. E., and Knott, J. F. 1972. Toughness of martensitic and martensitic-bainitic microstructures with particular reference to heat-affected zones in welded low-alloy steels. Journal of Iron and Steel Institute (November): 857-865.
5. Codden, M. J., and Boyd, J. D. 1981. Characterization of microstructures in weld heat-affected zones by electron microscopy. Microstructural Science 9: 343-354.
6. Cabelka, J., and Million, C. 1966. The weldability of high strength steels. British Welding Journal (October): 587-593.
7. Surian, E., Trotti, J., Casamelli, A. N., and deVedia, L. A. 1987. Influence of Mn content in mechanical properties and microstructure of a high strength M.M.A. electrode weld metal. IIW Doc. ll-A-724-87.
8. Konkol, P. J., Rathbone, A. M., and Gross, J. H. 1966. Development of 170/200 ksi yield strength Ni-Cr-Mo-Co weld metals for constructional steels. Welding Journal 45 (12): 525-s to 539-s.
9. Saunders, G. G. 1977. Effect of major alloying elements on the toughness of high strength weld metal. Welding Institute 7 (2): 91-119.
10. Nippes, E. F., Savage, W. F., and Paez, J. M. 1959. Transformational behavior of Mn-Mo armor steels. Welding Journal 18 (12): 475-s to 481-s.
11. Bell, R. A., Clark, D. C , and Howden, D. G. Development of low cost filler materials for welding high strength steels. The Ohio State University Research Foundation Report, submitted to the Office of Naval Research, April 29, 1984.
12. Krauss, G. 1983. Tempering and structural change in ferrous martensitic structures. Phase Transformations in Ferrous Alloys, A. R. Marder and ). I. Goldstein, eds. Conference Proceedings, AIME, Philadelphia.
13. Huppi, G. S. Reheat zone microstructural development and toughness in selected HSLA steel weld metals. Ph.D. Thesis, No. T-3175, Colorado School of Mines, May 1986.
14. Fleck, N. A., Grong, O., Edwards, G R., and Matlock, D. K. 1986. The role of filler wire and flux composition variation in submerged arc weld metal transformation kinetics. Welding Journal b5 (5): 113-s to 121-s.
15. Deb, P., Challenger, K. D., and Therrien, A. E. 1987. Structure-property correlation of submerged-arc and gas-metal-arc weldments in HY-100 steel. Metallurgical Transactions 18A (June): 987-999.
16. LePera, F. S. 1980. Imposed etching techniques to emphasize martensite and bainite in high-strength dual-phase steels. Journal of Metals (March): 38-39.
17. ASTM Handbook, Spec. E8-82. Tension Testing of Metallic Materials. 1982.
18. ASTM Handbook, Spec. E23-82. Notched Bar Impact Testing of Metallic Materials. 1982.
19. Dallam, C. B., Liu, S„ and Olson, D. L. 1985. The influence of CaO-CaF-Si02 welding flux system on the welding of niobium microalloyed HSLA steel. Welding Journal'64 (5): 140-s to 151-s.
20. Siebert, C. A., Doane, D. V., and Breen, D. H. 1977. The Hardenability of Steels. ASM International, Metals Park, Ohio: 87-91.
21. Jackson, C. E. 1973. Fluxes and slags in welding. Welding Research Council Bulletin 190.
22. Liu, S. The role of non-metallic inclusions in controlling weld metal microstructures in niobium microalloyed steels. Ph.D. Thesis, No. T-2923, Colorado School of Mines, May 1984.
23. Bowen, T. F., Brody, H. D., and Flemings, M. C. 1966. Solute redistribution in dendritic solidification. Transactions AIME 236: 615-624.
24. Krauss, G. 1980. Principles of Heat Treatment of Steel. ASM International, Metals Park, Ohio: 212-215.
25. Pickering, F. B. The structure and properties of bainite in steel. Transformation and Hardenability in Steels, Symposium Proceedings, Climax Molybdenum Company of Michigan, Ann Arbor, 1967.
26. Porter D. A., and Easterling, K. E. 1981. Phase Transformations in Metals and Alloys. Van Nostrand Reinhold, Berkshire: 334-337.
27. Grong, O., and Matlock, D. K. 1986. Microstructural development in mild- and low-alloy steel weld metals. International Metals Reviews 31 (1): 27-47.
28. Ramsay, C. W. Research in progress. Colorado School of Mines, 1988.
168-s|APRIL 1989