Significance of Methylthioadenosine Metabolism to Plant ...
302
Significance of Methylthioadenosine Metabolism to Plant Growth and Development by Chammika Ishari Waduwara-Jayabahu A thesis presented to the University of Waterloo in fulfillment of the thesis requirement for the degree of Doctor of Philosophy in Biology Waterloo, Ontario, Canada, 2011 ©Chammika Ishari Waduwara-Jayabahu 2011
Transcript of Significance of Methylthioadenosine Metabolism to Plant ...

Significance of
Methylthioadenosine Metabolism to
Plant Growth and Development
by
Chammika Ishari Waduwara-Jayabahu
A thesis
presented to the University of Waterloo
in fulfillment of the
thesis requirement for the degree of
Doctor of Philosophy
in
Biology
Waterloo, Ontario, Canada, 2011
©Chammika Ishari Waduwara-Jayabahu 2011

ii
Author’s Declaration
I hereby declare that I am the sole author of this thesis. This is a true copy of the thesis,
including any required final revisions, as accepted by my examiners.
I understand that my thesis may be made electronically available to the public.

iii
Abstract
Arabidopsis thaliana contains two genes annotated as methylthioadenosine nucleosidases
(MTN): MTN1, At4g38800 and MTN2, At4g34840. This enzyme activity hydrolyzes the
methylthioadenosine (MTA) produced by nicotianamine (NA), polyamine (PA), and ethylene
biosynthesis to methylthioribose (MTR) within the Yang cycle. Comprehensive analysis of the
mtn1-1mtn2-1 mutant line with 14 % residual MTN activity revealed a complex phenotype that
includes male and female infertility and abnormal vascular development. Based on metabolite
profiling, mtn1-1mtn2-1 has a reduced NA content, altered PA profiles with higher putrescine
(Put) and lower spermidine (Spd) and spermine (Spm) levels, disrupted metal ion profiles, and
abnormal auxin distribution. The modeling of Arabidopsis PA synthases developed by
comparison with the crystal structures of human Spd and spermine synthases complexed with
MTA suggests that Arabidopsis PA synthases are product inhibited by MTA. Thus, these
pleiotropic mutant phenotypes possibly are the result of one metabolite directly inhibiting
numerous pathways.
By creating and analyzing a series of mutants and transgenic lines with moderate levels of MTN
activity the complex phenotype of mtn1-1mtn2-1 was dissected in order to determine the
fundamental trait associated with MTN deficiency. Two double mutants were identified by
crossing single T-DNA mutants, and an artificial micro RNA (amiRNA) line was generated by
transforming mtn1-1 with amiRNA specific to MTN2. The T-DNA double mutants, mtn1-4mtn2-
1, and mtn1-1mtn2-5 had 98 % and 28 % MTN activity, respectively, whereas the amiRNA line
has 16 % MTN activity. The growth, development, and metabolite analysis of these mutants
revealed that their delayed bolting, correlated with an increased number of leaves, was the
common trait observed across all lines. Xylem proliferation defects and increased number of
vascular bundles per unit area were shared in all lines except mtn1-4mtn2-1. Based on these

iv
results, auxin distribution is proposed as the key target of the accumulated MTA that results
from MTN deficiency.
The infertility related to MTN-deficiency was restored by supplying 100 µM of Spd to the mtn1-
1mtn2-1 seedlings over 14 days. The data presented in this thesis reveals two potential links
that work synergistically to recover fertility in this mtn1-1mtn2-1 line. Based on a detailed
analysis of the female gynoecia morphology, transcript, hormone and metabolite profiles, it is
proposed that the Spd partially reverses the mutant phenotypes through the recovery of auxin
distribution and /or vascular development. Interestingly, the Spd effect seems to be
transgenerational: they give rise to plants that are genotypically mtn1-1mtn2-1 but
phenotypically WT over generations. Taken together, all of the results suggest that MTN-
deficient mutants provide the potential for unraveling the molecular mechanism associated
with nicotianamine, polyamines, auxin, and vascular development with respect to enhancing
the efficiency of nutrient use and yields in plants.

v
Acknowledgements
First, I would like to thank my supervisor, Prof. Barb Moffatt. Barb, I am without the words to
express how thankful I am to you. You have stood by me, encouraged me, guided me, and
helped me develop in to a confident scientist. I know that sometimes I was difficult to handle,
but you always managed me with great patience. You have been a model for me in many ways
and have also played many roles in my life, from tough master to comforting soul. For all of
your contributions to the person I have become, not only in a scientific context but also in day-
to-day life situations, I owe you the greatest possible gratitude.
To my committee members, Dr. Susan Lolle, Dr Frederique Guinel, and Dr. Simon Chuong (not
in a particular order), I am indebted to all three of you for the invaluable expertise, suggestions,
and guidance you provided during the committee meetings what have made this project a
success. I would also like to thank each of you individually for inspiring me in your own special
ways:
Susan, you always had an encouraging word for me even when I met you in the hallway
for a quick question. I especially thank you for supervising my work during Barb’s
sabbatical. Your suggestions were always valuable, but particularly in the case of my
proposal for the NSERC-summer-Japan scholarship, they helped to make my application
outstanding.
Dr. Guinel, you have inspired me in many ways especially with respect to your
meticulous method of editing scientific writing. You have been there to discuss scientific
issues or how to focus on writing a paper, and you have gone even beyond expectations
to lend me your literature collection when needed it.
Simon, I feel very fortunate to have had your “gentle” criticism throughout my graduate
career: you were there as a committee member when I defended my MSc thesis in
2007, and four years later you were in the same position at my PhD defense. It was

vi
because of your advice, that I hold my basic knowledge of plant anatomy and physiology
as a source of pride.
I would also like to thank my external supervisors, Prof. Jim Mattson and Dr. Betsy Daub, for
devoting their precious time to the reading of my thesis and for critically evaluating my current
knowledge.
I give special thanks to all who contributed toward the success of this project. I would certainly
not have been able to progress as far as I have without all of your hard work.
Our collaborators Prof. Rudiger Hell and Dr. Markus Wirtz from the University of
Heidelberg, Germany; Prof. Margret Sauter and Yasmin Oppermann from
Universität Kiel, Germany; Prof. Hitoshi Sakakibara and Dr. Nori Nakamichi from
RIKEN Japan; and Prof. Taku Takahashi and Dr. Jun-ichi Kekahi, Okayama University,
Japan.
The undergraduate students of the Moffatt laboratory, who assisted me technically
in conducting many parts of this project: Olga Kazberova, Andy Kong, Lilian Lee,
Farah El-zarkout, Ahmed Elzahabi, Danielle Menezes, Shantel Menezes, Marie
Leung, Roba Bdeir, Zachary, T. Hull, Natasha Peer, Kameisha Parkins.
Sarah Schoor, former graduate student of Moffatt laboratory, who initiated the
work presented in this thesis, and, Tzann-Wei Wang and Qifa Zheng, research
associates of Thompson laboratory, who provided assistance with the two
dimentional gel electrophoresis.
The providers of greatly appreciated expert knowledge throughout this project:
Prof. Jaideep Mathur, University of Guelph for microscopic analysis of the mutant;
Prof. Sheila Macfee, University of Western Ontario, Canada, for ionomic analysis;
and Dr. Alexander N. Plotnikov for MTA inhibition modelling.

vii
Yong Li, technician of Moffatt laboratory, who taught me technical skills, guided me
in designing the cloning and RT-PCR experiments, and gave his fullest support
during critical experiments for the project.
The kind gifts of the seeds of the auxin reporter line DR5rev::GFP, the NA
overproducing Arabidopsis K1 line, and tkv from J. Friml (Ghent University,
Belgium), Pierre Czernic (Université Montpellier, France), and Timothy Nelson (Yale
University, USA), respectively. Prof. W.D. Kruger, Fox Chase Cancer Center,
Philadelphia who donated the hMTAP cDNA; and Prof. M. Niitsu of the Faculty of
Pharmaceutical Sciences, Josai University, who provided Tspm.
I would like to thank all the sources that provided funding during my PhD program: Ontario
Graduate Student scholarships (OGS), the NSERC discovery grant, the NSERC summer Japan
scholarship, travel and other bursaries from the Graduate Student Office, University of
Waterloo; graduate student scholarships and research and teaching assistantships from the
Department of Biology, University of Waterloo.
My profound thanks to Prof. Carol Peterson and Dr. Arunika Gunewardana: Carol for giving me
the opportunity to come to Canada, igniting the scientist in me and guiding me in the building
of a firm foundation in plant knowledge, and Arunika for connecting me with Carol and making
my dream of graduate studies in Canada a reality.
To all my colleagues at the University of Waterloo, including Katja Engle, Sarah Schoor, Dr.
Sanghyun Lee, Tony Facciuolo, Makoto Yanagisawa, and Terry (Shiu Cheung) Lung, and to those
at RIKEN, Japan, I thank you for sharing your knowledge and expertise whenever I needed it
and also for making the lab a fun place to work.

viii
I am extremely grateful for the faculty, staff, and students of the Department of Biology. Very
special thanks go to Linda Zepf, for always lending me a shoulder to lean on when things were
not going well at my end. And to Dr. Mungo Marsden and Dr. Simon Chuong, thank you for
letting me use your microscopes. Lynn Hoyles was there to guide and advise me every time I
encountered problems with my plants on chambers and even with totally unrelated other
matters. Thank you Lynn, for always taking care of my problems right away. Dale Weber
deserves special thanks for teaching me the fundamentals of confocal microscopy and helping
me out in every possible way, whether related to microscopy or not. I also owe Jeannie
Redpath-Erb and administrative staff, Gracia Murase, Karen Miinch, Daryl Enstone, and, Ron
Socha, thanks for their assistance in a variety of ways during the last four years. I am grateful to
Dragana Miskovic and Cheryl Duxbury for trusting in me during TA assignments.
I would like to thank Barbara Trotter for editing this thesis and Erin Harvey for her assistance
with the statistical analysis.
I have greatly appreciated all my friends who have been so supportive during this period
especially Suramya Mihindukulasekara and Chithral Angammana for assistance and initial
support with respect to statistical analysis and for providing technical support for setting up the
hydroponic system, respectively. I thank Rasanie Padmathilake for her assistance in tying up the
ends of this thesis.
To my parents and my brother’s family, I am so grateful for all your love and the confidence you
have placed in me. Thaththi (Dad), I lost you when I was four-years-old, but I wish you were
here to witness this happy moment. Amma (Mom), thank you for all that you have done for me,
including sacrificing your happiness to raise me, provide me with a good education, and taking
over the household work so I could concentrate writing the thesis. Ayya (brother) I thank you

ix
for taking over the role of father and for taking care of my mother when she was severely ill so
that I could continue my Ph.D. studies. I thank Krishmali Alles (sister-in-law) for taking care of
the family during these difficult times. Uncle Marinus (Van prattenburg) and aunty Marie (Van
prattenburg), thank you for all your help and encouragement from the moment you heard
about our decision to come to Canada up until now.
Anthony (Adikari) uncle, you taught me the importance of education. Here I am at the highest
education level one can achieve, and for that I owe you a debt of gratitude. A very special
thanks goes to my father-in-law, Karunarathna Jayabahu, who is working on a PhD in his late
60s. Thaththa, you were my motivation to keep going when times were difficult and I wanted to
step away. Fr. Roy Mariarathnam, you deserve a huge thank you for exposing me to advanced
technology during the early stages of my education.
Nandana, I know I have not been the best wife or best mom for Dylan for most of my graduate
career especially during the last few months of writing my thesis. Thankfully, you both have
been very understanding and have stood beside me very patiently. What I desire from the
bottom of my heart is to be a better wife and mother with the completion of this Ph.D.
Above all, I give thanks to the GOD almighty, for the wonderful blessing he has bestowed on me
by surrounding me with all of the people who have helped me in various ways and at various
times during my journey towards the successful completion of this thesis. God Bless You all!

x
Dedication
To the two most wonderful men in my life
One of you is just two months older than the initiation of the work presented in this thesis
whereas the other one receives all the credit for inspiring me to continue my studies to earn a
PhD and for being the pillar that has held me together so that I could successfully complete
this thesis.
To my husband Nandana Jayabahu
and
my son Dylan Jayabahu.
Both of you have made enormous sacrifices just to keep up with me during the past four years
of my journey.
Dylan, you are the best son a mother could ever wish for, and
Nandana I am nothing without you and your guidance.
I am enormously blessed to have you both in my life.
I love you both, and I dedicate this most precious document of my life to both of you with
gratitude.

xi
Table of Contents
Author’s Declaration ............................................................................................................. ii
Abstract ............................................................................................................................... iii
Acknowledgements ............................................................................................................... v
Dedication ............................................................................................................................. x
Table of Contents ................................................................................................................. xi
List of Figures ..................................................................................................................... xvii
List of Supplemental Figures ................................................................................................. xx
List of Tables ....................................................................................................................... xxi
List of Supplemental Tables ................................................................................................ xxii
List of Abbreviations .......................................................................................................... xxiii
Chapter 1 : General Introduction ........................................................................................... 1
1.1 The model plant Arabidopsis ................................................................................................ 1
1.2 Network of essential pathways linked by 5’-Methylthioadenosine nucleosidase activity ... 2
1.2.1 Yang cycle/Met recycling pathway ................................................................................. 2
1.2.2 Met/transmethylation cycle ......................................................................................... 14
1.3 Methylthioadenosine nucleosidase .................................................................................... 14
1.3.1 Plant MTNs ................................................................................................................... 16
1.3.2 MTN-deficient plants .................................................................................................... 19
1.4 Plant development and the role of hormones .................................................................... 21
1.4.1 General growth and development ............................................................................... 21
1.4.2 Reproductive development .......................................................................................... 22
Data source: Boyes et al. (2001) ............................................................................................ 24
1.4.3 Vascular development .................................................................................................. 35
1.5 Objectives of the research .................................................................................................. 46

xii
Chapter 2 : Recycling of methylthioadenosine is essential for normal vascular development
and reproduction in Arabidopsis thaliana ............................................................................ 47
2.1 Overview ............................................................................................................................. 47
2.2 Introduction ......................................................................................................................... 48
2.3 Methods .............................................................................................................................. 52
2.3.1 Plant material and growth conditions .......................................................................... 52
2.3.2 Microscopy ................................................................................................................... 52
2.3.3 Chemical complementation experiments .................................................................... 54
2.3.4 Extraction of NA from K1 plants ................................................................................... 55
2.3.5 Complementation of mtn1-1mtn2-1 ............................................................................ 55
2.3.6 RT-PCR .......................................................................................................................... 56
2.3.7 MTN enzyme assay ....................................................................................................... 57
2.3.8 Polar auxin transport assay. ......................................................................................... 57
2.3.9 Immunoblot analysis .................................................................................................... 57
2.3.10 Two- dimensional electrophoresis ............................................................................. 58
2.3.11 Determination of PA content ..................................................................................... 58
2.3.12 Determination of NA content ..................................................................................... 58
2.3.13 Determination of MTA content .................................................................................. 59
2.3.14 Detection of metal contents ....................................................................................... 59
2.3.15 Modeling of MTA inhibition for Tspm synthase and Spd synthase 1 ......................... 59
2.4 Results ................................................................................................................................. 60
2.4.1 MTN activity in mtn1-1mtn2-1 mutants reflects decreased transcript and protein
abundance ............................................................................................................................. 60
2.4.2 MTN deficiency affects both vegetative and reproductive development ................... 62
2.4.3 The mtn1-1mtn2-1 phenotype complemented by MTN1 over-expression ................. 69
2.4.4 The basis of mtn1-1mtn2-1 phenotype is accumulation of MTA, not loss of MTR...... 69

xiii
2.4.5 Modeling of Spd synthase and Tspm synthase complexed with MTA ......................... 71
2.4.6 mtn1-1mtn2-1 plants exhibit altered PA profiles. ........................................................ 73
2.4.7 MTN-deficiency results in altered NA levels ................................................................ 75
2.4.8 Exogenous feeding of PA and NA partially restored fertility of mtn1-1mtn2-1 ........... 77
2.5 Discussion ............................................................................................................................ 80
2.5.1 MTA accumulation is the basis for mtn1-1mtn2-1 phenotype .................................... 80
2.5.2 MTA binds NA synthase, SPD synthase, SPM synthase and TSPM synthase ............... 82
2.5.3 Molecular basis of the altered vascular development of mtn1-1mtn2-1 .................... 82
2.5.4 NA deficiency of mtn1-1mtn2-1 causes altered ion homeostasis leading to interveinal
chlorosis and reproductive abnormalities ............................................................................. 84
2.5.5 Restoration of seed set in mtn1-1mtn2-1 .................................................................... 84
2.6 Conclusion ........................................................................................................................... 86
2.7 Data contributed by others. ................................................................................................ 86
2.8 Supplemental material ........................................................................................................ 87
Chapter 3 : Dissecting the complex phenotypes associated with 5’-methylthioadenosine
nucleosidase deficiency ....................................................................................................... 93
3.1 Overview ............................................................................................................................. 93
3.2 Introduction ......................................................................................................................... 94
3.3 Methods .............................................................................................................................. 99
3.3.1 Plant materials and growth conditions ........................................................................ 99
3.3.2 Plate and soil-based growth assays .............................................................................. 99
3.3.3 Generation and identification of the amiRNA MTN-deficient mutants ....................... 99
3.3.4 Development of double-mutant lines ........................................................................ 100
3.3.5 Screening for MTN-deficient double mutants ............................................................ 100
3.3.6 Microscopic analysis ................................................................................................... 101
3.3.7 MTN assay and measurement of MTA and NA .......................................................... 101

xiv
3.4 Results ............................................................................................................................... 102
3.4.1 Mutant generation ..................................................................................................... 102
3.4.1.2 MTN-deficient artificial microRNA (amiRNA) lines.................................................. 102
3.4.2 Detailed analysis of the mtn1-1mtn2-1 mutant phenotype ...................................... 103
3.4.3 Variations in the PA-related phenotypes and the degree of MTN-deficiency ........... 109
3.4.4 Alteration of NA-related phenotypes of MTN-deficient mutants .............................. 118
3.4.5 Ethylene-related alterations of the phenotype of MTN-deficient mutants............... 119
3.4.6 Variable MTN activity in different allelic combinations and amiRNA lines ................ 119
3.4.7 Variable MTA content in the leaves of MTN-deficient mutants ................................ 121
3.4.8 NA content in MTN-deficient lines ............................................................................. 121
3.5 Discussion .......................................................................................................................... 125
3.5.1 MTN activity and phenotypes of the MTN-deficient lines ......................................... 125
3.5.2 Effect of MTN-deficiency on the embryo and seed development of MTN-deficient
mutants ................................................................................................................................ 126
3.5.3 Correlation of the variable level of MTN activity with altered xylem proliferation ... 128
3.5.4 Possible reduction in ethylene biosynthesis resulting from MTN deficiency ............ 129
3.5.5 Delayed emergence of inflorescence stems in MTN-deficient plants ....................... 129
3.5.6 Correlation of the MTN activity and the metabolite levels of the MTN-deficient lines
with their phenotypes ......................................................................................................... 131
3.6 Conclusion ......................................................................................................................... 134
3.7 Technical assistance by others .......................................................................................... 134
3.8 Supplemental material ...................................................................................................... 135
Chapter 4 : Spermidine-Dependent Fertility Recovery of mtn1-1mtn2-1 ............................. 146
4.1 Overview ........................................................................................................................... 146
4.2 Introduction ....................................................................................................................... 147
4.3 Methods ............................................................................................................................ 150
xv
4.3.1 Plant material and growth conditions ........................................................................ 150
4.3.2 Microscopic analysis ................................................................................................... 151
4.3.3 Microarray analysis ..................................................................................................... 152
4.3.4 Hormone analysis ....................................................................................................... 152
4.3.5 Metabolite analysis..................................................................................................... 153
4.4 Results ............................................................................................................................... 154
4.4.1 Defective reproductive development of MTN-deficient plants ................................. 154
4.4.2 Reduced MTA levels in flowers restored by exogenous Spd ..................................... 157
4.4.3 Increased Cytokinin, Auxin, and Gibberellic Acid Content in mtn1-1mtn2-1 compared
to those in the WT ............................................................................................................... 159
4.4.4 Spd-reduced IAA and CK levels in the mtn1-1mtn2-1 ................................................ 159
4.4.5 Restoration of the normal endomembrane system transcript profile with Spd
treatment ............................................................................................................................. 161
4.4.6 Spd responses in Yang cycle-related transcripts ........................................................ 168
4.4.7 Increased H2O2 production in Spd-fed seedlings ....................................................... 169
4.4.8 Vasculature, embryos, and auxin distribution of restored branches ......................... 172
4.4.9 Transgenerational effects of Spd that give rise to WT-looking mtn1-1mtn2-1 plants
............................................................................................................................................. 174
4.5 Discussion .......................................................................................................................... 176
4.5.1 Spd and vascular development .................................................................................. 176
4.5.2 Spd and reproductive development ........................................................................... 177
4.5.3 Spd effects on the Yang cycle and SAM utilization activities ..................................... 178
4.5.4 Metabolic mechanism for Spd-dependent fertility recovery ..................................... 179
4.5.5 Metabolic recovery versus epigenetic recovery ........................................................ 180
4.6 Conclusion ......................................................................................................................... 182
4.7 Technical assistance by others .......................................................................................... 182

xvi
4.8 Supplemental Material ...................................................................................................... 183
Chapter 5 : Significant contributions and future directions ................................................. 203
Appendix 1 ........................................................................................................................ 209
Appendix 2 ........................................................................................................................ 219
Appendix 3 ........................................................................................................................ 236
Appendix 3 ........................................................................................................................ 236
References ........................................................................................................................ 262

xvii
List of Figures
Figure 1.1: Yang cycle and activated Met cycle in Arabidopsis. ................................................. 3
Figure 1.2: Biosynthetic pathway of polyamines in plants. ........................................................ 5
Figure 1.3: Biochemical pathway and chemical structure of nicotianamine (NA). .................. 11
Figure 1.4: Yang cycle reactions and. MTA hydrolysis reaction ............................................... 15
Figure 1.5: Sequence alignment and pylogenetic tree of MT. ................................................. 17
Figure 1.6: Expression pattern of the Arabidopsis MTN1 in leaf tissues. ................................. 20
Figure 1.7: Representative growth stages of Arabidopsis ........................................................ 23
Figure 1.8: The Arabidopsis flower 25
Figure 1.9: Development of Arabidopsis reproductive organs. ................................................ 27
Figure 1.10: Pollen development .............................................................................................. 28
Figure 1.11: Hormones at a later stage of flower development .............................................. 29
Figure 1.12: Embryo sac development ..................................................................................... 31
Figure 1.13: Arabidopsis embryogenesis. ................................................................................. 33
Figure 1.14: Schematic representation of the organization of the primary vascular tissues
in Arabidopsis ............................................................................................................................ 37
Figure 1.15: Schematic model of xylem formation................................................................... 39
Figure 1.16: Factors effecting vascular development............................................................... 41
Figure 1.17: The molecular mechanism of auxin transport ...................................................... 43
Figure 1.18: Model showing the direction of auxin movement, leaf primodia initiation, and
vascular strand formation ......................................................................................................... 45
Figure 2.1: Overview of enzymatic reactions that generate 5'- methylthioadenosine (MTA) . 49
Figure 2.2: MTN transcript and protein abundance with corresponding enzyme activity ...... 61
Figure 2.3 : Vegetative phenotypes of mtn1-1mtn2-1 compared to WT. ................................ 64
Figure 2.4: Polar auxin transport and stem vascular arrangement .......................................... 66

xviii
Figure 2.5: Reproductive abnormalities of mtn1-1mtn2-1 ....................................................... 68
Figure2.6: Complementation of mtn1-1mtn2-1 phenotype by MTN1, MTA concentration and
complementation of mtn1-1mtn2-1 phenotype by hMTAP. .................................................... 70
Figure 2.7: Structural basis for inhibition of Spd synthase 1 and Tspm synthase enzymes by
MTA ........................................................................................................................................... 72
Figure 2.8: PA profiles and two dimensional gels showing eukaryotic initiation factor 5A
(eIF5A) ....................................................................................................................................... 74
Figure 2.9: Nicotianamine content and metal profiles of leaves and buds. ............................. 76
Figure 2.10: Exogenous NA and PA restored the fertility phenotype of mtn1-1mtn2-1.......... 78
Figure 3.1: Pathways affected by MTA accumulation .............................................................. 95
Figure 3.2: Gene structure of MTN genes .............................................................................. 104
Figure 3.3: Total number of rosette leaves of MTN-deficient lines. ...................................... 105
Figure 3.4: Delayed bolting phenotype of MTN-deficient plants. .......................................... 108
Figure 3.5: The mature phenotype of MTN-deficient lines. ................................................... 110
Figure 3.6: Shoot architecture of the mature plant or architecture of the mature plant shoots
.............................................................................................................................................. 112
Figure 3.7: Leaf vein pattern and pollen tube growth of mtn1-1mtn2-1 compared to WT. .. 114
Figure 3.8 Vascular phenotype of MTN-deficient mutants/lines. .......................................... 116
Figure 3.9: Time taken for the leaf edges to become yellow (senescence). .......................... 120
Figure 3.10: MTN activity of MTN-deficient plants. ............................................................... 122
Figure 3.11: MTA concentration of MTN-deficient lines. ....................................................... 123
Figure 3.12: NA content of MTN-deficient lines. .................................................................... 124
Figure 3.13: Schematic summary that illustrates the primary developmental defects of the
MTN-deficient mutant ............................................................................................................ 132
Figure 4.1: Polyamine biosynthesis, catabolism, and links to the Yang cycle and eIF5A ....... 148
Figure 4.2: Floral organ defects in the mtn1-1mtn2-1 ........................................................... 156
xix
Figure 4.3: mtn1-1mtn2-1 ovule development and pistil morphology compared to those of
the WT. .................................................................................................................................... 158
Figure 4.4: Met cycle-related metabolites of stage 14 flowers. ............................................. 160
Figure 4.5: Hormone profiles of the floral organs . ..................................................... 162
Figure 4.6: Hormone content of 14-day-old mtn1-1mtn2-1 compared to that of the WT. .. 164
Figure 4.7: Hormone changes during flower development. ................................................... 165
Figure 4.8: Histochemical DAB staining to detect H2O2 production ....................................... 171
Figure 4.9: Cross-sections of branches of a mtn1-1mtn2-1 plant recovered after exogenous
Spd feeding. Scale bars = 60 µm. ............................................................................................ 173
Figure 4.10: Seeds and embryos of restored plants ............................................................... 175
Figure 4.11: Model showing potential links resulting in the recovery of vasculature and
reproduction for seed production after feeding with exogenous Spd ................................... 181
Figure 5.1: A model that explains the holistic view of MTN functions in plant growth and
development ........................................................................................................................... 205
xx
List of Supplemental Figures
Figure S2.1: MAN activity of various organs harvested from 6-week-old WT plant .............. 87
Figure S2.2: Leaf vein pattern and pollen tube growth of mtn1-1mtn2-1 compared to WT. 88
Figure S2.3: Interveinal chlorosis by Nicotianamine (NA) ...................................................... 89
Figure S2.4:Relative transcript abundance of polyamine oxidises and H2O2 production. ..... 90
Figure S3.1: Gel images confirming the genotypes of the MTN-deficient mutants. ............ 135
Figure S3.2: Root characteristics of MTN-deficient mutants. .............................................. 136
Figure S3.3: Number of days after germination for MTN-deficient seedlings to open their
cotyledons.. ........................................................................................................................... 137
Figure S3.4: Cuticle defects and number of leaves in mtn1-1mtn2-1 compared to those in the
WT. ........................................................................................................................................ 138
Figure S3.5: Organs of mtn1-1mtn2-1 mutants that were twisted. ..................................... 139
Figure S3.6: Twisted stem and cross-sections along the stem showing the altered vascular
arrangement. ........................................................................................................................ 140
Figure S3.7: Phenotype of mtn1-1mtn2-1sac51d triple mutant compared to that of mtn1-
1mtn2-1 four: weeks after bolting. ....................................................................................... 141
Figure S3.8: Segregating phenotypes of the amiMTN 5.3 line. ............................................ 142
Figure S4.1: The hormone profiles of mtn1-1mtn2-1 plants compared to WT grown on ½ MS.
............................................................................................................................................... 183
Figure S4.2: The profiles of mtn1-1mtn2-1 plants compared to WT grown on ½ MS
supplemented with Spd ........................................................................................................ 184
Figure S4.3: Pathways determined by genes that are affected as a response to Spd ......... 185
Figure S4.4: Nomenclature of mtn1-1mtn2-1 over generations with and without Spd
treatment .............................................................................................................................. 186
Figure S4.5: The phenotype of mtn1-1mtn2-1 over two generations of Spd feeding ......... 187

xxi
List of Tables
Table 1.1: PA biosynthetic mutants. ........................................................................................... 7
Table 1.2: NA biosynthesis mutants. ........................................................................................ 12
Table 1.3: Catalytic activities of MTN1 and MTN2 with substrate MTA: ................................. 18
Table 1.4: Arabidopsis growth stages on plates ....................................................................... 24
Table 1.5: Summary of the stages of flower development ...................................................... 26
Table 2.1: Viable seeds obtained from reciprocal crosses between WT and mutants ............ 65
Table 3.1: Segregation analysis of the MTN1mtn1/mtn2mtn2 T-DNA alleles ....................... 111
Table 4.1: Up-regulated genes as a response to Spd in three GO categories ........................ 166
Table 4.2: Yang cycle related genes that are changed in the mtn1-1mtn2-1 mutant compared
to WT on both MS media supplemented with Spd ................................................................ 170
xxii
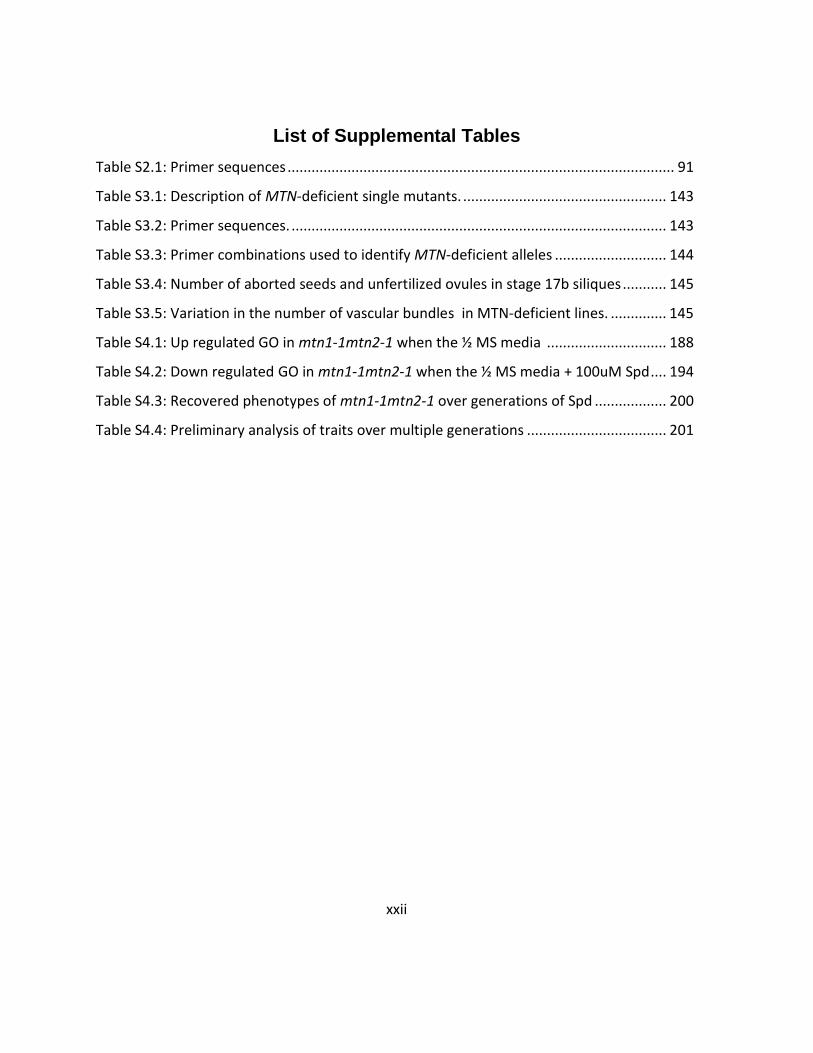
List of Supplemental Tables
Table S2.1: Primer sequences ................................................................................................. 91
Table S3.1: Description of MTN-deficient single mutants. ................................................... 143
Table S3.2: Primer sequences. .............................................................................................. 143
Table S3.3: Primer combinations used to identify MTN-deficient alleles ............................ 144
Table S3.4: Number of aborted seeds and unfertilized ovules in stage 17b siliques ........... 145
Table S3.5: Variation in the number of vascular bundles in MTN-deficient lines. .............. 145
Table S4.1: Up regulated GO in mtn1-1mtn2-1 when the ½ MS media .............................. 188
Table S4.2: Down regulated GO in mtn1-1mtn2-1 when the ½ MS media + 100uM Spd .... 194
Table S4.3: Recovered phenotypes of mtn1-1mtn2-1 over generations of Spd .................. 200
Table S4.4: Preliminary analysis of traits over multiple generations ................................... 201

xxiii
List of Abbreviations
ABA Abscisic acid
ACC 1-aminocyclopropane-1-carboxylic acid
ACL5 ACAULIS5/ Tspm synthase
ACO 1-aminocyclopropane-1-carboxylic acid oxidase
ACS 1-aminocyclopropane-1-carboxylic acid synthase
ADC Arginine dearboxylase
Ade Adenine
Ado Adenosine
AIH Agmatineiminohydrolase
ami artificial microRNA
AMP Adenosine monophosphate
ARD Acidoreductone oxygenase
ARF Adenosine diphosphate Ribosylation Factor-
AT 3-amino-1, 2, 4-triazole
ATHB Arabidopsis thaliana homeobox
axr6 AUXIN RESISTANT 6
bdl BODENLOS
bHLH Type basic-helix-loop-helix
BR Brassinosteroid
CBL Calcineurin B-like
CDS Coding sequences
CK Cytokinin
Co Cobolt
Cu Copper
CuAO Copper amine oxidase
DAB 3-3’ diaminobenzine
DAG Days After Germination
DCFA-DA Dichloro Fluorescin Di Acetate
dcSAM Decarboxylated S-adenosyl methionine
DEP1 Dehydratase-enolase -phosphatase -complex 1
DHKMP 1, 2-dihydro-3-Keto-5-Methylthiopentene
DHS Deoxyhypusine synthase
DIC Differential Interference Contrast

xxiv
DNA Deoxyribonucleic acid
eIF5A eukaryotic initiation factor 5A.
EtOH Ethanol
Fe Iron
GA Gibberellic acid
GAP Guanine triphosphatase Activating Protein
GCOS GeneChip Operating Software
GEF Guanine nucleotide Exchange Factor
GFP Green Fluorescent Protein
GO Gene Ontology
GUS β-Glucuronidase
h Hour
H2O2 Hydrogen peroxide
Hcy Homocysteine
HD-ZIP III Homeodomain transcription factor family
IAA Auxin / Indoleacetic acid
ICP-AES Inductively Coupled Plasma Atomic Emission
Spectroscopy
JA Jasmonic acid
KMTB 2-keto-4-methylthiobutyrate
lop1 LOPPEDED
LRR Leucine-Rich-Repeat
MAT1 methionine adenosyltransferases
Met Methionine
Mn Manganese
Min minute
MP MONOPTEROS
MS Murashige and Skoog
MTA 5'-Methylthioadenosine
MTAP 5’-Methylthioadenosine phosphorylase
MTI1 5'-Methylthioribose 1-phosphate isomerase 1
MTK 5’-Methylthioribose kinase
MTN 5’-Methylthioadenosine nucleosidase
MTR 5’-Methylthioribose

xxv
MTR-1P 5'-Methylthioribose 1-phosphate
MTRu-1-P 5’-Methylthioribulose-1-phosphate
NA Nicotianamine
NAAT Nicotianamine aminotransferase
NAS NA synthase
nas NAS deficient
Ni Nickel
NO Nitric oxide
NPA 1-N-naphthylphthalamic acid
ODC Ornithine decarboxylase
OsMTN Oriza sativa MTN
PA Polyamine
PAR Photosynthetically Active Radiation
PAO Polyamine oxidase
PAT Polar Auxin Transport
PDB Protein Data Base
ph phloem
PP2A Protein phoshatase 2A
Put Putrescine
RLK Receptor-Like Kinases
RMA Robust Multi-chip Average
RNA Ribonucleic acid
RT Room Temperature
SA Salicylic acid
SAC51 suppressor of the ACAULIS5
SAH S-adenosylhomocysteine/AdoHcy
SAM S-adenosyl-L-methionine /AdoMet
SAMDC S-adenosylmethionine decarboxylase
SDS Sodium Dodecyl Sulfate
Spd Spermidine
SPDS Spd synthase
Spm Spermine
SPMS Spm synthase
SPSS Statistical Package for the Social Sciences

xxvi
SRH S-ribosylhomocysteine
TAIR The Arabidopsis Information Resource
TBO Toluidine Blue O
T-DNA Transfer DNA
tkv thick vein
trn TORNADO
Tspm Thermospermine
WT Wild Type
xy xylem
YSL1 Yellow Strip-Like
Zn Zinc

1
Chapter 1: General Introduction
1.1 The model plant Arabidopsis
Arabidopsis thaliana was discovered by Johannes Thal in Germany in the 1500s (Somerville and
Koornneef, 2004). This small dicotyledonous species belongs to the Brassicaceae (mustard)
family. Unlike some members of this family, which are well known for their agricultural
importance (turnip, cabbage, broccoli, and canola being the commonly consumed members),
Arabidopsis is not economically important. However, it has been studied in laboratories for
more than 40 years for its importance in the generation of fundamental information in the
fields of genetics, development, biochemistry, and the physiology of plants [The Arabidopsis
Genome Initiative, 2000; The Arabidopsis Information Resource (TAIR), 2011].
This plant has many desirable traits that make it suitable for molecular genetic studies,
including its short life cycle (~8 weeks from seed germination to seed set); its generation of
selfed progeny with a production of ~10,000 seeds/plant; its ability to grow in a limited space;
and a fully sequenced small genome (125 Mb) with low amount of repetitive sequences, small
introns, and few gene families (The Arabidopsis Genome Initiative, 2000; Wortman et al., 2003).
The complete genome sequence is available publically on many online databases. The
Arabidopsis Information Resource (TAIR; http://www.arabidopsis.org/index.jsp) maintains such
a database, which contains the complete genome sequence along with many other data
relevant to this model plant: information about gene structure, expression, and metabolites;
the availability of DNA and seed stocks; genome maps; physical and genetic markers; and
information about the Arabidopsis research community. The latest release of the Arabidopsis
genome annotation (TAIR10) reports that, out of a total of 33,518 genes, only 27,379 code for
proteins (TAIR, 2011). In addition to these online databases, several stock centres with
collections of cloned genes and characterized mutants are also available for researchers who
are studying Arabidopsis. Many tools have also been developed by the Arabidopsis research
community. For example, the floral dip method (Clough and Bent, 1998) for producing transgenic

2
plants and a large number of well-characterized mutant collections including T-DNA insertion
mutants (TAIR, 2011) are used extensively to address a variety of research questions by many
Arabidopsis scientists around the world, including our lab group. All of these characteristics
have made Arabidopsis an ideal model organism for basic biological research.
The work presented in this thesis uses this model plant and its tools to determine the
contribution of methylthioadenosine nucleosidase (MTN; EC 3.2.2.16) activity to plant growth
and development.
1.2 Network of essential pathways linked by 5’-Methylthioadenosine
nucleosidase activity
5’-Methylthioadenosine nucleosidase (MTN) is located centrally between two essential
interconnected pathways: the methionine (Met) recycling pathway and the activated Met cycle
(Figure 1.1). The importance of these pathways and their links to others are discussed in this
section, with special emphasis on the Met recycling pathway and the polyamine (PA) and
nicotianamine (NA) biosynthesis pathways, all of which rely on MTN activity for their continued
activity.
1.2.1 Yang cycle/Met recycling pathway
The Met recycling pathway is present in all organisms, from unicellular bacteria to plants and
animals, and is thus considered a universal (housekeeping) pathway, the role of which is
primarily to recycle sulfur-containing metabolites. 5’-methylthioadenosine (MTA), a key sulfur-
containing by-product of several reactions, is an intermediate in this pathway, which is also
called the MTA cycle. In plants, this pathway is specifically called the Yang cycle because it was
first discovered by Shang Fa Yang in the 1980s (Yang and Hoffman, 1984). The Yang cycle

3
Figure 1.1: Yang cycle and activated Met cycle in Arabidopsis.
MTA, produced as a by-product during PA biosynthesis, NA biosynthesis, and ethylene
biosynthesis, is subsequently recycled to Met. SAM regenerated fr om Met acts as the
substrate for SAM decarboxylase, NA synthase, ACC synthase, and Methyl transferase to
produce DCSAM, NA, ACC, and SAH, respectively. DCSAM provides the aminopropyl
moieties to Spd synthase and Spm/Tspm synthase in order to convert Put to Spm/Tspm
via Spd. ACC oxidase generates ethylene from ACC while SAH becomes cleaved into Hcy
by SAH hydrolase. Hcy is recycled back to Met. Ade, adenine; ACC, 1 -aminocyclopropane-
1-carboxylate synthase; Hcy, homocysteine; Met, methionine; MTA, methylthioa denosine;
MTR, methylthioribose; NA, nicotianamine; PA, polyamine; Put, Putrescine; Spd,
spermidine; Spm, spermine; Tspm, thermospermine; SAH, S -adenosylhomocysteine; SAM,
S-adenosylmethionine; DCSAM, decarboxylated SAM; CuA oxidase, Cupper amine oxidase;
and eIF5A, eukaryotic initiation factor 5A. PAoxidase, polyamine oxidase.

4
recycles the MTA that is generated via three biosynthetic pathways: PA (Takahashi and Kakehi,
2011), NA (Negishi et al., 2002) and ethylene (Yang and Hoffman, 1984).
1.2.1.1 Biosynthesis of PAs and their functions
PAs are organic cations that are involved generally in many cellular processes, modulating the
functions of deoxyribonucleic acid (DNA), ribonucleic acid (RNA), nucleotide triphosphates, and
proteins (Igarashi and Kashiwagi, 2010). The diamine putrescine (Put), triamine spermidine
(Spd), and tetraamines spermine (Spm) and thermospermine (Tspm) are the PAs most
commonly found in living organisms. Although in animals, fungi and young plants Put is derived
from either ornithine or arginine (Figure 1.2) mature plants commonly use arginine as the
precursor. Unlike most plant species, Arabidopsis thaliana lacks ornithine decarboxylase activity
(ODC; EC 4.1.1.17; Hanfrey et al., 2001) and thus relies on arginine decarboxylase (ADC; EC
4.1.1.19; Figure 1.1) to generate Put. Put is converted first to Spd by Spd synthase (SPDS; EC
2.5.1.16) and then to Spm and Tspm by Spm synthase (SPMS; EC 2.5.1.22) and Tspm synthase
(ACL5; ACAULIS5; EC 2.5.1.79), respectively. Decarboxylated S-adenosyl methionine (dcSAM)
serves as the aminopropyl donor for all of these reactions. dcSAM is generated from
S-adenosyl-L-methionine (SAM) by S-adenosylmethionine decarboxylase (SAMDC; EC 4.1.1.50).
Although it has been known for decades that PAs play a role in cell division, embryogenesis,
root formation, fruit development, and responses to abiotic stresses in plants (Kumar et al.,
1997), an understanding of their modes of action at the molecular level has just begun to
emerge.
Put is involved primarily in abiotic stress responses (Table 1.1; Takahashi and Kakehi, 2010)
while both Put and Spd are preferentially essential for embryogenesis (Table 1.1; Imai et al.,

5
Figure 1.2: Biosynthetic pathway of polyamines in plants.
Put, Putrescine Spd, spermidine; Spm, spermine; Tspm, thermospermine ; ADC, arginine
decarboxylase; AIH, agmatineimino hydrolase; CPA, N -carbamoyl putrescineamido
hydrolase; ODC, ornithine decarboxylase; SAM, S -adenosyl-L-methionine; SAMDC, S-
adenosyl-L-methionine decarboxylase; SPDS, Spd synthase; SPMS, Spm synthase; ACL5,
Acaulis5; Tspm synthase. Modified from Takahashi and Kakehi (2011).

6
2004a). One reason for the requirement for Spd could be that it is the source of the butylamine
moiety needed for the activation of the eukaryotic translation initiation factor 5A (eIF5A; Figure
1.1). The activation of this factor is essential for cell growth and proliferation (Park, 2006) and
possibly also for plant embryo development. Based on this rationale, the mutation in the
deoxyhypusine synthase (DHS) gene that is involved in the rate-limiting first step in
hypusination of eIF5A results in the arrest of embryo-sac development in Arabidopsis
(Pagnussat et al., 2005).
In addition to the roles played by free PA, the contribution of conjugated Spd on the other hand
is related to protection against pathogens, the detoxification of phenolic compounds; Spd also
functions as a PA reserve in seeds (Takahashi and Kakehi, 2010).
Spm is non-essential for the survival of Arabidopsis (Table 1.1) but participates in signaling
pathways by regulating control of ion channels and receptor activities, protecting DNA from
being mutated by free radicals (Ha et al., 1998), and mediating signals to protect against plant
pathogens (Yamakawa et al., 1998; Takahashi et al., 2003). During this signaling, Spm
accumulates in the apoplast and produces H2O2 via apoplastic polyamine oxidation, resulting in
the up regulation of a subset of defense-related genes (Cona et al., 2006; Moschou et al., 2008).
A structural isomer of Spm, Tspm, plays a critical role in vascular cell differentiation. The gene
that encodes Tspm synthase is expressed specifically in early-developing vessel elements and
has an upstream promoter element that is auxin sensitive. When this gene is disrupted, the
resulting plants are dwarf, with increased xylem proliferation in their stems (acl5; Table 1.1;
Hanzawa et al., 2000), and have highly vascularized leaves with thicker mid-veins (tkv, allelic to
acl5; Clay and Nelson, 2005). The acl5 phenotype is restored by a suppresser mutation of acl5
known as SAC51 (suppressor of the ACAULIS5; sac51-d; Imai et
7
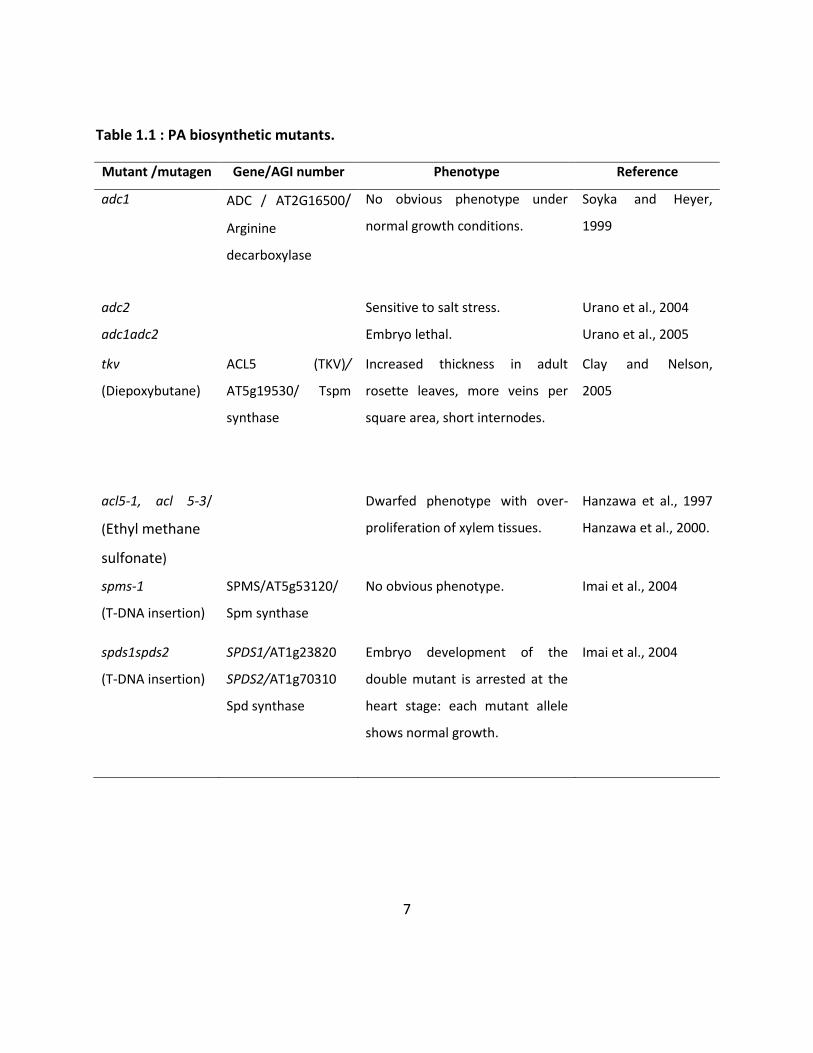
Table 1.1 : PA biosynthetic mutants.
Mutant /mutagen Gene/AGI number Phenotype Reference
adc1 ADC / AT2G16500/
Arginine
decarboxylase
No obvious phenotype under
normal growth conditions.
Soyka and Heyer,
1999
adc2 Sensitive to salt stress. Urano et al., 2004
adc1adc2 Embryo lethal. Urano et al., 2005
tkv
(Diepoxybutane)
ACL5 (TKV)/
AT5g19530/ Tspm
synthase
Increased thickness in adult
rosette leaves, more veins per
square area, short internodes.
Clay and Nelson,
2005
acl5-1, acl 5-3/
(Ethyl methane
sulfonate)
Dwarfed phenotype with over-
proliferation of xylem tissues.
Hanzawa et al., 1997
Hanzawa et al., 2000.
spms-1
(T-DNA insertion)
SPMS/AT5g53120/
Spm synthase
No obvious phenotype. Imai et al., 2004
spds1spds2
(T-DNA insertion)
SPDS1/AT1g23820
SPDS2/AT1g70310
Spd synthase
Embryo development of the
double mutant is arrested at the
heart stage: each mutant allele
shows normal growth.
Imai et al., 2004

8
al., 2006). Vera-Sirera et al. (2010) proposed a model for the role of Tspm based on the work
conducted with respect to acl5: Tspm activates SAC51 translationally to ensure an adequate
level of basic helix-loop-helix (bHLH) transcription factors that negatively regulate the genes
related to cell death, thereby maintaining differentiating vessel elements alive until maturation
by preventing premature cell death (Muñiz et al., 2008).
1.2.1.2 PA catabolism
In contrast to the amount of knowledge available with respect to plant PA biosynthesis,
understanding of PA catabolic pathways is just beginning. Two enzyme groups are known to be
involved in PA catabolism. A copper-containing amine oxidase (CuAO; EC 1.5.3.3; Figure 1.1)
utilizes Put, and a flavin adenine dinucleotide-dependent polyamine oxidase (PAO; EC 1.4.3.6)
utilizes Tspm/Spm and Spd as substrates. Arabidopsis contains 12 CuAO isoforms and five PAO
isoforms (Takahashi et al., 2010; Wimalasekera et al., 2011). PAO back-converts Tspm/Spm to
Put via Spd in order to maintain PA homeostasis within plants (Takahashi et al., 2010). A
detailed characterization of PAO activities indicates that PAO1 prefers Tspm and nor-Spm over
Spm as its predominant substrate while PAO4 uses Spm. PAO2 and PAO3 back-convert Spd to
Put (Takahashi et al., 2010). All of these oxidation reactions produce H2O2. H2O2 generated
during exogenous supplementation of Spd or the overexpression of PAO acts as signals for
premature xylem differentiation (Tisi et al., 2011) or for reduced pollen tube growth (Wu et al.,
2010). A recent report by Wimalasekera et al. (2011) suggests that these Spd-mediated
responses occur via nitric oxide (NO) signaling. NO signaling is known to affect an array of plant
functions, including pollen-pistil interactions (Prado et al., 2008). PA biosynthesis, catabolism,
and conjugation thus act together to maintain the PA homeostasis that is involved in many
aspects of plant growth and development. Since MTN - deficient single mutants, mtn1-1 and
mtn1-2, have altered PA profiles (Bürstenbinder et al., 2010), factors that affect PA homeostasis
may be relevant to understanding their phenotype.

9
1.2.1.3 NA biosynthesis and its functions
NA, another product of an MTA-generating reaction, is a non-proteinogenic amino acid and a
strong metal chelator that is involved in long-distance metal translocation in plants. NA
synthase (NAS; EC 2.5.1.43, Figure 1.3A) condenses three amino-carboxylpropyl groups, each
arising from S-adenosyl-L-methionine (SAM) molecules, in order to produce one molecule of
NA. The structural features of NA are ideal for chelating metals: NA coordinates the centrally
bound metal ion via its three amino and three carboxyl groups to form an octahedral complex
(Curie et al., 2009; Figure1.3B). NA thus forms stable complexes with manganese (Mn), iron
(Fe), cobalt (Co), zinc (Zn), nickel (Ni) and copper (Cu), in increasing order of affinity (Anderegg
and Ripperger, 1989). As a result, NA deficiency leads to phenotypes that resemble mutants
with altered metal profiles, including interveinal chlorosis and fertility defects (Table 1.2).
Plants are classified as belonging to one of two groups based on their strategies for iron
acquisition: strategy I plants (non-graminaceous plants: e.g., Arabidopsis) and strategy II plants
(graminaceous plants: e.g., rice). In strategy I plants, ions are acquired by the reduction of Ferric
(Fe +3) ions into the more soluble Ferrous (Fe +2) ions. In these plants, NA functions as a chelator
of iron in symplastic and phloem transport, as a chelator of Cu in xylem transport, and as a cell
protector against oxidative stress. In addition to the roles it plays in strategy I plants, in strategy
II plants, NA serves as the precursor for the biosynthesis of the phytosiderophores of the
mugineic acid family (Figure 1.3A). These plants excrete these phytosiderophores to form
complexes with Fe+3. NA synthesis is thus extremely important for the regulation of iron
metabolism in both strategy I and strategy II plants (Curie et al., 2009).
Although NAS gene family has been thought to be plant specific, NAS-like genes have been
revealed in many organisms, including fungi, and archaea (Herbik et al., 1999; Trampczynska et
al., 2006). Arabidopsis contains four NAS isoforms. Klatte et al. (2009) reports the phenotype of

10
two quadruple nas mutants (Table 1.2). On one hand the nas4x-2 mutant that has lost full nas
function develops chlorotic leaves and is sterile. On the other hand, nas4x-1, with an
intermediate nas function, due to leaky expression of NAS 2, is fertile and develops leaf
chlorosis that becomes severe upon the transition to the reproductive phase or during Fe
deficiency. Moreover, the tomato nas mutant chloronerva and the transgenic tobacco line that
overexpresses NA aminotransferase (NAAT) activity also show leaf chlorosis and sterility as a
result of reduced NA (Scholz et al., 1992; Ling et al., 1999; Takahashi et al., 2003). Thus in
plants, NA produced by NA synthase plays an important role in ion homeostasis, including Fe
content. Since an MTN-deficient double mutant (Bürstenbinder et al., 2010) is sterile, the
effects of NA have also been studied in detail in the research for this thesis.
1.2.1.4 Ethylene biosynthesis and its roles in plant development
The gaseous phytohormone ethylene is involved in a number of growth and development
processes in plants, including floral development, fruit ripening, response to stresses, and
senescence (Bleecker and Kende, 2000). Ethylene is formed from SAM via two steps. First, 1-
aminocyclopropane-1-carboxylic acid (ACC) synthase (ACS; EC 4.4.4.14; Yang and Hoffman,
1984) catalyzes the transfer of the aminobutyrate group from SAM to ACC. This is the rate-
limiting step (Bleecker and Kende 2000) that produces MTA as a by-product. Subsequently, in
the second step, ACC oxidizes to ethylene by means of ACC oxidase (ACO; EC 1.14.17.4: Yang
and Hoffman, 1984).
Although the Arabidopsis contains 12 ACS (ACS 1-12) annotated genes, only nine genes (ACS1,
ACS2, ACS4–9, and ACS11) comprise its active multigene family because ACS3 is a pseudogene,
and ACS10 and ACS12 are aminotransferases (Yamagami et al., 2003). Of the nine, ACS1 forms a
non-functional homodimer while the remainder forms functional

11
Figure 1.3: Biochemical pathway and chemical structure of nicotianamine (NA).
(A) The position of NA synthase and the way in which it leads to the phytosiderophores
of the mugenic acid family. Modified from Takahashi et al. (2003).
(B) Biochemical properties of NA: the proposed chemical structure of the metal
complex. Modified from Curie et al. (2009).

12
Table 1.2: NA biosynthesis mutants.
Mutant /mutagen Gene Function Phenotype Reference
nas4x-1, Arabidopsis
(T-DNA insertions in all
four isoforms with a
partially functional nas2-
1 allele
NA synthase Mild chlorosis that occurs at
the time of first flowering,
and is fertile with seeds that
have reduced Fe.
Klatte et al.
(2008)
nas4x-2 ,Arabidopsis
(T-DNA insertions in all
four isoforms with a null
allele of nas2)
NA synthase Severe chlorosis throughout
the life cycle and is sterile.
Klatte et al.
(2008)
Naat,Tobacco
(Constitutively expressing
a barley naat-A gene)
NA aminotransferase
(NAAT) catalyzes the amino
group transfer of NA
Interveinal chlorosis
phenotype in young leaves,
morphological abnormalities
in flowers, pollen
maturation defects, and late
anther dehiscence, long
narrow leaves
Takahashi et
al. (2003)
Chloronerva,Tomato
mutant
(Single base mutation in
the single NAS)
NA synthase Interveinal chlorosis
phenotype in young leaves.
Scholz et al.
(1992)

13
homodimers (Tsuchisaka and Theologis, 2004a). Tsuchisaka et al. (2009) recently showed that
knocking down the entire ACS gene family results in embryo lethality. Their detailed
characterization of single and multiple mutants revealed the overlapping functions of a variety
of ACS members in plant growth and development, including flowering time, response to
gravity, and ethylene production. These results show that the ACS gene family that generates
MTA as a by-product is a key component in plant growth and development.
The MTA generated in all three of these biosynthetic pathways (PA, NA, and ethylene synthesis)
is recycled to Met via a series of reactions collectively called the Yang cycle or Met recycling
pathway (Figure 1.1). In this pathway MTA is hydrolyzed to adenine and methylthioribose (MTR,
Figure 1.4). In plants MTR is converted back to Met through the production of four successive
intermediate products; 5’ methylthioribose-1-phosphate (MTR-1-P), 5-methylthioribulose-1-
phosphate (MTRu-1-P), 1,2-dihydroxy-3-keto-5-methylpentene (DHKMP) and 2-keto-4-
methylthiobutyrate (KMTB). The 5’-methylthioribose kinase (MTK; EC 2.7.1.100) transfers a
phosphate group in the process of generating MTR-1-P from MTR (Sauter et al., 2004) whereas
acidoreductone oxygenase (ARD; EC 1.13.11.54) converts DHKMP to KMTB (Sauter et al., 2005).
The enzymes catalyzing the other two steps have been identified only recently by BLAST
searches (http://www.ncbi.nlm.nih.gov/ blast/Blast.cgi); Pommerrenig et al., 2011). 5’-
methylthioribose-1-phosphate isomerase1 (MTI1; EC 5.3.1.23) that converts MTRu-1-P to
DHKMP and dehydratase-enolase-phosphatase-complex1 (DEP1) that converts DHKMP to
KMTB were identified and characterized (Pommerrenig et al., 2011). Although it has been
commonly thought that the Yang cycle genes are expressed in almost all plant cells
(Pommerrenig et al., 2011), based on the actively translated transcriptome profiling of distinct
cell populations (Mustroph et al., 2009), concluded that these enzymes are expressed
predominantly in phloem tissues. Β-glucuronidase (GUS) reporter gene fusions to all genes of

14
the Yang cycle reveal that MTN, MTK, ARD (except ARD3), MTI1, and DEP1 are localized
primarily in the phloem of Arabidopsis and Plantago (Pommerrenig et al., 2011).
1.2.2 Met/transmethylation cycle
All three biosynthetic pathways that generate MTA as a by product utilize SAM (also
abbreviated as AdoMet) as their precursor (for review see Albers, 2009). SAM is also the donor
of methyl groups for almost all cellular methylation reactions that mediate important aspects of
plant metabolism, such as the synthesis of pectin, lignin, and chlorophyll.
S-adenosylhomocysteine (SAH or AdoHcy), produced as a by-product in these methylation
reactions, is recycled back to Met via homocysteine (Hcy). This cycle is referred to either as the
transmethylation cycle or as the SAM cycle. These methylation reactions are critical for the
regulation of diverse biological processes, including the methylation of phospholipids and the
“modification of DNA, RNA, histones and other proteins, dictating replication, transcriptional
and translational fidelity, mismatch repair, chromatin remodeling, epigenetic modifications and
imprinting” (Loenen 2006). In addition to methylation, SAM plays many other critical roles: it
acts as a co-factor for nucleases and controls transcription or translation by binding to specific
RNA molecules called riboswitches (Loenen, 2006). MTN has been studied intensely not only
because of its ability to link critical pathways but also because its activity has been shown to be
essential for viability.
1.3 Methylthioadenosine nucleosidase
MTA generated via several pathways is converted in either one or two steps to 5’-
methylthioribose 1-phosphate (MTR-1-P). In animals, yeasts, cyanobacteria, and archaeae, MTA
is cleaved and phosphorylated directly to MTR-1-P by methylthioadenosine phosphorylase
(MTAP; EC 2.4.2.28) (Albers, 2009). In plants and most bacteria, MTA is hydrolyzed at the N-
glycosyl bond between the ribose and adenine moieties by MTN, releasing MTR and Ade (Figure

15
Figure 1.4: Yang cycle reactions and MTA hydrolysis reaction
(A)Yang cycle reactions in plants are indicated in green arrows whereas reactions found
in bacteria but not in plants are indicated in black arrows. MAT1 to MAT4, methionine
adenosyltransferases (S-adenosyl-L-methionine synthases); MTN; Methylthioadenosine
nucleosidase; MTK, methylthioribose kinase; MT1, methylthioribose-1-phosphate isomerase1;
DEP1, dehydratase-enolase-phosphatase-complex1; ADR1 to ADR4, acidoreductone oxygenase.
Question marks have been added if direct proof for this function is still missing. Modified from
Pommerrenig et al. (2011).
(B) Conversion of MTA to MTR via MTN reaction
1.4B, Guranowski et al., 1981; Cornell et al., 1996). In bacteria, this enzyme, designated as
MTAN, also hydrolyses SAH to S-ribosylhomocysteine (SRH) and adenine (Lee et al., 2005).

16
1.3.1 Plant MTNs
Plant MTNs were initially investigated in lupin (Lupinus luteus L.) and tomato extracts
(Guranowski et al., 1981; Kushad et al., 1985). Kushad et al. (1985) found that MTN activity is
required for wound-induced ethylene biosynthesis in tomatoes and cucumbers. The single MTN
gene of rice (Oryza sativa L.), OsMTN, was later identified and characterized (Rzewuski et al.,
2007). Recombinant OsMTN has a kinetic constant (Km) of 2.1 ± 0.2 µM for MTA but will accept
substrates with 5’ substitutions on the thiol group (e.g., ethylthioadenosine and
butylthioadenosine; Rzewuski et al., 2007). Studies of OsMTN revealed that both MTN
transcript levels and MTN enzyme activity increased with increases in ethylene biosynthesis.
MTN activity is also sufficient for the maintenance of the Met and SAM pools during the
prolonged periods of ethylene biosynthesis associated with rice submergence (Rzewuski et al.,
2007). The work presented in this thesis has examined Arabidopsis MTNs with the goal of
understanding the fundamental role of the activity of this enzyme in growth and development.
1.3.1.1 Arabidopsis MTNs
The Arabidopsis thaliana genome has two sequences annotated as MTNs along with three
other related sequences: At4g24340, At4g24350, At4g28940 (Figure 1.5). The annotated MTN
isoforms are AtMTN1 (At4g38800) and AtMTN2 (At4g34840) while the MTN-related genes have
yet to be analyzed. The coding regions of these two genes share a 73 % nucleotide identity and
a 64 % amino acid identity. Based on the phylogenetic tree (Figure 1.5) the MTN-related genes
do not belong to the same clade as the MTN1 and MTN2 genes. Siu et al. (2008) discovered that
both plant isoforms hydrolyze MTA with comparable apparent enzyme kinetics (Table 1.3),
substrate preference, and pH values; the optimum pH for MTN1 is 8 while for MTN2, it is 6.
However, MTN2 shows activity (14 %) toward SAH,

17
Figure 1.5: Sequence alignment and phylogenetic tree of MT.
(A) Sequence alignment of MTN1, MTN2, and other MTN genes. Strictly conserved residues are boxed.
(B) Phylogenetic tree of MTN genes.
B
A

18
which led the authors to suggest that MTA metabolism is mediated primarily by MTN1 (Siu et
al., 2008). A comparison of the crystal structure of MTN1 and a homology model generated for
MTN2 revealed changes in the active sites that were thought to be critical for the observed
substrate specificity. Recently, Siu et al. (2011) reported that MTN1 binds SAH but is incapable
of hydrolyzing it because binding SAH changes the catalytic water molecule, thus rendering
hydrolysis impossible.
Table 1.3: Catalytic activities of MTN1 and MTN2 with substrate MTA:
MTN1 MTN2
Km (μM) 7.1±0.5 3.4±0.2
Vmax (nmol/min) 3.7±0.1 2.0±0.08
Kcat (s−1) 18.7 2.0
Kcat/Km (s−1 μM−1) 2.6 0.6
Data source: Siu et al. (2008).
1.3.1.2 Expression Profiles of Arabidopsis MTNs
MTN is known to be expressed in all organs, primarily in the phloem of vascular tissues. Public
microarray data indicate that MTN1 transcripts are about 10 times more abundant than MTN2
transcripts across different organs (Zimmermann et al., 2004). However MTN1 and MTN2 were
uniquely expressed in different tissues (Figure 1.6A; Winter et al., 2007) when used tissue
specific expression in EFPbrowser (http://efp.ucr.edu/cgi-bin/relative). Using RNA gel-blot
analysis Oh et al. (2008) confirmed that MTN1 is expressed in roots, stems, flowers and both
cauline and rosette leaves. Based on the MTN1::GUS gene expression, MTN1 appears first at
the tips of the cotyledons of 3-day-old seedlings and in the shoot apex and leaves of young
seedlings particularly in vascular tissues (Oh et al., 2008). In flowers, MTN1 is found specifically
in sepals and anthers but not in pistils or petals. Since GUS expression was seen only in the
mature anthers and not in immature ones, the authors suggested that MTN1 plays a role in

19
pollen development. The results of translatome profiling by FLAG tagging of ribosomal protein
L18 (Mustroph et al., 2009) provide additional insight. In these experiments, an epitope-tagged
ribosomal protein was expressed from a variety of tissue-specific promoters, allowing the
recovery of actively translated transcripts. When the results are visualized with translatome
eFPbrowser, it is evident that MTN1 is synthesized primarily in phloem tissues and guard cells
whereas MTN2 is in phloem tissues and epidermal cells, including guard cells (Figure 1.6B, C).
The expression pattern for MTN1 was validated by pMTN1:: MTN1: GUS analysis which showed
that MTN1 is specifically in phloem but not in xylem (Pommerrenig et al., 2011)
1.3.1.3 Interacting partners of Arabidopsis MTN
In a study designed to determine the interacting partners of Calcineurin B-like (CBL) protein
family, Oh and colleagues (2008) found a physical interaction of MTN1 and MTN2 with CBL3 in
vitro using yeast two-hybrid assays. The interaction between MTN1 and CBL3 inhibits MTN1
activity. Based on this MTN inhibition, ethylene, PA, and NA syntheses are most likely regulated
via the Met cycle (Oh et al., 2008). At the cellular level, MTN1 was shown to be localized at the
plasma membrane, in the cytoplasm, and in the nucleus. However, the interaction with CBL3
was shown to occur mainly outside of the nucleus.
1.3.2 MTN-deficient plants
Four transfer DNA (T-DNA) insertion single mtn mutants have recently been described: mtn1-1
(T-DNA insertion in the third intron of the MTN1 gene), mtn1-2 (T-DNA insertion in the sixth
exon of the MTN1 gene), mtn2-1 (T-DNA insertion in the fourth exon of the AtMTN2), mtn2-2
(T-DNA insertion in the fourth exon of the MTN2) (Bürstenbinder et al., 2010). These single
mutants, when grown on soil or germinated on sulfur-sufficient media containing 500μM
MgSO4, are phenotypically indistinguishable from the wild type (WT). However, when the sulfur
source is 500μM MTA, mtn 1-1 and mtn1-2 are retarded with respect to both seedling and root

20
A
BC
Figure 1.6: Expression pattern of the Arabidopsis MTNs in leaf tissues.
(A) Comparison of transcripts of MTN1 and MTN2 using the publicly available eFP Browser tool Based on the scale presented the abundance of MTN1 is indicated in shapdes of red colour while the MTN2s in shades of blue colour.
(B) MTN1 is preferentially expressed in phloem and guard cells based on the translatome expression patterns
(C) MTN2 is expressed in epidermal cells in addition to the phloem cells
21
growth (Bürstenbinder et al., 2010). The primary defect of mtn single mutants grown on MTA is
altered PA metabolism while the NA levels and ethylene levels measured in four-day-old
seedlings were not significantly different from those of the WT (Bürstenbinder et al., 2010). The
MTN-deficient double mutant mtn1-1mtn2-1 has a pleiotropic phenotype and developmental
abnormalities when grown either on ½ Murashige and Skooog (MS) media or on soil. The most
obvious defects include delayed bolting and sterility with underdeveloped siliques
(Bürstenbinder et al., 2010). Part of the research outlined in this thesis documents in detail the
developmental defects of MTN-deficient mutants in order to determine the role of MTN in
plants.
1.4 Plant development and the role of hormones
A general description of WT Arabidopsis development, including reproductive and vascular
milestones, is provided in the next two sections. The key hormone contributions to each of
these development stages are also included where appropriate.
1.4.1 General growth and development
Since the work presented in this thesis involved the determination of the function of an enzyme
for plant growth and development, it was critical to use well-defined developmental
milestones. The Arabidopsis growth and development stages outlined by Boyes et al. (2001)
have been used. These metrics provide a structure for identifying phenotypic differences that
are a result of genotypic or environmental variations. As listed in Table 1.4, plant development
from seed imbibition to plant senescence was categorized as different growth stages, which
were adapted by Boyes et al. (2001) from a scale originally presented for crops and weeds
(Lancashire et al., 1991). The time required for WT Columbia (Col-0) to reach each of these
stages when grown under conditions that included a 16 h day was used as a reference. Figure
1.7 shows the phenotypes that correspond to the principal growth stages listed in Table 1.4.

22
1.4.2 Reproductive development
Plant reproduction depends on the formation of reproductive organs along with the male and
female gametes that are produced within specialized structures in flowers. Because plant
reproduction is strongly influenced by MTN deficiency and is thus a major focus of this
research, the detailed developmental stages of flowers as described by Smyth et al. (1990)
were followed (Table 1.5). These stages were used as a basis for determining when to harvest
tissues for hormone, metabolite, and microscopic analyses.
1.4.2.1 Flower development
The mature Arabidopsis flower exhibits the simple structure of a typical Brassicaceae (Figure
1.8). It has a calyx and a corolla with four sepals and four petals, respectively. The six stamens
vary in arrangement and length: the four medially arranged stamens are longer than the two
relatively shorter laterally arranged ones. The gynoecia are superior with two carpels that
enclose ovules.
1.4.2.2 Stamen and pollen development
Floral identity genes specify the stamen primordia at flower development stage 5 (Figure 1.9A).
These primordial cells then differentiate to form a basal filament and an anther. An anther
containing the male sporogenous tissue develops in two phases: microsporogenesis and
microgametogenesis. During the microsporogenesis, morphogenesis and meiosis take place
(Figure 1.10; Alvarez-Buylla et al., 2010; Sanders et al., 1999), and when the tetrads release
microspores, microgametogenesis is initiated, which involves the maturation of microspores
into pollen. During this process, the tapetum, which provided nutrients and structural
components to the pollen mother cells, also nurtures the developing pollen. Elongation of the
filament and enlargement of the anthers also occur simultaneously. Finally, the anther enters
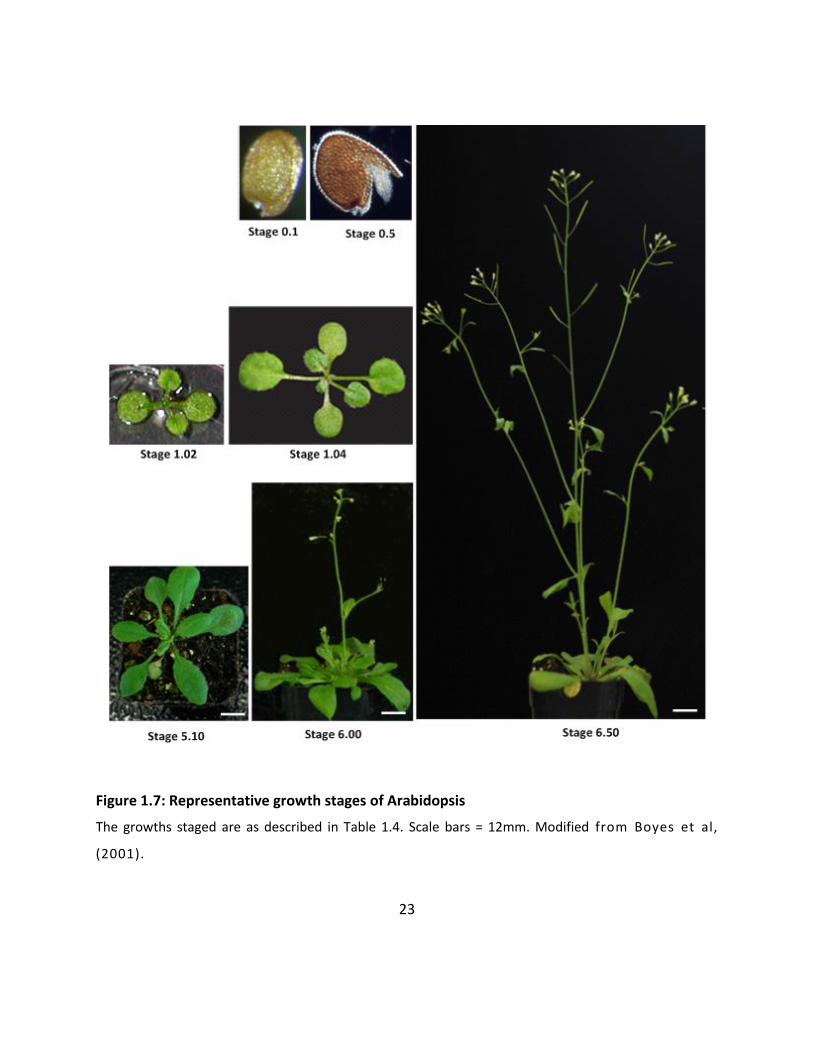
23
Figure 1.7: Representative growth stages of Arabidopsis
The growths staged are as described in Table 1.4. Scale bars = 12mm. Modified from Boyes et al,
(2001).

24
Table 1.4: Arabidopsis growth stages on plates
*Average days from sowing, including three-day stratification at 4oC to synchronize germination. Plants
were grown under standard long day conditions.
Stage Description Days (Col-0)*
Principal growth stage 0 Seed germination
0.10 Seed imbibition 3.0
0.50 Radicle emergence 4.3
0.7 Hypocotyl and cotyledon emergence 5.5
Principal growth stage 1 Leaf development
1.0 Cotyledons fully opened 6.0
1.02 2 rosette leaves > 1mm 10.3
1.04 4 rosette leaves > 1mm 14.4
Principal growth stage 5 Inflorescence emergence
5.10 First flower buds visible 26
Principal growth stage 6 Flower production
6.0 First flower open 31.5
6.5 50% of flowers are open 43.5
6.9 Flowering complete 49.4
Principal growth stage 9 Senescence
9.7 Senescence completed with seeds ready to
collect
ND
Data source: Boyes et al. (2001)

25
Figure 1.8: The Arabidopsis flower
(A) Mature flower at anthesis. Scale bar = 0.3mm.
(B) Cartoon of a lateral section through a mature flower, with organ types indicated
(C) Floral diagram showing the relative placement of floral organs. Organ types are
colored as in (B). Modified from Irish et al. (2010)

26
Table 1.5: Summary of the stages of flower development
Flowers are collected from plants that are grown on standard long day conditions.
Stage Landmark Event at Beginning of Stage Duration (h) Age of Flower at End of
stage ( days)
1 Flower buttress arises 24 1
2 Flower primordium forms 30 2.25
3 Sepal primordia arise 18 3
4 Sepals overlie flower meristem 18 3.75
5 Petal and stamen primordia arise 6 4
6 Sepals enclosed bud 30 5.25
7 Long stamen primordia stalked at
base
24 6.25
8 Locules appear in long stamens 24 7.25
9 Petal primordia stalked at base 60 9.75
10 Petals level with short stamens 12 10.25
11 Stigmatic papillae appear 30 11.5
12 Petals level with long stamens 42 13.25
13 Bud opens, petals visible, anthesis 6 0.5
14 Long anthers extend above stigma 18 1
15 Stigma extends above long anthers 24 2
16 Petal and sepals withering 12 2.5
17 All organs fall from green siliques 192 10.5
18 Siliques turn yellow 36 12
19 Valves separate from dry siliques Up to 24 13
20 Seed fall
Data source: Smyth et al. (1990)

27
Figure 1.9: Development of Arabidopsis reproductive organs.
(A) Stamen development. When the anther is at stage 2 During stage 2, the four
archesporial cells (Ar)arise in the L2 layer. Before meiosis these Ar cells divide and
procuce the primary parietal layer (1P) and the primary sporogenous layer (1Sp). The 1 P
then divides into two secondary parietal layers (outer and inner, 2P) while the 1Sp
generates the microspore mother cell (MMC).
(B) Flower stages according to Smyth et al. (1990)
(C) Carpel development modified from Alvarez-Buylla et al. (2010)

28
Figure 1.10: Pollen development
Modified from McCormick et al. (2004)

29
Figure 1.11: Hormones at a later stage of flower development
Modified from Alvarez-Buylla et al. (2010)

30
the dehiscence stage, releasing mature pollen (Goldberg et al., 1993). The later stages of
stamen development are known to be under the control of hormones such as auxin (IAA),
gibberellic acid (GA), and jasmonic acid (JA) (Figure 1.11; Alvarez-Buylla et al., 2010).
1.4.2.3 Carpel and embryo sac development
Carpel primordia, which are specified by the floral identity genes, develop into gynoecia with a
central ovary, distal stigma with papillae, and a style that connects the stigma to the ovary
(Alvarez-Buylla et al., 2010). The two carpels of the ovary are separated by a septum, and the
ovules are attached to this septum by a placenta (Figure1.9C). At flowering stage 11, the inner
and outer integuments of the ovules are formed, and these cover the nucellus completely by
flowering stage 12, at which time megagametogenesis occurs (Figure 1.12; Bowman, 1994). The
megasporocyte undergoes meiosis and produces four haploid megaspores. Three of these cells
degrade while the remaining megaspore divides mitotically to generate the embryo sac (Figure
1.12). The embryo sac of the Arabidopsis contains seven cells representing four cell types: an
egg cell, a central cell, two accessory synergid cells, and three antipodal cells. The development
of these cells depends on the asymmetric distribution of auxin (Figure 1.12, Pagnussat et al.,
2005). This auxin gradient depends on the auxin synthesis that takes place at specific locations,
in contrast to the auxin efflux that produces auxin gradients in the remainder of the plant
(Pagnussat et al., 2005).
1.4.2.4 Fertilization
During fertilization, two sperm cells from each pollen grain are delivered through a pollen tube
into the embryo sac. One of these sperm cells fertilizes the egg whereas the other fertilizes the
central cell (Costa et al., 2004; Berger et al., 2006). This double fertilization forms a diploid
zygote, which gives rise to the future embryo, and a triploid endosperm, which forms
nutritional tissue for the embryo.

31
Figure 1.12: Embryo sac development
FG indicates female gametophyte; mmc, microspore mother cell; m, microspore; ac, antipodal
cells; cc, central cell; ec, egg cell; pn, polar nuclei; and sc, synergid cells; sn, synergid nucleus. Modified
from Pagnussat et al. (2009)
32
After fertilization, the ovary is called a silique, and the ovules are called seeds. These seeds are
connected to the replum (septum) through a funiculus (placenta). The funiculus that provided
the route for the pollen tube growth during fertilization now provides the route for nutrients
from the maternal plant to reach the developing embryo.
1.4.2.5 Embryo development
The diploid zygote transforms into a mature embryo during the process of embryogenesis.
During embryogenesis, many stages of embryos can be identified: pro embryo (8 cells), pre-
globular (16 cells), globular (32 cells), transition, heart, linear, early curled, curled and mature
(Figure 1.13). Three tiers can be identified at the proembryo stage: an apical tier, a basal tier,
and suspensor cells (Figure 1.13). The apical tier gives rise to the shoot meristem and the
adaxial side of the cotyledons while the basal tier forms the abaxial part of the cotyledons,
hypocotyl, and the root and its meristem. The suspensor connects the embryo to maternal
tissue. The periclinal divisions of the proembryo give rise to the protoderm and ground tissues
of the pre-globular embryo. At the globular stage, the hypophysis which is the uppermost
suspensor cell divides asymmetrically. In the transition stage, the radial symmetry of the
proembryo changes to bilateral symmetry (Figure 1.13). Mature embryos consist of two
cotyledons, plus an embryonic stem and root.
1.4.2.6 Auxin and PIN protein localization
The plant hormone auxin is responsible for many aspects of plant development and the ability
of plants to adapt to ever-changing environments (Grunewald and Friml, 2011). The spatial
distribution of this hormone is governed by polar auxin transport (PAT) which is central to the
establishment of auxin gradients (maxima and minima). PAT occurs via the membrane localized
auxin efflux carriers of PIN-FORMED (PIN) family proteins that direct auxin fluxes. A large
number of internal and external signals is required for the determination of the polar

33
Figure 1.13: Arabidopsis embryogenesis.
Cartoon diagrams of ovule containing embryo sac, the developing seeds and mature seed.
The embryo stages within the developing seeds were detailed along with l ocalization of
PIN proteins and DR5 activities. Adapted from Pagnussat et al. (2005).

34
localization of the PINs. The Adenosine diphosphate Ribosylation Factor- Guanine
triphosphatase Activating Protein/ Guanine nucleotide Exchange Factor (ARF-GAP/GEF) family
of proteins that mediate vesicle transport are essential for PAT and plasma membrane PIN
localization. PIN proteins are not localized statically on plasma membranes but are recycled by
endo-exocytosis between membranes and endosomes (Dhonukshe et al., 2007, 2008).
GNOM/VAN7, an ARF-GEF associated with auxin signaling, determines the recycling of PINs
from endosomes to either apical or basal membranes (Geldner et al., 2003; Kleine-Vehn et al.,
2008). The serine-threonine kinase PINOID (PID) and Protein phosphatase2A (PP2A) determine
the phosphorylation status of PIN proteins (Bennett et al., 1995; Benjamins et al., 2001; Friml et
al., 2004; Michniewicz et al., 2007). Phosphorylated PIN proteins are targeted to the apical
plasma membrane, whereas dephosphorylated PIN proteins are targeted to the basal plasma
membrane.
During embryogenesis, PIN7 is the first PIN protein to be expressed upon zygote division,
directing the auxin flow first into the apical cell and subsequently, by re-locating to reverse the
auxin efflux, to the suspensor cells (Figure 1.13). PIN1 is expressed in the early stages, becoming
basally localized in the pro-vascular cells next to the hypophysis by the globular stage. In the
transition stage, PIN1 and PIN7are repositioned toward the flanks of the apical domain. At this
same stage, PIN4 is expressed in the hypophysis and later PIN3 in the columella precursor cells.
The directions of the auxin flow predicted by these PINs correspond with the expression of
green fluorescent protein (GFP) directed by the synthetic auxin-responsive promoter DR5 in
DR5rev::GFP transgenes (Figure 1.13). DR5 is a minimal promoter having multiple copies of the
TGTCTC auxin response element whereas DR5rev consists of nine repeats of the DR5 element in
reverse orientation directing expression of a modified GFP that is targeted to the endoplasmic
reticulum (Friml et al., 2003). Improper auxin distribution disrupts the apical-basal axis of the
embryos (Friml et al., 2003). Auxin continues to maintain its gradient even after germination

35
and organ initiation including the initiation of roots, leaf primordia, leaves, and inflorescences
(Benkova et al. 2003). Auxin distribution is also critical for vascular formation (Scarpella et al.,
2006), ovule development (Benkova et al., 2003), gamete specification (Pagnussat et al., 2005),
fruit formation, and seed dispersal (Sorefan et al., 2009).
1.4.3 Vascular development
The vascular system is a network of cells that interconnects all major plant organs and provides
a route for the transport of water, nutrients, and signaling molecules; it also contributes
physical support to plants helping them remain upright and avoid the effects of pathogens
(Figure 1.14; Berleth and Mattsson, 2000; Dengler and Kang, 2001; Fukada, 2004). The
vasculature of an adult plant is pre-established in the embryo and differentiates at predictable
positions and times during development. However, these arrangements can change in response
to local signals (Fukada, 2004).
1.4.3.1 Establishment and maintenance of vascular stem cells
In plants, the establishment of vascular stem cells in the embryo is relatively less complex than
the vascular arrangement that appears in mature plants (Goldberg et al., 1994). The genetic
programs that establish these stem cells need to be active and continue post-embryonically.
These genetic programs, including the regulatory networks of vascular stem cell initiation and
establishment, have been studied extensively in recent years. The phytohormones auxin,
cytokinin (CK), and brassinosteroids (BR), along with signaling components such as Leucine-
Rich-Repeat (LRR), Receptor-Like Kinases (RLK), and the Clavata 3/ Endosperm surrounding
region (CLE) peptide have been identified as key regulators of vascular development (Zhou et
al., 2011).

36
1.4.3.2 Xylem and phloem tissue differentiation
All vascular tissues are derived from vascular stem cells (meristematic cells): pro-cambium and
vascular cambium. Procambial cells give rise to the precursor cells of phloem or xylem
depending on their position, with cell-to-cell communication playing a role in the determination
of this position. For example, in most higher plant stems the phloem is positioned toward the
periphery while xylem is isolated toward the centre. On the other hand, long-distance signaling
plays a role in the formation of continuous vascular strands in the apical-basal direction. The
xylem and phloem precursor cells become differentiated into distinct types of cells (Figure
1.15). Phloem precursor cells differentiate into the sieve tube elements, companion cells,
phloem parenchyma and phloem fibres; all cells comprise the phloem tissue. Xylem precursor
cells differentiate into xylem cells, which consists of tracheary elements (vessels and tracheids),
xylem parenchyma, and xylem fibres. At maturity, the tracheary elements differentiate further
through the deposition of secondary cell wall material and then undergo programmed cell
death to form the hollow tubes that allow fluid movement. The cell wall thickenings of the
tracheary elements, which may be annular, spiral, reticulate, or pitted, provide strength and
keep these hollow tubes from collapsing (Demura and Fukuda, 2007).
1.4.3.3 Factors affecting vascular differentiation
Vascular cell differentiation depends on many factors, including auxin, transcription factors and
Cks (Figure 1.16; Demura and Fukuda [2007]). Auxin triggers the vascular development program
whereas the activity of the homeodomain transcription factor (HD-ZIP III) family directs the
gene expression underlying the spatial information necessary for regulating cambial cell
specification and proliferation. CK on the other hand initiates and maintains the procambial
cells.

37
Figure 1.14: Schematic representation of the organization of the primary vascular tissues in Arabidopsis
Vascular tissue arrangement of the whole plant in longitudinal view together with cross-
section of shoot, cross-section of leaf, and cross-section of root tip. Adapted from
Nieminen et al. (2004).

38
1.4.3.3.1 Auxin
It is commonly thought that auxin ensures the continuation of vascular formation throughout
plant life. MONOPTEROS (mp) is a mutant whose defects in auxin signaling and lower rate of
auxin transport cause it to fail to establish vascular stem cells (Hardtke and Berleth, 1998);
other mutants that fail to transport auxin, such as pin1/(PIN-FORMED1), trn1/(TORNADO1), and
lop1/(LOPPEDED), are also severely defective in vein formation (Galweiler et al., 1998; Carland
and McHale, 1996; Cnops et al., 2006). Similar vein
phenotypes are evident in plants in which auxin transport is inhibited by 1-N-
naphthylphthalamic acid (NPA, Mattsson et al., 1999). Moreover, mutants that cannot perceive
auxin, such as axr6/(AUXIN RESISTANT-6), and bdl/ (BODENLOS), are also incapable of proper
vein formation (Hamann et al., 2002; Hamann et al., 1999; Hobbie et al., 2000). Thus, defects in
auxin signaling, transport, and/ or perception have a significant effect on the formation of
vasculature.
The common element that links these auxin phenotypes can be traced back to problems in PIN
protein localization to the plasma membrane via vesicle transport (Figure 1.17; PIN trafficking;
Grunewald and Friml, 2011). The PIN auxin efflux carriers are located on specific points on the
plasma membrane that contact the basal end wall in both procambial cells and xylem
parenchyma cells. Interestingly, PINOID is also expressed primarily in xylem precursor cells and
xylem parenchyma cells. Thus, GNOM, which directs PINs to their proper apical basal
membranes, and PINOID, which phosphorylates PINs, together determine the localization of
PIN and ultimately establish the auxin gradients necessary for proper vascular differentiation,
as detailed in section 1.4.2.6.
Dengler (2006) presented an auxin-based model that explains the relationship between the
internal vascular arrangement and the external arrangement of lateral organs (phyllotaxis). For

39
Figure 1.15: Schematic model of xylem formation.
Procambial cells produced cambial cells that differentiate into phloem cells and xylem
cells. Xylem cells include tracheary elements (tracheids and vessel elements) and phloem
cells include sieve tube elements and companion cells. Both fibres and parenchyma cells
are part of xylem and phloem tissue. Based on the pattern of cell wall deposition two
types of vessels are observed: protoxylem vessels commonly have annular and spiral wall
thickenings and metaxylem vessels have reticulate and pitted thickenings. Modified from
Demura and Fukuda, (2007).

40
example, a vascular bundle that is seen in the stem cross-section represents either an individual
leaf trace or a parent strand that gives rise to a leaf trace. Based on the Dengler model auxin
first moves uniformly towards the shoot apical meristem from regions outside of it, and then
through the polar localization of PIN proteins, auxin is concentrated at points that identify the
positions of forthcoming leaf primordia. Following the outgrowth of the primordia, the PIN
proteins are redistributed toward the interior of the meristem along a narrow cell file to form
the procambial strand of the future midvein (Figure 1.18).
1.4.3.3.2 HD-ZIP III family
Arabidopsis thaliana homeobox (ATHB) genes, ATHB8 and ATHB15, of the HD-ZIP III family are
expressed strictly in the procambial or xylem precursor regions (Baima et al., 1995; Ohashi-lto
and Fukuda 2004). In regulating cambial
activity, these transcription factors act antagonistically: overexpression of ATHB8 or down
regulation of ATHB15 increases proliferation of xylem cells. Thus, members of the HD-ZIP III
family together regulate the specification and proliferation of xylem.
1.4.3.3.3 Cytokinin
CK also plays a critical role in the formation and maintenance of procambial cells. The genes
involved in CK biosynthesis are expressed in the tips of root vascular bundles (Mähönen et al.,
2000). The CK receptor histidine kinase encoded by the WOL/CRE1/AtHK4 (Mähönen et al.,
2000) genes are expressed preferentially in the procambium whereas two other CK receptor
genes (AtHK2 and AtHK3) are expressed in vascular cells. CK also induces response regulators
that negatively or positively control CK signaling responses in vascular tissues: ARR15 in
procambial cells but not in xylem and phloem cells, and ARR16 in the pericycle. Taken together,
these factors indicate that CK is a contributing regulator for the maintenance of procambial
activity. In addition, CK also plays a role in the specification of phloem (Mähönen et al., 2000)
and in the inhibition of protoxylem differentiation (Mähönen et al., 2006).

41
Figure 1.16: Factors effecting vascular development
Genes (blue boxes) and phytohormones (orange) interactions in xylem and phloem
development both at cellular and tissue level are presented. Modified from Demura and
Fukuda, (2007).

42
1.4.3.3.4 Brassinosteroids
The phenotype of BR biosynthetic and signaling mutants reveals that this steroid hormone is
involved in promoting xylem differentiation (Caño-Delgado et al., 2004). BR biosynthesis-
deficient mutants, constitutive photomorphogenic dwarf (cpd; Szekeres et al., 1996) and dwarf7
(Choe et al., 1999), have decreased xylem formation. Yamamoto et al. (1997, 2007) report that
BRs are involved in tracheary development such as secondary cell wall formation and
programmed cell death. As well, the inhibition of BR signaling with brassinazole or the
phenotype of BR receptor mutants (bri) has led to the suggestion that BRs specify xylem
precursor cells in order to maintain a proper ratio between the phloem and the xylem (Asami et
al., 2000; Caño-Delgado et al., 2004).
Ibañes et al. (2009) used mathematical modeling to show that the pattern of vascular bundle
arrangement in Arabidopsis stem sections is coordinated by auxin and BR. Their model predicts
that BRs affect vascular patterning by controlling the proliferation of pre-vascular cells. BR
signaling mutants, bri1 and cpd, have fewer pro-cambial cells, leading to the generation of
fewer vascular bundles than in the WT.
In addition to the effects of auxin, HDZIP III, CK, and BR that are described above, many other
factors including non-classical types of arabinogalactan proteins, xylogens, transcription factors
(eg., NAC), and microRNAs have been implicated in vascular development (Figure 1.16). The
contribution of the PA, Tspm, to vascular development is also of emerging importance (Zhou et
al., 2011).
1.4.3.3.5 Thermospermine and plant development
Tspm that is generated from Spd is present in very low quantities in plants (Kakehi et al., 2008).
Although PA genes have been reported to be preferentially expressed in phloem (Pommerrenig

43
Figure 1.17: The molecular mechanism of auxin transport
Auxin can move from one cell to another either by diffusion (arrows) or via
transmembrane proteins. Auxin influx carriers (AUX proteins) are localized to the apical
membrane whereas auxin efflux carriers (PIN proteins) are localized to the basal
membrane. This asymmetrical PIN localization causes a polarized flow of auxin. PIN
proteins are recycled in cells: transported from endomembranes to the plasma membrane
by endosomes. Modified from Fukuda (2004) and Berleth etal. (2000).

44
et al. 2011), studies with RNA in situ hybridization and GUS reporter gene analysis shows that
ACL5 is expressed specifically in the pro-cambium during embryogenesis, starting in early
globular embryos and persisting into the bent cotyledon-staged embryo phase (Clay and
Nelson, 2005). Its expression has also been detected during primary root development and
early leaf development and in axillary buds and vascular bundles in stems. The recent high-
resolution observation of ACL5 expression with in situ hybridization and GUS analysis of resin-
embedded sections has revealed that the expression is specifically in the xylem vessel elements
of the stems, hypocotyls, and in the transition zone between the silique and the pedicels
(Muñiz et al., 2008). The ACL5 expression was visualized soon after the expansion of the vessel
elements but before the initiation of the secondary wall deposition. Cross-sections of leaf
midveins and of the inflorescence stems of acl5 mutants show an increased number of xylem,
phloem, and cambial cells (Hanzawa et al., 1997; Clay and Nelson, 2005). Interestingly, these
mutants have reduced capability with respect to polar auxin transport (66.2 % compared to the
WT) and an unregulated transcript level of five HDZIP III genes, including ATHB8 (~ 7 fold; Imai
et al., 2006). In addition, Muñiz et al. (2008) provide evidence that Tspm prevents the
premature maturation of the xylem vessels, thus supporting the premise that Tspm is involved
in vascular development.
Based on the literature presented here, the MTN activity that links many critical pathways could
potentially affect plant growth and development, specifically in the areas of reproduction and
vascular development. However, the specific effects or modes of action in plants remain
unclear.

45
Figure 1.18: Model showing the direction of auxin movement, leaf primordia initiation, and vascular strand formation
Arrows show the auxin flow that is directed by the PIN1 proteins toward the centre of the
incipient primordia (I1, I2) and toward internal tissues during primo rdia growth (P1, P2).
The long blue lines indicate the parent vasculature; the short blue lines, the primo rdial
vasculature; and the orange lines, the connecting procambium. Modified from Dengler
(2006).
46
1.5 Objectives of the research
Most of the research work presented in this thesis was obtained by designing experiments with
the aim of determining the functional significance of MTN in plant growth and development.
The first two chapters contain the findings that address the following objectives:
1. To characterize the MTN-deficient mtn1-1mtn2-1 mutant in detail.
2. To dissect the primary defect of MTN-deficiency in plant growth and development.
During this study I discovered that the application of exogenous Spd changed the sterile
phenotype of mtn1-1mtn2-1 to be fertile. Chapter 3 contains research findings to examine this
Spd-dependent fertility recovery with the following objective.
3. To establish the basis behind Spd-dependent fertility recovery of mtn1-1mtn2-

47
Chapter 2: Recycling of methylthioadenosine is essential for normal
vascular development and reproduction in Arabidopsis thaliana
2.1 Overview
5’-methylthioadenosine (MTA) is the common by-product of polyamine (PA), nicotianamine
(NA) and ethylene biosynthesis. The methylthiol moiety of MTA is salvaged by 5’-
methylthioadenosine nucleosidase (MTN) in a reaction producing methylthioribose (MTR) and
adenine.. The MTN double mutant, mtn1-1mtn2-1, retains ~14% of the MTN enzyme activity
present in the wild type, and displays a pleiotropic phenotype that includes altered vasculature
and impaired fertility. These abnormal traits were associated with increased MTA levels, altered
PA profiles and reduced NA contents. Exogenous feeding of PAs partially recovered fertility
whereas NA supplementation improved fertility and also as reversed interveinal chlorosis. The
analysis of PA synthase crystal structures containing bound MTA suggests that the
corresponding enzyme activities are sensitive to MTA content. Mutant plants that expressed
either MTN or human methylthioadenosine phosphorylase (which metabolizes MTA without
producing MTR) appeared wild type, proving that the abnormal traits of the mutant are due to
MTA accumulation rather than reduced MTR. Based on our results, we propose that the
possible key targets affected by this increase in MTA content are thermospermine synthase and
eukaryotic initiation factor 5A modification.

48
2.2 Introduction
The Met recycling pathway (or Yang cycle) is present in all types of organisms where its primary
role is to recycle sulfur-containing metabolites (Albers, 2009). In most plants, bacteria and
protozoa, 5'-methylthioadenosine (MTA) nucleosidase (MTN; EC 3.2.2.16) irreversibly
hydrolyses MTA to methylthioribose (MTR) and adenine (Figure 2.1); the resulting MTR is
phosphorylated to 5'-methylthioribose 1-phosphate (MTR-1P) by MTR kinase (MTK; EC
2.7.1.100). Recently, two novel enzymes that act as intermediate steps in generating Met from
MTR-1P were identified and characterized: 5'-methylthioribose-1-phosphate isomerase and
dehydratase-enolase-phosphate-complex1 (Pommerrenig et al., 2011). The activities of both
enzymes, along with the others of the Yang cycle, are expressed primarily in phloem tissue but
some are also weakly expressed in shoot bundle sheaths (e.g. MTRK) and leaf epidermis (e.g.
MTN2).
In some eukaryotes, such as humans, MTA is converted to MTR-1P by methylthioadenosine
phosphorylase (MTAP; EC 2.4.2.28). Continuous MTA metabolism is extremely important in
mammals as loss of MTAP activity is associated with cancer (Bertino et al., 2011), while
accumulation of MTA has been linked to tumor progression (Stevens et al., 2009).
MTA metabolism may be equally important to plants, as it is the by-product of polyamine (PA),
nicotianamine (NA) and ethylene biosynthesis (Figure 2.1). PAs such as putrescine (Put),
spermidine (Spd), spermine (Spm) and thermospermine (Tspm) are cationic organic molecules
that are essential for plant development and stress responses. Some of the documented roles
of PAs include vascular differentiation, embryogenesis, cell division and responses to abiotic
stresses such as salt, osmotic, drought and wounding (Vera-Sirera et al., 2010; Takahashi and
Kakehi, 2010). For example, recent evidence suggests roles for both Tspm and H2O2 produced
from PA catabolism in the control of xylem differentiation (Muñiz et al., 2009; Tisi et al., 2011).

49
Figure 2.1: Overview of enzymatic reactions that generate 5'-methylthioadenosine (MTA)
MTA is generated as a by-product of polyamine (PA), nicotianamine (NA) and ethylene
biosynthesis. 5’-methylthioadenosine nucleosidase (MTN, EC 3 .2.2.16) hydrolyses MTA to
5’-methylthioribose (MTR) and adenine. The MTR is converted to Met through several
steps, the first of which, MTR kinase (EC 2.7.1.100), catalyzes the production of MTR -1P.
Methionineadenosyltransferase (EC 2.5.1.6) condenses Met and ATP to form S-
adenosylmethionine (SAM). SAM decarboxylase (SAMDC, EC 4.1.1.50) removes carboxyl
group from SAM to generate decarboxylated SAM (DCSAM). An aminopropyl group is
transferred from DCSAM when putrescine (Put) is converted to spermidine (Spd ) via Spd
synthase (SPDS, EC 2.5.1.16). Similarly, another aminopropyl group is transferred from
DCSAM when Spd is converted to spermine (Spm) or its isomer thermospermine (Tspm)
via Spm synthase (SPMS, EC 2.5.1.22) or Tspm synthase (ACL5, EC 2.5.1.79) res pectively.
NA is produced from the condensation of three SAM molecules by NA synthase (NAS, EC
2.5.1.43). 1 amincyclopropane-1-carboxylic acid (ACC) is also derived from SAM by ACC
synthase (ACS, EC 4.4.1.14) in the rate-limiting step in the biosynthesis of ethylene. The
dotted line indicates that there are many steps involved in converting MTR into Met. The
compounds that are in bold letters are the key compounds of interest in the present
study.
Met
SAM
DCSAM
MTA MTR
Put
Spd
Spm/Tspm
NAACC
Ethylene
ATP
Pi PPi
SAM decarboxylase
ACC synthase
Spd synthase
Spm/Tspm synthase
NA synthase
MTA nucleosidase (MTN; EC3.2.2.16)
adenineH2O
Yang cycle
adenine
OHHO
SOH
O
OHHO
SO
MTR – 1P
MTRkinase
SAM synthase
COOH

50
PAs have also been implicated in RNA processing, chromatin remodeling, membrane fluidity
and protein activation (Baron and Stasolla, 2008, Takahashi and Kakehi, 2010). NA, a product of
another MTA generating reaction, is a metal chelator involved in long distance transport of
ions. NA ion complexes ultimately support gametogenesis and embryo development (Curie et
al., 2009 and Lan et al., 2011). Finally, ethylene is a phytohormone that impacts numerous
processes, including seed germination, seedling growth, fruit ripening, flower development and
abscission (Yang and Hoffman, 1984).
The Arabidopsis genome has two MTN-encoding genes (At4g38800 and At4g34840) that are
annotated as AtMTN1 (MTN1) and AtMTN2 (MTN2), respectively (Rzewuski et al., 2007). Public
microarray data indicate that MTN1 transcripts are about 10 times more abundant than MTN2
transcripts across different organs (Zimmermann et al., 2004). Using a northern blot of MTN1
Oh et al. (2008) confirmed that MTN1 is expressed in roots, stems, flowers and both cauline
and rosette leaves. However, when the microarray data expression abundance of the MTN
genes was compared in the tissues, MTN1 and MTN2 were uniquely expressed in different
tissues (Winter et al., 2007). MTN1 is expressed in cortex of roots and xylem of stems. On the
other hand, MTN2 is expressed in apical basal tissues of embryos, developing pollen stages,
stigma and ovules, and leaf guard cells (Winter et al., 2007). Recently it has also been shown
that both MTNs are abundant in the phloem tissue (Pommerrenig et al., (2011). Although MTN1
and MTN2 polypeptide sequences share 64% amino acid sequence identity they have distinct
substrate specificities and pH optima (Siu et al., 2008). Thus, it was initially inferred that these
two enzymes may have distinct roles in plant metabolism: in vitro MTN1 accepts only MTA as a
substrate while MTN2 can also accept S-adenosylhomocysteine to a limited extent (Siu et al.,
2008). More recent crystallography and protein dynamic analyses revealed that MTN1 binds to
S-adenosylhomocysteine but is incapable of hydrolysing it (Siu et al., 2011).
Recently we described the physiology of several single T-DNA insertion mutants in MTN1 and
MTN2: mtn1-1 (T-DNA insertion in the third intron), mtn1-2 (T-DNA insertion in the sixth exon),

51
mtn2-1 (T-DNA insertion in the fourth exon) andmtn2-2 (T-DNA insertion in the fourth exon)
(Bürstenbinder et al., 2010). Based on biochemical analyses, we established that MTN1 is
responsible for 80% of the MTN activity in crude extracts of four-day-old seedlings and rosette
leaves of three-week-old plants grown on media (Bürstenbinder et al., 2010). When grown on
soil or germinated on sulfur sufficient-media containing 500μM MgSO4, seedlings of single
mutants were phenotypically indistinguishable from the wild type (WT). However, when the
sulfur source is 500μM MTA, both mtn1-1 and mtn1-2 mutants have impaired seedling and root
growth (Bürstenbinder et al., 2010). These MTN-deficient seedlings also have altered PA
profiles with increased Put and Spm compared to seedlings grown on media containing 500µM
MgSO4. Interestingly, no significant changes in either NA content or ethylene production were
detected in either mtn1-1 or mtn2-1. In an attempt to lower MTN levels further, the two
homozygous mutant lines were crossed and isolate a double mutant was isolated The resulting
mtn1-1mtn2-1 plants exhibited a pleiotropic phenotype with developmental abnormalities
(Bürstenbinder et al., 2010). The details and physiological basis for these pleiotropic traits, in
terms of MTN’s enzyme activity and MTA regulation in general was unclear.
Here, we investigate the effect of MTN deficiency by a comprehensive examination of the
development and physiology of the homozygous mtn1-1mtn2-1 double mutant. In addition to
measuring its residual MTN enzyme activity and profiling relevant metabolites, we analyzed the
effect of MTA accumulation based on the estimated structures of Spd and Tsp synthases co-
crystallized with this ligand. The effect of exogenous supplementation of relevant compounds
on the mutant phenotype was tested to reveal abnormalities in the cellular metabolism of the
MTN-deficient plants. The results of these analyses reveal the critical importance of MTA
recycling maintaining the biosynthesis of NA and PAs that are essential for normal plant
vascular development and reproduction.

52
2.3 Methods
2.3.1 Plant material and growth conditions
2.3.2 Microscopy
Seeds for mtn1-1 (SALK_085385)and mtn2-1 (SALK_071127)single T-DNA insertion lines used to
generate mtn1-1mtn2-1 were obtained from the Arabidopsis Biological Resource Center. The
male sterile mutant, apt1-3 (Moffatt and Somerville, 1998), was used for reciprocal crosses. All
Arabidopsis seeds were surface sterilized with chlorine gas before sowing on plates with half
strength MS medium solidified with 0.8% (w/v) agarose (Murashige and Skoog, 1962); these
plates were incubated in the dark at 4°C for 48 h for seed stratification. On the third day after
sowing, plates were transferred to a tissue culture chamber (TC7, Conviron, Winnipeg, Canada)
under continuous light: 24h at 210C with 80µmol m-2s-1 photosynthetically active radiation for
10 days. Seedlings were then transplanted to individual pots (25 cm2) containing a 1:1 soil
mixture of Sunshine LC1 mix and Sunshine LG3 germination mix (SunGro Horticultural Inc,
Washington, USA) and maintained in a growth chamber (Conviron, Winnipeg, Canada)under
long day conditions: 16h at 220C with 150 µmol m-2s-1 photosynthetically active radiation. The
plants were watered every two days and fertilized with 20:20:20 (N: P: K) fertilizer mix (Plant
products Co Ltd, Brampton, Canada) once a week until maturity. Hydroponic experiments were
set up as described in Pierre et al. (2003) and maintained in the same growth chambers.
To document the first obvious developmental defect of mtn1-1mtn2-1 compared to WT, plate-
based-growth and soil-based-growth assays were conducted as detailed in Boyes et al. (2001).
In the plate-based assay the time taken to develop the first true leaves >1mm along with daily
lengths of roots were measured over duration of 11 days. The reproductive defects were
evaluated in the stage 14 flowers as described by Smyth et al. (1990).

53
Buds and rosette leaf samples were obtained from WT and mtn1-1mtn2-1 plants two weeks
after bolting unless otherwise stated. When sampled, WT plants were five-weeks-old whereas
mtn1-1mtn2-1 plants were approximately seven-weeks-old in order to similar developmental
stages to be evaluated. Samples were collected before noon for all the experiments.
2.3.2.1 Bright- light microscopy
Developmentally similar (i.e., having the same number of first order veins arising from the mid
vein) WT and mtn1-1mtn2-1 rosette leaves and stage 14 pistils (Smyth et al., 1990) were first
incubated in clearing solution (3:1, glacial acetic acid:ethanol [EtOH]) for 2 h. Upon clearing, the
tissue was rehydrated by moving it from 70% EtOH to water in a gradient series of 15 min
intervals each, and softened by incubating overnight in 8 M NaOH. For visualization, leaf
samples were then stained with 0.1% (w/v) Toluidine Blue O (TBO; pH 6.8) for 15s and observed
with a Zeiss Axiovert 200M microscope (Carl Zeiss Inc, Toronto, Canada). The ovules of the
cleared pistils were observed with Differential Interference Contrast (DIC) optics of a Zeiss
Axiovert 200M microscope.
The same stage leaves of both genotypes were fixed in solution (50 mM sodium cacodylate, 2%
paraformaldehyde [w/v, pH 7], 0.1% glutaraldehyde) for 1 h under vacuum at room
temperature (RT). The samples were then transferred to fresh fixative and incubated overnight
at 4°C. After the appropriate amount of fixation, the samples were dehydrated in a series of
EtOH under vacuum at RT, going from 10 to 70% EtOH in 15% intervals for 1 h each. The
samples were left in 70% EtOH and 0.2% eosin overnight at 4°C. Once fully dehydrated, the
tissue was slowly infiltrated with LR White plastic resin (hard grade, Canemco, Mississauga,
Canada), in a series of EtOH to resin volumes: 3:1, 1:1, 1:3 for 2 h each, then 100% LR white for
1 h, then in fresh LR overnight. Once the samples were fully infiltrated with resin, the LR white
was refreshed and the samples were polymerized in a 60-65°C oven for 2-24 h. Once the resin

54
had hardened, tissue was sectioned at 1 µm thickness using an ultramicrotome (UltracutE,
Reichert, New York, USA) and stained with TBO for observation with Zeiss Axiovert 200M
microscope.
2.3.2.2 Scanning Electron Microscopy
Anthers of stage 14 flowers from WT andmtn1-1mtn2-1were placed in fixative (4% [w/v]
paraformaldehyde [pH 7], 2% [w/v] glutaraldehyde, 1x potassium bisulphite) for 1 h under
vacuum at Room Temperature (RT). Upon replacing the fixative solution, the samples were left
to incubate overnight at 4°C. The tissue was then dehydrated in a 10% ethanol gradient (50% -
95%) at 30 min intervals under vacuum. Upon reaching 95% EtOH concentration, samples were
left overnight at 4°C.The samples were then moved to HPLC-grade acetone for 2 h at RT. The
samples were dried using a mass critical point dryer, mounted on 2″ stubs and sputter coated
with gold particles. The tissue was visualized using a Hitachi S570 scanning electron microscope.
2.3.2.3 Laser Scanning Confocal Microscopy
The expression patterns of DR5rev::GFPstem sections of both WT and mtn1-1mtn2-1
backgrounds were observed using a Carl Zeiss LSM 510 confocal microscope (Carl Zeiss Inc.
Jena, Germany). The GFP signals were excited with an argon ion laser at 488 nm, and emissions
were captured with a 505/530 nm band pass filter. Chlorophyll autofluorescence was also
excited at 488 nm and was a captured with 650 nm long pass filter.
2.3.3 Chemical complementation experiments
Seeds were placed on ½ MS media supplemented with one of the following chemicals: 20 μM of
NA (crude KI extract, see below), 20 μM of WT extract, 100 μM Spd, 100 μM Spm, and 50 μM
Tspm. After two days of cold incubation these plates were transferred tocontinuous light for 21
days. The seedlings were then transplanted to soil or hydroponic media and grown under long

55
day conditions. In the case of soil-grown plants, chemicals were supplied daily as drops (~20μl)
in ½ MS to each vegetative and reproductive meristems over a period of 3-4 weeks. However,
Tspm was not applied as daily drops due to its limited availability.
2.3.4 Extraction of NA from K1 plants
NA-overproducing Arabidopsis transgenic lines (K1, Pianelli et al., 2005) were grown until the
full rosette stage. NA was extracted from the rosette leaves ground in 80oC; corresponding
extracts from WT leaves were used as controls. The K1 extract were quantified and had 50 pmol
mgFW-1 NA compared to WT and neither KI nor WT extracts contained detectable PAs,
indicating that the K1 is a unique source of NA.
2.3.5 Complementation of mtn1-1mtn2-1
For complementation, pMTN1::MTN1, UBQ10::MTN1 coding sequences (CDS) and
UBQ10::hMTAP CDS were introduced to mtn1-1mtn2-1 mutants. The UBQ10(AT4G05320)
promoter (693bp) was amplified using UBQ10pF and UBQp blunt R primers (Table S1) and
cloned in to pSAT5.nosP.RNAi.nosT (EUO49865) with AgeI and HincII to generate
pSAT5.UB10p.nosT.This vector was then used to introduce the UBQ10 promoter for MTN1 and
hMTAP CDSs. Binary vectors pGreenII 0229 (www.pgreen.ac.uk) and pPZP-RCS2-BAR (CD3-
1057, Arabidopsis Biological Resource Centre) were used for Agrobacterium–mediated
transformation.
Genomic MTN1 was amplified using the following primers: gMTN1-F and gMTN1-R (Table S1).
The 1.9 kb genomic MTN1 fragment with162 bp of promoter was then digested with Spe1 and
BamHI and cloned directly into binary vector pGreenII 0229. The MTN1 cDNA was amplified
with the following primers: MTN1CDS-F and MTN1CDS-R (Table S1). The resulting 0.8kb
fragment was digested with XmaI and BamHI and cloned first into pSAT5.UB10p.nosT.

56
After (Table S1), cloned into the SmaI site of pSAT5-UBQ10p-nosT and the resulting
UBQ10::hMTAP cassette inserted into pPZP-RCS2-BAR.
sequencing, the UB10p::CDS cassette was transferred top PZP-RCS2-BAR. Similarly, the 0.8 kb
hMTAP cDNA fragment was amplified from hMTAP cDNA with hMTAP-F and hMTAP-R primers
MTN1 constructs were introduced into Agrobacterium strain GV3101Soup, while
UBQ10::MTN1CDS and UBQ10::hMTAP were placed in Agrobacterium strain GV3101.
Homozygous mtn1-1 plants were transformed with their respective Agrobacterium strains using
the floral dipping method (Bechtold et al, 1993). Transgenic T1 individuals were selected for by
spraying 10 day-old soil grown seedlings with 40 mg/ L Basta (Glufosinate Ammonium, Wilson
laboratories inc. Dundas, Canada). The expression of MTN1 and hMTAP in the surviving T1
plants was confirmed by immunoblot, and successful transformants were crossed with mtn1-
1/mtn1-1MTN2-1/mtn2-1plants. The resulting F1 progeny was germinated on media containing
Basta and genotyped by PCR to identify mtn1-1mtn2-1 F2 individuals. F2 seeds of three lines
were selected and screened on Basta supplemented MS media and genotyped to identify
mtn1-1mtn2-1seedlings.
2.3.6 RT-PCR
Total RNA was extracted from leaves and buds of WT and mtn1-1mtn2-1 plants using Tri Pure
Isolation Reagent (Roche). Two micrograms of total RNA was used for first strand synthesis with
SuperScriptTM reverse transcriptase (Invitrogen) according to the manufacturer’s instructions.
PCR reactions were performed as described in Bürstenbinder et al., 2007 using AtMTN1-F3,
AtMTN1-R3, AtMTN2-F1, AtMTN2-R1 and Actin 8F and Actin 8R primers (Table S1) to determine
the transcript abundance of MTN1 (851bp), MTN2 (306bp) and actin (700bp).

57
2.3.7 MTN enzyme assay
Bud protein extracts were prepared from developmentally matched flowering plants in 50mM
potassium phosphate buffer [pH 7, Bürstenbinder et al., 2010]. Twenty micrograms of soluble a
DU530 spectrophotometer (Beckman Coulter, Krefeld, Germany) at 470 nm modified from the
protocol outlined in Bürstenbinder et al. (2010).
protein from buds was used to determine MTN specific activity using a xanthine oxidase-
coupled enzyme assay (Lee et al., 2005). Absorbance was measured every 10 min over 1 h with
2.3.8 Polar auxin transport assay.
Polar auxin transport in primary inflorescence stem segments of WT, mtn1-1mtn2-1, and tkv
was measured using a modification of procedure provided by Okada et al. (1991) method as
described in Clay and Nelson (2005). The inflorescence stem segments were immersed in 14C
labeled IAA (Sigma) in either an acropetal or basipetal orientation. After 19h of incubation, the
uppermost 5mm of the stem segments were removed and incubated overnight in liquid
scintillation cocktail (Cytoscint, MP Biomedicals, and Toronto, Canada). Released radioactivity
was counted using a scintillation counter (Model LS 1701, Beckman, Munich, Germany).
2.3.9 Immunoblot analysis
Ten micrograms of total soluble protein was extracted as described above, separated on a
12.5% SDS polyacrylamide gel (Laemmli, 1970) and transferred onto a polyvinylidenedifluoride
membrane using a semi-dry electro-blotting system (Bio-Rad laboratories, Mississauga,
Canada). The membrane blot was cut near the 34 kDa marker so the bottom portion could be
incubated for 2 h with anti-MTN1 (1: 2500) antibody, while the top portion was incubated for
the same time with monoclonal antibody for actin (MP Biomedicals, Toronto, Canada; 1: 3000).
Bound antibodies were detected following incubation with horseradish peroxidase-conjugated

58
secondary antibodies, using the ECL Plus Western Blotting Detection System (GE Healthcare,
Mississauga, Canada) and Amersham HyperfilmTM ECL.
2.3.10 Two- dimensional electrophoresis
Protein was extracted using phenol followed by ammonium acetate-methanol precipitation as
described by Zheng et al., (2007). focusing on a Multiphore II system (GE Healthcare,
Mississauga, Canada) using immobiline dry strip gels with non-linear pH gradients (pH 4-7NL).
Protein was quantified using RC/DC protein assay kit (Bio-Rad laboratories, Mississauga,
Canada). These proteins were then separated based on isoelectric These strips were placed on
SDS polyacrylamide (12.5%) gels as detailed in Zheng et al., (2007). The separated proteins were
then blotted as described for immunoblot analysis above. The membrane blot was then
incubated overnight at 40C, with eIF5A specific primary antibody (1: 3000).The blots were
detected as described above. Digital images of these films were analysed using Image Quant TL
analysis software (GE Healthcare, Mississauga, Canada).
2.3.11 Determination of PA content
Rosette leaves and inflorescences of WT and mtn1-1mtn2-1 were mixed with 5% (v/v)
perchloric acid at a ratio of 1:4 (w/v) and frozen at –20ο C. Samples were further processed and
Put, Spd and Spm were quantified by high performance liquid chromatography as described by
Minocha et al. (1990, 1994).
2.3.12 Determination of NA content
Nicotianamine was extracted from leaves and inflorescences of the WT and mtn1-1mtn2-1
plants and quantified after labeling with 9-fluorenyl methyl chloroformate as described in
Supplementary material S1 of Klatte et al. (2009).

59
2.3.13 Determination of MTA content
Leaves and inflorescences of the WT and mtn1-1mtn2-1 plants (0.1 g) were ground in liquid
nitrogen to a fine powder, which was extracted with 1 ml of 0.1 M HCl for 15 min at 4°C. Cell
debris were removed by centrifugating twice at 28,000 g for 15 min at 4°C. MTA was
determined as described in Rzewuski et al. (2007) using the same HPLC system.
2.3.14 Detection of metal contents
Samples were dried for constant weight at 60oC, and subjected to acid digestion with Omni-
Trace1 nitric acid (EMI Scientific), and then heated to 85 – 90oC. Nitric acid blanks were
processed to ensure that metals were not added during sample preparation. The
standardsTomato (NIST Standard #1573a) and Corn (NIST Standard # 1573a) leaves were also
processed without sample to quantify the recovery of Zn, Cu, Mn and Fe during the extraction
procedure. Filtered samples were prepared and analyzed for metals as described by Gadapati
and Macfie (2005) by inductively coupled plasma atomic emission spectroscopy (ICP-AES).
2.3.15 Modeling of MTA inhibition for Tspm synthase and Spd synthase 1
A 3-D model of ACL5 was built by Swiss-Model suite (Arnold et al., 2006) using the crystal
structure of PA aminopropyl transferase from Thermus thermophilus (PDB ID 1UIR; Ohnuma et
al., 2011) as a template (39% identity). The crystal structure of Arabidopsis Spd synthase1 is
available in PDB (PDB ID 1XJ5). To obtain Tspm synthase-MTA and Spd synthase1-MTA
complexes, MTA was docked using DOCK 4.0 (Ewinget al., 2001). Programs COOT (Emsley and
Cowtan,2004) and PyMOL(DeLano Scientific, San Carlos, Canada) were used for structure
visualization and figure preparation.

60
2.4 Results
2.4.1 MTN activity in mtn1-1mtn2-1 mutants reflects decreased transcript and
protein abundance
RT-PCR was performed on cDNA isolated from the buds and rosette leaves of WT and mtn1-
1mtn2-1 plants. In both organs, MTN1 transcript levels were higher than MTN2 in the WT
background (Figure 2.2A). A comparison of transcript abundance in mtn1-1mtn2-1 revealed
substantially decreased MTN1 and undetectable levels of MTN2 in both leaves and buds.
Immunoblot analysis (Figure 2.2B) showed a similar abundance of MTN1 protein in WT leaves
and buds but reduced levels in mtn1-1mtn2-1. Interestingly, MTN-deficient buds had higher
amounts of MTN1 than leaves. As documented previously by Bürstenbinder et al. (2010), MTN2
protein cannot not be detected in either WT or mtn1-1mtn2-1 tissues by immunoblotting with
the appropriate antibody.
WT and mutant bud extracts were assayed for MTN enzyme activity to determine whether or
not this correlated with MTN protein abundance and phenotype. Floral buds were chosen for
the assay based on preliminary studies indicating that this organ had the highest MTN specific
activity (Figure S1). Compared to the 7 - 8% retained MTN activity observed in mtn1-1 seedlings
grown on MTA (Bürstenbinder et al., 2010), mtn1-1mtn2-1 buds had 14% residual MTN activity
(1.21 ± 0.27 nmol mg-1 protein min-1 in WT; Figure 2.2C). Thus our results show that mtn1-
1mtn2-1 is a knock-down mutant, with MTN1 contributing to the residual MTN activity.
Attempts to create a mutant completely lacking MTN activity by crossing homozygous knock-
out lines, mtn1-2 and mtn2-2, failed due to embryo lethality.

61
Figure 2.2: MTN transcript and protein abundance with corresponding enzyme activity
Results are averages (± SD) of 3-10 independent biological replicates.
(A) RT-PCR showed that MTN1 and MTN2 transcript abundance was reduced in mtn1-
1mtn2-1. Actin was used as the reference gene to ensure equal loading of the cDNA.
N=3.
(B) Immunoblot analysis indicated that MTN1 was present in buds and leaves of WT. In
mtn1-1mtn2-1 MTN1 was considerably lower in buds and undetectable in the leaves.
Detection of actin protein confirmed equal protein loading. N=3.
(C) Specific enzyme activity of MTN1 was measured in buds harvested from plants two -
weeks after bolting. Statistically significant variables are indicated by different letters
(P < 0.05; N = 10).

62
2.4.2 MTN deficiency affects both vegetative and reproductive development
The mtn1-1mtn2-1 mutants developed no obvious defects until the formation of the first true
leaves. Subsequently an array of abnormalities developed upon activation of the floral
meristem. Here we focus on the changes in vascular development and reproduction.
2.4.2.1 Vegetative phase phenotypes
Ten days after germination (DAG), the first true leaf of WT seedlings is greater than 1 mm in
length (stage 1.02 described in Boyes et al., 2001; Figure 2.3A). In comparison to WT, mtn1-
1mtn2-1 seedlings did not reach this stage until 12 days after sowing. In addition to their
delayed development, the first true leaves of mtn1-1mtn2-1 exhibited interveinal chlorosis
(Figure 2.3B): a condition where the veins of the leaf remain green while the area between the
veins becomes yellow in color. This chlorosis was most notable in emerging young leaves when
seedlings were grown on ½ strength Murashige and Skoog (MS; Murashige and Skoog, 1962)
medium (as opposed to soil). Upon maturation of the leaves or transfer of the plants to soil, the
interveinal chlorosis gradually disappeared.
As the mtn1-1mtn2-1 mutants matured, abnormalities of the rosette leaves became apparent.
Clearing and observation of the 6th leaf revealed an increase in venation, particularly adjacent
to the leaf margins (Figure S2.2A, B). Leaves of mtn1-1mtn2-1 leaves also had thicker mid-veins
(Figure 2.3C, D). Further examination of embedded leaf sections showed that the thicker veins
in mtn1-1mtn2-1 resulted from increased numbers cells in the xylem, phloem and cambial cells
(Figure 2.3E, F). Irrespective of the larger leaves, the leaf vasculature of mtn1-1mtn2-1 was
similar to that of the Tspm synthase mutant, thick vein (tkv, Clay and Nelson 2005), which is
allelic to acaulis5 (acl5; Hanazawa et al., 1997; Kakehi et al., 2008). ACL5 is specifically
expressed in xylem vessel elements and both acl5 and tkv have an over-proliferation of xylem
vessels in their stems. This increased xylem is proposed to result from reduced polar auxin

63
transport (PAT; Clay and Nelson 2005). Thus based on similarities to tkv and acl5, we assayed
auxin transport and followed vascular patterning in the stems of mtn1-1mtn2-1.
Auxin transport was measured in WT and mutant inflorescence stem segments using 14C-indole
acetic acid (IAA). The basipetal transport of 14C-IAA in the mtn1-1mtn2-1 mutant was 46% of
that detected in WT stems while the acropetal transport in the stem segments was normal. IAA
transport in tkv, measured as a control, was 64% that of WT (Figure 2.4A) which is consistent
with the initial description of this mutant by Clay and Nelson (2005).
We next examined stem cross-sections of the MTN double mutant in more detail. These WT
stems contain 6-8 symmetrically arranged vascular bundles ~2-3 cm above the base of primary
inflorescence (Figure 2.4B) whereas corresponding sections of mtn1-1mtn2-1 stems usually had
ten or more vascular bundles. These mutants also have increased number of small cells in all
stem tissues (Figure 2.4C). Furthermore, the symmetrical arrangement of the vascular bundles
in the WT was disrupted in the mtn1-1mtn2-1 mutant, leading it to have an irregular stem
circumference.
Auxin maxima developed from differences in auxin distribution in the shoot apical meristem
determine the position of leaf primordial initiation and formation of leaf traces (Dengler 2006).
These leaf traces are evident as vascular bundles in stem sections. Since the mtn1-1mtn2-1
mutants have an increased number of vascular bundles compared to WT. We examined GFP
production from a synthetic auxin-responsive promoter DR5rev::GFP (Friml et al., 2003) in this
mutant back ground. The resulting images showed that mtn1-1mtn2-1 stem cross sections
always had a greater number of auxin maxima than WT, corresponding to the mutant’s
increased number of vascular bundles (Figure 2.4D-G).

64
Figure 2.3 : Vegetative phenotypes of mtn1-1mtn2-1 compared to WT.
(A, B) WT and mtn1-1mtn2-1 seedlings at the 1.02 development stage, when first true
leaves are > 1mm. WT seedlings had green true leaves (A) compared to mutant
seedlings that exhibited interveinal chlorosis (B).
(C, D) Developmentally matched adult leaves (equal number of secondary veins arising
from the mid veins) of WT (C) and mtn1-1mtn2-1 (D), were cleared and stained with
Toluidine Blue O to reveal the increased vein thickness in mtn1-1mtn2-1. Trichomes
of the mutant were larger and the leaves tended to acquire more stain compared to
the WT. Scale bars = 1.5 mm.
(E, F) Transverse sections through the mid veins of developmentally matched adult leaves
of WT (E) and mtn1-1mtn2-1 (F) plants. The mtn1-1mtn2-1 exhibited an increase
number of xylem (xy), phloem (ph) and cambial (ca) cells. Scale bars = 15 µm.

65
2.4.2.2 Reproductive phase phenotypes
The mtn1-1mtn2-1 siliques arrested when they were 2-3 mm (stage 16 of the developmental
milestones described by Smyth et al., [1990]) and very few siliques produced viable seeds. To
determine the basis for this observed sterility, reciprocal crosses were performed: WT pollen
was applied to mtn1-1mtn2-1 pistils and mtn1-1mtn2-1 pollen grains were transferred to
stigma of the male sterile mutant apt1-3. The resulting fertilization was documented by
recording the number of crosses producing viable seeds (Table 1). Both mtn1-1mtn2-1and apt1-
3 pistils were receptive to WT pollen, and mtn1-1mtn2-1 pollen was able to germinate on WT
and apt1-3 pistils resulting in successful seed production in all cases. Thus, both mtn1-1mtn2-1
male and female gametes were capable of producing viable heterozygous progeny but with
reduced efficiency relative to WT.
Table 2.1: Viable seeds obtained from reciprocal crosses between WT and mutants (apt1-3 and mtn1-1mtn2-1).
Crosses were collected from 10 plants.
Percentage of crosses with viable seeds
Number of crosses
apt1-3(φ) x WT (σ) 84% N = 25
mtn1-1mtn2-1(φ) x WT (σ) 14% N = 50
apt1-3(φ) x mtn1-1mtn2-1(σ) 28% N = 50
Data source: Sarah Schoor
Further examination revealed several factors that contribute to decreased fertility in mtn1-
1mtn2-1. Anthers of stage 14 mtn1-1mtn2-1 flowers were indehiscent (Figure 2.5A). In order to
observe pollen, anthers of mtn1-1mtn2-1 needed to be opened manually (Figure 2.5D). These
anthers contained abnormally formed pollen grains (Figure 2.5E, F). Specifically, most of the
mtn1-1mtn2-1 grains were round in shape and lacked the groove presentin WT pollen (Figure
2.5B, C). To assess the viability of the abnormal pollen grains, anthers of stage 14 flowers were

66
Figure 2.4: Polar auxin transport and stem vascular arrangement
(A) Reduced polar auxin transport of 1 4C-IAA in excised inflorescence stem segments of
mtn1-1mtn2-1 mutants placed basipetally (inverted orientation) in 1 4C-IAA. Three
independent experiments were conducted using segments of 32 plants for each
genotype. Error bars indicate SE. Statistically significant values (P < 0.05) are
indicated in different letters .
(B-C) Free hand cross sections of mtn1-1mtn2-1 and WT taken at the basal end of the
primary inflorescence stem. Composite images of confocal laser scanning image and
pseudo DIC image. Psedo DIC image shows the increased number of vascular bundles
of the mtn1-1mtn2-1 (C) compared to WT (B). Confocal laser image shows the
lignified inter and intra fascicular fibers stained with berberine. Scale bars: B, C= 50
µm.
(D-G) Auxin maxima (*) visualized using DR5 rev::GFP mostly corresponded to number of
vascular bundles in cross-sections taken from the basal end of the primary
inflorescence stem (D, E) of WT (D, F)and mtn1-1mtn2-1 backgrounds (E, G). Higher
magnification images reveal auxin maxima primarily localized to the xylem (xy) tissue
of the vascular bundles (F, G). Note that the green fluorescence observed on lignified
xylem of the inter-fascicular and intra-fascicular (IF) was autoflorescence. Scale bars:
D, E = 50 µm: F, G = 150 µm.

67
stained with fluorescein diacetate, a stain that is taken up into viable cells. Almost all of the WT
pollen studied was able to take up the fluorescein diacetate (N = 45), whereas mtn1-1mtn2-1
had more unstained than stained pollen: 37% of MTN-deficient anthers had no viable pollen,
20% had less than five viable pollen grains, almost half (40%) had five to ten and only 3% had an
excess of ten viable pollen grains (N= 65).
Next, in vivo pollen tube formation was assessed; pistils were fixed 24 h after pollination and
visualized with aniline blue (Figure S2.2C to H). Reciprocal crosses performed between mtn1-
1mtn2-1 and WT pollen proved the mutant stigma to be receptive to pollen, with 90% of the
successfully pollinated pistils containing pollen tubes. Attempts to manually pollinate apt1-3 or
mtn1-1mtn2-1 with mtn1-1mtn2-1 pollen were not successful as no pollen tubes were observed
for either cross 24 h later. Collection of stage 14 mtn1-1mtn2-1 flowers and staining them with
aniline blue showed that 22% had self-pollinated and of those pollinated, 48% had pollen tubes.
Thus, mtn1-1mtn2-1 pollen is capable of forming pollen tubes in vivo but apparently need
longer than 24 h to extend.
Carpel and ovule development was also aberrant in stage 14 mtn1-1mtn2-1 flowers; carpels
had wide or duplicated stigmas, while ovules of the pistils had un-extended integuments when
compared to WT (Figure 2.5G, H). About 10% of mtn1-1mtn2-1flowers examined contained
one-three fully developed ovules that appeared to WT.

68
Figure 2.5: Reproductive abnormalities of mtn1-1mtn2-1
(A-F) Scanning electron micrographs of WT (A) and manually opened (D) anthers sacs
showed abnormal pollen development in the mutant. The mtn1-1mtn2-1 pollen grains
were irregularly shaped (F), and lacked the characteristic furrow (indicated by the
arrow) seen in the WT (B, C). At times the muta nt pollen appeared clumped with each
other (E) compared to WT (B). Scale bars = A, B = 45 µm; B, C E, F= 5 µm.
(G-H) Differential interference contrast (DIC) images of stage 14 flower pistils. WT had
mature ovules post-fertilization stage (G) while the mtn1-1mtn2-1 ovules (H)
corresponded to those normally observed in stage 12 WT flowers: outer integuments
were not fully extended over the nucellus. Scale bars = 25 µm.

69
2.4.3 The mtn1-1mtn2-1 phenotype complemented by MTN1 over-expression
In the Yang cycle MTA is converted to MTR-1P via two steps: first, MTA is hydrolysed by MTN to
form MTR and adenine, and the resulting MTR is subsequently metabolized by MTK. Unlike
mtn1-1mtn2-1 seedlings, MTK-deficient seedlings are not impaired in their growth and
development when provided with sulfur-sufficient conditions (Sauter et al., 2004) suggesting
MTN is the more crucial of the two enzyme activities. In order to verify that the complex
phenotype of mtn1-1mtn2-1 was solely due to MTN deficiency, the MTN1 gene was re-
introduced to the double mutant. The pleiotropic phenotype of mtn1-1mtn2-1 was fully
complemented by a 2.4 Kb genomic fragment that contained the full length coding sequence of
MTN1 along with 356bp of the upstream region (Figure 2.6A). These results were further
confirmed by the ectopic expression of MTN1cDNA under a polyubiquitin 10 (UBQ10)
constitutive promoter in the mtn1-1mtn2-1 background. We therefore concluded that the
pleiotropic phenotype of mtn1-1mtn2-1was the result of MTN-deficiency, and that replenishing
MTN1 alone was sufficient to compensate for the lack of MTN2.
2.4.4 The basis of mtn1-1mtn2-1 phenotype is accumulation of MTA, not loss of
MTR
Although the observed vascular and reproductive defects of mtn1-1mtn2-1 were restored by
MTN transgene expression, we reasoned that these abnormal traits could be due to either a
lack of MTA metabolism or a decreased MTR. Targeted profiling of Met metabolites in
inflorescences and rosette leaves, revealed statistically significant increases of MTA in mtn1-
1mtn2-1 (p< 0.05). MTA was elevated two-fold in rosette leaves (Figure 2.6B) and five-fold in
the mutant inflorescences, leading us to conclude that MTN deficiency leads to increased MTA
content. However, based on these data, it could not be excluded that the lack of MTR might
also contribute to the complex phenotype of the mutant. To test this, we
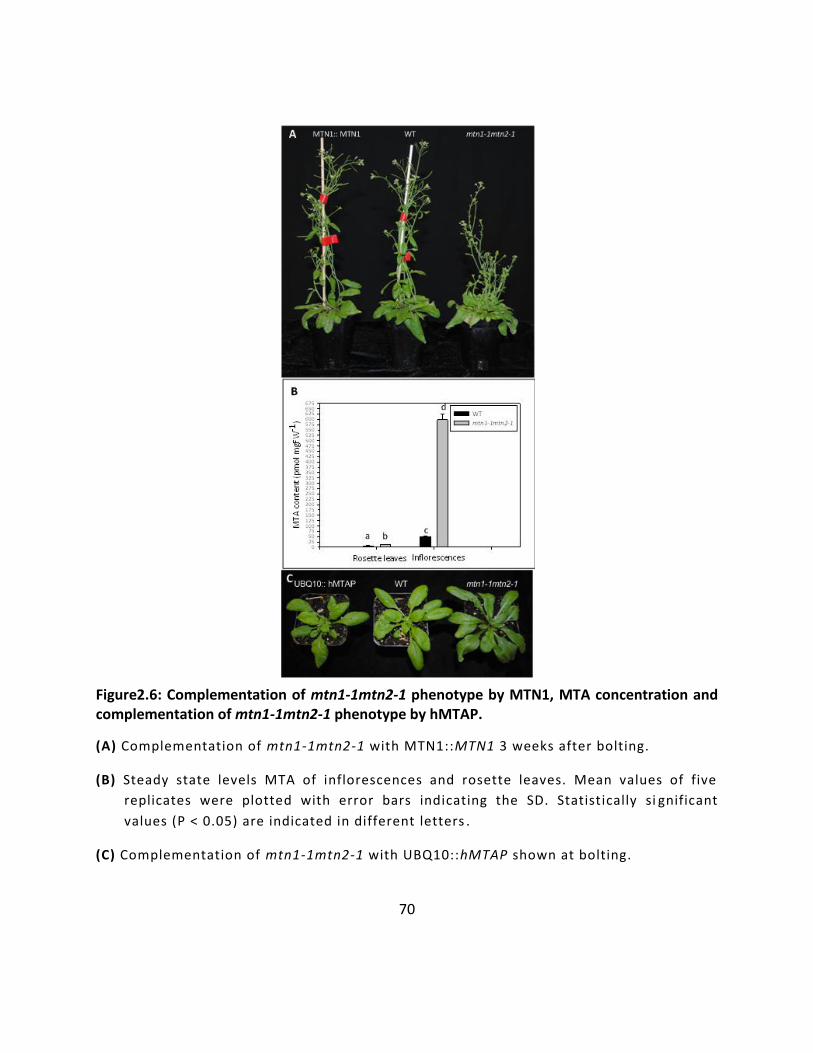
70
Figure2.6: Complementation of mtn1-1mtn2-1 phenotype by MTN1, MTA concentration and complementation of mtn1-1mtn2-1 phenotype by hMTAP.
(A) Complementation of mtn1-1mtn2-1 with MTN1::MTN1 3 weeks after bolting.
(B) Steady state levels MTA of inflorescences and rosette leaves. Mean values of five
replicates were plotted with error bars indicating the SD. Statistically si gnificant
values (P < 0.05) are indicated in different letters .
(C) Complementation of mtn1-1mtn2-1 with UBQ10::hMTAP shown at bolting.

71
introduced a cDNA encoding human MTAP activity (UBQ10::hMTAP) into the mutant. This
enzyme phosphorylates MTA directly into MTR-1P without producing MTR. The phenotype of
the double mutant was fully complemented by constitutive expression of hMTAP (Figure 2.6C).
2.4.5 Modeling of Spd synthase and Tspm synthase complexed with MTA
MTA is a potent inhibitor of both human Spm synthase (approximate Ki =0.3 μM) and Spd
synthase (Ki= 2-10 μM, Wu et al., 2007). Analysis of crystal structures containing bound ligands
of these enzymes with MTA explains the difference in affinity: the hydrophobic binding site of
Spm synthase is larger allowing it to have more extensive interactions with the adenine residue
of MTA than does Spd synthase. The conserved structural folds of the human and plant PA
enzymes allowed us to model MTA binding to these targets. 3-D models were developed for
Arabidopsis Spd synthase1and Tspm synthase and then their MTA complexes were visualized as
for human Spd synthase1 and Spm synthase (Wu et al., 2008). Analysis of these 3-D models
revealed that the MTA-binding pockets of Spd synthase1 and Tspm synthase are very similar
(Figure 2.7A,B): the CH3S moiety of MTA makes van der Waals contact with L90, L92 and V156
of Spd synthase1, or L76, I78 and V142 of Tspm synthase. The ribose ring of MTA is predicted to
establish hydrogen bonds with the side chains of Q76 and E151 of Spd synthase 1 or the side
chains of Q62 and E137 of Tspm synthase. N-6 of MTA adenine forms hydrogen bonds with the
side chain of D182 of Spd synthase1 or D168 of Tspm synthase. The adenine ring of MTA is
placed between I137 on one side and L187 and L199 on the other side in the Tspm synthase-
MTA complex. In Spd synthase1-MTA complex, the adenine ring of MTA is sandwiched between
I151 and L212. The residues I151 and L212 of Spd synthase1 and the residues I137 and L199 of
Tspm synthase are structurally conserved, while the L187 residue of Tspm synthase is
substituted by Serine (S202) in Spd synthase1 (Hanazawa et al., 2000). Therefore, the
hydrophobic surfaces involved in interaction with the adenine ring of MTA are predicted to be
very

72
Figure 2.7: Structural basis for inhibition of Spd synthase 1 and Tspm synthase enzymes by MTA
(A, B) Close-up views of the MTA-binding pocket for Spd synthase 1 and Tspm synthase,
respectively. MTA and the residues interacting wi th MTA in both structures are
shown in stick-and-ball representation, while carbon atoms for residues are in the
same color as the corresponding structure, whereas carbon atoms of MTA are in
gray.
(C, D) The hydrophobic surfaces interacting with the adeni ne ring in MTA. The two
surfaces stacking with the adenine ring are in magenta and yellow.

73
different. The hydrophobic surface (in yellow) made by I152 in Spd synthase1 is similar to the
corresponding one in Tspm synthase (I138) (Figure 2.7C, D). On the other side of the adenine
ring of MTA, the hydrophobic surface (in magenta) of Spd synthase1 made by L212 is shifted
and partially covers the adenine ring of MTA, whereas in the Tspm synthase, the hydrophobic
surfaces made by L187 and L199 are large and positioned to cover the adenine ring completely.
Although MTA binds to all three PA synthases, these modeling experiments predict that similar
to human Spm synthase, Tspm synthase may be more sensitive to inhibition by MTA than Spd
synthase1 due to extensive hydrophobic interactions between Tspm synthase and the adenine
moiety of MTA.
2.4.6 mtn1-1mtn2-1 plants exhibit altered PA profiles.
We next investigated whether increased MTA abundance in the mutant was associated with
changes in free PA content. To do this, we monitored both leaves and inflorescences for Put,
Spd, and Spm using HPLC analysis. Unfortunately Tspm abundance was so low that it was not
readily detected in WT samples (Naka et al., 2010) and as a result, could not be measured. For
those PAs that could be measured, differences were observed in both mtn1-1mtn2-1 leaves and
inflorescences: Put levels increased in mtn1-1mtn2-1 whereas Spd and Spm levels decreased
(Figure 2.8A, B). Of these, a statistically significant difference was only observed in the Put
content of inflorescences.
We reasoned that if these changes were physiologically relevant, reactions dependent on PAs
would be affected. Spd is a cofactor for the post-translational activation of the translation
initiation factor eIF5A. The butylamine moiety that is provided solely by Spd is transferred to
eIF5A in a two-step reaction causing it to become hypusinated on a specific lysine residue (Pegg
and Casero, 2011). Thus we tested the degree of hypusination of eIF5A in mtn1-1mtn2-1 leaf

74
Figure 2.8: PA profiles and two dimensional gels showing eukaryotic initiation factor 5A (eIF5A)
(A, B) Altered PA profiles of inflorescences (A) and rosette leaves (B) of mtn1-1mtn2-1
and WT (N = 4). Error bars represent SD. Stat istically significant values (P < 0.05) are
indicated in different letters.
(C, D) The hypusinated (H) and non-hypusinated (NH) eIF5A in rosette leaves of mtn1-
1mtn2-1 (D) compared to WT (C). Images are representations of three replicates. The
Rubisco large sub unit polypeptide dot was used as the reference for quantification (*).
N=3. Molecular mass standards (in KDa) are indicated to the left in C, D.

75
extracts by 2-D gel electrophoresis followed by immunoblotting with eIF5A-specific antibodies
as an indicator of intracellular Spd availability. The amount of hypusinated eIF5A was two-fold
lower in mtn1-1mtn2-1 indicating a clear reduction in hypusination of elF5Ain comparison to
WT leaf extracts (Figure 2.8C, D).
2.4.7 MTN-deficiency results in altered NA levels
Upon recognizing that the free PA profiles changed in response to increased MTA abundance,
we next analyzed NA levels of mtn1-1mtn2-1.We determined that NA was significantly reduced
in inflorescences and mature rosette leaves of mtn1-1mtn2-1 compared to WT (p < 0.05; Figure
2.9A). In WT plants, the highest NA content (268 ± 58 pmol mg FW-1) was detected in
inflorescences with leaves having 60% less NA (106 ± 50 pmol mg FW-1) whereas the NA
content of mtn1-1mtn2-1 inflorescences was 34% lower than WT and undetectable in rosette
leaves.
Since NA is known to play a key role in ion homeostasis and long distance transport, we
investigated whether the ion content (Cu, Fe, Zn, and Mn) of mtn1-1mtn2-1 was different from
WT, using inductively coupled plasma atomic emission spectroscopy (Gadapati and Macfie,
2006). In the mutant inflorescences, contents of Cu, Fe and Zn were significantly lower, with Fe
and Zn showing the greatest reduction compared to WT (p< 0.05; Figure 2.9B). The ion profiles
of mutant and WT rosette leaves were similar with reduced Zn and Cu abundance, except the
Mn content in the mutant was significantly higher than in the WT (p< 0.05; Figure 2.9C).
Interestingly, mtn1-1mtn2-1 had significantly decreased Fe levels in the inflorescences
compared to WT while these levels were not significantly different in rosette leaves (p< 0.05).
Confirming these results, interveinal chlorosis was absent in the reproductive leaves of mature
mtn1-1mtn2-1 mutants.

76
Figure 2.9: Nicotianamine content and metal profiles of leaves and buds.
Nicotianamine could not be detected in the rosette leaves (A; N = 5) compared to WT and
was lower in mtn1-1mtn2-1 inflorescences (N = 3). In addition to Nicotianamine, Fe, Mn,
Zn and Cu levels were also reduced in mtn1-1mtn2-1 inflorescences (B) and leaves (C; N =
5) compared to WT. Each n is a pool of three biological replicates. Error bars indicate the
standard error of the mean; FW, fresh weight; DW, dry weight. Statistically significant
values (P< 0.05) are indicated in different letters while insignificant values indicated in
same letters.

77
2.4.8 Exogenous feeding of PA and NA partially restored fertility of
mtn1-1mtn2-1
2.4.8.1 Chemical rescue of fertility
Since both free PA and NA levels were affected in the mtn1-1mtn2-1 mutant, we postulated
that MTA -producing reactions were being product inhibited. We then hypothesized that the
exogenous application of target compounds would reverse abnormal phenotypes. To test this,
we chemically complementedmtn1-1mtn2-1 mutants with exogenous application of Spd, Spm,
Tspm or NA (NA was extracted from NA over-producing transgenic Arabidopsis plants).
To treat MTN-deficient plants, F2 seeds of MTN1-1/mtn1-1mtn2-1/mtn2-1 plants were grown
on media supplemented with Spm, Spd, Tspm or NA. After 2-3 weeks on media, seedlings were
transplanted to soil and genotyped via PCR. With the exception of Tspm, drops of the
corresponding compound were then applied daily to shoot apices of mtn1-1mtn2-1 plants until
the plants were eight-weeks-old. Examination of the treated plants showed that mtn1-1mtn2-1
fertility was partially recovered using any of three compounds (Spm, Spd or NA): partial
recovery of fertility was indicated by the presence of extended siliques (Figure 2.10A) with
fertile seed (Figure 2.10B to E) on individual branches. Surprisingly partial fertility was also
recovered in a similar manner when the seeds were germinated on the indicated compounds
for 14 or more days and transferred to soil without being provided with further supplement
(Figure 2.10F).
Generally, siliques with unfertilized ovules fail to extend beyond 3.5mm, while siliques
containing 60 seeds reach a maximal length of 15 mm (Meinke, 1994). Thus the fertility of the
plants without further supplement was scored by categorizing the siliques length in to three
groups: (1) 5-7 mm, (2) 8-10 mm and (3) more than 10 mm (Figure 2.10A). Most of the

78
Figure 2.10: Exogenous NA and PA restored the fertility phenotype of mtn1-1mtn2-1
(A-E) Silique and seed morphology of restored plants. The restored seeds of mtn1-1mtn2-
1 were categorized in groups based on their lengths; most of the seeds of > 10 mm
siliques has normal WT-looking seeds (B) while the former two categories had seeds with
abnormal color and shape (C). Closer observation of these abnormal seeds showed (D)
that they had developed seed coats similar to WT (E). Scale bar s: A = 1.5 mm, B, C= 300
µm, D, E 100 µm.
(F) Number of siliques that developed when mtn1-1mtn2-1 was grown in ½ MS media
supplemented with 20 µM NA, 100 µM spermine (Spm), spermidine (Spd) or 50 µM
thermospermine (Tspm). The restored siliques were of var ious lengths they were
categorized into three groups based on their lengths (N = > 20 siliques per treatment).
Statistically significant values (P< 0.05) are indicated in different letters.
(G) Number of seeds/ silique and percent seed germinated from mtn1-1mtn2-1 plants
grown on ½ MS supplemented with 100 µM Spd. Seed counts were average of 60 siliques
from 6 plants for 5–7 mm and 8-10 mm categories while 36 siliques from 6 plants for >
10mm category. Percent germination was assessed only on seeds collec ted for latter 2
categories (N = 6 siliques). Bars represent the standard deviation (SD). Statistically
significant values (P< 0.05) are indicated in different letters while insignificant values
indicated in same letters.
79
siliques produced were in the first two categories while only Spd and Tspm gave rise to siliques
that were >10 mm long. Of the four treatments, the most effective was 100 μM Spd (78 ± 5
siliques / plant) and the least effective was100 μM Spm (Figure 2.10F). Both NA and Tspm
treatments produced 25-35 siliques/ plant.
The number of seeds and or silique in each group of the Spd experiment was further
determined: 5-7cm group had 1 ± 0.4 seeds per silique, while the 8-10 mm and >10 mm group
had 6 ± 1, and 14 ± 4 seeds per silique, respectively. Some seeds in the 5-7 mm and 8-10 mm
category showed abnormal shape and color (Figure 2.10B) when compared to WT (Figure
2.10C). To determine the viability of these abnormal seeds approximately 100 seeds from 6
siliques were germinated on media and scored: 8-10 mm and >10 mm siliques had 33 ± 10 %
and 66 ± 20% germination, respectively (Figure 2.10G).
2.4.8.2 Chemical rescue of interveinal chlorosis by NA
In addition to testing for recovered fertility, rescue of interveinal chlorosis with the application
of exogenous PAs (Put, Spd, Spm or Tspm)or NA was also investigated. Of the compounds
tested, onlymedia supplemented with NA completely eliminated the interveinal chlorosis
normally observed at 10DAG in mtn1-1mtn2-1 seedlings. Similarly, mutant seedlings that
already exhibited interveinal chlorosis on ½ MS developed green leaves two days after
transplanting to ½ MS supplemented with NA. Moreover, hydroponically grown mtn1-1mtn2-1
supplemented with 20μM NA lacked interveinal chlorosis (N= 8, Figure S2.3).

80
2.5 Discussion
Our detailed characterization of the mtn1-1mtn2-mutant has established a correlation between
MTN deficiency, abnormal vasculature and low reproductive efficiency. The first distinct
phenotype of mtn1-1mtn2-1 coincides with the development of true leaves. As recently
reported, the Yang cycle (i.e. MTA recycling) in Arabidopsis and Plantago major mainly occurs in
leaf veins (Pommerrenig et al., 2011). Thus, it is likely that the flux of MTA synthesis first
increases substantially in leaves as vein development proceeds.
Molecular characterization of the mtn1-1mtn2-1 mutant showed a reduction in MTN transcript
levels consistent with the presence of a T-DNA insertion within the transcribed region of each
gene. Protein abundance and enzyme activity reflected transcript levels, with the mtn1-1mtn2-
1 mutant having ~14 % residual MTN activity, indicating its substantially reduced capacity for
MTA hydrolysis. The MTN assay results were consistent with mtn1-1 and mtn1-2 single mutant
seedlings grown on sulfur-deficient medium supplemented with MTA. These seedlings have less
than 20% of the MTN activity of WT, and displayed severe growth retardation. Interestingly,
they also had increased MTN activity when grown in the presence of MTA. Since MTN transcript
levels did not change under these conditions, the activation of MTN must occur at the protein
level (Bürstenbinder et al., 2010). While the molecular basis of this activation remains
unknown, we assume that the increased MTA content in the double mutant activates the
residual MTN enzyme, leading to cellular variations in enzyme activity.
2.5.1 MTA accumulation is the basis for mtn1-1mtn2-1 phenotype
While our data pointed to the lack of MTA hydrolysis as being the cause of the abnormalities in
mtn1-1mtn2-1 plants the contribution of reduced MTR content could not be excluded. The
latter consideration arose from comparing the completely normal phenotype of MTR kinase
mutants (Sauter et al., 2004) with the complex phenotype of MTN-deficient plants. Both
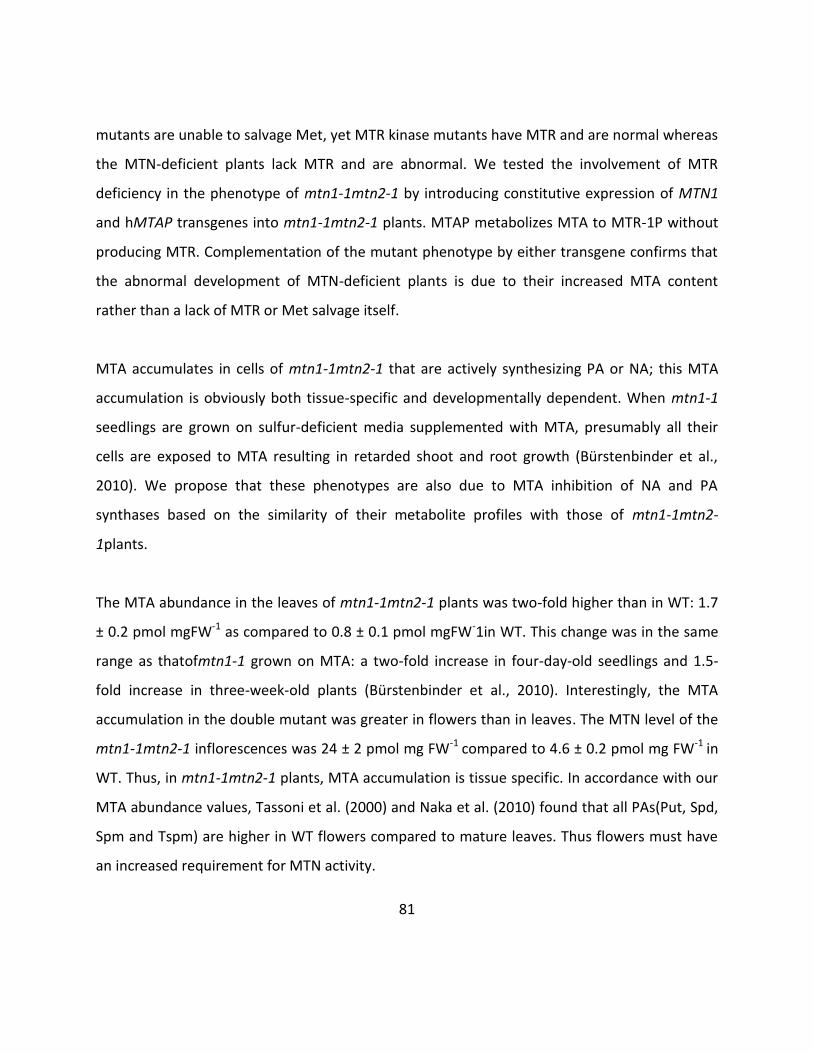
81
mutants are unable to salvage Met, yet MTR kinase mutants have MTR and are normal whereas
the MTN-deficient plants lack MTR and are abnormal. We tested the involvement of MTR
deficiency in the phenotype of mtn1-1mtn2-1 by introducing constitutive expression of MTN1
and hMTAP transgenes into mtn1-1mtn2-1 plants. MTAP metabolizes MTA to MTR-1P without
producing MTR. Complementation of the mutant phenotype by either transgene confirms that
the abnormal development of MTN-deficient plants is due to their increased MTA content
rather than a lack of MTR or Met salvage itself.
MTA accumulates in cells of mtn1-1mtn2-1 that are actively synthesizing PA or NA; this MTA
accumulation is obviously both tissue-specific and developmentally dependent. When mtn1-1
seedlings are grown on sulfur-deficient media supplemented with MTA, presumably all their
cells are exposed to MTA resulting in retarded shoot and root growth (Bürstenbinder et al.,
2010). We propose that these phenotypes are also due to MTA inhibition of NA and PA
synthases based on the similarity of their metabolite profiles with those of mtn1-1mtn2-
1plants.
The MTA abundance in the leaves of mtn1-1mtn2-1 plants was two-fold higher than in WT: 1.7
± 0.2 pmol mgFW-1 as compared to 0.8 ± 0.1 pmol mgFW-1in WT. This change was in the same
range as thatofmtn1-1 grown on MTA: a two-fold increase in four-day-old seedlings and 1.5-
fold increase in three-week-old plants (Bürstenbinder et al., 2010). Interestingly, the MTA
accumulation in the double mutant was greater in flowers than in leaves. The MTN level of the
mtn1-1mtn2-1 inflorescences was 24 ± 2 pmol mg FW-1 compared to 4.6 ± 0.2 pmol mg FW-1 in
WT. Thus, in mtn1-1mtn2-1 plants, MTA accumulation is tissue specific. In accordance with our
MTA abundance values, Tassoni et al. (2000) and Naka et al. (2010) found that all PAs(Put, Spd,
Spm and Tspm) are higher in WT flowers compared to mature leaves. Thus flowers must have
an increased requirement for MTN activity.

82
2.5.2 MTA binds NA synthase, SPD synthase, SPM synthase and TSPM synthase
MTA is known to inhibit PA synthetic enzyme activities, while increasing SAMDC activity (Albers,
2009). For example, mammalian Spm synthase and Spd synthase activities are MTA sensitive
(Pegg, 1981; Wu et al., 2008). Insilico modelling leads us to propose that MTA inhibits
Arabidopsis Spd synthase and Tspm synthase with the latter being the most sensitive. This
inhibition is likely quite dynamic since the stimulation of SAMDC by MTA theoretically increases
flux to PA synthesis and further enhances MTA production.
Barley NA synthase is product inhibited by MTA (Ki = 5 µM; Herbiket al, 1997).We suspect that
the Arabidopsis enzyme is similarly affected given its amino acid sequence identity (46%) and
similar domains (Herbik et al., 1999). Moreover, the mutant plants have chlorotic leaves that
are reversed by NA supplementation. Thus, MTA inhibits PA and NA synthases in a spatially and
temporally dependent manner reflecting the flux through the Yang cycle and the cellular
abundance of the target enzyme activities.
2.5.3 Molecular basis of the altered vascular development of mtn1-1mtn2-1
The increased venation of mtn1-1mtn2-1 rosette leaves likely contributes to the variation in
their free PA content as PA biosynthesis predominantly occurs in leaf vasculature (Pommerrenig
et al., 2011).Increased vein thickness of the MTN mutant rosette leaves is similar to that
reported for tkv (Clay and Nelson 2005). Since our modeling predicted that Tspm synthase
activity is inhibited by MTA, and Tspm is required for normal xylem differentiation (Muñiz et al.,
2008), it was of interest to examine Tspm content. Unfortunately, Tspm quantification is a
challenge due to its low abundance; Tspm was not detected in our system. Despite this
observation, our results lead us to believe that mtn1-1mtn2-1 plants have reduced Tspm.
Aside from Tspm effects, PA catabolism may also contribute to the changes in vascular
development in mtn1-1mtn2-1.The altered PA content of the mutant(e.g. increased Put) may

83
lead to increased PA oxidase activity and H2O2, a documented signal for increased vascular
tissue differentiation (Tisi et al., 2011). However, we did not detect increased H2O2 in 14d-old
mtn1-1mtn2-1 seedlings using a histochemical stain (Figure S4). Similarly, semi-quantitative RT-
PCR of mature leaves of mtn1-1mtn2-1 did not show significant changes in the transcript levels
of three representative PA oxidases (PAO1, PAO2, PAO5) compared to WT (Figure S4).
However, further analysis is necessary to determine if PAO activities change in the mature
mutant plants, or as a result of Spd treatments.
The vascular abnormalities of mtn1-1mtn2-1 appear to be a direct effect of changes in PAT. We
base this conclusion on the similarities between the mtn1-1mtn2-1 vasculature and the effects
of reducing PAT by naphthylphthalamic acid treatment (Mattsson et al., 1999); both sets of
plants have thick veins in their rosette leaves, and an increased number of vascular bundles in
stem sections. Ibañes et al. (2009) created a computational model for vascular bundle
development based on DR5::GUS expression of naphthylphthalamic acid-treated plants and
anatomical analysis of brassinosteroid (BR) signalling mutants. Their model predicts PAT-related
auxin maxima determine the spacing between vascular bundles while BR controls bundle
number. If this is the case, then our results suggest that BR signalling changes may also
contribute to the vascular phenotype of mtn1-1mtn2-1.
The question arises then, why do acl5 and tkv that also have reduced PAT (Clay and Nelson,
2005; Vera-Sirera et al., 2010) lack the increase in vascular bundles characteristic of mtn1-
1mtn2-1 plants? We propose that the differing phenotypes of these Tspm-deficient plants
reflect the degree to which PAT is inhibited. mtn1-1mtn2-1 plants have less residual auxin
transport as compared with tkv (46% versus 64%, respectively). Their more severe reduction in
PAT may lead to an increase in their BR content or sensitivity causing them to have an increased
number of bundles. The modest PAT changes in tkv (and acl5) may not be sufficient to trigger

84
the crosstalk with BR. This reasoning is consistent with the proposal that the PAT changes in
acl5 are secondary to their vascular defects (Vera-Sirera et al., 2010). Direct investigation of BR
content and signaling in Tspm-deficient mutants is needed to clarify its involvement in these
phenotypes.
2.5.4 NA deficiency of mtn1-1mtn2-1 causes altered ion homeostasis leading to
interveinal chlorosis and reproductive abnormalities
In addition to free PAs, NA levels were significantly affected in mtn1-1mtn2-1 tissues: NA was
undetectable in double mutant rosette leaves, while inflorescences exhibited a 3.7-fold
reduction relative to WT. This NA deficiency is similar to that of the chloronerva tomato mutant
(Bohme and Scholz, 1960), quadruple NA synthase Arabidopsis mutants (nas4x-2 and nas4x-1;
Klatte et al., 2009), and transgenic naat tobacco lines over-expressing NA aminotransferase
(Takahashi et al., 2003). All these plants have interveinal chlorosis and reduced fertility along
with reduced NA content. In all cases, this deficiency is associated with altered profiles of Fe,
Zn, Mn and Cu. Similar to the previously published reports describing mutants with decreased
NA, mtn1-1mtn2-1 plants had lower levels of all these ions in both inflorescences and rosette
leaves, with the exception of Mn which increased in leaves.
2.5.5 Restoration of seed set in mtn1-1mtn2-1
The reduced presence of double mutants in the segregating progeny of MTN1/mtn1-1mtn2-
1mtn2-1 plants is also indicative of a reproduction problem. The double mutant was commonly
recovered from these segregating populations at a frequency of 1/7thto 1/10th, in contrast to
the expected 1/4. Whereas Spm synthase mutants are normal, spds1-1spds2-1 double mutants
that lack Spd (but have increased Put content) arrest as embryos (Imai et al., 2004). mtn1-
1mtn2-1 mutants have a similar change in their PA profile suggesting that the distortion in the
segregation ratio of mtn1-1mtn2-1may be due to altered PA homeostasis during

85
embryogenesis. The suggestion that conjugated forms of Spd serve as PA reserves in seeds to
release Spd in developing tissues (Luo et al., 2009) supports this conclusion. If so, a decrease in
the amount of Spd conjugate from maternal tissues may underlie the reduced recovery of
homozygous double mutants and account for the variation in the segregation ratios of different
F2 seed populations. Alternatively changes in polyamine metabolism may affect fertilization
since mutants with reduced PAO3 activity have abnormal pollen tube growth (Wu et al., 2010).
mtn1-1mtn2-1 mutants experience both male and female gamete abnormalities together with
mis-timing of reproductive developmental events leading to poor fertilization.
Exogenous supply of 20 µM NA, 100 µM Spd, 100 µM Spm or 50 µM Tspm improved the fertility
of mtn1-1mtn2-1 to a limited extent. When each of these chemicals was supplied exogenously,
the plant need not attempt to generate these chemicals via biosynthesis. As a result the
amount of MTA generated invivo by these biosynthetic pathways is presumably reduced and
thus alleviates the product inhibition of PA or NA synthases to improve fertility. Among the
compounds tested, 100 µM Spd was the most effective; Spm was the least and Tspm and NA
had intermediate effects. Application of 100 µM Put, 10 or 100 µM of IAA, or 5 µM of ACC did
not produce observable differences. The simplest explanation of Spd recovery is that
exogenous Spd provides an increased precursor pool for Tspm synthesis. The Tspm may induce
more normal xylem differentiation and restore sufficient transport of compounds essential for
seed development including phytohormones and metal cofactors. Interestingly, a recent report
by Tisi et al. (2011) shows that increased xylem differentiation and secondary wall deposition is
induced in maize roots by exogenous Spd feeding. This is apparently induced by H2O2 arising
from PA catabolism. Similar H2O2 signaling may contribute to the Spd effect on mtn1-1mtn2-1
plants reported here. It is also possible that the Spd acts by another route aside from simply
being the precursor for Tspm or affecting PA catabolism, such as via eIF5A modification. A
recent study based on pumpkin has shown that the eIF5A modification occurs in companion

86
cells (Ma et al., 2010) of phloem tissues where both MTN enzymes occur predominantly
(Pommerrenig et al., 2011). A comprehensive developmental and metabolite analysis of Spd-
treated mtn1-1mtn2-1 plants will be required to elucidate the molecular mechanism underlying
the effects of both MTN deficiency and Spd feeding. A deeper understanding of this process will
provide important insight of the long recognized link between PA and plant development.
2.6 Conclusion
Although MTN-deficient plants have a complex phenotype, each abnormal trait can be traced
back to an effect of MTA accumulation. Given the different enzyme activities inhibited by MTA
and their wide ranging contributions to plant metabolism, increases in MTA content have a
broad impact on both a cellular and developmental scale.
2.7 Data contributed by others.
The work presented in this chapter was a team effort of many personnel. Ishari Waduwara-
Jayabahu (IW-J) navigated the project, designed and conducted most of the experiments. Sarah
Schoor, a former student of Moffatt lab, who first started on this project analysed most of the
reproductive defects of this mutant including the data presented in Table 1.1, Figure 2.5. and
Figure S2.2C-H. Zachary T. Hull, an undergraduate student of Moffatt lab, took the lead in MTN
assays (Figure 2.2C) with the assistance of IW-J. IW-J sent the tissues harvested from plants
grown at University of Waterloo to Yasmin Oppermann, Universität Kiel, Germany who
determined the PA content presented in Figures 2.8A, B. Yasmin also conducted initial MTN
assays on different tissues (Figure S2.1). Tissues were also send to Dr. Markus Wirtz, University
of Heidelberg, Germany who determine the NA content (Figure 2.6B) and Met-related
metabolites (Figure 2.9A). MTA inhibition for Tspm synthase and Spd synthase 1 was modeled
by Dr. Alexander N. Plotnikov, Mount Sinai School of Medicine, USA who is responsible for the
Figure 2.7.

87
2.8 Supplemental material
Young leaves
MT
N a
ctivity (
nm
ol m
g-1
pro
t m
in -1
)
0.0
0.2
0.4
0.6
0.8
1.0
1.2
Old leaves
Openflowers
Flowerbuds
Young siliques
Old siliques
Stems
Figure S2.1: MAN activity of various organs harvested from 6-week-old WT plant.
(Data source: Yasmin Oppermann)

88
Figure S2.2: Leaf vein pattern and pollen tube growth of mtn1-1mtn2-1 compared to WT.
(A, B) Cleared 6 th rosette leaf of mtn1-1mtn2-1 mutant and WT. (B) The mtn1-1mtn2-1
shows increased vascularisation of the leaf compared to (A) WT.
(C-H) Aniline blue stained images of (C-E) stigma and (F-H) ovaries of (C, E, F, H) mtn1-
1mtn2-1 and (D, G) WT. o = ovule, pt = pollen tube. WT pollen tube growth on
stigma and style of mtn1-1mtn2-1 (C, F), WT pollen tube growth on WT stigma and
style (D, G) and mtn1-1mtn2-1 pollen tube growth on mtn1-1mtn2-1 style and
stigma (E, H) are shown. (Source: C-H, Sarah Schoor)

89
Figure S2.3: Interveinal chlorosis by Nicotianamine (NA)
(A, B) Seedlings of MTN1/mtn1-1.mtn2-1/mtn2-1 segregating seeds placed on ½ MS a nd ½
MS supplemented with 20 µM NA. The (A) mtn1-1mtn2-1 seedlings on ½ MS could be
readily identified based on interveinal chlorosis whereas this phenotype was not
observed, if these seedlings were (B)supplemented with NA.
(C, D) WT and mutant seedlings identified from (A) were transplanted to fresh ½ MS
medium.
(E, F) WT and mutant seedlings identified from (A) were transplanted to fresh ½ MS
medium supplemented with NA. The NA eliminated interveinal chlorosis in the
mutant.

90
Figure S2.4: Relative transcript abundance of polyamine oxidises and H2O2 production.
(A) RT-PCR of PAO1, PAO2 and PAO5 conducted on the leaves of WT and mtn1-1mtn2-1
harvested two weeks after bolting. Among the five Arabisopsis PAO genes three
representative genes were selected. PAO2-4 is distinct from PAO1 and PAO5 based
on amino acid sequence identity (Fincato et al., 2011). The PAO1 is particularly
interested as it is suggested to use Tspm as a substrate in vivo . The PAO2 that is
expressed primarily in leaf veins (Takahas hi et al., 2010) was selected to represent
PAO2-4 subfamily. PAO5 was used as it is expressed in all tissues (Takahashi et al.,
2010).
(B-E) Detection of H2O2 produced by (B, D) WT and developmentally similar (C, E) 14 -day-
old mtn1-1mtn2-1 seedlings using DAB staining. Scale bars, 4mm. No differences
were visible between WT and mtn1-1mtn2-1 staining intensities in the leaves of the
seedlings grown on (B, C)½ MS. Seedlings that were grown (E,F) ½ MS supplemented
with 3-amino-1,2,4-triazole (AT), catalase inhibitor that induce oxidative stress,
served as controls and stained both WT and mtn1-1mtn2-1 leaves.

91
Table S2.1: Primer sequences
Primer name Description Primer Sequence
mtn1-1F Forward primer for mtn1-
1(At4g38800); SALK_085385
TGACGGAGACCAACTCCATAC
mtn1-1R Reverse primer for mtn1-1
(At4g38800); SALK_085385
GAGGCTCTTCCTTTGGTCAAC
mtn2-1F Forward primer for mtn2-1
(SALK_071127)
CCTTGCTTACGTGGCATAAAC
mtn2-1R Reverse primer for mtn2-1
(SALK_071127)
GGAAAGGGCAAAAATATATGG
LBb1.3 Left-border for SALK lines ATTTTGCCGATTTCGGAAC
UBQ10 p F Forward primer for UBQ 10
promoter with 3’ Age I
TAACCGGTAACGATCGTTAAATCTCAAC
UBQ10p blunt R Reverse primer for UBQ10
promoter with 5’-blunt end
CTGTTAATCAGAAAAACTCAGAT
AtMTN1-F3 Forward primer to MTN1
RTPCR
GAATCGGAAGAGAGGGATAAG
AtMTN1-R3 Reverse primer to MTN1 RTPCR ATAAAAAAGGAAGAGAACAGAAG
AtMTN2-F1 Forward primer to MTN2
RTPCR CAACAGATTACGCCTCGTTG
AtMTN2-R1 Reverse primer to MTN2 RTPCR ACAGGTATTCTTCTGTCATGG
Actin 2F Forward Primer for Actin
(At5G09810) CCG ATG GTG AGG ATA TTC AGC C
Actin 2R Reverse Primer for Actin
(At5G09810) TGT CAC GGA CAA TTT CCC GTT CTG C
gMTN1-F Forward Primer for genomic
MTN1
AACCCGGGATGGCTCCTCATGGAGATGG
gMTN1-R Reverse Primer for genomic
ATGGATCCGTTTAAAGGTCCGAAAGGTTTCT

92
MTN1
MTN1CDS-F Forward Primer for MTN1
coding sequence
AACCCGGGATGGCTCCTCATGGAGATGG
MTN1CDS-R Reverse Primer for MTN1
coding sequene
ATGGATCCGTTTAAAGGTCCGAAAGGTTTCT
hMTAP-F hMTAP CDS cloning ATG blunt
5' end
ATGGCCTCTGGCACCAC
hMTAP-R hMTAP CDS cloning TAA blunt
3' end
TTAATGTCTTGGTAATAAAACAG
PAO1 RT-F Forward Primer For PAO1 TTATTGGCCTTCACCGAGTC
PAO1 RT-R Reverse Primer For PAO1 GGAGACGCGTTAGCTATTTCA
PAO2 RT-F Forward Primer For PAO2
CAGCTTGCCAAAGACATTGA PAO2 RT-R
Reverse Primer For PAO2 AAACGATCCGACACGAGAAT
PAO5 RT-F Forward Primer For PAO5
GGGAGGATTCCGAGTTTAGG PAO5 RT-R
Reverse Primer For PAO5 TTCTCTAAACACATTACCCCAAAA

93
Chapter 3: Dissecting the complex phenotypes associated with 5’-
methylthioadenosine nucleosidase deficiency
3.1 Overview
5’-methylthioadenosine is a by-product of polyamine, nicotianamine, and ethylene
biosynthesis, which is recycled into Met by 5’-methylthioadenosine nucleosidase (MTN). In
Arabidopsis, MTN is encoded by two genes: AtMTN1 and AtMTN2. Mutants that have
disruptions in both of these genes have pleiotropic developmental defects, including abnormal
vasculature and reproductive problems. The goal of this research was to define the
fundamental abnormal trait associated with reduced MTN activity. To this end, a series of
MTN-deficient lines with differing residual MTN activity were developed using two approaches:
crossing different MTN knock-down single alleles and creating transgenic lines that express an
artificial microRNA (ami) against MTN2 in an mtn1-1 background. The single T-DNA insertion
mtn mutants used for the crosses were mtn1-1 (SALK_085385), mtn1-2 (GK_568C06.18), mtn1-
4 (SALK_088214C), mtn2-1 (SALK_ 071127), mtn2-2 (GK_845B05), and mtn2-5 (SALK_022510).
The following lines were generated (1) mtn1-4mtn2-1, (2) mtn1-1mtn2-1, (3) mtn1-1mtn2-5, (4)
ami5.3, and (5) ami2.8. The complete loss-of-function MTN mutant, mtn1-2mtn2-1, was
embryo lethal. Based on an analysis of the anatomy and development of these lines, three with
distinct phenotypes were selected for detailed study: mtn1-1mtn2-5, mtn1-1mtn2-1, and
ami5.3. They were further assessed and compared to the WT with respect to their MTN activity
and Met-related metabolite content. Their residual MTN activity correlated with the severity of
their phenotype. The mtn1-1mtn2-1 has only 14 % of the MTN activity and have a complex
pleiotropic phenotype, while mtn1-1mtn2-5 with 28 % of the MTN activity of the WT, has a
delayed transition to flowering (bolting) along with the xylem proliferation defects associated
with mtn1-1mtn2-1. The ami5.3 line, with 16 % MTN activity, is phenotypically similar to
mtn1-1mtn2-1 and shares delayed bolting, xylem proliferation defects, and delayed

94
senescence. Based on these analyses we conclude that the delayed bolting is the fundamental
trait associated MTN deficiency.
3.2 Introduction
5’-methylthioadenosine nucleosidase (MTN, EC 3.2.2.16) activity is essential for the hydrolysis
of methylthioadenosine (MTA), which is generated in plants by means of three essential
biochemical pathways: polyamine (PA), nicotianamine (NA), and ethylene biosynthesis (Figure
3.1). Phenotypic analysis of mutants with disruptions in the genes that encode the enzymes
involved in these three pathways has revealed the critical roles of PA [putrescine (Put),
spermidine (Spd), spermine (Spm), and thermospermine (Tspm)], NA, and ethylene in plant
growth and development.
Analysis of Arabidopsis PA biosynthesis mutants has shown that Put and Spd are essential for
plant survival and growth because knocking down many of the PA biosynthesis pathway
components leads to embryo lethality. In this pathway, arginine decarboxylase (ADC; EC
4.1.1.19) converts arginine to Put and subsequently to Spd by means of Spd synthase (SPDS; EC
2.5.1.16; Figure 3.1). Spd is catalyzed to either Spm or Tspm via Spm synthase (SPMS; EC
2.5.1.22) and Tspm synthase (ACL5; EC 2.5.1.79), respectively. S-adenosyl-L-methionine (SAM)
decarboxylase (SAMDC; EC 4.1.1.50) provides the aminopropyl group necessary for the
conversion of Put to Spd, of Spd to Spm, and of Spd to Tspm. Double mutants of ADC
(adc1adc2; Urano et al., 2005), Spd synthases (spds1spds2; Imai et al., 2004b), and SAM-
decarboxylase (samdc1samdc4; Ge et al., 2006) show lethality at the embryo stage. The
involvement of Tspm in vascular development has been revealed through the study of
ACAULIS5 (acl5) mutants (Hanazawa et al., 1997; Vera-Sirera et al., 2010). ACL5 encodes Tspm
synthase, which is expressed in vascular tissues (Clay and Nelson, 2005), specifically in the
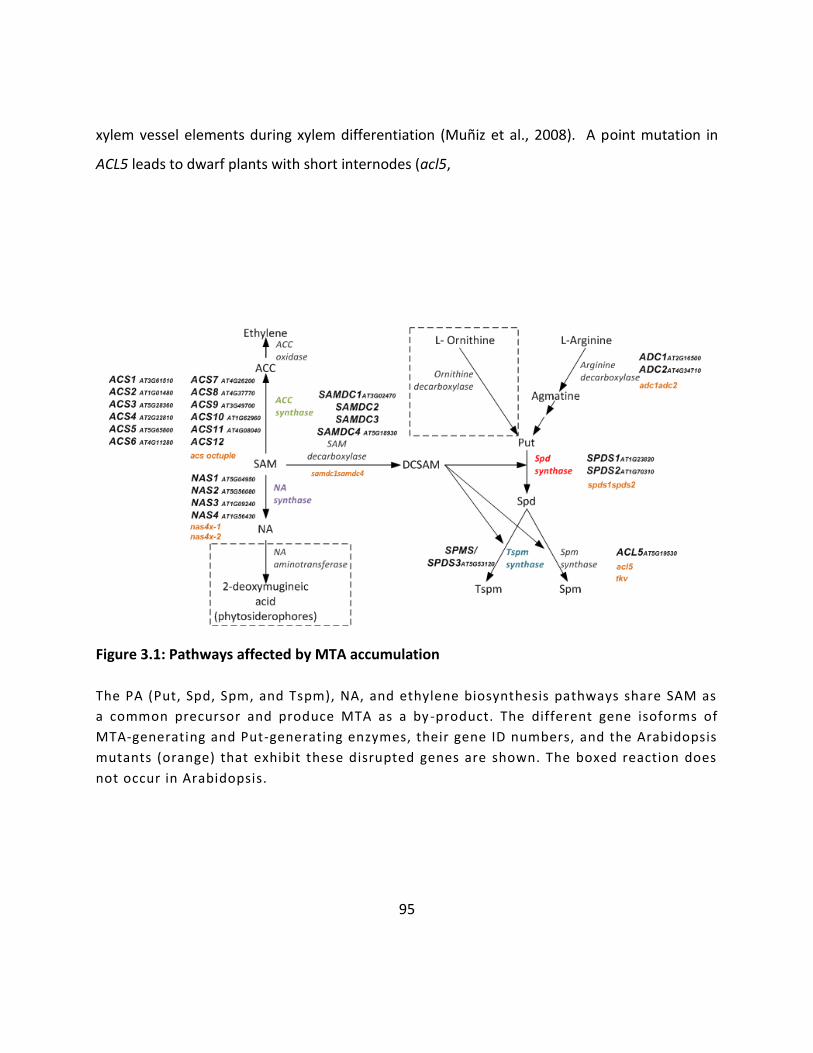
95
xylem vessel elements during xylem differentiation (Muñiz et al., 2008). A point mutation in
ACL5 leads to dwarf plants with short internodes (acl5,
Figure 3.1: Pathways affected by MTA accumulation
The PA (Put, Spd, Spm, and Tspm), NA, and ethylene biosynthesis pathways share SAM as
a common precursor and produce MTA as a by -product. The different gene isoforms of
MTA-generating and Put-generating enzymes, their gene ID numbers, and the Arabidopsis
mutants (orange) that exhibit these disrupted genes are shown. The boxed reaction does
not occur in Arabidopsis.

96
Hanazawa et al., 1997) along with altered secondary vascular development that completely
lacks pitted xylem vessel elements and xylem fibres (Muñiz et al., 2008). Based on these
observations, it has been proposed that Tspm prevents the premature death of the developing
xylem vessels (Muñiz et al., 2008). It has also been shown that Tspm translationally activates
SAC51, which encodes a basic-helix-loop-helix (bHLH-type) transcription factor (Imai et al.,
2006) generally involved in the regulatory transcriptional programs (Toledo-Ortiz et al., 2003).
Thick-vein (tkv), another mutant of ACL5, has small leaves with thicker leaf mid veins due to an
increased number of xylem (xy), phloem (ph), and cambial cells. The bud2 mutant, which has a
mutation in SAM decarboxylase 4 also displays enlarged vascular systems in inflorescences,
roots, and petioles (Ge et al., 2006). On the other hand, the spms mutant, which is defective in
its synthesis of Spm, shows WT morphology under normal growth conditions (Imai et al.,
2004a). Taken as a whole, the evidence indicates that Put and Spd are essential for
embryogenesis and that Tspm is essential for proper vascular development.
Plant lines deficient in NA content have been created either by mutagenizing NA synthase (NAS;
EC 2.5.1.43) genes or by introducing a transgene that metabolizes endogenous NA. Takahashi
and his colleagues (2003) created a tobacco line that constitutively expresses a barley gene for
encoding nicotianamine aminotransferase (NAAT; EC 2.6.1.80), which converts endogenous NA
into a non-functional product, resulting in undetectable NA content. The NA-deficient
chloronerva tomato mutant has a point mutation in its single NA synthase gene (Bohme and
Scholz, 1960) whereas the nas4x-2 mutant of Arabidopsis has mutations in all four NA synthase
isoforms (Klatte et al., 2009). All of these lines have the altered metal profiles that are
associated with interveinal chlorosis and reproductive abnormalities.
Tsuchisaka et al. (2009) describe a series of ethylene-deficient Arabidopsis mutants created by
multiple genetic crosses between point mutants in each of the nine genes (ACS1, ACS2, ACS4-9,

97
and ACS11). In these mutants ethylene is synthesized from SAM in two steps in which the
catalysts are aminocyclopropane-1-carboxylic acid (ACC) synthase (ACS; EC 4.4.1.14) and ACC
oxidase (ACO; EC 1.14.17.4), respectively. Each single ACS mutant has a WT phenotype while
the higher order mutants (pentuple, hexuple, heptuple, or octuple) have an array of
abnormalities. The knock-out of all nine ACS activities resulted in embryo lethality. The octuple
ACS mutant has a lower ethylene production than the pentuple, hexuple, or heptuple mutants
and shows delayed senescence.
PA-, NA- and ethylene-deficient mutant analysis led to the discovery of the connection of these
metabolites to a specific phenotype: Put or Spd with embryo development and Tspm with
vascular development. NA, on the other hand, is responsible for ion transport and seed
production, and ethylene affects many aspects of growth and development, including
senescence.
The MTN-deficient double mutant, mtn1-1mtn2-1, with disruptions in both its genes [MTN1
(At4g38800) and MTN2 (At4g34840)] has only ~ 14 % of the MTN activity present in WT (buds)
and two-fold to five-fold higher MTA content (Chapter 2). MTA is known to product inhibit the
enzymes that catalyze the biosynthesis of PA, NA, and ethylene in plants (Albers, 2009; Hyodo
and Tanaka, 1986; Herbik et al., 1997; Chapter 1). Changes in MTA metabolism thus have the
potential of impacting a vast number of processes, including PA, NA, and ethylene biosynthesis
and the developmental programs they coordinate. In agreement with this assessment is the
fact that mtn1-1mtn2-1 is deficient in NA content with altered PA profiles: increased Put with
decreased Spd and Spm (Chapter 2). This mutant, which also has reduced auxin transport and
altered auxin maxima shows a pleiotropic developmental defects, including delay in the
emergence of the inflorescence stem (bolting) along with defects in reproduction and vascular
development (Bürstenbinder et al., 2010; Chapter 2). The mtn1-1mtn2-1 is sterile, with defects

98
in both male and female reproductive structures. The male defects include abnormal and non-
viable pollen production with indehiscent anthers, and the female reproductive defects include
improper ovule maturation. The vascular defects in the leaves are evident as thicker mid-veins
each with increased xylem and phloem production. The stems have an increased number of
asymmetrically arranged vascular bundles that track to the altered auxin maxima. Thus, an
understanding of the role of MTN in plant development requires the dissection of the complex
phenotypes observed in the mtn1-1mtn2-1.
In this study, an allelic series of MTN-deficient lines with variable phenotypes and MTN
activities were comprehensively examined in order to identify and investigate the primary traits
in order of manifestation that result from MTN deficiency.

99
3.3 Methods
3.3.1 Plant materials and growth conditions
All of the MTN-deficient lines were first germinated on ½ MS media after the surface
sterilization of the seeds and incubation at 4:C for 48 h. After 14 d, 10 seedlings from all eight
lines including the wild type (WT, ecotype Columbia), were transplanted to soil and grown
under standard long day conditions: 8 h dark (21:C ) and 16 h light (23:C).
3.3.2 Plate and soil-based growth assays
Sterilized seeds were placed on ½ MS and the growth and developmental stages of all MTN-
deficient lines were compared to those of the WT using plate-based growth assays and soil-
based-growth assays conducted as detailed in Boyes et al. (2001). For the plate-based assays,
the time taken for the radicle to emerge (stage 0.5), the cotyledons to open (stage 1), and the
first set of true leaves > 1mm to be produced (stage 1.02) was recorded (usually a period of 14
days). These seedlings were then transplanted to soil for the soil-based assay. For this assay,
the number of leaves, the percentage of plants the inflorescence stems of which had emerged,
and the time taken for the first rosette leaf that turns yellow was recorded. Mature plants were
used to determine the final height, the number of cauline nodes, the number of cauline
branches, the number of first order rosette branches, and the number of second order rosette
branches.
3.3.3 Generation and identification of the amiRNA MTN-deficient mutants
With the use of MicroRNA Designer (http://wmd.weigelworld.org), a specific amiRNA was
designed to target only MTN2. The amiRNA was generated by using four primers amiMTN2-I-IV
(Table S3.2) and a pRS300-based vector as a template (Schwab et al., 2006). The amplified
amiRNA fragment was cloned into the EcoRI/BamHI site of pSAT4. These constructs were then
transferred into the I-SceI site of the pPZP-RCS2 binary vector to enable plant transformation, as

100
detailed in Chapter 2. The T1 seeds were screened by spraying with 0.067 % (v/v) (40 mg/mL)
herbicide glufosinate ammonium (Basta; Wipeout from Wilson Laboratories Inc.; Dundas, Canada)
daily after true leaf emergence; the presence of the amiRNA was confirmed in the resistant
plants by PCR with pSAT-F with amiMTN2-IV primers.
3.3.4 Development of double-mutant lines
The mtn1 (mtn1-1, mtn1-2, mtn1-4) and mtn2 (mtn2-1, mtn 2-2 and mtn2-5) homozygous
single mutants were crossed, and the resultant F2 progeny were screened for double mutants
by PCR, using left border and gene-specific reverse primers and a second reaction with two
flanking primers. Homozygous mtn1-4mtn2-1, mtn1-1mtn2-5, and mtn1-1mtn2-1 lines were
identified by means of PCR amplification using primers listed in Table S3.2. The T-DNA insertion
genomic location was confirmed by sequencing the resultant PCR products with left border
primers (data not shown).
3.3.5 Screening for MTN-deficient double mutants
For some allele combinations, mtn double mutants were not obtained after screening > 100 F2
plants (e.g. mtn1-2mtn2-2) and in some cases, the recovery rate of the double mutant was
much lower than the expected based on simple Mendelian segregation (e.g., mtn1-1mtn2-1).
To analyze the genotypes of the progeny in these cases, a plant that was segregating progeny
for only one mutant allele was identified from F2 populations and used for further analysis.
Using light microscopy, the seeds in three self-fertilized F2 stage 17b siliques from these plants
were compared visually with those from developmentally matched WT siliques in order to
determine the percentages of aborted ovules. All of the seeds from the three siliques from each
of these mutants were then germinated and the F3 seedlings genotyped through PCR in order
to determine the segregation ratio. All of the seeds from a replicated set of three siliques were
also cleared in Hoyer’s solution (30 g gum arabic, 200 g chloral hydrate, 20 g glycerol, and 50 mL

101
water; Truernit et al., 2008) to enable the detection of whole-mount embryos using light
microscopy.
3.3.6 Microscopic analysis
Free-hand stem cross-sections of all of the MTN-deficient lines were stained with 0.1 %
Toluidine Blue O (TBO) and observed using light microscopy. The stage 17b siliques were
placed individually onto the surface of double-sided tape which had been attached to slides.
After the valves were gently removed with fine-point tweezers, the seeds were observed with a
dissecting microscope and their contents scored according to the number of normal seeds,
abnormal seeds and unfertilized ovules. The developing seeds were placed in Hoyers’s solution
overnight. The slides were viewed using a Zeiss Axiovert 200M microscope with differential
interference contrast optics and Axiovision Rel. 4.63 software.
3.3.7 MTN assay and measurement of MTA and NA
The MTA activity of the crude protein extracts from the unopened floral buds of mtn1-1mtn2-5,
ami 5.3, mtn1-1mtn2-1, and the WT was determined using a spectrophotometric assay, as
described in Chapter 2. HPLC methods were used to measure the MTA and NA contents in the
rosette leaves and inflorescences of mtn1-1mtn2-1, ami5.3, mtn1-1mtn2-5, and the WT, as
described in Chapter 2.

102
3.4 Results
3.4.1 Mutant generation
3.4.1.1 MTN1 and MTN2 T-DNA double mutants
MTN-deficient single mutants were selected from either the SALK collection
(http://signal.salk.edu/cgi-bin/tdnaexpress; Alonso et al., 2003) or the GABI collection
(http://www.gabi-kat.de) based on the flanking sequence data provided. Four of the MTN-
deficient single mutants (mtn1-1, SALK_085385, T-DNA insertion in the third intron; mtn1-2,
GK_568C06, T-DNA insertion in the sixth exon; mtn2-1, SALK_ 071127, T-DNA insertion in the
fourth exon; mtn2-2, GK_845B05, T-DNA insertion in the fourth exon) are phenotypically WT in
standard growth conditions (Bürstenbinder et al., 2010). However, the mtn1-1mtn2-1 double
mutant showed pleiotropic phenotypes. To generate MTN-deficient double mutants that have
phenotypes less severe from those of the mtn1-1mtn2-1 mutant, two new MTN-deficient single
mutants, mtn1-4 (SALK_088214C, T-DNA insertion in the 5’ UTR) and mtn2-5 (SALK_022510, T-
DNA insertion in the promoter), were crossed with the existing mtn1-1 and mtn2-1 single
mutants (Figure 3.2, Table S3.1). Two new MTN-deficient double mutants were recovered:
mtn1-4mtn2-1 and mtn1-1mtn2-5. The genotypes of these mutants were confirmed by PCR
using gene-specific and left border primers (Figure S3.1, Tables S3.2, S3.3). Repeated attempts
to recover mtn1-2mtn2-2 failed.
3.4.1.2 MTN-deficient artificial microRNA (amiRNA) lines
Using the oligonucleotide sequences generated by Web MicroRNA Designer
(http://wmd.weigelworld.org; Schwab et al., 2006), several unsuccessful attempts were made
to engineer MTN-deficient amiRNA lines targeted at both MTN genes. Several lines that
expressed an amiRNA targeted at MTN2 in an mtn1-1 background were ultimately created.

103
Based on a preliminary analysis of 15 lines, two (ami2.8 and ami5.3) that shared some traits in
common with the mtn1-1mtn2-1 plants were selected for further analysis.
3.4.2 Detailed analysis of the mtn1-1mtn2-1 mutant phenotype
To establish the phenotypic extremes of MTN deficiency, the mtn1-1mtn2-1 mutants that had
the strongest phenotype compared to those of the WT were first analyzed. The mtn1-1mtn2-1
mutants exhibits a slight delay (less than a day) in radicle emergence (growth stage 0.5 as
described in Boyes et al., 2001; Figure S3.2A) and cotyledon opening (growth stage 1.0, as
described in Boyes et al., 2001; Figure S3.3). The mtn1-1mtn2-1 mutants had shorter roots than
WT (Figure S3.2B), which may be a consequence of the delayed emergence of their radicles.
These mutants also exhibit delayed development of their first true leaves, which have
interveinal chlorosis, as described in Chapter 2. Another phenotype that was observed in the
same growth stage of mtn1-1mtn2-1 plants was their defective leaf cuticle. This trait was
assayed using the rapid visualization method described by Tanaka et al. (2004). In this simple
method, leaves with cuticle defects become purple when stained with TBO which is excluded by
the waxy surface of WT leaves (Figure S3.4 A-C). Using this test, the mtn1-1mtn2-1 mutant
adaxial rosette leaf surface stained purple (Figure S3.4B) similarly to that of a mutant with
previously documented cuticle defects (fiddlehead, fdh-13; Fig S3.4C). The mtn1-1mtn2-1 was
classified as having a patchy cuticle defect (class II) based on the scheme developed by Tanaka
et al. (2004). As expected, WT did not exhibit an evident staining pattern (Figure S3.4A).
As the plants matured into the vegetative phase, the mtn1-1mtn2-1 mutants generated an
increased number of thick, long, narrow brittle-textured dark green rosette leaves compared to
the leaves of the WT plants (Figure 3.3; Figure S3.4D, E). Both the mtn1-1mtn2-1 and the WT
plants developed five juvenile-vegetative phase rosette leaves with round margins and
trichomes only on their adaxial surfaces. Next vegetative leaves developed with serrated
104
margins and trichomes present on both surfaces. The mtn1-1mtn2-1 plants grew 7 ± 1 adult
vegetative phase rosette leaves as compared to the 4 ± 1 vegetative phase rosette leaves
produced by the WT.
Figure 3.2: Gene structure of MTN genes
Gene structure of MTN1 (top) and MTN2 (bottom) showing the T -DNA insertions for 1-1,
1-2, 1-4, 2-1, 2-2 and 2-5.

105
Figure 3.3: Total number of rosette leaves of MTN-deficient lines.
106
The mtn1-1mtn2-1 plants produced 12 ± 1 adult rosette leaves without petioles compared to
the WT production of 2 ± 1 at bolting. Both adult-vegetative phase rosette leaves and adult
reproductive-phase rosette leaves contribute to the overall increased number of leaves evident
in the mtn1-1mtn2-1 mutant. As described in Chapter 2, these mtn1-1mtn2-1 rosette leaves
have an increased vasculature, with thicker-mid veins due to the increased xylem proliferation.
(N = 5-8).
In the reproductive phase, 17 days after germination, 50 % of the WT population reached
growth stage 5.10 (Boyes et al., 2001), which occurs when the first flower buds are visible
(bolting). It is notable that formation of the first flower buds was delayed in the mtn1-1mtn2-1
mutant by six days and that, because of individual variation, six weeks were required for the
entire population to transit to the flowering stage (Figure 3.4A, B). Compared to the WT plants,
the mature mtn1-1mtn2-1 plants were shorter and bushier with enhanced shoot branching
(Figure 3.5A, F). The mutant plants remained shorter than the WT ones at each developmental
time point up to 40 days after sowing, as indicated by the height of the primary inflorescence
(Figure 3.4A). However, since the mutant plants continued to increase in height and show
delayed senescence, they reached a final height of 26 ± 3 cm versus the 24 cm height of the WT
plants at maturity (Figure 3.5A, B).
Arabidopsis has two types of nodes that produce first-order branches: cauline nodes, located
on the primary inflorescence stem, and rosette nodes, located on the hypocotyl. The number of
cauline nodes was 3 ± 1 for both mtn1-1mtn2-1 and the WT plants, with a similar number of
first-order branches arising from the primary inflorescence stem. On the other hand, the
number of first-order branches produced from the rosette nodes was greater in the mtn1-
1mtn2-1 plants than in the WT plants (Figure 3.6B). Moreover, in the mtn1-1mtn2-1 plants an
increased number of second-order branches were also produced from the first-order rosette

107
branches. The overall increase in number of branches produced a bushy shoot architecture in
the mtn1-1mtn2-1 mutant (Figure 3.5D). At times, two or more cauline leaves arose from the
same cauline node and two or more first-order branches grew out from the same cauline node,
which are indications of abnormal phyllotaxy. The first-order cauline branches or the second-
order rosette branches of the mtn1-1mtn2-1 mutant were most commonly fascinated with the
axillary cauline leaves (Figure 3.6G). Occasionally, the branches of these mtn1-1mtn2-1 mutants
became extremely thick and flattened (Figure 3.6H). When compared to WT inflorescences the
mtn1-1mtn2-1 inflorescences also had altered phyllotaxy with deformed flowers. These
mutants were also sterile due to poor ovule development and irregular microsporogenesis,
resulting in reduced fertilization efficiency (Chapter 2).
In keeping with the delay in many of the developmental stages, the time to senescence (stage
9.0 in Boyes et al. (2001) was also delayed. On average, 50 % of the WT plants reached this
stage 43 days after germination whereas the mtn1-1mtn2-1 plants took 48.5 days to senesce.
One phenotype exhibited in both the vegetative and reproductive stages was organ twisting.
This was observed in almost all organs of mtn1-1mtn2-1 plants which were twisted to some
extent (Figure S3.5): the hypocotyl, rosette leaves, stems, flower parts (pedicels, stigmas,
anther filaments), siliques (stage 16), and roots. The twisting observed was very subtle in the
vegetative phase but became more pronounced upon the transition to the reproductive phase.
In each organ, the twisting occurred at random locations with an unfixed handedness. For
example, along the length of the anther filament shown in Figure S3.5M, the epidermal cell files
are arranged in both right- and left-handed directions: towards the anther, the cell files were
twisted in a right-handed direction while towards the filament base the files were arranged in a
left-handed direction.

108
Figure 3.4: Delayed bolting phenotype of MTN-deficient plants.
(A) Primary inflorescence stems at 20 days after germination
(B) Percentage bolted over a period of six weeks (N = 15 for WT and ami2.8; N = 30 for all
other genotypes).
(C) Number of leaves at the time of bolting. Different letters indicate the statistically
significant variations. Means were compared using an independent sample t -test.
Average ± SD. (N = 5-8).

109
The pleiotropic developmental defects in the mtn1-1mtn2-1 mutant are believed to be due to
the binding of accumulated MTA to Spd synthase, Tspm synthase as shown in the present work
(Chapter 2). Similarly, MTA binding is also repoted for NA synthase (Herbik et al., 1997) and
possibly ACC synthase (Hyodo and Tanaka, 1986). Thus, MTA binding of these enzymes inhibit
their activities. Some of the traits observed in this mutant are clearly secondary effects. To
determine the fundamental primary target affected by MTA deficiency, phenotypes that could
be traced back to a specific enzyme activity that is affected by MTA were examined in less
severe MTN-deficient mutants. The following representative phenotypes were investigated:
embryo lethality and bolting time, which were interpreted as Spd-deficient phenotypes; stem
vasculature defects, which were attributed to Tspm-deficient phenotypes; interveinal chlorosis
and limited seed production, which were considered to be NA-deficient phenotypes; and
delayed senescence, an ethylene-deficient-phenotype.
3.4.3 Variations in the PA-related phenotypes and the degree of MTN-deficiency
3.4.3.1 Embryo development
Spd is essential for embryo development (Imai et al., 2004b), so the progenies of three different
F2 populations that segregated for one mtn allele (i.e., heterozygous for mtn1 and homozygous
for mtn2, or vice versa) were genotyped by PCR. All the seeds of the individual siliques were
germinated on ½ MS, and the F2 progeny were genotyped. The mtn1-4mtn2-1 and
mtn1-1mtn2-5 double mutants were recovered from the corresponding F2 population with an
expected frequency of 1/4th (Table 3.1). However, mtn1-1mtn2-1 double mutants were
recovered at a lower than expected frequency of 1/7th (Table 3.1). In the F2 progeny of
mtn1-1mtn1-1/MTN2mtn2-1, 25 % of the seedlings were expected to be double mutants, but
only 14 % of these seedlings were confirmed to be mtn1-1mtn1-1 and 6 % did not germinate (N
= 3 siliques from 3 plants). The frequency of this mtn1-1mtn2-1 double

110
Figure 3.5: The mature phenotype of MTN-deficient lines.
(A)The WT, (B) mtn1-4mtn2-1, and (C) ami2.8 senesced earlier than the (D) mtn1-1mtn2-
5, (E)ami5.3, and (F)mtn1-1mtn2-1. The fully matured green siliques were observed in all
lines except mtn1-1mtn2-1. The close up images of primary inflorescences show the
relative abundance and lengths of the siliques of mtn1-1mtn2-5 and ami5.3 compared to
those of the WT and mtn1-1mtn2-1.

111
mutant recovery was significantly different from the 1/4th that was expected based on chi
square analysis (χ2 = 5.9; df = 2; P = 0.05). The mtn1-2mtn2-2 mutant with T-DNA insertions in
exons of both MTN genes was not identified even after > 100 F2 seedlings were genotyped.
Thus, we concluded that in the lines tested, embryo development is reduced in mtn1-1mtn2-1,
whereas mtn1-2mtn2-2 is embryo lethal.
The morphology of the seeds produced from the self-pollinated MTN1mtn1/mtn2mtn2 plants
was analyzed using microscopic observation of dissected stage 17b (Smyth et al., 1990) siliques.
In agreement with the expected double mutant recovery from the segregation analysis, the
MTN1mtn1-4/mtn2-1mtn2-1 and MTN1mtn1-1/mtn2-5mtn2-5 siliques contained large green
seeds similar to those in the WT siliques (Figure 3.7A). The MTN1mtn1-1/mtn2-1mtn2-1 siliques
contained 8 % (N = 8-10 siliques from each of 4 plants) aborted ovules along with WT-like seeds
(Figure 3.7A).
Table 3.1: Segregation analysis of the MTN1mtn1/mtn2mtn2 T-DNA alleles
Chi-squared values were calculated for the expected segregation ratio. Statistically
significant deviation (P > 0.05) from this ratio is indicated by an asterisk (*).
Total Homo
(-/-)
Het
(+/-)
Homo
(+/+)
Non –
germinated
seeds
χ2
(hypothesis)
MTN1mtn1-4/
mtn2-1mtn2-1
420 115 199 106 0 1.54
(1:2:1); N=9
MTN1mtn1-1/
mtn2-5mtn2-5
252 65 129 58 0 0.53 (1:2:1);
N=6
MTN1mtn1-1/
mtn2-1mtn2-1
69 10 33 26 8 7.55*
(1:2:1); N=3

112
Figure 3.6: Shoot architecture of the mature plant or architecture of the mature plant shoots
(A) Height of the primary inflorescence over a period of eight weeks
(B) Number of first- and second order lateral branches arising from rosette nodes at the
cessation of flower production: after 45-46 days after germination for WT and after 84
days after germination for mtn1-1mtn2-1 (N = 30; Error bars represent Standard
deviation).
(C) Diagram of primary and secondary rosette branches.
(D-E) Rosette branches of the (D) WT compared to those of the (E) mtn1-1mtn2-1. The
first-order rosette branches (double arrowheads) that arise from the rosette nodes
subsequently give rise to many second-order rosette branches (single arrowheads) in
the mtn1-1mtn2-1 mutant.
(F-H) Representative branches of WT and mtn1-1mtn2-1 shoots. In the (F) WT plants, the
first-order rosette branch axil with a single cauline leaf gives rise to a single lateral
branch whereas in the (G) mtn1-1mtn2-1 mutant an axil may have many cauline leaves
(asterisks) and gives rise to many lateral branches which are indicative of altered
phyllotaxy. The cauline leaves of the mtn1-1mtn2-1 are often fasciated to the rosette
branches (double arrowhead); occasionally, (H) stems are fasciated and generate flat
structures.

113
To determine whether the embryos in the WT-like seeds in the MTN1mtn1-1/MTN2-1mtn2-1
siliques had developmental defects, all of the seeds from 10 stage 16 and 17b siliques were
cleared and observed. In the WT plants, seeds develop synchronously within each silique,
resulting in similar stage embryos within an individual silique (i.e., stage 17b siliques contain
100 % mature embryos (Figure 3.7B, D).
However, in the MTN1mtn1-1/MTN2mtn2-1 plants, embryos at different stages (i.e., stage 17 b
siliques contained topedo-stage embryos among the majority of mature embryos [Figure 3.7C]
or developmentally delayed same-stage embryos [Figure 3.7E]) were observed. The proportion
of defective embryos was in agreement with the expected double mutant frequency (1/16th) of
the total seeds in each silique. However, based on the segregation analysis, the 6 % (Table 3.1)
of seeds that did not germinate suggest that some of these embryos were arrested and unable
to develop into a seedling.
In summary, the F2 populations of MTN1mtn1-4/mtn2-1mtn2-1 and MTN1mtn1-1/
mtn2-5mtn2-5 (or mtn1-1mtn1-1/MTN2mtn2-5) segregate in the expected Mendelian ratios
whereas F2 populations of mtn1-1mtn1-1/MTN2mtn2-1 segregate fewer homozygous double
mutants than expected. Detailed analysis of the seeds and embryos of MTN1-1mtn1-1/mtn2-
1mtn2-1 suggest that most likely these heterozygous plants have fertilization defects similar to
those described for mtn1-1mtn2-1 (Chapter 2), but to a lesser degree. In contrast to the general
observation that 100 % of the ovules in mtn1-1mtn2-1 are unfertilized, only ~8 %, (Table S3.4)
of the ovules in these plants are unfertilized. In a group of fertilized ovules that gave rise to
developmentally delayed embryos, ~ 6 % did not germinate into mtn1-1mtn2-1 seedlings. Of
the MTN-deficient lines tested, only F2 populations of the MTN1mtn1/mtn2mtn2 lines have
developmental defects in the embryo.

114
Figure 3.7: Leaf vein pattern and pollen tube growth of mtn1-1mtn2-1 compared to WT.
(A) Images showing normal seeds of the WT, MTN1mtn1-4/mtn2-1mtn2-1, and
MTN1mtn1-1/mtn2-5mtn2-5 plants and aborted ovules (↑) of MTN1mtn1-1/mtn2-
1mtn2-1.
(B-E) Embryos within cleared seeds . (B, C) stage 17b siliques and (D, E) stage 16 siliques
of (B, D) the WT and (C, E) the MTN1mtn1-1/MTN2mtn2-1 plants. In WT siliques
only one stage of embryos were pbserved: mature embryos at silique stage 17b and
heart stage embryos at silique stage 16. On the other hand the some of the
embryos of MTN1mtn1-1/MTN2mtn2-1 were delayed as indicated by asterisks (*).
Scale bars = 25 µm.
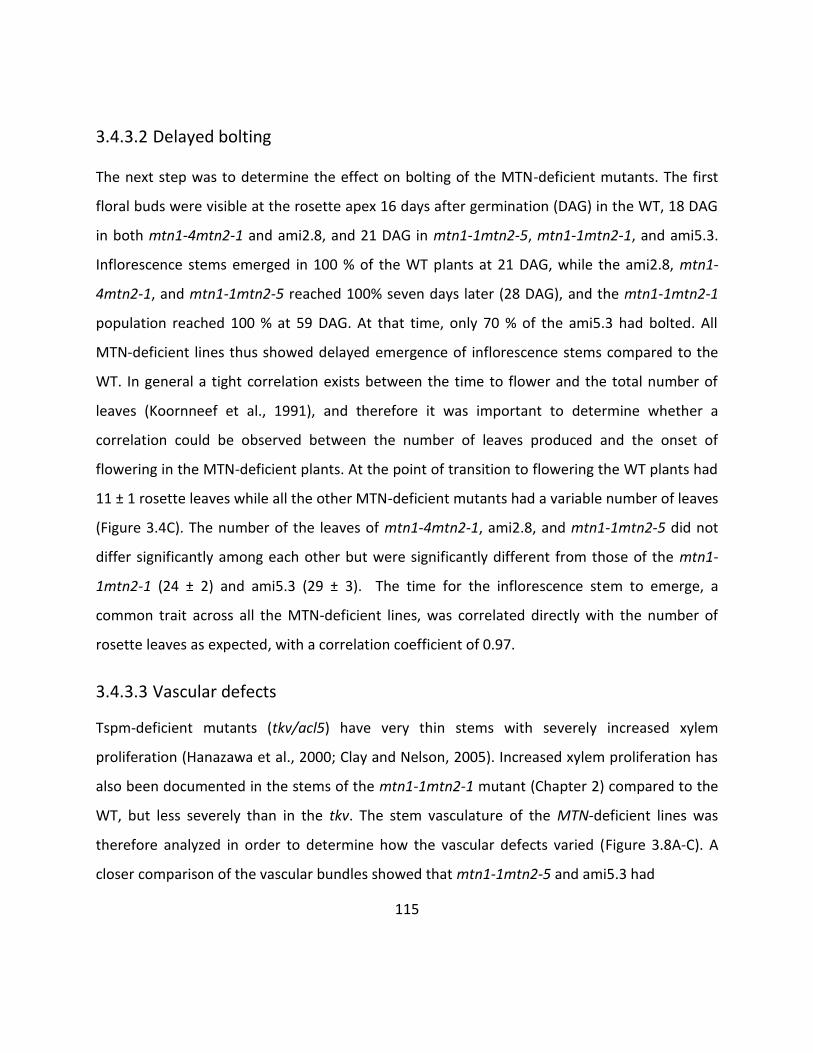
115
3.4.3.2 Delayed bolting
The next step was to determine the effect on bolting of the MTN-deficient mutants. The first
floral buds were visible at the rosette apex 16 days after germination (DAG) in the WT, 18 DAG
in both mtn1-4mtn2-1 and ami2.8, and 21 DAG in mtn1-1mtn2-5, mtn1-1mtn2-1, and ami5.3.
Inflorescence stems emerged in 100 % of the WT plants at 21 DAG, while the ami2.8, mtn1-
4mtn2-1, and mtn1-1mtn2-5 reached 100% seven days later (28 DAG), and the mtn1-1mtn2-1
population reached 100 % at 59 DAG. At that time, only 70 % of the ami5.3 had bolted. All
MTN-deficient lines thus showed delayed emergence of inflorescence stems compared to the
WT. In general a tight correlation exists between the time to flower and the total number of
leaves (Koornneef et al., 1991), and therefore it was important to determine whether a
correlation could be observed between the number of leaves produced and the onset of
flowering in the MTN-deficient plants. At the point of transition to flowering the WT plants had
11 ± 1 rosette leaves while all the other MTN-deficient mutants had a variable number of leaves
(Figure 3.4C). The number of the leaves of mtn1-4mtn2-1, ami2.8, and mtn1-1mtn2-5 did not
differ significantly among each other but were significantly different from those of the mtn1-
1mtn2-1 (24 ± 2) and ami5.3 (29 ± 3). The time for the inflorescence stem to emerge, a
common trait across all the MTN-deficient lines, was correlated directly with the number of
rosette leaves as expected, with a correlation coefficient of 0.97.
3.4.3.3 Vascular defects
Tspm-deficient mutants (tkv/acl5) have very thin stems with severely increased xylem
proliferation (Hanazawa et al., 2000; Clay and Nelson, 2005). Increased xylem proliferation has
also been documented in the stems of the mtn1-1mtn2-1 mutant (Chapter 2) compared to the
WT, but less severely than in the tkv. The stem vasculature of the MTN-deficient lines was
therefore analyzed in order to determine how the vascular defects varied (Figure 3.8A-C). A
closer comparison of the vascular bundles showed that mtn1-1mtn2-5 and ami5.3 had

116
Figure 3.8 Vascular phenotype of MTN-deficient mutants/lines.
(A) Representative stem cross-sections of inflorescence stems taken ~2-3cm above the
base from all six lines two weeks after bolting. Scale bars = 50 µm
(B) The most proliferated vascular bundle of each stem section (white boxes in A) was
enlarged to enable comparison of the vascular tissues between the lines. The yellow
dotted line indicates the location of the cambium, which generates phloem (ph)
toward the stem epidermis and xylem (xy) toward the stele. Scale bars = 150 µm
(C) The number of vascular bundles per unit area was calculated from cross -sectional
images that were magnified 15 fold. The same letters indicate the significant
differences (P < 0.05). Values are mean ± SD. (N = 3-4).
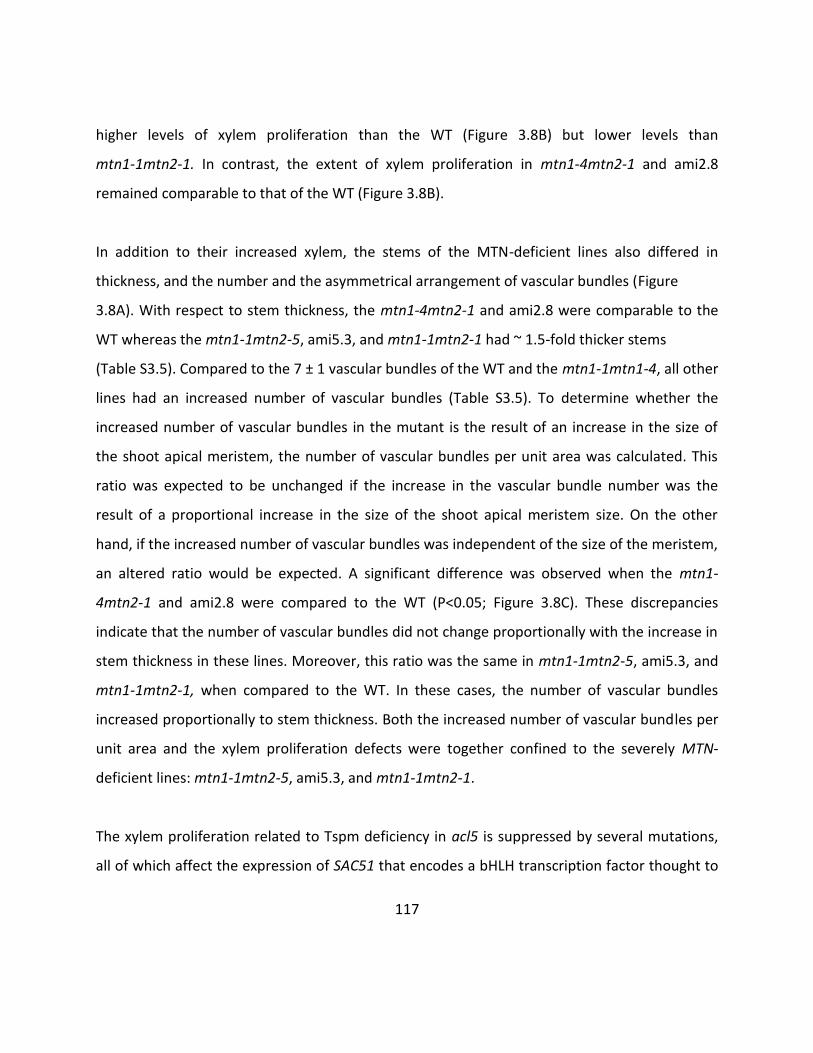
117
higher levels of xylem proliferation than the WT (Figure 3.8B) but lower levels than
mtn1-1mtn2-1. In contrast, the extent of xylem proliferation in mtn1-4mtn2-1 and ami2.8
remained comparable to that of the WT (Figure 3.8B).
In addition to their increased xylem, the stems of the MTN-deficient lines also differed in
thickness, and the number and the asymmetrical arrangement of vascular bundles (Figure
3.8A). With respect to stem thickness, the mtn1-4mtn2-1 and ami2.8 were comparable to the
WT whereas the mtn1-1mtn2-5, ami5.3, and mtn1-1mtn2-1 had ~ 1.5-fold thicker stems
(Table S3.5). Compared to the 7 ± 1 vascular bundles of the WT and the mtn1-1mtn1-4, all other
lines had an increased number of vascular bundles (Table S3.5). To determine whether the
increased number of vascular bundles in the mutant is the result of an increase in the size of
the shoot apical meristem, the number of vascular bundles per unit area was calculated. This
ratio was expected to be unchanged if the increase in the vascular bundle number was the
result of a proportional increase in the size of the shoot apical meristem size. On the other
hand, if the increased number of vascular bundles was independent of the size of the meristem,
an altered ratio would be expected. A significant difference was observed when the mtn1-
4mtn2-1 and ami2.8 were compared to the WT (P<0.05; Figure 3.8C). These discrepancies
indicate that the number of vascular bundles did not change proportionally with the increase in
stem thickness in these lines. Moreover, this ratio was the same in mtn1-1mtn2-5, ami5.3, and
mtn1-1mtn2-1, when compared to the WT. In these cases, the number of vascular bundles
increased proportionally to stem thickness. Both the increased number of vascular bundles per
unit area and the xylem proliferation defects were together confined to the severely MTN-
deficient lines: mtn1-1mtn2-5, ami5.3, and mtn1-1mtn2-1.
The xylem proliferation related to Tspm deficiency in acl5 is suppressed by several mutations,
all of which affect the expression of SAC51 that encodes a bHLH transcription factor thought to
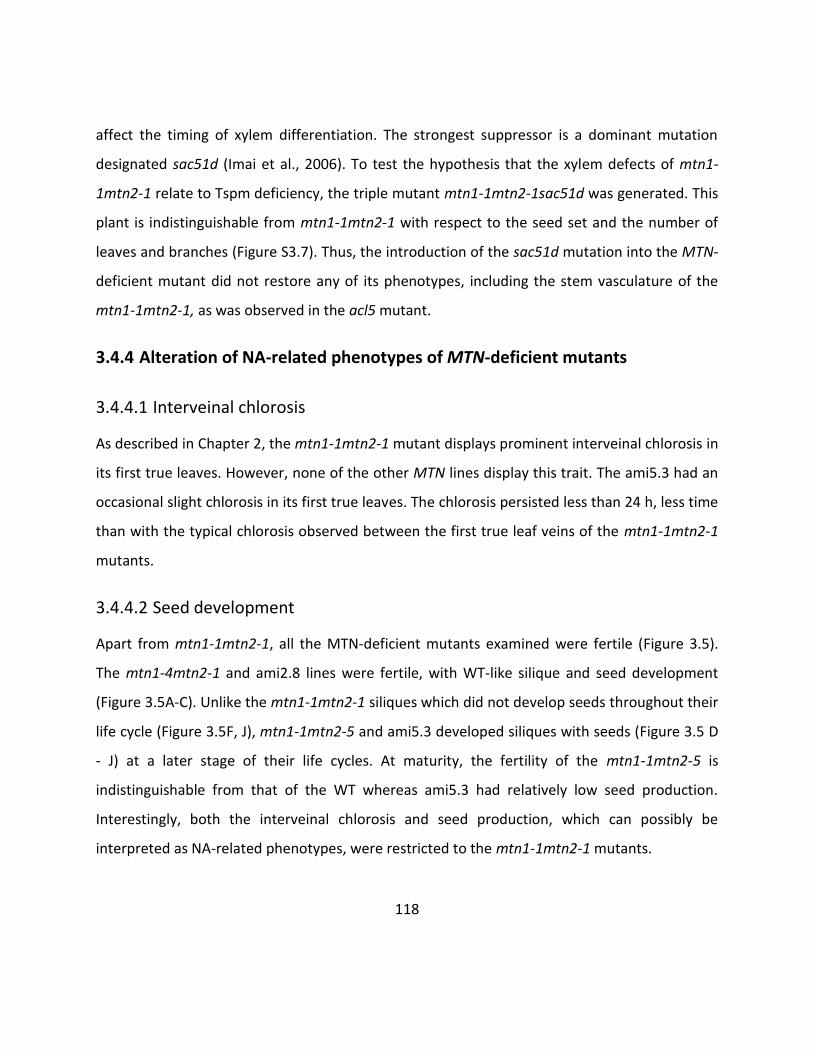
118
affect the timing of xylem differentiation. The strongest suppressor is a dominant mutation
designated sac51d (Imai et al., 2006). To test the hypothesis that the xylem defects of mtn1-
1mtn2-1 relate to Tspm deficiency, the triple mutant mtn1-1mtn2-1sac51d was generated. This
plant is indistinguishable from mtn1-1mtn2-1 with respect to the seed set and the number of
leaves and branches (Figure S3.7). Thus, the introduction of the sac51d mutation into the MTN-
deficient mutant did not restore any of its phenotypes, including the stem vasculature of the
mtn1-1mtn2-1, as was observed in the acl5 mutant.
3.4.4 Alteration of NA-related phenotypes of MTN-deficient mutants
3.4.4.1 Interveinal chlorosis
As described in Chapter 2, the mtn1-1mtn2-1 mutant displays prominent interveinal chlorosis in
its first true leaves. However, none of the other MTN lines display this trait. The ami5.3 had an
occasional slight chlorosis in its first true leaves. The chlorosis persisted less than 24 h, less time
than with the typical chlorosis observed between the first true leaf veins of the mtn1-1mtn2-1
mutants.
3.4.4.2 Seed development
Apart from mtn1-1mtn2-1, all the MTN-deficient mutants examined were fertile (Figure 3.5).
The mtn1-4mtn2-1 and ami2.8 lines were fertile, with WT-like silique and seed development
(Figure 3.5A-C). Unlike the mtn1-1mtn2-1 siliques which did not develop seeds throughout their
life cycle (Figure 3.5F, J), mtn1-1mtn2-5 and ami5.3 developed siliques with seeds (Figure 3.5 D
- J) at a later stage of their life cycles. At maturity, the fertility of the mtn1-1mtn2-5 is
indistinguishable from that of the WT whereas ami5.3 had relatively low seed production.
Interestingly, both the interveinal chlorosis and seed production, which can possibly be
interpreted as NA-related phenotypes, were restricted to the mtn1-1mtn2-1 mutants.
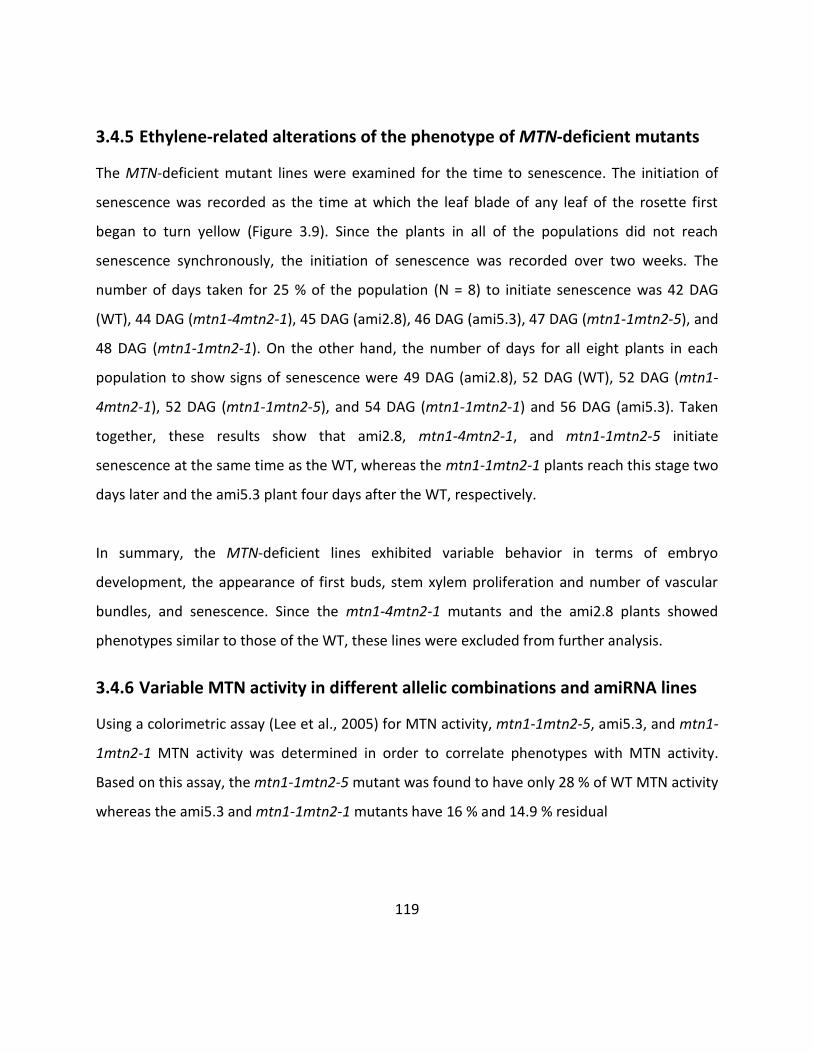
119
3.4.5 Ethylene-related alterations of the phenotype of MTN-deficient mutants
The MTN-deficient mutant lines were examined for the time to senescence. The initiation of
senescence was recorded as the time at which the leaf blade of any leaf of the rosette first
began to turn yellow (Figure 3.9). Since the plants in all of the populations did not reach
senescence synchronously, the initiation of senescence was recorded over two weeks. The
number of days taken for 25 % of the population (N = 8) to initiate senescence was 42 DAG
(WT), 44 DAG (mtn1-4mtn2-1), 45 DAG (ami2.8), 46 DAG (ami5.3), 47 DAG (mtn1-1mtn2-5), and
48 DAG (mtn1-1mtn2-1). On the other hand, the number of days for all eight plants in each
population to show signs of senescence were 49 DAG (ami2.8), 52 DAG (WT), 52 DAG (mtn1-
4mtn2-1), 52 DAG (mtn1-1mtn2-5), and 54 DAG (mtn1-1mtn2-1) and 56 DAG (ami5.3). Taken
together, these results show that ami2.8, mtn1-4mtn2-1, and mtn1-1mtn2-5 initiate
senescence at the same time as the WT, whereas the mtn1-1mtn2-1 plants reach this stage two
days later and the ami5.3 plant four days after the WT, respectively.
In summary, the MTN-deficient lines exhibited variable behavior in terms of embryo
development, the appearance of first buds, stem xylem proliferation and number of vascular
bundles, and senescence. Since the mtn1-4mtn2-1 mutants and the ami2.8 plants showed
phenotypes similar to those of the WT, these lines were excluded from further analysis.
3.4.6 Variable MTN activity in different allelic combinations and amiRNA lines
Using a colorimetric assay (Lee et al., 2005) for MTN activity, mtn1-1mtn2-5, ami5.3, and mtn1-
1mtn2-1 MTN activity was determined in order to correlate phenotypes with MTN activity.
Based on this assay, the mtn1-1mtn2-5 mutant was found to have only 28 % of WT MTN activity
whereas the ami5.3 and mtn1-1mtn2-1 mutants have 16 % and 14.9 % residual

120
Figure 3.9: Time taken for the leaf edges to become yellow (senescence).
0
20
40
60
80
100
120
42 44 47 49 52 54 56
Pe
rce
nt
Sen
esc
en
es
Days after Germination
WT
mtn1-4mtn2-1
mtn1-1 mtn2-5
mtn1-1 mtn2-1
ami 5.3
ami 2.8

121
activities, respectively (Figure 3.10; N = 5). The MTN activity in each line was significantly
reduced compared to that evident in the WT (P < 0.05), but no significant difference was
observed between the activity in the ami5.3 and the mtn1-1mtn2-1. Next we examined
whether the phenotypes observed correlated with the content of Met-related metabolites.
3.4.7 Variable MTA content in the leaves of MTN-deficient mutants
It was expected that the MTA content of the mutants would correlate inversely with the
amount of residual MTN activity determined in crude bud extracts (Figure 3.10). However, this
expected trend was found only in the case of the MTA content of rosette leaves: all lines were
significantly different from one another (P< 0.05, Figure 3.11A). The MTA content of the mtn1-
1mtn2-1 (2.2 ± 0.1 pmol mg FW-1), which had 14.9 % MTN activity of WT, was 2.4-fold greater
than that in the WT (0.9± 0.2 pmol mg FW-1), and the ami5.3, with 16 % of the MTN activity an
MTA content only 1.7 fold greater, resulting from increased MTA content (1.5 ± 0.2 pmol mg
FW-1). In contrast, the MTA content of the mtn1-1mtn2-5 was 0.6 ± 0.1 pmol mg FW-1 (0.7 fold
change compared to WT) with 28 % of the MTN activity. In the inflorescences, a statistically
significant increase in MTA was observed only in the mtn1-1mtn2-1 compared to the level in
the WT, (P< 0.05, Figure 3.11B). The MTA content of the other two lines was indistinguishable
both from the level of the other line and from that of the WT.
3.4.8 NA content in MTN-deficient lines
The NA content of both the rosette leaves and the inflorescences was decreased in MTN-
deficient lines compared to the levels in the WT, except in the ami5.3 leaves (Figure 3.12A, B).
The NA content of the mtn1-1mtn2-1 rosette leaves was significantly reduced compared to that
in the WT leaves (P<0.05; Figure 3.11A). Significant differences were also observed between the
mtn1-1mtn2-5 and the mtn1-1mtn2-1 rosette leaves (P<0.05; Figure 3.11A). However, as with
the MTA content, only the mtn1-1mtn2-1 inflorescences showed a

122
Figure 3.10: MTN activity of MTN-deficient plants.
The different letters indicate the significant differences (P < 0.05). Values are mean ± SD.
(N = 5).

123
Figure 3.11: MTA concentration of MTN-deficient lines.
Different letters indicate the statistically significant differences between genotypes (P<
0.05). (N = 4).

124
Figure 3.12: NA content of MTN-deficient lines.
Different letters indicate the statistically significant differences between genotypes (P<
0.05). (N = 4).

125
significant reduction in NA when compared to the WT inflorescences (P<0.05) (Figure 3.12B).
The anomalous NA content of the ami5.3 leaves most likely reflects inefficient or variable
silencing in the leaves.
3.5 Discussion
3.5.1 MTN activity and phenotypes of the MTN-deficient lines
This study has compared the phenotypes and Met-related metabolites of two groups of plants
relative to WT: three double mutants with reduced MTN activity due to T-DNA insertions and a
line created by artificial microRNA expression. The mtn1-4mtn2-1 and mtn1-1mtn2-5 exhibited
phenotypes that were less complex than those of mtn1-1mtn2-1. mtn1-1mtn2-1 contains two
insertion mutations, one in the third intron of MTN1 (mtn1-1) and another in the fourth exon of
MTN2 (mtn2-1), and has a severe pleiotropic phenotype (Bürstenbinder et al., 2010; Chapter 2).
The mtn1-1 and mtn2-1 alleles were combined with weaker alleles [i.e., mtn1-4, which has a T-
DNA insertion in the 5’ untranslated region (UTR) of MTN1, and mtn2-5, which has a T-DNA
insertion in the promoter of MTN2] to generate plants with moderate MTN deficiencies. The
observations of their phenotypes are in agreement with the findings from a survey of 136 T-
DNA insertion mutants (Wang et al., 2008), which revealed that insertions in either the
promoter or 5’ UTR are less effective in generating knockout mutants than insertions in either
exons or introns. When the T-DNA is inserted before the start codon, the translation of the
gene is often weakly reduced, resulting in a leaky phenotype (Wang et al., 2008). Since MTN1
contributes 80 % of the total MTN activity in the leaves (Bürstenbinder et al., 2010), combining
a weak allele for MTN1 with the knock-out mtn2-1 resulted in a plant (mtn1-4mtn2-1) with a 98
% MTN level of activity. Surprisingly, this modest MTN deficiency resulted in a two-day delay in
the formation of the first flower buds. On the other hand, plants containing the weak allele for
MTN2 along with the somewhat leaky mtn1-1 mutation (mtn1-1mtn2-5) showed only 28 % of
the MTN activity of the WT and exhibited a phenotype closer to that of the mtn1-1mtn2-1,

126
including delayed formation of the first flower buds and increased xylem proliferation. The final
observation is that mtn1-2mtn2-2 plants containing knock-out insertions in the sixth exon of
MTN1 (mtn1-2) and the fourth exon of MTN2 (mtn2-2) were apparently lethal; this double
mutant was not recovered from repeated screenings of F2 populations (N = 3; > than 100 F2
seedlings). The combination of mutant alleles that affect cis elements with those located within
exons or introns thus enabled the generation of mutants with moderate MTN activity and
variable phenotypes compared to those of mtn1-1mtn2-1.
Artificial microRNA silencing of MTN proved to be difficult. Attempts to simultaneously reduce
both MTN1 and MTN2 by one amiRNA (two different designs) or two individual amiRNAs failed:
the T1 plants resulting from these transformations appeared identical to the WT, with no
evidence of MTN silencing. It was concluded that the silenced plants were lethal and that only
plants that did not express the amiRNA effectively had been recovered. Taking the approach of
reducing MTN2 expression (the less active MTN gene) in an mtn1-1 background led to the
generation of multiple amiMTN lines, although substantial variation was observed among the
progeny of the more silenced lines. The ami5.3 line was the most strongly affected and had
three distinct progeny phenotypes: WT-like, mtn1-1mtn2-1-like and tkv-like (Figure S3.8). Since
the degree of silencing in an amiRNA line corresponds to the levels of expression of the amiRNA
(Schwab et al., 2006), we assume that the phenotypic and metabolic variation of ami5.3 plants
reflects fluctuations in silencing that contribute to variations in the biochemical inhibition
caused by MTA.
3.5.2 Effect of MTN-deficiency on the embryo and seed development of MTN-
deficient mutants
A correlation was discovered between MTN activity and seed production in the plant lines
studied. The mtn1-1mtn2-1, with 14.9 % MTN activity, did not produce seed, and ami5.3 with

127
16 % activity, developed seeds only sparsely. The mtn1-1mtn2-5 with 28 % MTN activity
showed normal seed production. It is highly unlikely that the 1 % difference of MTN activity
between mtn1-1mtn2-1 and ami5.3 could have an effect on seed production. However, the
variable silencing of ami5.3 in the later development stages could be a possible explanation for
this difference.
Many processes occur during seed development, which begins with double fertilization and
ends with the production of dormant seeds that become the next generation (Raghavan, 2006).
These processes include embryo differentiation (Gehring et al., 2004; Huh et al., 2008),
endosperm formation (Braybrook, 2008), and seed coat development (Haughn and Chaudhury,
2005).
Analysis of the seeds within the siliques of MTN1mtn1-1/mtn2-1mtn2-1 plants resulted in ~8 %
(N = 8-10 siliques each of four plants) of the ovules being identified as unfertilized, a result
consistent with the reduced fertilization efficiency previously noted in this line (Chapter 2). In
addition, 14 % (N = 3 siliques from 3 plants) of the progeny of MTN1mtn1-1/mtn2-1mtn2-1
plants were mtn1-1mtn2-1 homozygotes that had completed embryo differentiation,
endosperm formation, and seed coat development. On the other hand, 6 % (N = 3 siliques from
3 plants) of the seeds with a developed seed coat did not germinate to produce seedlings; these
embryos most likely arrested at some point during embryo development.
Several factors might cause the MTN-deficient embryos to become lethal: (1) Spd is required for
embryogenesis (Imai et al., 2004b), and given that mtn1-1mtn2-1 plants have reduced Spd
content, their embryos may be affected similar to spd-deficient mutants, either because of
MTA inhibition of PA synthesis or because of lower production of Spd conjugates (Luo et al.,
2009); (2) the nutrient supply to the embryo from the maternal tissues may be disrupted either

128
due to the reduced NA-mediated transport of essential metals, or as a result of vascular
development defects that hinder the nutrient transfer between the maternal tissue and the
embryo. At this point, there are no data to distinguish between these possibilities.
3.5.3 Correlation of the variable level of MTN activity with altered xylem
proliferation
The MTN-deficient mutants exhibited an array of vascular stem defects including an increased
number of asymmetrically arranged vascular bundles and an over proliferation of xylem within
the vascular bundles. Of these traits, xylem proliferation and the symmetry of the bundle
arrangement were inversely correlated with residual MTN activity: mtn1-1mtn2-5, ami5.3, and
mtn1-1mtn2-1 with a 28 %, 16 %, and 14.9 % MTN activity, respectively, exhibited an increased
degree of xylem proliferation (Figure 3.8B). In contrast, the number of vascular bundles per unit
area was not significantly different among mtn1-1mtn2-5, ami5.3, and mtn1-1mtn2-1 (Figure
3.8C). The vascular phenotype that most strongly correlates with MTN activity is an increase in
xylem proliferation. The Tspm-deficient mutants acl5 and tkv (Hanazawa et al., 1997; Clay and
Nelson, 2005) have similar xylem proliferation abnormalities. In the case of acl5, this phenotype
was suppressed by a mutation in an upstream of a bHLH gene (sac51d mutation; Imai et al.,
2006). Based on the model proposed by Imai et al. (2006), sac51d suppression of the acl5
phenotype is the result of the Tspm-mediated activation of SAC51 translation. In WT plants, one
of the short upstream open reading frames (uORFs) of SAC51 encodes a 53 amino acid
polypeptide. This peptide represses the translation of the main open reading frame (mORF) of
SAC51. ACL5 (Tspm synthase) expression leads to Tspm synthesis, which inhibits repression by
the uORF peptide, thereby allowing the synthesis of SAC51. The acl5 mutant, which is thought
to produce essentially no Tspm, has low or no SAC51 production. The sac51d point mutation in
the fourth uORF of SAC51 leads to the premature termination of the uORF peptide, resulting in
the synthesis of a 3-amino-acid polypeptide rather than the 53-amino-acid polypeptide. This 3-

129
amino-acid polypeptide is incapable of repressing mORF expression and thus allows SAC51
production in the absence of Tspm (Imai et al., 2006).
The sac51d mutation did not suppress any of the abnormal traits of the mtn1-1mtn2-1 plants.
Again, several factors may have contributed to this outcome. The sac51d mutation is in the
Landsberg erecta background while the MTN mutants are the Columbia ecotype. It is possible
that the differences in their genotypes affect the efficiency of sac51d suppression. A possible
factor is that Tspm is not the only basis of the mtn1-1mtn2-1 mutant phenotypes, which means
that even if the sac51d suppressed the Tspm defects, the plant would not restore the WT
phenotypes. The effect of the constitutive over-expression of SAC51 on the restoration of
mtn1-1mtn2-1 morphology to the WT is currently under investigation.
3.5.4 Possible reduction in ethylene biosynthesis resulting from MTN deficiency
Both mtn1-1mtn2-1 and ami5.3 plants have low MTN activity (< 16 %) and delayed leaf
senescence. These observations suggest that this phenotype may correlate with MTN
deficiency. These mutants/silenced lines may possess low ethylene levels similar to those in
octuple ACS mutants (Tsuchisaka et al., 2009). However, many other factors, including other
phytohormones, interact in a complex manner to determine the onset of senescence (He et al.,
2001; van der Graaff et al., 2006). This could also be a result of delay on seed production. At
this point, the exact nature of the cause of senescence in the mtn1-1mtn2-1 is not known.
3.5.5 Delayed emergence of inflorescence stems in MTN-deficient plants
The degree of delay in the emergence of inflorescence stems in the MTN-deficient lines
correlates with their increased number of leaves. In addition, an increased number of
primary/secondary branches, flowers, and buds (data not shown) were evident in mtn1-1mtn2-
1 mutants. These changes in lateral organ arrangement are known to correspond closely to the
internal architecture of the vascular system (Dengler, 2006). The main vascular bundles and

130
their divergence to leaf traces therefore determine the number of vascular bundles in a stem.
Based on this logic, the increased number of vascular bundles in the stems of the MTN-deficient
mutants develops as a result of the increased number of leaves.
The plant hormones auxin and brassinosteroids (BR) are essential for the initiation of vascular
tissues and for their differentiation (Fukuda, 1997; Berleth et al., 2001). Mutation in the auxin
transport efflux carrier PIN1 or the chemical inhibition of the auxin transport with
naphthylphthalamic acid (NPA; Mattsson et al., 1999) leads to increased xylem differentiation.
Interestingly, as with mtn1-1mtn2-1, plants treated with NPA also have an increased number of
vascular bundles. According to Ibañasa et al. (2009) the directed auxin maxima of the polar
auxin transport determines the space between the vascular bundles whereas BR promotes
early procambial division in order to control the number of vascular bundles. An increased
number of vascular bundles in the stems is therefore a combined effect of altered auxin
maxima and increased BR signalling. It has already been reported that mtn1-1mtn2-1 mutant
stems show altered auxin maxima (Chapter 2), but changes in responses to BR have yet to be
examined in this mutant.
From another perspective, the enlarged meristem of the mtn1-1mtn2-1 mutant may have given
rise to its larger number of vascular bundles and thicker stems as compared to the WT. Since a
balance between cell division and cell differentiation is essential for determining the size of the
meristem, any change in the auxin- and cytokinin-mediated communication between
CLAVATA3 and WUS would contribute to changes in the MTN-deficient mutants (Sui et al.,
2011). Ultimately the PIN protein-directed increase in the number of auxin maxima may initiate
increased number of leaf primordia giving rise to an increased number of leaves (Dengler 2006).
This increased production of leaves may delay the transition of the shoot apical meristem to the
inflorescence apical meristem, thus causing a delay in the emergence of the inflorescence stem.

131
3.5.6 Correlation of the MTN activity and the metabolite levels of the MTN-
deficient lines with their phenotypes
Detailed analysis of the phenotypes selected that could be traced back to pathways affected by
MTA content enabled the determination of the primary developmental defects caused by MTN
deficiency. MTN activity and the severity of the traits correlated well across the MTN-deficient
mutants.
The MTA content correlated inversely with residual MTN activity. The levels of accumulated
MTA were lowest in the leaves of mtn1-1mtn2-5 which had a 28 % level of MTN activity,
whereas the highest were in mtn1-1mtn2-1, which had a with 14.9 % level of MTN activity
(Figure 3.11A). In ami5.3 the MTA levels were intermediate, as was the MTN activity. In the
leaves, increased MTA levels were associated with decreased MTN activity. The vegetative trait
interveinal chlorosis was evident only in the mtn1-1mtn2-1 mutant whereas increased xylem
proliferation and an increased number of vascular bundles per unit area were evident in mtn1-
1mtn2-5, ami5.3 and mtn1-1mtn2-1. Surprisingly, the delayed emergence of the inflorescence
stem was exhibited by all of the MTN-deficient lines, including mtn1-4mtn2-1. This delayed
emergence corresponds to the level of MTN activity.
Since interveinal chlorosis is a result of NA deficiency (Takahashi et al., 2003), it was expected
that NA levels would be low only in the mtn1-1mtn2-1, which displays this phenotype.
However, low NA levels were observed in both mtn1-1mtn2-5 and ami5.3 in addition to the
expected mtn1-1mtn2-1. mtn1-1mtn2-5 had slight but significantly higher

132
Figure 3.13: Schematic summary that illustrates the primary developmental defects of the
MTN-deficient mutant

133
NA levels, which could be adequate for these mutants not to show the interveinal chlorosis
phenotype. However the increased NA levels in the ami5.3 could only be due to insufficient or
variable production of amiMTN2s to silence the MTN2 gene product in the leaves at two weeks
after bolting. Increased MTA content was detected only in the mtn1-1mtn2-1 inflorescences,
whereas the MTA levels in mtn1-1mtn2-5 and ami5.3 were not significantly different from
those in the WT (Figure 3.11B). Consistent with this accumulation pattern, the altered
reproductive abnormalities, in embryo development and in seed development were observed
only in mtn1-1mtn2-1. Moreover, NA levels in the inflorescences were also significantly
decreased only in the mtn1-1mtn2-1, which is sterile with no seed development: an NA-related
phenotype (Takahashi et al., 2003; Klatte et al., 2009).
Taken together, these findings lead to the conclusion that NA synthase activity is sufficiently
inhibited when the MTN activity is ~14% of that in the WT. The following summary is proposed
as a means of incorporating these observations and those reported in the literature (Figure
3.12): when plants have ~ 28 % of the WT MTN activity, they have increased xylem proliferation
defects related to Tspm deficiency as well as delayed emergence of the inflorescence stem
related to possible auxin defects. When the MTN activity is reduced further to ~16 %, delayed
senescence related to ethylene inhibition becomes apparent in these plants. At ~14 % of MTN
activity, these plants have interveinal chlorosis and the inability to produce seeds, which are
NA-deficient phenotypes. When the MTN levels are very low probably closer to 0 % embryo
lethality resulting from low Spd occurs. Experiments are currently underway to measure Spd
and Tspm levels of these MTN-deficient lines in order to confirm this proposed model. Although
MTA and NA data were consistent among the five replicates, another independent metabolite
analysis will also be conducted in order to confirm these results.

134
3.6 Conclusion
Xylem proliferation defects and delayed bolting are the primary key defects (symptoms) caused
by of MTN deficiency. However, it is possible that the auxin defects that cause a delay in bolting
in all MTN-deficient lines, including mtn1-4mtn2-1, underlie all of these traits.
3.7 Technical assistance by others
Ishari Waduwara-Jayabahu designed and conducted the pilot experiments and executed all of
the experiments described in this chapter, with the technical assistance of Natasha Peer,
Zachary T. Hull, Andy Kong, Yong Li, Olga Kazberova, and Roba Bdeir. Natasha Peer helped
monitor the growth metrics in the mutant lines and performed some of the PCR segregation
analysis; Zachary T. Hull conducted the MTN assays. Andy Kong created ami MTN transformants
in the mtn1-1 background with Yong Li’s technical guidance, and Roba Bdeir analyzed T2 MTN
lines to identify ami2.8 and ami5.3. Olga Kazberova carried out the earlier attempts to create
amiMTN lines. Sarah Schoor conducted some of the SEM analysis. Markus Wirtz (University of
Heidelberg, Germany) measured the MTA and NA content of plants grown at the University of
Waterloo.

135
3.8 Supplemental material
Figure S3.1: Gel images confirming the genotypes of the MTN-deficient mutants
Flanking and left border reactions for mtn1-4 mtn2-1, mtn1-1mtn2-1, and mtn1-1mtn2-5.
Homozygous plants were identified when the left border reaction (gene -specific reverse
and T-DNA border primer) gave bands along with no bands with flanking reactions (gene -
specific reverse and forward).

136
Figure S3.2 Root characteristics of MTN-deficient mutants.
(A) Time taken for radicle emergence in MTN-deficient lines (N = 9).
(B) Root lengths of mtn1-1mtn2-1 compared to those of the WT. (N = 10; Error bars
indicate ±SD)

137
Figure S3.3: Number of days after germination for MTN-deficient seedlings to open their
cotyledons. (N = 8).

138
Figure S3.4: Cuticle defects and number of leaves in mtn1-1mtn2-1 compared to those in the WT.
(A-C)Cuticle defects of seedlings observed based on staining with TBO. (A) WT appeared
unstained while (B) mtn1-1mtn2-1 and (C) fiddlehead appeared patchy-stained in
the first true leaves. Scale bars = 2.5mm.
(D-E) Number of leaves in (D) WT compared to those in (E) mtn1-1mtn2-1 the 28 days
after sowing. The leaves were separated into three categories based on the
appearance of the margins and presence of trichomes: (1) juvenile vegetative -phase
rosette leaves, (2) adult vegetative-phase rosette leaves, and (3) adult reproductive -
phase rosette leaves.

139
Figure S3.5: Organs of mtn1-1mtn2-1 mutants that were twisted.
(B, D, F, H, J, L) The twisted organs of mtn1-1mtn2-1 mutants compared to regular organs of
the (A, C, E, G, I, K) WT: (A, B) twisted petals; (C, D) anther filaments; (E, F) carpe ls; (G,
H) leaves; (I, J) trichomes; and (K, L) stems. Most of these mtn1-1mtn2-1 organs are
twisted in left- and right- handed directions, as shown in the young (M) anther filament.
Scale bars: A, B = 0.3mm; C, D = 0.12mm; E, F = 0.19mm; G, H= 1mm; I, J= 60µm; K, L=
100µm; M=60µm. DIJM image courtesy of Sarah Schoor .

140
Figure S3.6: Twisted stem and cross-sections along the stem showing the altered vascular arrangement.
Consecutive free-hand sections (A-F) obtained at 0.5 cm intervals along a prominently
twisted mtn1-1mtn2-1 stem segment. The orientation of the stem sections was
maintained by marking a nick along one side of the segment (red line). Inset shows the
aligned sections with altered vascular bundle arrangement along the twisted are a.

141
Figure S3.7: Phenotype of mtn1-1mtn2-1sac51d triple mutant compared to that of mtn1-1mtn2-1 four weeks after bolting.
The triple mutant exhibited traits similar to those of mtn1-1mtn2-1, with sterile flowers and bushy shoot
architecture.
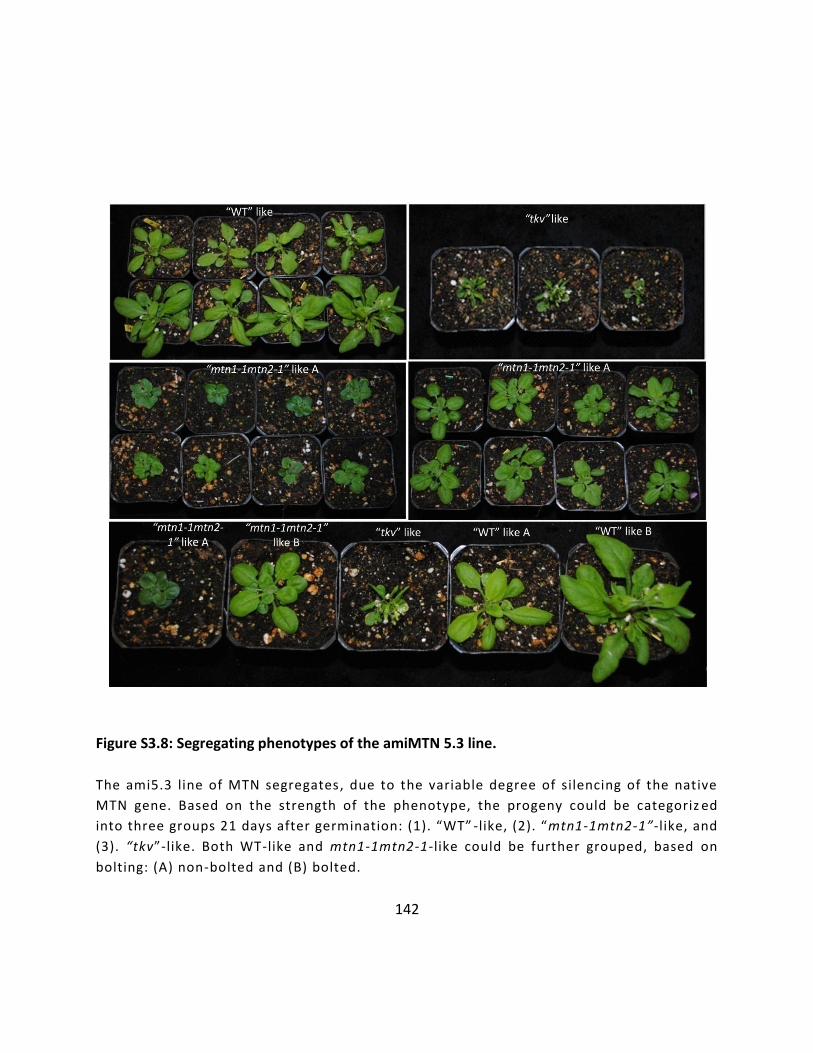
142
Figure S3.8: Segregating phenotypes of the amiMTN 5.3 line.
The ami5.3 line of MTN segregates, due to the variable degree of silencing of the native
MTN gene. Based on the strength of the phenotype, the progeny could be categoriz ed
into three groups 21 days after germination: (1). “WT” -like, (2). “mtn1-1mtn2-1”-like, and
(3). “tkv”-like. Both WT-like and mtn1-1mtn2-1-like could be further grouped, based on
bolting: (A) non-bolted and (B) bolted.

143
Table S3.1: Description of MTN-deficient single mutants.
Gene Gene ID Alleles Description
MTN1 At4g38800 mtn1-1 T-DNA insert in an third intron; SALK_085385
mtn1-2 T –DNA insert in an sixth exon; GK_568C06.18
mtn1-4 T-DNA insert in an exon; SALK_088214C
MTN2 At4g34840 mtn2-1 T-DNA insert in an fourth exon; SALK_ 071127
mtn2-2 T-DNA insert in an fourth exon; GK_845B05
mtn2-5 T-DNA insert in the promoter; SALK_022510
Table S3.2: Primer sequences.
Primer
name
Sequence Description
mtn1-1-F Forward primer for mtn1-1; SALK_085385 TGACGGAGACCAACTCCATAC
mtn1-1-R Reverse primer for mtn1-1; SALK_085385 GAGGCTCTTCCTTTGGTCAAC
mtn1-2-F Forward primer for mtn1-2 GAATCGGAAGAGAGGGATAAG
mtn1-2-R Reverse primer for mtn1-2 CTTCTGTTCTCTTCCTTTTTTAT
mtn1-4-F Forward Primer for mtn1-4 ;SALK_088214C TGG GGA GTA TAA TGT TGC AGC
mtn1-4-R Reverse Primer for mtn1-4 ;SALK_088214C GCA TTG AGT GCA AAG CTT ACC
mtn2-1-F Forward primer for mtn2-1; SALK_071127 CCTTGCTTACGTGGCATAAAC
mtn2-1-R Reverse primer for mtn2-1; SALK_071127 GGAAAGGGCAAAAATATATGG
mtn2-2-F Forward primer for mtn2-2 CAACAGATTACGCCTCGTTG
mtn2-2-R Reverse primer for mtn2-2 CCATGACAGAAGAATACCTGT
mtn2-5-F Forward Primer for mtn2-5; SALK_022510 ACT GTG CCA ACA CTC TCA ACC
mtn2-5-R Reverse Primer for mtn2-5; SALK_022510 AAG ATT TCC GCT TCC TGA AAG
LbB1.3 Left-border for SALK lines ATTTTGCCGATTTCGGAAC
GABI LB GABI Left Boarder ATTGACCATCATACTCATTGC
miMTN2-I amiRNA targeting MTN2 GATTTTATTAGAATCGTAGGCGCTCTCTCTTTTGTATTCC
miMTN2-II amiRNA targeting MTN2 GAGCGCCTACGATTCTAATAAAATCAAAGAGAATCAATGA
miMTN2-III amiRNA targeting MTN2 GAGCACCTACGATTCAAATAAATTCACAGGTCGTGATATG
miMTN2-IV amiRNA targeting MTN2 GAATTTATTTGAATCGTAGGTGCTCTACATATATATTCCT

144
Table S3.3: Primer combinations used to identify MTN-deficient alleles.
Gene Genotype Primer combination Band size
MTN1 MTN1-1 mtn1-1F/R 947bp
mtn1-1 mtn1-1R/ LbB1.3 495bp
MTN1-2 mtn1-2F/R 1630bp
mtn1-2 mtn1-2F/ GABI LB 1300bp
MTN1-4 mtn1-4F/R 1000bp
mtn1-4 mtn1-4R/ LbB1.3 300bp
MTN2 MTN2-1 mtn2-1F/R 950bp
mtn2-1 mtn2-1R/ LbB1.3 528bp
MTN2-2 mtn2-2F/R 1459bp
mtn2-2 mtn2-2F/ GABI LB 593bp
MTN2-5 mtn2-5F/R 1100bp
Mtn2-5 mtn2-5R/ LbB1.3 600bp

145
Table S3.4: Number of aborted seeds and unfertilized ovules in stage 17b siliques.
(N = 8-12 siliques of three different plants were observed ).
Normal seeds Aborted seeds Unfertilized
ovules
N
MTN1-4mtn1-4/mtn2-1mtn2-1 1436 0 0 26
MTN1-1mtn1-1/mtn2-5mtn2-5 1231 0 0 25
MTN1-1mtn1-1/mtn2-1mtn2-1 1639 1 138 34
Table S3.5: Variation in the number of vascular bundles and the cross-sectional area of the stem sections in MTN-deficient lines.
WT mtn1-4
mtn2-1
ami2.8 mtn1-1
mtn2-5
ami5.3 mtn1-1
mtn2-1
Number of vascular
bundles in a sem
section
7±1 7±1 9±3 8±2 8±0.5 12±2
Total area of the
stem section (cm2)
7±1 5±1 6±1 10±2 8±1 10±1
Number of bundles
/ area
1.1±0.3 1.3±0.3 1.5±0.3 0.89±.03 1.07±0.2 1.12±0.2
N 4 4 4 4 3 4

146
Chapter 4: Spermidine-Dependent Fertility Recovery of mtn1-1mtn2-1
4.1 Overview
The accumulation of the Yang cycle metabolite MTA in mtn1-1mtn2-1 mutants leads to
pleiotropic phenotypes including no seed production. This reproductive defect was partially
restored by supplying the seedlings with Spermidine (Spd) for 14 days. This partial recovery
included the formation of a few siliques that contained viable seeds. The measurement of Met-
related metabolites and morphological observations of the flower organs, particularly the
female gynoecia, the profiling of hormones, and transcripts of 14-day-old seedlings, were used
to investigate the possible effects of Spd treatment on mtn1-1mtn2-1 mutants. Several findings
were indicative of the involvement of auxin in Spd treatment: Spd-treated seedlings recovered
WT IAA levels, transcript levels of the auxin efflux carrier protein gene and of the
endomembrane system-related genes were increased, and DR5rev::GFP expression was
recovered in the restored siliques. In addition, the arrangement of the vascular bundles in the
restored branches was normal. This vascular recovery could also be due to proper auxin
distribution, which could ultimately lead to the recovery of fertility. The increased abundance of
S-adenosyl-L-methionine decarboxylase and copper-amine oxidase transcripts indicate
additional factors that may contribute to vascular recovery. A model incorporating these
observations is presented for the Spd-mediated recovery of seed production in mtn1-1mtn2-1.
This model proposes that the seed production in mtn1-1mtn2-1 could be either a direct effect
of proper auxin distribution or an indirect effect of proper xylem differentiation.

147
4.2 Introduction
The Yang cycle regenerates methionine (Met) from 5’-methylthioadenosine (MTA) via series of
reactions, the first of which hydrolyzes MTA to methylthioribose (MTR) and adenine (Figure
4.1). The key enzyme involved in this hydrolysis is methylthioadenosine nucleosidase (MTN).
Based on the data presented in Chapter 2, MTN-deficiency in plants leads to the accumulation
of its substrate MTA, which in turn, inhibits the synthesis of polyamine (PA) and nicotianamine
(NA). PA and NA biosynthesis are two of the predominant pathways that utilize S-adenosyl-L-
methionine (SAM) to generate MTA as a by-product in plants.
Xylem development, and PA and metal homeostasis are among the many critical factors that
affect reproduction in plants. Current research related to PAs shows that spermidine (Spd) an
essential factor in plant embryogenesis (Urano et al., 2005; Imai et al., 2004b; Ge et al., 2006).
Although the basis of this requirement has not been determined, it is known that Spd modifies
the eukaryotic translation initiation factor 5A (inactive eIF5A) post-translationally to form the
unique amino acid hypusine (active eIF5A; Park, 2006). This activation occurs via two enzymatic
steps involving deoxyhypusine synthase (DHS, EC2.5.1.46) and deoxyhypusine hydroxylase
(DHH, EC 1.14.99.29; Figure 4.1). Hypusine biosynthesis has been correlated with critical
functions during plant development (Feng et al., 2007) and during female gametophyte
development (Pagnussat et al., 2005). As a metal chelator, NA is also involved because it
facilitates the long-distance transport of ions needed for the proper formation of pollen and
seeds (Bohme and Scholz, 1960; Takahashi et al., 2003; Klatte et al., 2009).
Normal vascular development is crucial for plants because it transports essential components,
including ions and phytohormones (Krizek et al., 2011). Of the many factors that affect vascular
development, the PA thermospermine (Tspm) is particularly crucial because it prevents
premature xylem maturation (Hanazawa et al., 1997; Imai et al 2004a,b;

148
Figure 4.1: Polyamine biosynthesis, catabolism, and links to the Yang cycle and eIF5A
Black lines indicate the Yang cycle and PA biosynthesis, blue lines indicate PA catabolism
and back conversion, and orange lines indicate the in volvement of Spd in the
hypusination of eIF5A.
MTA
Put
Spd
Spm/Tspm
Spd synthase
Spm/Tspm synthase
PA oxidase
PA oxidase
PA oxidase
CuAoxidase
4-aminobutanal
N-(3-aminopropyl)4-aminobutanol
H2O2
H2O2
H2O2
SAM
NA
MTR
Met
Ethylene
dcSAM
SAM decarboxylase
ACC synthase
NA synthase
eIF5A (inactive)
eIF5A Intermediate
eIF5A (active)
Deoxyhypusine synthase
Deoxyhypusine hydroxylase
MTA nucleosidase
149
Kakehi et al., 2008; Muñiz et al., 2008). Reproductive and vascular-related defects are also
associated with the catabolism of PAs. PA catabolism includes the oxidation of Spermine (Spm)
and/or Tspm to N- (3-aminopropyl) 4-aminobutanol and Putrescine (Put) and/or Spd to 4-
aminobutanol (Figure 4.1; Baron and Stasolla, 2008). Polyamine oxidases (PAO; EC 1.5.3.11) are
responsible for the catalysis of Spd, Spm, and Tspm and for the back conversion of Spm/Tspm
to Spd, while copper-containing amine oxidases (CuAO; EC 1.4.3.6) mediate the catabolism of
Put. All of these reactions generate hydrogen peroxide (H2O2), which acts as a signaling
molecule to enhance xylem differentiation (Tisi et al., 2011). H2O2 also induces an influx of Ca+2
into the pollen tube cytosol as a means of regulating reproduction by reducing the growth of
the pollen tubes (Wu et al., 2010). Phytohormones also play a central role in synchronizing and
implementing processes that are essential for successful seed production in plants.
Auxin, which is produced by all cells at all stages of flower development (Aloni et al., 2006), acts
as the master regulator of reproductive success by providing positional cues for apical-basal
patterning, floral identity and organogenesis, organ vascularization, gamete development, and
the timing of fertilization (Mattsson et al., 1999; Krizek et al., 2011). The mtn1-1mtn2-1 mutants
are sterile and do not produce seeds. Inpart this is due to decreased fertilization efficiency
associated with developmental defects in both ovules and pollen. Ovules arrest with non-
extended integuments; pollen development, on the other hand, is variably delayed. Taken
together with this mutant’s indehiscent anthers and poor pollen tube growth, it is evident that
several factors contribute to its infertility ( Chapter 2). Amazingly, seedlings provided with
exogenous Spd during their early vegetative phase (first 14 days after germination) produced a
small number of seeds during the later stages of reproductive phase (56 days after
germination). These seeds arise in randomly on different branches ( Chapter 2).
150
In this chapter, the mechanistic basis of this exogenous Spd-dependent fertility recovery in
mtn1-1mtn2-1 plants is explored. Hormones, transcripts, and metabolites of mtn1-1mtn2-1 and
WT seedlings grown on ½ MS and ½ MS that had been supplemented with Spd were profiled.
The combined analyses point to auxin distribution and vascular development as the key
mediators of the Spd-mediated recovery of seed production in mtn1-1mtn2-1.
4.3 Methods
4.3.1 Plant material and growth conditions
Arabidopsis thaliana WT (Col) and MTN1mtn1-1/mtn2-1mtn2-1 progeny seeds were placed on
½ MS or ½ MS media that had been supplemented with 100 μM Spd (Sigma). After the plates
were incubated for 48 h at 4oC in the dark, they were transferred to continuous light at 22oC for
14 days. A set of these seedlings were then transplanted to peat soil (KUREHA, Tokyo, Japan)
for harvesting of aerial organ tissues. Another set of seedlings were transplanted to a
hydroponic system (Pierre et al., 2003) for the harvesting of root tissue. Both sets of seedlings,
the soil transplants and the hydroponic transplants, were grown under 16 h of light at 22:C
with 150 μ mol m –2 s –1 of photosynthetically active radiation.
Samples were collected simultaneously for hormone, microarray, and metabolite analyses; all
samples were collected at the same time of the day. Flower stages were collected in
accordance with Smyth et al. (1990). Aerial organs and roots were harvested two weeks after
bolting (i.e., five-week-old WT and seven-week-old mtn1-1mtn2-1).

151
4.3.2 Microscopic analysis
4.3.2.1 Light microscopy
Stage 14 flowers, as described by Smyth et al. (1990), were cleared (glacial acetic acid: ethanol)
for 2 h, after which the pistils and ovules were observed. Stage 15 siliques of mtn1-1mtn2-1,
restored siliques of the mtn1-1mtn2-1 that had been supplied with 100 µM Spd, and WT stage
17 siliques were manually opened, and all the seeds/ovules were scraped into a drop of Hoyer’s
clearing solution (50 g of chloral hydrate, 2.5 mL of glycerol, 3.75 g of Gum Arabic and 15 mL of
water) for embryo observation. The pistils were observed with bright light optics while the
ovules and embryos were observed with Differential Interference Contrast (DIC) optics of a
Zeiss Axiovert 200M Microscope (Carl Zeiss Inc, Toronto, Canada).
Histochemical staining for H2O2 with 3-3’ diaminobenzine (DAB) of the Arabidopsis seedlings
that were 14 days old, taken from ½ MS, ½ MS supplemented with 100 µM Spd or from ½ MS
supplemented with 50 µM 3-amino-1,2,4-triazole (AT; oxidative stress inductive media; May
and Leaver, 1993) were vacuum infiltrated for 20 min with a 3,3’-diaminobenzidine (DAB)
solution (Sigma, 1mg/ml, pH 3.8) and then incubated at room temperature for 6 h (Nakagami et
al., 2006). The seedlings were cleared for 4 h in glacial acetic acid: ethanol (3:1). When DAB
polymerizes with H2O2, a visible brown stain is produced (Nakagami et al., 2006).
4.3.2.2 Scanning electron microscopy and laser scanning confocal microscopy
Stage 14 flowers from the WT and mtn1-1mtn2-1 were placed in fixative, critical point dried,
mounted, sputter coated and visualized using a Hitachi S570 scanning electron microscope, as
described in Chapter 2. The expression patterns of DR5rev::GFP in the seeds and ovules of both
the WT and mtn1-1mtn2-1 were observed using a Carl Zeiss LSM 510 confocal microscope, as
detailed in Chapter 2.

152
4.3.3 Microarray analysis
Using an RNeasy Plant Mini Kit (Qiagen, Hilden, Germany), RNA was extracted from 14-day-old
WT and mtn1-1mtn2-1 seedlings grown on ½ MS and ½ MS supplemented with 100 μM Spd.
Each replicate contained 10 seedlings. Microarray analysis was performed using an ATH1 Gene
Chips Arabidopsis Genome array (Affymetrix, Santa Clare, USA) as detailed in Nakamichi et al.
(2009). Relative expression values and detection values (genes were tagged as “present, P”;
“marginal, M”; or “absent, A”) were generated for each transcript with the use of the MAS5.0
algorithm of the GeneChip Operating Software (GCOS, Affymetrix). The raw image of the chip
(.dat) was used to generate an Affymetrix CEL file. The generated CEL data files were used to
calculate a robust multi-chip average (RMA) in order to normalize and estimate the intensity of
the signal (Irizarry et al., 2003)
To identify genes the expression of which had changed significantly with the treatment, the CEL
files were evaluated using the RMA. False discovery rate (FDR)-controlled q-values < 0.01 were
defined as in (QVALUE; http//genomine.org/qvalue/). Gene Ontology (GO) analysis was
performed using Chip Enrich software (Orlando et al., 2009), available at
http://www.arexdb.org/software.jsp. This analysis was performed by Dr. Nori Nakamichi,
RIKEN, Japan.
4.3.4 Hormone analysis
For the hormone analysis, 14-day-old seedlings and the aerial organs, and roots of mature
plants were collected from the WT and mtn1-1mtn2-1 that had been germinated either on ½
MS or on ½ MS supplemented with Spd. Seven organs were collected from mature plants:
unopened buds, stage 14 flowers, stage 15 siliques, stage 17b siliques, rosette leaves, stems,
and roots. A leaf developmentally similar to the WT 6th rosette leaf was harvested from the
mutant. With respect to the stems, 2 cm stem segments were harvested between the first and

153
third nodes of the primary shoot. These tissues were subjected to hormone extraction,
detection, and analysis, as described in Kojima et al. (2009). This analysis was performed by
Mikiko Kojima, RIKEN, Japan.
4.3.5 Metabolite analysis
Using UPLC-TQD (Waters) as previously described in Sawada et al. (2009), Met-related
metabolites were determined. For this metabolite analysis, 50 mg - 100 mg of stage 14 flowers
from both the WT and mtn1-1mtn2-1 plants that were grown on ½ MS and from the plants that
were grown on ½ MS supplemented with Spd were collected. This analysis was performed by
Yuji Sawada, RIKEN, Japan.

154
4.4 Results
4.4.1 Defective reproductive development of MTN-deficient plants
4.4.1.1 Abnormal floral organogenesis
To determine the initial cause of sterility in MTN-deficient plants, reproductive organ initiation
and development were observed in detail. An obvious defect in the inflorescences was their
altered phyllotaxy (irregular pedicel arrangement, (Figure 4.2A, B). Compared to the WT, the
mutant inflorescences showed an increased number of buds that had opened and that had
exposed immature reproductive organs (as shown by a comparison Figure 4.2C, D). The flowers
were also deformed in mtn1-1mtn2-1. In contrast to the WT flowers, which have a
symmetrically arranged pattern of four sepals, four petals, and six stamens (Figure 4.2G), the
mutant flowers variously had (1) an inconsistent number of petals (Figure 4.2H) and anthers; (2)
asymmetrically arranged long narrow petals (Figure 4.2E) and anthers; (3) wide stigmas (Figure
4.2F and H); and (4) fused flowers with fasciated pedicels (Figure 4.2F).
4.4.1.2 Underdeveloped ovules
As reported in Chapter 2, mtn1-1mtn2-1 plants did not produce seeds as a result of their
reduced fertilization efficiency. One of the reasons for this reduced fertility is that ovule
development arrests prematurely. To determine the mechanism or timing of this arrest, the
pistils of the WT and mtn1-1mtn2-1 plants were cleared and observed with DIC optics. The
developmental stages of these embryos were designated according to Schneitz et al. (1995).
During megasporogenesis (stage 2), the mother cell undergoes meiosis, and two distinct layers
of integument form to surround the dividing nucellus. When stage 2-III ovules were examined
in the WT (Figure 4.3A, C) and mtn1-1mtn2-1 (Figure 4.3D), the initiation of the inner and outer
integument was evident in both genotypes. Stage 2-V ovules also displayed development that
was similar in the WT (Figure 4.3B) and mtn1-1mtn2-1 (Figure 4.3E), with the formation of the

155
tetrad nuclei and extension of both integuments towards the apex of the nucellus. Upon
megagametogenesis (stage 3), however, ovule development in mtn1-1mtn2-1 was noticeably
abnormal. In WT stage 3-II, the tetrad was replaced with a binuclear embryo sac with the outer
integument nearly surrounding the nucellus (Figure 4.3C). Despite the double mutant having
two nuclei, the outer and inner integuments did not extend past the point where they were at
stage 2-V (Figure 4.3F). Thus based on these results, the ovule development of the mtn1-
1mtn2-1 mutants is arrested at stage 2-V (Schneitz et al., 1995).
4.4.1.3 Disrupted gynoecia vasculature
According to Schneitz et al. (1995), the major developmental event preceding the extension of
integuments at ovule stage 2-V is the appearance of the lateral vasculature. To determine
whether vascular development differed in the mtn1-1mtn2-1 female gynoecia, cleared stage 14
flower pistils were compared to those of the WT. The WT carpels contained four veins (Figure
4.3G): two medial and two lateral, consistent with the description provided by Nemhauser et al.
(2000). Moreover, at the boundary of the style and ovary, lateral veins terminated and the
medial veins bifurcated to heavily vascularize the stylar region. In contrast, mtn1-1mtn2-1
gynoecia were much more vascularized, with at least six thick veins that could not be clearly
distinguished as either medial or lateral (Figure 4.3H). However, this distinction was visible only
near the base of these gynoecia where the medial veins contained multiple bifurcations. The
increased vascularization of the mutant gynoecia suggested that the auxin gradient required for
proper gynoecia pattern formation is disrupted in mtn1-1mtn2-1. The pistils were therefore
observed by SEM to further document morphological variations in the gynoecia pattern. The
WT gynoecia contained regional boundaries that clearly demarcated the stigma, style, ovary,
replum, and stipe while most of these boundaries were altered in the mtn1-1mtn2-1 gynoecia.
The stigma,

156
Figure 4.2: Floral organ defects in the mtn1-1mtn2-1
(A, B) Altered phyllotaxy and fasciation of the MTN-deficient inflorescences. In
comparison with (A) the WT spiral inflorescence phyllotaxy, (B) the phyllotaxy of
mtn1-1mtn2-1 mutants is irregular with multiple insertions of floral pedicels (as
indicated by the arrow).
(C, D) Sepals of (C) WT buds were closed to protect the immature reproductive organs
whereas (D) the mtn1-1mtn2-1 reproductive organs were exposed with wide-open
sepals.
(E-H) Stage 14 flowers: (G) WT flowers displayed four petals and six fully extended
stamens in a symmetrical pattern. In (H) mtn1-1mtn2-1 mutants, a variety of single
flower phenotypes were observed, including variable numbers of petals, (E) an
asymmetrical organization of long narrow petals, and (F) fused flowers with
fasciated pedicels.

157
replum, and stipe could be identified in the mtn1-1mtn2-1, but these tissues were much wider
than in the WT. Furthermore, the style and valve of the mtn1-1mtn2-1 were indistinguishable.
Closer observation revealed that this area consisted of square-shaped cells that are usually seen
only in WT valves (Nemhauser et al., 2000). Since auxin gradients play a role in patterning and
forming regional boundaries in gynoecia (Nemhauser et al., 2000), these results suggest that
the auxin distribution within mtn1-1mtn2-1 may be altered, disrupting the gynoecia pattern,
regional boundaries, and vascular supply and possibly causing the early arrest of ovule
development. As discussed in Chapter 2, male gametophytic defects also contribute to the
reduced fertilization efficiency of mtn1-1mtn2-1. However, mtn1-1mtn2-1 partially recovered
seed production when seeds were grown on media supplemented with 100 µM Spd for 14 days
(Chapter 2).
4.4.2 Reduced MTA levels in flowers restored by exogenous Spd
To explore the Spd-dependent partial recovery of seed production in the mtn1-1mtn2-1, Met-
related metabolites were measured in the mutants grown with and without Spd
supplementation. When the mutants were grown on either medium, their adenine, adenosine,
and Met levels were not significantly different from those of the WT, indicating that the
homeostasis of these metabolites was unaffected by MTN deficiency or exogenous Spd
treatment. However, as reported in Chapter 2, the MTA content was higher in the mutant than
in the WT (Figure 4.4). MTA levels were significantly decreased by Spd treatment both in the
WT and in the mutant (P < 0.05). These results suggest that exogenous Spd feeding reduced the
MTA through an MTN-independent mechanism. Interestingly, the SAM content was also
statistically significantly decreased in the Spd-supplemented mutants but not in the WT (Figure
4.4).

158
Figure 4.3: mtn1-1mtn2-1 ovule development and pistil morphology compared to those of the WT.
(A-F)Using DIC optics: (A-C) WT and (D-F) mtn1-1mtn2-1 ovules have similar development
during (A, D) stages 2-III and (B, E) 2-V. However, when (C, F) stage 3-II is reached,
it is clear that the outer (oi) and inner integuments (ii) of mtn1-1mtn2-1 do not
extend over the nucellus (n). Scale bars = 25 µm.
(G, H) Bright field images of cleared pistils from stage 14 flowers of (H) mtn1-1mtn2-1
compared to those from (G) the WT, showing medial veins ( m), lateral veins (l), and
stylar xylem (stx). The bifurcations of the medial veins are indicated by arrows.
Scale bars = 0.9 mm.
(I, J) SEM images showing the gynoecia pattern of (J) mtn1-1mtn2-1 compared to that of (I) the
WT. In the WT, the stigma (sg), style (st), valve (v), and replum (r) are clearly
distinguishable in contrast to the indistinguishable st and v of mtn1-1mtn2-1. Arrow head
indicated base of style. Scale bars = 0.6 mm.

159
4.4.3 Increased Cytokinin, Auxin, and Gibberellic Acid Content in mtn1-1mtn2-1
compared to those in the WT
Since hormones regulate both male and female gametophyte development and their efficient
fertilization (Cecchetti et al., 2004; Jaillais and Chory, 2010), the first step was to determine the
hormone profiles of the mtn1-1mtn2-1 mutants compared with those of the WT. The auxin
(IAA), cytokinin (CK), gibberellic acid (GA), abscisic acid (ABA), jasmonic acid (JA), and salicylic
acid (SA) contents were compared for four floral-development stages, as defined by Smyth et
al. (1990): unopened buds with stage 13 and smaller buds, stage 14 open flowers with long
anthers extending above the stigma, stage 16 with no petals and sepals attached, and stage 17b
extended green siliques (Figure 4.5A-D). Total CK, IAA, GA, ABA, and JA were higher in all four
mtn1-1mtn2-1 organs than in those of the WT, except for stage 16, which had lower JA (Figure
4.5C). SA was decreased in all mtn1-1mtn2-1 organs compared to those of the WT. However, of
all of these changes, statistically significant differences were observed only in the total CK, IAA,
and GA of the unopened buds (P< 0.05;Figure 4.5A) and stage 14 flowers (Figure 4.5B).It was
therefore reasoned that the sterility of the mtn1-1mtn2-1 mutants may be due in part to their
altered hormone content.
4.4.4 Spd-reduced IAA and CK levels in the mtn1-1mtn2-1
Since mtn1-1mtn2-1 produced a few seeds after germination on the media supplemented with
100 µM Spd for 14 days (Chapter 2), the next step was to profile the hormones in the 14-day-
old seedlings (Figure 4.6A, B). In these mtn1-1mtn2-1 seedlings, the overall abundance of all six
hormone classes was increased compared to the WT levels, but only the CK, ABA, and SA
contents were significantly different (Student’s t-test; P< 0.05; Figure 4.6A). The exogenous
feeding of Spd appeared to produce no significant differences

160
Met related metabolites
0.0001
0.001
0.01
0.1
1
10
WT / MS
mtn1-1mtn2-1 / MS
WT / MS + Spd
mtn1-1mtn2-1 / MS +Spd
Ade Ado MTA SAMMet
a
c
b
d
ef
a
Figure 4.4: Met cycle-related metabolites of stage 14 flowers.
Tissues were harvested from plants grown on ½ MS and ½ MS supplemented with Spd for
14 days. The adenine (Ade), adenosine (Ado ), methionine (Met), methylthioadenosine
(MTA), and S-adenosyl-L-methionine (SAM) contents of the mtn1-1mtn2-1 flowers
relative to those of the WT are shown on a logarithmic scale. Different letters indicate
statistical significant variations . Values are Mean ± SD. (N=3; P=< 0.05) (Data source: Yuji
Sawada)

161
in the content of any of the hormone classes compared to those of the WT, aside from the total
CK (Figure 4.6B). In the presence of Spd, CK levels were significantly decreased in the mutant.
These results suggested that the application of exogenous Spd resulted in the recovery of the
mtn1-1mtn2-1 altered hormone content (except total CK) to WT levels.
To determine whether the Spd effects detected in mtn1-1mtn2-1 after 14 days on Spd persisted
into the unopened buds and stage 14 flowers eight weeks later, the hormone content of these
organs was evaluated in comparison to that of same-stage tissues collected from mtn1-1mtn2-1
grown on ½ MS. In the unopened buds and stage 14 flowers of these ½ MS-grown plants, IAA
was found to be ~four-fold higher in mtn1-1mtn2-1 compared to the levels in the WT (Figure
4.7A; Figure S1; Figure S2). The IAA content of both of these organs harvested from exogenous
Spd-fed plants was reduced to WT levels. In contrast, WT IAA levels in unopened buds and
stage 14 flowers (Figure 4.7A) increased as a response to Spd. In all four stages, total CK levels
in mtn1-1mtn2-1 grown on media supplemented with Spd were reduced to the same level as
those in the WT grown on ½ MS (Figure 4.7B). The GA levels followed the same trend
irrespective of the genotype or growth medium, indicating that Spd did not affect GA levels
(Figure 4.7C). Taken together, these results make it clear that, compared to the WT levels, in
the mtn1-1mtn2-1 mutant, the IAA and CK levels were decreased by Spd.
4.4.5 Restoration of the normal endomembrane system transcript profile with
Spd treatment
To gain further insight into the effect of Spd on fertility in mtn1-1mtn2-1, a transcript profiling
experiment was conducted using the Affymetrix ATH-1 GeneChip. RNA for these arrays was
extracted from a subset of the seedlings grown simultaneously in the same growth conditions
as those used for hormone profiling: WT seeds grown on ½ MS media without Spd (MS –Spd),
WT seeds grown on ½ MS media with Spd (WT + Spd),

162
Figure 4.5: Hormone profiles of the floral organs .
Hormones were quantified in four floral organs harvested from both WT (black bars) and
mtn1-1mtn2-1 (gray bars) plants grown on ½ MS: (A) unopened buds, (B) stage 14
flowers, (C) stage 15 siliques, and (D) stage 17b. Different letters indicate the s ignificant
changes of hormone levels in mtn1-1mtn2-1 compared to WT (P< 0.05). Note: (1) data for
stage 15 siliques were a result of two representative replicates (C; N=2) while for all
others representatibe of three replicates (A, B, D; N=3), (2) the mtn1-1mtn2-1 grown on
½ MS were sterile and do not have stage 17b siliques (D). (Data source: Mikiko Kojima)

163
mtn1-1mtn2-1 seeds grown on ½ MS media without Spd (Mut-Spd) and mtn1-1mtn2-1 seeds
grown on ½ MS media with Spd (Mut+Spd). Three independent replicates were analyzed for
each genotype in order to unravel the possible transcriptional network underlying the Spd-
mediated responses in the mutant compared to those in the WT. The average number of
detectable “present” genes in the array experiment was between 15,600 and 16,200 out of
22,747 (Appendix 4C).
To identify genes whose expression is up- or down-regulated by an underlying MTN deficiency,
the array data for (WT-Spd) and for (Mut-Spd) were compared. The MTN mutation resulted in
the significantly increased expression of 141 genes (Appendix 4D), and the decreased
expression of 191 genes (Appendix 4E), based on the FDR criteria (q<0.01). To investigate the
biological processes of these genes, a significant enriched Gene Ontology (GO) analysis was
performed. The GO analysis revealed that categories of “response to cold” and “defense
response” were significantly enriched (Fisher’s test P< 10-4) in up-regulated genes in the mtn1-
1mtn2-1 compared to those in the WT (Table S4.1). On the other hand, the “endomembrane
system” “lipid binding” and “lipid metabolism” categories were significantly enriched in the
down-regulated genes in the mutant (P < 10-11, 10-7,10-5, respectively, Table S4.2). The next
investigation was conducted to examine whether the expression of representative genes in the
three categories were recovered by the Spd in the mutants. As shown in Table 4.1, most of
these genes were up-regulated by the Spd treatment, suggesting that the endomembrane
system and lipid-related biological processes are key targets of the Spd–dependent recovery of
fertility.

164
Figure 4.6: Hormone content of 14-day-old mtn1-1mtn2-1 compared to that of the WT.
Seedlings were grown on (A) ½ MS and (B) ½ MS supplemented with Spd. Different
letters indicates the statistical significant hormone changes in the two genotypes (N = 3,
P< 0.05). The purple colour indicates that the plants were fed exogenous Spd. (Data
source: Mikiko Kojima)
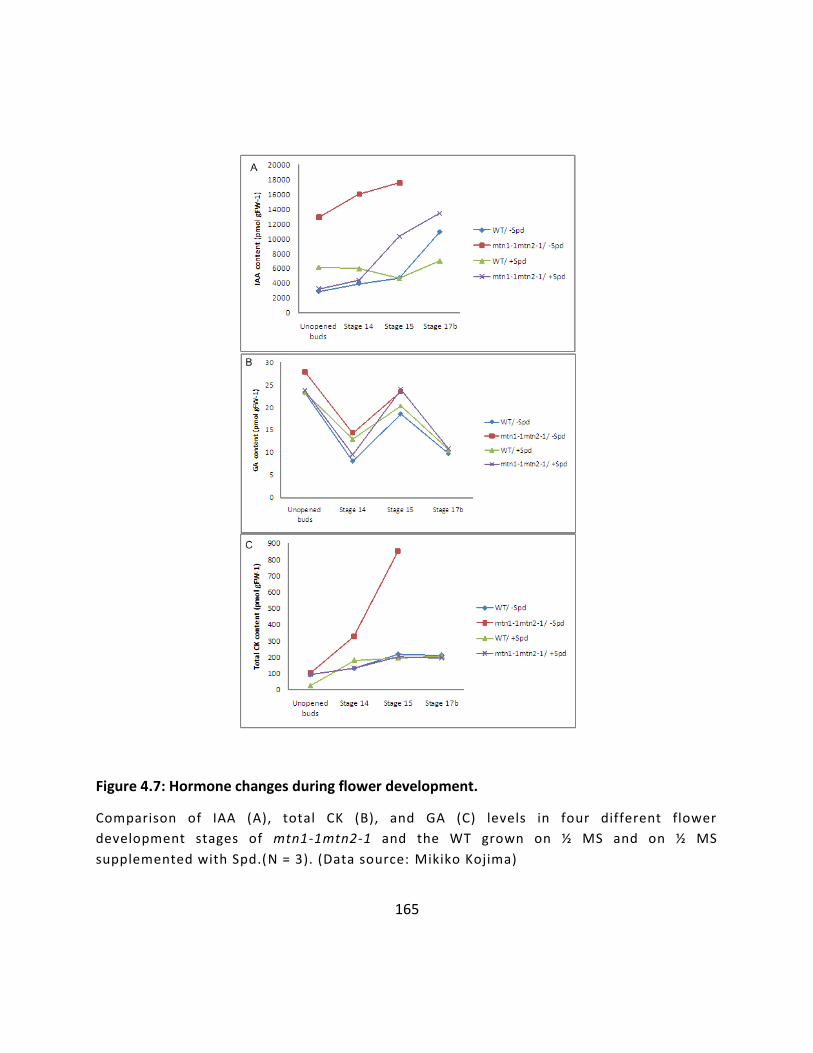
165
Figure 4.7: Hormone changes during flower development.
Comparison of IAA (A), total CK (B), and GA (C) levels in four different flower
development stages of mtn1-1mtn2-1 and the WT grown on ½ MS and on ½ MS
supplemented with Spd.(N = 3). (Data source: Mikiko Kojima)

166
Table 4.1: Up-regulated genes as a response to Spd in three GO categories
Colours are assigned based on the scale below.
magnitude of change 0 0.27 0.54 0.82 1.09 1.37 1.64 1.91 2.19 >2.46 greater than zero less than zero
AGI Description Fold change
Mut-Spd/ WT-Spd
Mut+ Spd/ WT + Spd
GO:0012505 Endomembrane system At1g06830 Glutaredoxin (thioltransferase) 0.6 1.8
At1g11850 Expressed protein 0.6 1.4 At1g12570 Glucose-methanol-choline (GMC) oxidoreductase 0.6 1.4 At1g13080 Cytochrome P450 monooxygenase 0.6 1.3 At1g18980 Germin-like protein 0.5 1.4 At1g23205 Pectin methylesterase inhibitor 0.5 1.3 At1g25450 Very-long-chain fatty acid condensing enzyme 0.5 1.6 At1g26560 Glycosyl hydrolase family 1 protein 0.5 1.8 At1g29660 GDSL-motif lipase/hydrolase 0.6 1.4 At1g30530 UDP-glucoronosyl/UDP-glucosyl transferase 0.5 1.3 At1g30700 FAD-binding domain-containing protein 0.5 1.5 At1g51840 protein kinase-related proteins 0.6 1.5 At1g63710 cytochrome P450 0.4 1.7 At1g65490 expressed protein 0.6 2 At1g68850 peroxidase 0.6 1.2 At1g75030 pathogenesis-related thaumatin-like protein 0.6 1.3 At2g03200 aspartyl protease 0.6 1.2 At2g16005 MD-2-related lipid recognition protein 0.4 1.9 At2g20870 cell wall protein precursor 0.5 1.5 At2g21100 disease resistance-responsive protein-related 0.6 1.3 At2g22510 hydroxyproline-rich glycoprotein family protein 0.6 1.2 At2g23540 GDSL-motif lipase/hydrolase 0.6 1.3 At2g32270 zinc transporter (ZIP3) identical to zinc transporter 0.6 1.7 At2g35380 peroxidase 20 (PER20) 0.4 1.5 At2g42250 cytochrome P450 0.2 2.7 At2g43590 chitinase, 0.5 1.4 At2g44460 glycosyl hydrolase] 0.6 2 At2g47880 Glutaredoxin (thioltransferase) 0.5 1.7 At3g01420 pathogen-responsive alpha-dioxygenase 0.5 1.2 At3g13650 disease resistance response protein-related 0.6 1.1 At3g22060 receptor protein kinase-related 0.4 2.2 At3g28740 Structure-specific recognition protein 1 homolog (HMG) 0.5 1.3

167
At3g44970 cytochrome P450 0.4 2.1 At3g50400 GDSL-motif lipase/hydrolase 0.5 1.2 At3g52720 Carbonic anhydrase anhydrase 0.6 1.5 At3g54420 class IV chitinase (CHIV) 0.6 1.3 At3g55710 UDP-glucoronosyl/ glucuronosyl 0.5 1.7 At4g04955 Amidohydrolase 0.5 1.9 At4g11460 Protein kinase domain 0.4 1.5 At4g13410 glycosyl transferase 0.5 1.4 At4g15210 beta-amylase 0.5 1.9 At4g17215 expressed protein 0.6 1.3 At4g24140 hydrolase 0.6 1.3 At4g28780 GDSL-motif lipase 0.6 1.3 At4g28940 Nucleosidase-related contains weak similarity to MTN 0.5 1.3 At4g29030 glycine-rich protein 0.6 1.4 At4g38080 hydroxyproline-rich glycoprotein 0.6 1.3 At5g03350 legume lectin family protein 0.5 1.7 At5g09480 hydroxyproline-rich glycoprotein 0.6 1.3 At5g09520 hydroxyproline-rich glycoprotein 0.5 1 At5g14130 peroxidase, putative identical to peroxidase 0.6 1 At5g18430 GDSL-motif lipase/hydrolase 0.5 1.5 At5g33370 GDSL-motif lipase/hydrolase 0.4 2.1 At5g36910 thionin 0.5 1.1 At5g37690 GDSL-motif lipase 0.6 1.4 At5g44550 integral membrane protein 0.6 1.2 At5g47635 expressed protein 0.6 1.2 At5g50200 expressed protein 0.5 1.7 At5g50260 cysteine proteinase 0.4 1.4 At5g55720 pectate lyase] 0.5 1.5 At5g65730 xyloglucan:xyloglucosyl transferase, 0.4 1.5
GO:0008289 lipid binding At1g55260 seed storage/lipid transfer protein (LTP) 0.5 1.5
At2g48130 seed storage/lipid transfer protein (LTP) 0.5 1.3 At2g48140 seed storage/lipid transfer protein (LTP) 0.6 1.2 At3g08770 lipid transfer protein 6 (LTP6) 0.5 1.9 At4g12500 seed storage/lipid transfer protein (LTP) 0.5 1.2 At5g13900 seed storage/lipid transfer protein (LTP) 0.6 1.1 At5g48490 seed storage/lipid transfer protein (LTP) 0.5 1.2 At5g55450 seed storage/lipid transfer protein (LTP) 0.3 2.6 At5g59320 lipid transfer protein 3 (LTP3) 0.6 2.1
GO:0006629 lipid metabolism At1g29660 GDSL-motif lipase/hydrolase 0.6 1.4
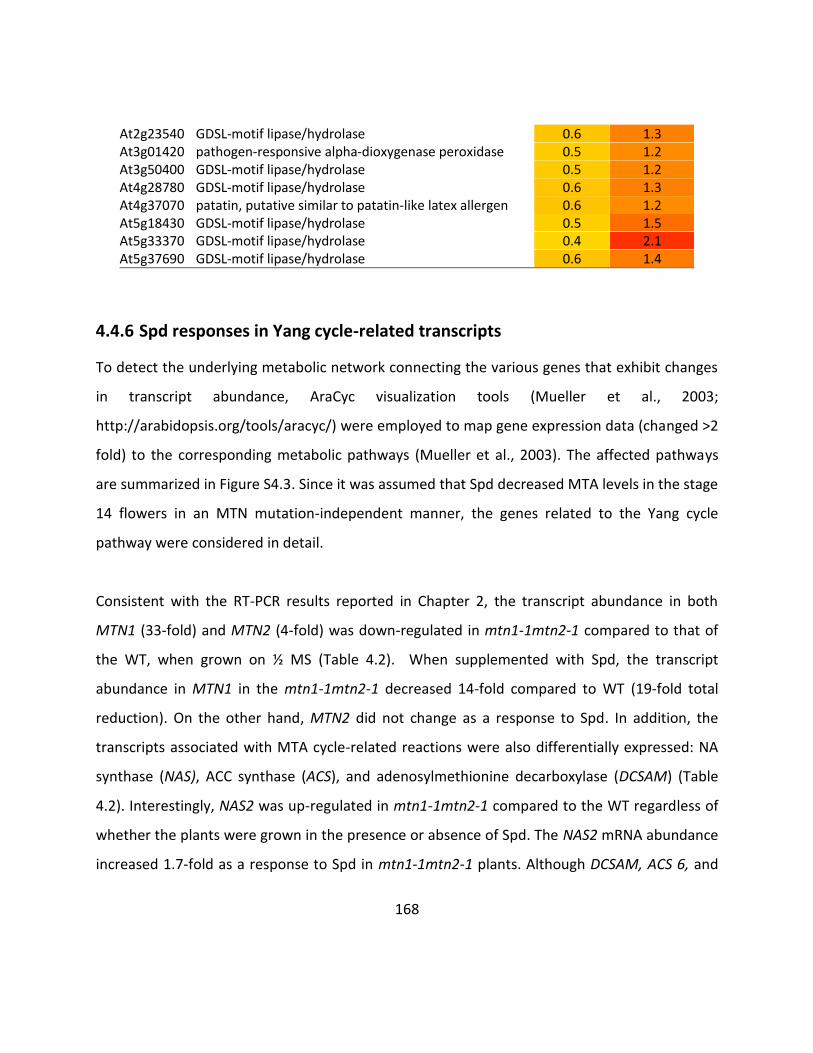
168
At2g23540 GDSL-motif lipase/hydrolase 0.6 1.3 At3g01420 pathogen-responsive alpha-dioxygenase peroxidase 0.5 1.2 At3g50400 GDSL-motif lipase/hydrolase 0.5 1.2 At4g28780 GDSL-motif lipase/hydrolase 0.6 1.3 At4g37070 patatin, putative similar to patatin-like latex allergen 0.6 1.2 At5g18430 GDSL-motif lipase/hydrolase 0.5 1.5 At5g33370 GDSL-motif lipase/hydrolase 0.4 2.1 At5g37690 GDSL-motif lipase/hydrolase 0.6 1.4
4.4.6 Spd responses in Yang cycle-related transcripts
To detect the underlying metabolic network connecting the various genes that exhibit changes
in transcript abundance, AraCyc visualization tools (Mueller et al., 2003;
http://arabidopsis.org/tools/aracyc/) were employed to map gene expression data (changed >2
fold) to the corresponding metabolic pathways (Mueller et al., 2003). The affected pathways
are summarized in Figure S4.3. Since it was assumed that Spd decreased MTA levels in the stage
14 flowers in an MTN mutation-independent manner, the genes related to the Yang cycle
pathway were considered in detail.
Consistent with the RT-PCR results reported in Chapter 2, the transcript abundance in both
MTN1 (33-fold) and MTN2 (4-fold) was down-regulated in mtn1-1mtn2-1 compared to that of
the WT, when grown on ½ MS (Table 4.2). When supplemented with Spd, the transcript
abundance in MTN1 in the mtn1-1mtn2-1 decreased 14-fold compared to WT (19-fold total
reduction). On the other hand, MTN2 did not change as a response to Spd. In addition, the
transcripts associated with MTA cycle-related reactions were also differentially expressed: NA
synthase (NAS), ACC synthase (ACS), and adenosylmethionine decarboxylase (DCSAM) (Table
4.2). Interestingly, NAS2 was up-regulated in mtn1-1mtn2-1 compared to the WT regardless of
whether the plants were grown in the presence or absence of Spd. The NAS2 mRNA abundance
increased 1.7-fold as a response to Spd in mtn1-1mtn2-1 plants. Although DCSAM, ACS 6, and

169
ACS 11 were not included in the transcripts that increased two fold in mtn1-1mtn2-1 plants
grown on ½ MS, they were detected in that category of expression in both the WT and mtn1-
1mtn2-1 plants fed with Spd. The levels of both DCSAM and ACS6 in mtn1-1mtn2-1 were
approximately 2.6 times those of the WT, whereas the level of ACS11 was four times less.
These results suggest that the genes related to the Yang cycle are regulated at the transcript
level in the presence of exogenous Spd.
4.4.7 Increased H2O2 production in Spd-fed seedlings
Since the H2O2 produced during PA catabolism either by PAO and CuAO acts as a signal in xylem
differentiation, DAB staining was used to qualitatively monitor the level of H2O2 production in
seedlings grown on ½ MS and on ½ MS supplemented with Spd (Figure 4.8). The control group
for this test were seedlings grown on oxidative-stress-inductive AT media that leads to H2O2
production due to stress.

170
Table 4.2: Yang cycle related genes that are changed in the mtn1-1mtn2-1 mutant compared to WT on both MS media supplemented with Spd
The values are averages of 3 independent replicates. Colours are assigned based on the scale
below.
magnitude of change 0 328.42 656.84 985.27 1313.69 1642.12 1970.54 2298.97 2627.39 >2955.82 greater than zero less than zero
AGI Description WT -Spd Mut -Spd WT + Spd Mut + Spd
GO:0009116 nucleoside metabolism
At4g38800
Methylthioadenosine nucleosidase (MTN1) 3284.2 97.3 3236.8 227.7
At4g34840 Methylthioadenosine nucleosidase (MTN2) 105.8 26.2 102.9 29.4
GO:0030418 Nicotianamine biosynthesis 166.7 635.8 108.5 603.3 At5g56080 Nicotianamine synthase (NAS 2) 65.6 172.2 60.1 181.2 At1g 09240 Nicotianamine synthase (NAS 3)
GO:0030419 Polyamine biosynthesis At5g15950
Adenosylmethionine decarboxylase (DCSAM) 0 0 220 606.6
GO:0009693 Ethylene biosynthesis At4g11280 ACC Synthase (ACS 6) 0 0 524.9 1390.7
At4g08040 ACC Synthase (ACS 11) 0 0 297.7 71.3

171
Figure 4.8: Histochemical DAB staining to detect H2O2 production
(A, B) mtn1-1mtn2-1 and WT seedlings grown for 14 days in ½ MS did not show the
distinct brown color in the leaves. However, the roots of both genotypes were stained.
(C, D) The seedling leaves and cotyledons of both genotypes are prominently stained with
DAB when grown on oxidative-stress-inductive AT media for 2 days.
(E, F) When grown on media supplemented with Spd, the mtn1-1mtn2-1 leaves were
stained more intensely than those of the WT. Scale bars = 6 mm.

172
According to Takahashi et al. (2010) of the five PAOs of Arabidopsis, only PAO4 and PAO5 are
present in 14-day-old Arabidopsis seedlings. Based on the microarray data obtained for the 14-
day-old seedlings, no significant changes were detected in these genes with or without
exogenous supplementation of Spd (Table S4.3). However, the CuAO (At4g12280) that was
increased by 1.9 times in the mtn1-1mtn2-1 seedlings grown on ½ MS compared to the levels in
the WT was further increased 2.8 fold when the plants were supplemented with Spd.
4.4.8 Vasculature, embryos, and auxin distribution of restored branches
As mentioned, the mtn1-1mtn2-1 generated from the seedlings that were grown on exogenous
Spd for 14 days developed some siliques with viable seeds two-three weeks after bolting. This
recovery of fertility occurred in random branches or at random times on sectors of one branch.
The cross-sectional areas of the recovered branches show ~ eight vascular bundles compared to
the increased number of vascular bundles (~ 12) in branches of untreated (“naïve”= never seen
Spd) plants (Figure 4.9). The majority of the flowers on the fertile branches closer to the siliques
were like those of the WT in appearance, with dehiscent anthers. The majority of ovules in the
“recovered siliques” developed beyond the 2-V ovule stage into seeds with embryos (Figure
4.10C, F). In contrast to the fully developed mature embryos in WT seeds (Figure 4.10I), the
restored siliques had seeds with embryos that spanned the stages between mature embryos
and stage 2-V ovules. DR5rev::GFP expression reflected increased auxin distribution in stage 2-V
mtn1-1mtn2-1 ovules (Figure 4.10A, B). Using the GFP signal as an indicator of auxin
distribution, the restored seeds had auxin maxima at the cotyledon tips and embryonic root tips
similar to those found in WT embryos (Figure 4.10D, E). However, these mtn1-1mtn2-1 embryos
were different in morphology and had

173
Figure 4.9: Confocal images of cross-sections of branches of a mtn1-1mtn2-1 plant recovered after exogenous Spd feeding. Scale bars = 60 µm.
(A) Non-restored branch with no filled siliques
(B) Restored branch with seed-containing siliques

174
increased ectopically expressed auxin surrounding the embryo. This apparent improved auxin
distribution may act as a signal for overcoming the barriers of mtn1-1mtn2-1 mutants to
generating viable embryos.
4.4.9 Transgenerational effects of Spd that give rise to WT-looking
mtn1-1mtn2-1 plants
The majority of seeds arising from Spd-treated plants germinated ( Chapter 2). Preliminary
analysis over two additional generations of Spd feeding (Figure S4.6, Table S4.16, Table S4.17)
revealed that plants that were grown either twice (+ SpdG2) or three times (+ SpdG3) on
exogenous Spd have variable vegetative phenotypes resembling those of mtn1-1mtn2-1. These
included interveinal chlorosis, observed at 14 DAG (Table S4.16), and rosette leaf texture
(Figure S4.7). Upon the transition to the reproductive phase, these plants appeared to adopt a
moderate phenotype with more WT characteristics, including earlier bolting than in
mtn1-1mtn2-1, although still later than in the WT (Table S4.4). These plants also had many
closed buds, in contrast to the open buds of mtn1-1mtn2-1 plants (Figure S4.7D-F). At maturity,
both + SpdG2 and + SpdG3 plants were indistinguishable from the WT, with normal flowers,
dehiscent anthers, and fertility (Figure S4.7G-H), despite being genotypically mtn1-1mtn2-1 and
having decreased MTN activity.
Amazingly, the generations that were exposed to only one (+ SpdG1–Spd G2) or two (+SpdG2–
Spd G3) Spd treatments were indistinguishable from plants exposed to Spd: (+SpdG1, G2) and
(+SpdG2, G3), respectively (Table S4.16). It was thus concluded that one Spd treatment triggers
genotypically mtn1-1mtn2-1 mutants to adopt a WT reproductive phase.

175
Figure 4.10: Seeds and embryos of restored plants
Compared to (A-B) underdeveloped ovules of mtn1-1mtn2-1 grown on ½ MS, (D, E)
restored seeds from exogenously fed Spd mtn1-1mtn2-1 show close to (G, H) the WT
Dr5rev::GFP distribution. The green florescence indicates the presence of auxin as
reported by the auxin sensitive reporter Dr5. Yellow florescence indicates the co-
localization of GFP florescence and autoflores cence (red). The restored siliques
contained underdeveloped ovules similar to (C) mtn1-1mtn2-1, (F) different size seeds
with embryos of different development stages, and (I) seeds with fully developed
embryos similar to those of the WT. Scale bars = 25 µm.
176
4.5 Discussion
4.5.1 Spd and vascular development
PAs are known to affect vascular development by influencing processes such as cambium
activity, the initiation of cell differentiation, and the induction of cell death (Vera-Sirera et al.,
2010). These processes are thought to be mediated by interactions with (1) hormones including
auxins, which affect cell division or (2) by the production of H2O2 during PA catabolism (Møller
and McPherson, 1998). To our knowledge the only documented connection between PA, auxin,
and xylem development is that auxin induces ACL5 transcription that encodes for Tspm
synthase (Hanazawa et al., 1997) which is necessary for proper xylem differentiation. In mtn1-
1mtn2-1, the low Tspm levels are speculated to be a result of accumulated MTA inhibiting ACL5
activity ( Chapter 2). With Spd feeding, the Tspm levels would be expected to increase by either
inducing ACL5 via recovered auxin or increasing SAMDC transcript levels. Since mutation of one
of the SAMDC isoforms, bud2, showed severely deformed vascular development (Ge et al.,
2006) it is possible that this increase in SAMDC transcript abundance may aid in producing
normal vasculature by adjusting the PA homeostasis in mtn1-1mtn2-1 mutants.
On the other hand, the increased H2O2 production detected by DAB staining in the 14-day-old
seedlings that received the Spd exogenously suggests that the Spd-induced PA catabolism could
also play a role in xylem differentiation and cell death in the mtn1-1mtn2-1 plants, leading to
improved fertility. In support of the possibility of a role played by H2O2, CuAO transcripts were
up-regulated in mtn1-1mtn2-1 compared to those in the WT when supplemented with Spd.
However, a detailed analysis of the genes involved in PA catabolism, PA metabolism, and PA
conjugation along with their anatomical changes will be necessary in order to narrow down the
basis of the vascular changes in mtn1-1mtn2-1 mutants when exposed to Spd. In any case, the

177
recovery of a normal vasculature may indirectly mediate the increased seed production of Spd-
treated mtn1-1mtn2-1 plants.
4.5.2 Spd and reproductive development
Several lines of evidence suggest that the effect of Spd on fertility involves auxin. First, Spd
treatment led to the development of normal floral organogenesis with the proper number,
spacing, and pattern of floral organs along with anthers that dehisce. Several mutants that were
disrupted either in auxin biosynthesis, transport, or signaling also exhibit similar flowering
defects related to organ number, spacing, and male and female reproductive structure
morphology (Krizek et al., 2011). The ett mutant with a mutation in a gene that encodes the
Auxin Response Factor, ETTIN (ETT)/ARF3, has an increased number of sepals, petals, and
abnormal reproductive structures (Sessions, 1997). The yuc1yuc4 mutant with defective auxin
biosynthesis also has abnormal reproductive structures (Cheng et al., 2006). On the other hand,
pin and pid mutants that have mutations in the genes that encode auxin transport system
components exhibit fewer floral organs but more petals (Bennett et al., 1995). In addition, ett
and pid mutants have alterations in the relative spacing and position of floral organ primordia
(Bennett et al., 1995; Sessions, 1997). Taken together, these results suggest that recovered
auxin homeostasis contributes to the proper development of floral organs in Spd-treated mtn1-
1mtn2-1 that would logically increase its fertilization efficiency. First, the fact that the “restored
seeds” developed past the 2-V ovule stage and produced seeds with apparently normal
embryos provides clear evidence that Spd-treated MTN mutant plants are partially fertile.
Second, with Spd treatment, the auxin levels decreased to WT levels in the 14-day-old
seedlings, unopened buds, and stage 14 flowers. Third, Spd treatment resulted in the recovery
of the components of the endomembrane system the function of wfhich is essential for proper
localization of membrane proteins, including PIN proteins and BR receptor proteins. PIN
polarity is known to direct auxin flow in order to create the local gradients essential for pattern

178
formation (Friml et al., 2004). The auxin efflux transmembrane transporter PIN 7 (At1g23080)
transcript was up-regulated 2.5-fold in the mtn1-1mtn2-1 in response to Spd. Finally, the
DR5rev::GFP expression of restored seeds in mtn1-1mtn2-1 was distributed more closely to that
of the WT expression (Figure 4.7) However, the partial recovery of fertility suggests the need
for proper auxin distribution in the reproduction phase. A consideration of all of this evidence
leads to the conclusion that auxin could be one of the key targets affected by Spd in the
recovery of fertility of mtn1-1mtn2-1.
4.5.3 Spd effects on the Yang cycle and SAM utilization activities
The response to exogenous Spd was observed in both the transcripts and metabolites related
to the Yang cycle and SAM utilization. The microarray data revealed that the transcript
abundance associated with seven genes of this cycle was affected by exogenous Spd: MTN1,
MTN2, NAS2, NAS3, DCSAM, ACS6, and ACS11. Exogenous Spd increased MTN1 transcript
abundance and decreased MTA content (20- and 13-fold, respectively). Irrespective of the MTN
mutation of the mtn1-1mtn2-1 knockdown mutant, the increase in MTN transcript abundance
may result in higher MTN activity that leads to decreased MTA content. This reduction in MTA
content should lower its inhibitory effects on MTA-producing enzyme activities ( Chapter 2).
The mechanisms of handling the lower MTA inhibition are likely pathway-specific. The
expression of NAS is up-regulated in mtn1-1mtn2-1 compared to that in the WT, even when
grown without Spd supplementation. The chlorotic phenotype of both mtn1-1mtn2-1 plants
grown on ½ MS or on ½ MS supplemented with Spd suggests that the mutants are experiencing
low NAS activity and possibly lower NA content even after supplementation with Spd. The
increases in NAS 2 (3.6-fold) and NAS 3 (2.6-fold) when grown on ½ MS may reflect a sensing of
their low NA content ( Chapter 2). On the other hand, SAMDC transcripts, which encode the
enzyme activity needed to produce decarboxylated SAM, the essential cofactor for PA

179
biosynthesis, were up-regulated only as a response to Spd (2.8-fold). These results lead to the
possibility of overriding the MTA inhibition of Spd and Tspm/Spm synthesis when treated with
Spd. As with SAMDC, ACS transcripts were also detected when the seedlings were
supplemented with exogenous Spd. These changes were isoform specific: ACS6 was up-
regulated 2.6-fold and ACS11 was down regulated 4.7-fold. According to Tsuchisaka et al.
(2009), individual ACS isoforms are non-essential, but specific combinations of ACS homo- and
heterodimers mediate ethylene-associated processes. ACS6 and ACS11 generally form an
inactive homodimer; upon Spd feeding, they may form other interactions with different
activities. While these transcript changes have yet to be validated and their corresponding
effects proven, it is evident that there are numerous potential effects of Spd on activities
relating to the Yang cycle/SAM utilization.
However, the lower MTA and higher SAM content with Spd feeding in mtn1-1mtn2-1 suggest
that exogenous Spd effects occur at both the transcript and metabolite levels. The molecular
mechanism and flux changes in its involvement merit further investigation.
4.5.4 Metabolic mechanism for Spd-dependent fertility recovery
The results presented in this chapter lead to a model for the partial improvement of fertility
resulting from the feeding of exogenous Spd to mtn1-1mtn2-1 (Figure 4.11). It is proposed that
this improvement may occur via two distinct routes or by a combination of both: (1) recovery of
proper auxin distribution and (2) development of normal vasculature. Analysis of all of the
microarray data suggests that the exogenous Spd restored the endomembrane system. The
recovery of the endomembrane system, which is needed for the proper localization of the auxin
efflux protein PINs, may result in the recovery of normal auxin distribution in all organs,
including both male and female reproductive structure, and their vasculature. It is proposed
that the logical link between Spd and the endomembrane system is the Spd-dependent post-

180
translational activation of eIF5A. In addition to the potential link with eIF5A, formation of
proper vasculature via auxin, increased Tspm produced from an exogenously supplied Spd
precursor via SAMDC activity and/or from increased H2O2 production via CuAO may be partially
responsible for the recovery of the mtn1-1mtn2-1 vascular defects. Moreover, the possible
involvement of hormone cross-talk especially with IAA, CK and BR cannot be ruled out.
4.5.5 Metabolic recovery versus epigenetic recovery
The evidence presented thus far suggests that the Spd-dependent recovery of fertility in
mtn1-1mtn2-1 is via a metabolic mechanism (Figure 4.11). However, three observations lead to
the possible involvement of an epigenetic mechanism in this reversal: (1) the partial nature of
the first reversal, with fertile siliques occurring only in some branches or sectors while retaining
genotypic identity; (2) the transgenerational nature of the fertility reversal, whereby without
further supplementation of Spd, the seeds from Spd-fed plants give rise to fertile plants in the
subsequent generation, and (3) the proportion of fertile recovered plants in different Spd+
generations was inconsistent despite the plants being maintained at identical growth
conditions.
However, based on the model presented, the partial recovery in some sectors could be due to
altered auxin distribution in the meristem that gives rise to these branches. These initial stem
cells, with variable properties based on the initial signals (auxin) they receive, will ultimately
give rise to at least a few branches with altered auxin distribution. Branches with proper auxin
gradients or locations with sufficient auxin content along the length of branches produce seeds.
The transgenerational effects may be due simply to the recovery of seeds with properly
developed embryos (including embryonic vasculature) that are capable of giving rise to a

181
SAMNA
SAM
decarboxylase
NA
synthase
MTA
nucleosidase
adenine
dcSAM
MTA
Put
Spd
Spm/Tspm
Spd
synthase
Spm/Tspm
synthase
Arginine
Agmatine
Arginine
decarboxylase
MTR
Met
Xylem differentiation
Reproductive
development
Auxin
Exogenous Spd
PIN
Endomembrane
sustem
eIF5A
H2O2
CuA
oxidase
Figure 4.11: Model showing potential links resulting in the recovery of vasculature and reproduction for seed production after feeding with exogenous Spd

182
fertile plant that still holds the mtn1-1mtn2-1 metabolism. However, what is questionable is
how these next-generation plants remain fertile while being MTN deficient. This effect could
result from a process that constitutively maintains either low MTA or high Spd levels. The
methylation of target genes (epigenetic) could be one possibility. A logical and potential
candidate could be the gene that encodes Spd sinapoyl CoA acyltransferase (Luo et al., 2009)
which is required for the production of conjugated Spd in seeds. This conjugated Spd is
proposed to serve as a PA reserve in seeds, which is released in order to fulfill the needs of the
developing tissues (Luo et al., 2009). One such need of the embryonic tissues could be the
activation of eIF5A. It is thus possible that methylation of this gene could release reserved PA
and overcome the Spd deficiency in the mtn1-1mtn2-1 mutant embryos.
4.6 Conclusion
Based on the results presented in this chapter, the key processes affected by exogenous Spd
feeding are auxin distribution and/or vascular development, which either alone or together
allow seed production in mtn1-1mtn2-1. The transgenerational effects observed as a result of
exogenous Spd supplementation could be an epigenetic affect.
4.7 Technical assistance by others
Ishari Waduwara-Jayabahu (IWJ) designed the experiments; grew the plants; collected the
samples; analyzed the reproductive organs using SEM, DIC, and confocal microscopes, except
for the ovule observations presented in Figure 2 A-F, which were conducted by Sarah Schoor;
IWJ also extracted and quantified the RNA for microarray analysis. The majority of this research
was carried out in the research laboratory of Dr. H. Sakakibara, RIKEN, Japan, during the three-
month period when IWJ joined his group on a JSPS-NSERC fellowship. The following laboratory
members of RIKEN were involved in the project: Mikiko Kojima analyzed hormones, Yuji Sawada
analyzed metabolites, and Nori Nakamichi analyzed microarray data and also extracted the list
of transcripts that exhibited changes greater than two-fold.

183
4.8 Supplemental Material
Figure S4.1: The hormone profiles of mtn1-1mtn2-1 plants compared to WT grown on ½ MS.
Hormone profiles of seven organs (A) unopened buds, (B) stage 14 flowers, (C) stage 15
siliques, (D) stage 17b, (E) stems, (F) rosette leaves and (G) roots were compared
between WT (black bars) and mtn1-1mtn2-1 (grey bars). Note: the mtn1-1mtn2-1 grown
on ½ MS are sterile and wil l not have stage 17b siliques (G). Values are mean ± SD (N = 2-
3).

184
Figure S4.2: The profiles of mtn1-1mtn2-1 plants compared to WT grown on ½ MS supplemented with Spd.
Hormone profiles of seven organs (A) unopened buds, (B)stage 14 flowers, (C) stage 15
siliques, (D) stage 17b, (E) stems, (F) rosette leaves and (G) roots were compared
between WT (black bars) and mtn1-1mtn2-1 (grey bars). Note the mtn1-1mtn2-1 grown
on ½ MS are sterile and wil l not have stage 17b siliques. Values are mean ± SD (N = 2-3).
Purple color indicates that the plant was fed with exogenous Spd.

185
mtn1-1mtn2-1
1/2MS
mtn1-1mtn2-1
1/2MS + Spd
Up regulated pathways
Up regulated genes
Down regulated genes
1. Methionine salvage pathway**
2. Glutamine biosynthesis 1
3. Lutein biosynthesis
4. Nitrate reduction II (assimilatory)
5. Methyl indole-3- acetate interconversion
6. Ammonia assimilation cycle II
7. Zeaxanthin biosynthesis
1. Nicotianamine biosynthesis##
2. Methionine (Met) salvage pathway**
3. Glucosinolate biosynthesis via homomet
4. Abscisic acid glucose ester biosynthesis
5. Chlorophyll a degradation
6. Cellulose biosynthesis**
7. Spermidine biosynthesis
8. IAA Biosynthesis I***9. Glucosinolate biosynthesis via dihomomet
10. Ethylene biosynthesis fron methionine
11. Spermine biosynthesis
1. Jasmonic acid biosynthesis
2. Nicotianamine biosynthesis*
3. 13- LOX and 13- HPL pathway
4. Glycolipid desaturation
5. Flavonol biosynthesis
Down regulated pathways
1. Methionine salvage pathway**
2. Sphingolipid biosynthesis (plants)
3. Triacylglycerol biosynthesis
4. CDP- diacylglycerol biosynthesis I
5. Photorespiration
6. Trehalose biosynthesis I
7. Proline degradation II
8. UDP- D - glucuronate biosynthesis (from myo-inositol
)9. Ethylene biosynthesis from methionine
10. Acyl - CoA hydrolysis
11. Cellulose biosynthesis **
12. Cytokinins -O- glucoside biosynthesis
13. CDP- diacylglycerol biosynthesis II
14. indole glucosinolate breakdown
15. Citrulline biosynthesis
16. Cutin biosynthesis*
17. Glucosinolate biosynthesis from tryptophan
18. Suberin biosynthesis
19. Folate transformations
20. Xylogllucan biosynthesis
21.Stachyose biosynthesis
22. Glycine biosynthesis
23. FormvITHF biosynthesis II24. Folate polyglutamylation I
Up regulated pathways Down regulated pathways
Figure S4.3: Pathways determined by genes that are affected as a response to Spd. Pathways in dark green and light green show -up and -down regulated pathways on ½ MS respectively. Similarly, pathways in orange and pink show -up and -down regulated pathways on ½ MS supplemented with Spd respectively. Asterics shows common pathways regulated among the four groups.
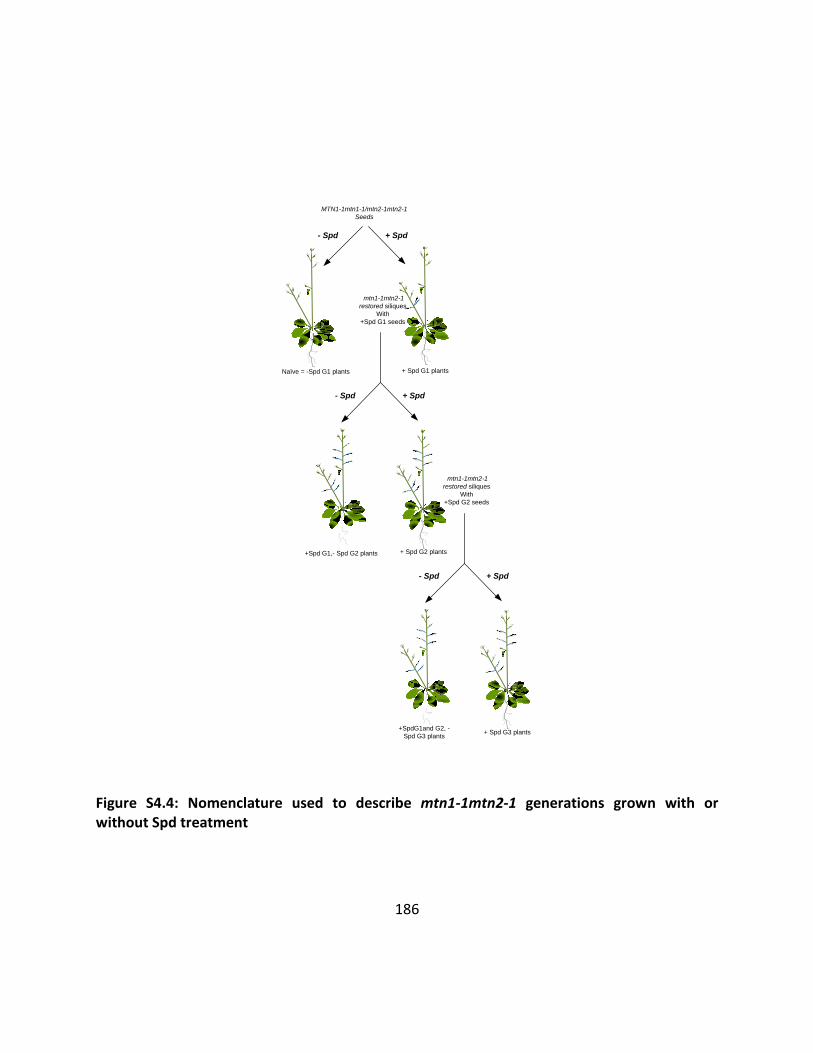
186
+ Spd G3 plants+SpdG1and G2, -
Spd G3 plants
Naïve = -Spd G1 plants
mtn1-1mtn2-1
restored siliques
With
+Spd G1 seeds
+ Spd G1 plants
+ Spd- Spd
+ Spd G2 plants+Spd G1,- Spd G2 plants
+ Spd- Spd
mtn1-1mtn2-1
restored siliques
With
+Spd G2 seeds
+ Spd- Spd
MTN1-1mtn1-1/mtn2-1mtn2-1
Seeds
Figure S4.4: Nomenclature used to describe mtn1-1mtn2-1 generations grown with or without Spd treatment

187
Figure S4.5: The phenotype of mtn1-1mtn2-1 over two generations of Spd feeding
The plants at inflorescence emergence (A -C) with close up view of first buds (D-F) and 2-weeks after bolting (G-I).
(A, D, G) Naïve mtn1-1mtn2-1. Scale bar = 24 mm.
(B, E, H) The mtn1-1mtn2-1 plants that were grown on exogenous Spd for two generations (+ Spd G2) . Scale bar = 80 mm.
(C, F, I) WT. Scale bar = 30 mm.
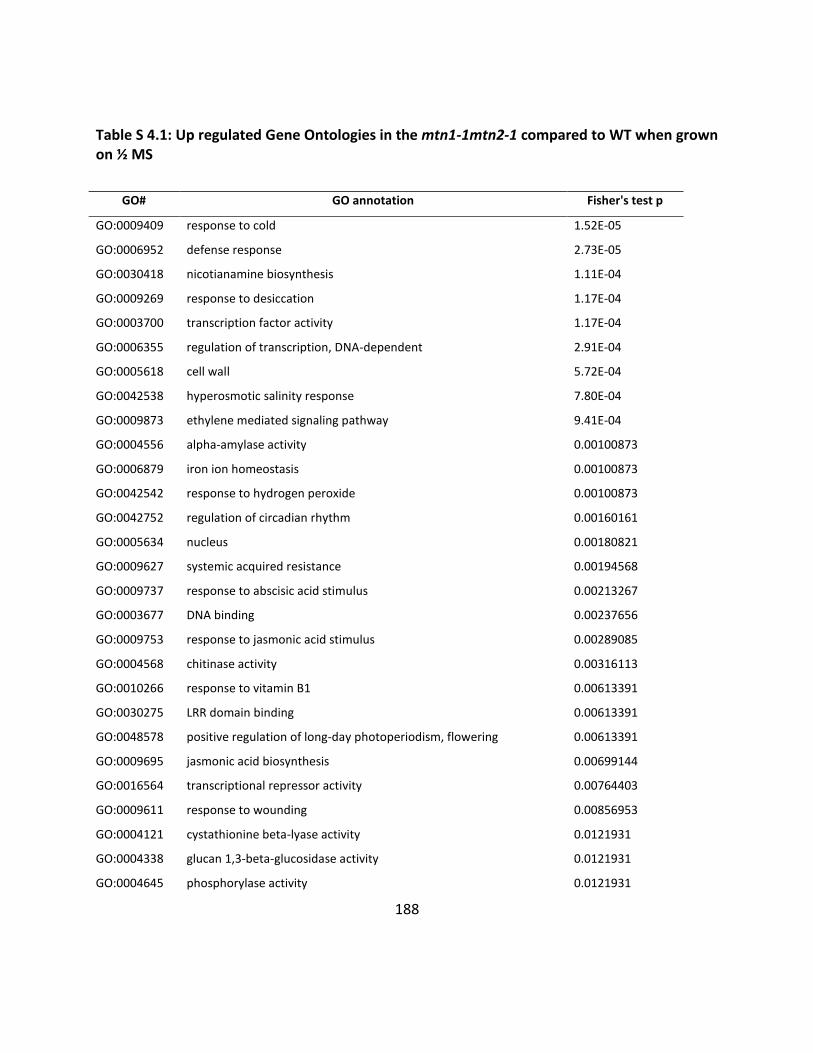
188
Table S 4.1: Up regulated Gene Ontologies in the mtn1-1mtn2-1 compared to WT when grown on ½ MS
GO# GO annotation Fisher's test p
GO:0009409 response to cold 1.52E-05
GO:0006952 defense response 2.73E-05
GO:0030418 nicotianamine biosynthesis 1.11E-04
GO:0009269 response to desiccation 1.17E-04
GO:0003700 transcription factor activity 1.17E-04
GO:0006355 regulation of transcription, DNA-dependent 2.91E-04
GO:0005618 cell wall 5.72E-04
GO:0042538 hyperosmotic salinity response 7.80E-04
GO:0009873 ethylene mediated signaling pathway 9.41E-04
GO:0004556 alpha-amylase activity 0.00100873
GO:0006879 iron ion homeostasis 0.00100873
GO:0042542 response to hydrogen peroxide 0.00100873
GO:0042752 regulation of circadian rhythm 0.00160161
GO:0005634 nucleus 0.00180821
GO:0009627 systemic acquired resistance 0.00194568
GO:0009737 response to abscisic acid stimulus 0.00213267
GO:0003677 DNA binding 0.00237656
GO:0009753 response to jasmonic acid stimulus 0.00289085
GO:0004568 chitinase activity 0.00316113
GO:0010266 response to vitamin B1 0.00613391
GO:0030275 LRR domain binding 0.00613391
GO:0048578 positive regulation of long-day photoperiodism, flowering 0.00613391
GO:0009695 jasmonic acid biosynthesis 0.00699144
GO:0016564 transcriptional repressor activity 0.00764403
GO:0009611 response to wounding 0.00856953
GO:0004121 cystathionine beta-lyase activity 0.0121931
GO:0004338 glucan 1,3-beta-glucosidase activity 0.0121931
GO:0004645 phosphorylase activity 0.0121931

189
GO:0010188 response to microbial phytotoxin 0.0121931
GO:0015086 cadmium ion transporter activity 0.0121931
GO:0016702 oxidoreductase activity, 0.0121931
GO:0046345 abscisic acid catabolism 0.0121931
GO:0009507 chloroplast 0.01433909
GO:0005506 iron ion binding 0.01456892
GO:0005509 calcium ion binding 0.01481291
GO:0006597 spermine biosynthesis 0.01817824
GO:0008898 homocysteine S-methyltransferase activity 0.01817824
GO:0009942 longitudinal axis specification 0.01817824
GO:0015691 cadmium ion transport 0.01817824
GO:0016566 specific transcriptional repressor activity 0.01817824
GO:0030410 nicotianamine synthase activity 0.01817824
GO:0031347 regulation of defense response 0.01817824
GO:0009908 flower development 0.01914803
GO:0004014 adenosylmethionine decarboxylase activity 0.02409001
GO:0005384 manganese ion transporter activity 0.02409001
GO:0006828 manganese ion transport 0.02409001
GO:0008199 ferric iron binding 0.02409001
GO:0009267 cellular response to starvation 0.02409001
GO:0046423 allene-oxide cyclase activity 0.02409001
GO:0005578 extracellular matrix (sensu Metazoa) 0.02992907
GO:0005654 nucleoplasm 0.02992907
GO:0006826 iron ion transport 0.02992907
GO:0008295 spermidine biosynthesis 0.02992907
GO:0008810 cellulase activity 0.02992907
GO:0009861 jasmonic acid and ethylene-dependent systemic resistance 0.02992907
GO:0042991 transcription factor import into nucleus 0.02992907
GO:0006596 polyamine biosynthesis 0.03569609
GO:0015976 carbon utilization 0.03569609
GO:0030304 trypsin inhibitor activity 0.03569609

190
GO:0043234 protein complex 0.03569609
GO:0048825 cotyledon development 0.03569609
GO:0009081 branched chain family amino acid metabolism 0.04139172
GO:0009625 response to insect 0.04139172
GO:0010039 response to iron ion 0.04139172
GO:0016165 lipoxygenase activity 0.04139172
GO:0040007 growth 0.04139172
GO:0016787 hydrolase activity 0.0448939
GO:0009651 response to salt stress 0.04628131
GO:0010017 red or far red light signaling pathway 0.04701661
GO:0010048 vernalization response 0.04701661
GO:0005375 copper ion transporter activity 0.05257142
GO:0009266 response to temperature stimulus 0.05257142
GO:0009698 phenylpropanoid metabolism 0.05257142
GO:0031012 extracellular matrix 0.05257142
GO:0005385 zinc ion transporter activity 0.05805678
GO:0005983 starch catabolism 0.05805678
GO:0007389 pattern specification 0.05805678
GO:0008283 cell proliferation 0.05805678
GO:0009817 defense response to fungus, incompatible interaction 0.05805678
GO:0016209 antioxidant activity 0.05805678
GO:0006829 zinc ion transport 0.06347332
GO:0009867 jasmonic acid mediated signaling pathway 0.06347332
GO:0009672 auxin:hydrogen symporter activity 0.06882168
GO:0010150 leaf senescence 0.06882168
GO:0016207 4-coumarate-CoA ligase activity 0.06882168
GO:0019761 glucosinolate biosynthesis 0.06882168
GO:0005554 molecular function unknown 0.07192527
GO:0008372 cellular component unknown 0.07286682
GO:0030528 transcription regulator activity 0.07771636
GO:0006869 lipid transport 0.08196074

191
GO:0009751 response to salicylic acid stimulus 0.08338001
GO:0006114 glycerol biosynthesis 0.08446388
GO:0009825 multidimensional cell growth 0.08446388
GO:0009414 response to water deprivation 0.08480117
GO:0016021 integral to membrane 0.08622134
GO:0009723 response to ethylene stimulus 0.08764828
GO:0008289 lipid binding 0.08907382
GO:0030154 cell differentiation 0.08954571
GO:0012505 endomembrane system 0.09364572
GO:0004089 carbonate dehydratase activity 0.09456243
GO:0009508 plastid chromosome 0.09456243
GO:0009887 organ morphogenesis 0.09456243
GO:0045941 positive regulation of transcription 0.09456243
GO:0008324 cation transporter activity 0.09951464
GO:0008483 transaminase activity 0.09951464
GO:0009631 cold acclimation 0.09951464
GO:0006520 amino acid metabolism 0.10440295
GO:0005488 binding 0.10763297
GO:0050832 defense response to fungus 0.11869029
GO:0009639 response to red or far red light 0.12332881
GO:0008757 S-adenosylmethionine-dependent methyltransferase activity 0.12790634
GO:0042742 defense response to bacterium 0.12790634
GO:0016887 ATPase activity 0.13153416
GO:0008080 N-acetyltransferase activity 0.13242342
GO:0005215 transporter activity 0.1349128
GO:0009744 response to sucrose stimulus 0.13688064
GO:0009910 negative regulation of flower development 0.13688064
GO:0048364 root development 0.13688064
GO:0007275 development 0.14110597
GO:0004222 metalloendopeptidase activity 0.14127854
GO:0005886 plasma membrane 0.15699221

192
GO:0030145 manganese ion binding 0.158288
GO:0009736 cytokinin mediated signaling 0.16239755
GO:0009926 auxin polar transport 0.16239755
GO:0000156 two-component response regulator activity 0.16645103
GO:0009735 response to cytokinin stimulus 0.17439193
GO:0005975 carbohydrate metabolism 0.18052686
GO:0048366 leaf development 0.18589587
GO:0009505 cell wall (sensu Magnoliophyta) 0.1962383
GO:0003993 acid phosphatase activity 0.19692315
GO:0006725 aromatic compound metabolism 0.20401651
GO:0007568 aging 0.20401651
GO:0004553 hydrolase activity, hydrolyzing O-glycosyl compounds 0.20861227
GO:0006970 response to osmotic stress 0.2109079
GO:0009617 response to bacterium 0.2109079
GO:0016706 oxidoreductase activity, 0.2109079
GO:0005737 cytoplasm 0.2129005
GO:0009733 response to auxin stimulus 0.22339416
GO:0003899 DNA-directed RNA polymerase activity 0.23040833
GO:0007165 signal transduction 0.23239402
GO:0016491 oxidoreductase activity 0.23834157
GO:0009793 embryonic development (sensu Magnoliophyta) 0.24507205
GO:0006633 fatty acid biosynthesis 0.24822548
GO:0048046 apoplast 0.24822548
GO:0006350 transcription 0.26185624
GO:0003824 catalytic activity 0.26188852
GO:0006857 oligopeptide transport 0.26445476
GO:0016563 transcriptional activator activity 0.26952748
GO:0045735 nutrient reservoir activity 0.26952748
GO:0008415 acyltransferase activity 0.2720025
GO:0009739 response to gibberellic acid stimulus 0.27683184
GO:0030599 pectinesterase activity 0.28150289
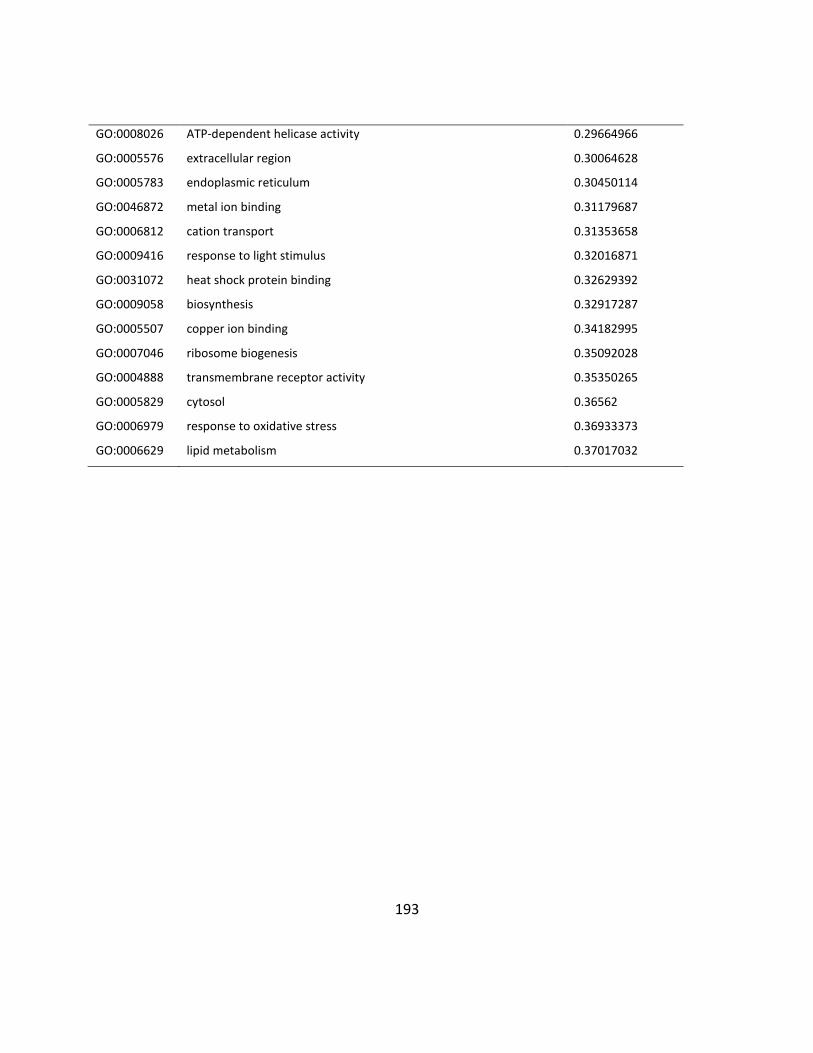
193
GO:0008026 ATP-dependent helicase activity 0.29664966
GO:0005576 extracellular region 0.30064628
GO:0005783 endoplasmic reticulum 0.30450114
GO:0046872 metal ion binding 0.31179687
GO:0006812 cation transport 0.31353658
GO:0009416 response to light stimulus 0.32016871
GO:0031072 heat shock protein binding 0.32629392
GO:0009058 biosynthesis 0.32917287
GO:0005507 copper ion binding 0.34182995
GO:0007046 ribosome biogenesis 0.35092028
GO:0004888 transmembrane receptor activity 0.35350265
GO:0005829 cytosol 0.36562
GO:0006979 response to oxidative stress 0.36933373
GO:0006629 lipid metabolism 0.37017032
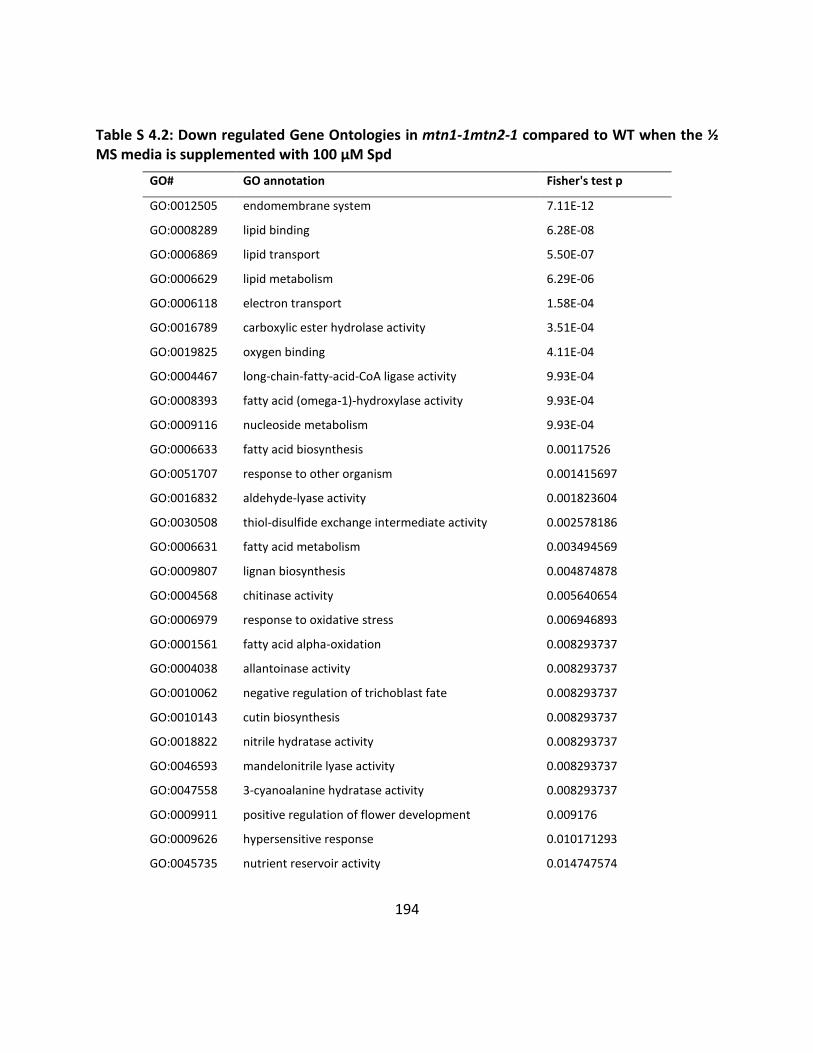
194
Table S 4.2: Down regulated Gene Ontologies in mtn1-1mtn2-1 compared to WT when the ½ MS media is supplemented with 100 µM Spd
GO# GO annotation Fisher's test p
GO:0012505 endomembrane system 7.11E-12
GO:0008289 lipid binding 6.28E-08
GO:0006869 lipid transport 5.50E-07
GO:0006629 lipid metabolism 6.29E-06
GO:0006118 electron transport 1.58E-04
GO:0016789 carboxylic ester hydrolase activity 3.51E-04
GO:0019825 oxygen binding 4.11E-04
GO:0004467 long-chain-fatty-acid-CoA ligase activity 9.93E-04
GO:0008393 fatty acid (omega-1)-hydroxylase activity 9.93E-04
GO:0009116 nucleoside metabolism 9.93E-04
GO:0006633 fatty acid biosynthesis 0.00117526
GO:0051707 response to other organism 0.001415697
GO:0016832 aldehyde-lyase activity 0.001823604
GO:0030508 thiol-disulfide exchange intermediate activity 0.002578186
GO:0006631 fatty acid metabolism 0.003494569
GO:0009807 lignan biosynthesis 0.004874878
GO:0004568 chitinase activity 0.005640654
GO:0006979 response to oxidative stress 0.006946893
GO:0001561 fatty acid alpha-oxidation 0.008293737
GO:0004038 allantoinase activity 0.008293737
GO:0010062 negative regulation of trichoblast fate 0.008293737
GO:0010143 cutin biosynthesis 0.008293737
GO:0018822 nitrile hydratase activity 0.008293737
GO:0046593 mandelonitrile lyase activity 0.008293737
GO:0047558 3-cyanoalanine hydratase activity 0.008293737
GO:0009911 positive regulation of flower development 0.009176
GO:0009626 hypersensitive response 0.010171293
GO:0045735 nutrient reservoir activity 0.014747574

195
GO:0008415 acyltransferase activity 0.01532335
GO:0004657 proline dehydrogenase activity 0.016450611
GO:0006562 proline catabolism 0.016450611
GO:0010136 ureide catabolism 0.016450611
GO:0016119 carotene metabolism 0.016450611
GO:0017057 6-phosphogluconolactonase activity 0.016450611
GO:0019499 cyanide metabolism 0.016450611
GO:0042411 beta-carotene hydroxylase activity 0.016450611
GO:0051410 detoxification of nitrogen compound 0.016450611
GO:0005618 cell wall 0.019544579
GO:0004601 peroxidase activity 0.023081291
GO:0009670 triose-phosphate transporter activity 0.02447231
GO:0010262 somatic embryogenesis 0.02447231
GO:0015717 triose phosphate transport 0.02447231
GO:0031304 intrinsic to mitochondrial inner membrane 0.02447231
GO:0030145 manganese ion binding 0.025051745
GO:0009751 response to salicylic acid stimulus 0.029863566
GO:0005615 extracellular space 0.032360499
GO:0006537 glutamate biosynthesis 0.032360499
GO:0009957 epidermal cell fate specification 0.032360499
GO:0015706 nitrate transport 0.032360499
GO:0050827 toxin receptor binding 0.032360499
GO:0051555 flavonol biosynthesis 0.032360499
GO:0000257 nitrilase activity 0.040116826
GO:0009725 response to hormone stimulus 0.040116826
GO:0005315 inorganic phosphate transporter activity 0.047742923
GO:0008519 ammonium transporter activity 0.047742923
GO:0009407 toxin catabolism 0.049266314
GO:0004364 glutathione transferase activity 0.052813643
GO:0003841 1-acylglycerol-3-phosphate O-acyltransferase activity 0.055240402
GO:0003954 NADH dehydrogenase activity 0.055240402
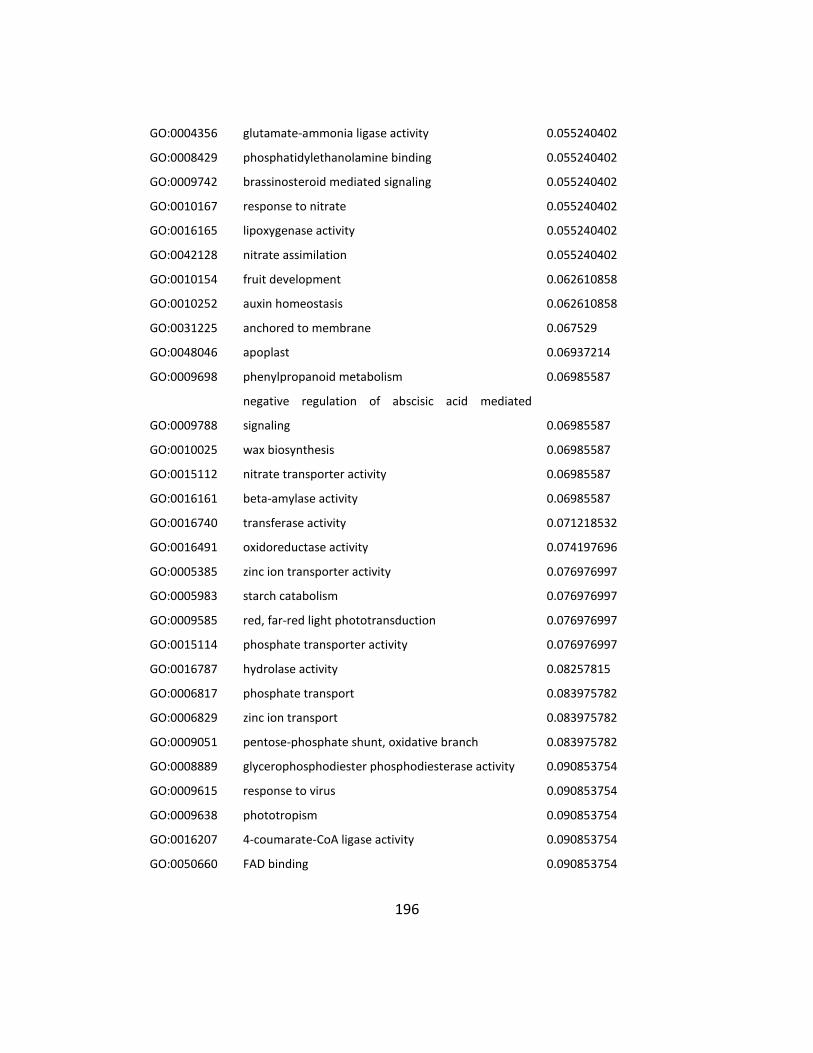
196
GO:0004356 glutamate-ammonia ligase activity 0.055240402
GO:0008429 phosphatidylethanolamine binding 0.055240402
GO:0009742 brassinosteroid mediated signaling 0.055240402
GO:0010167 response to nitrate 0.055240402
GO:0016165 lipoxygenase activity 0.055240402
GO:0042128 nitrate assimilation 0.055240402
GO:0010154 fruit development 0.062610858
GO:0010252 auxin homeostasis 0.062610858
GO:0031225 anchored to membrane 0.067529
GO:0048046 apoplast 0.06937214
GO:0009698 phenylpropanoid metabolism 0.06985587
GO:0009788
negative regulation of abscisic acid mediated
signaling 0.06985587
GO:0010025 wax biosynthesis 0.06985587
GO:0015112 nitrate transporter activity 0.06985587
GO:0016161 beta-amylase activity 0.06985587
GO:0016740 transferase activity 0.071218532
GO:0016491 oxidoreductase activity 0.074197696
GO:0005385 zinc ion transporter activity 0.076976997
GO:0005983 starch catabolism 0.076976997
GO:0009585 red, far-red light phototransduction 0.076976997
GO:0015114 phosphate transporter activity 0.076976997
GO:0016787 hydrolase activity 0.08257815
GO:0006817 phosphate transport 0.083975782
GO:0006829 zinc ion transport 0.083975782
GO:0009051 pentose-phosphate shunt, oxidative branch 0.083975782
GO:0008889 glycerophosphodiester phosphodiesterase activity 0.090853754
GO:0009615 response to virus 0.090853754
GO:0009638 phototropism 0.090853754
GO:0016207 4-coumarate-CoA ligase activity 0.090853754
GO:0050660 FAD binding 0.090853754

197
GO:0009611 response to wounding 0.096212753
GO:0006730 one-carbon compound metabolism 0.09761242
GO:0008794 arsenate reductase (glutaredoxin) activity 0.09761242
GO:0016847 1-aminocyclopropane-1-carboxylate synthase activity 0.09761242
GO:0009408 response to heat 0.098146978
GO:0016020 membrane 0.102847532
GO:0005856 cytoskeleton 0.104253275
GO:0042335 cuticle biosynthesis 0.104253275
GO:0000038 very-long-chain fatty acid metabolism 0.110777795
GO:0006071 glycerol metabolism 0.110777795
GO:0007017 microtubule-based process 0.110777795
GO:0005576 extracellular region 0.111653471
GO:0005783 endoplasmic reticulum 0.115489512
GO:0004805 trehalose-phosphatase activity 0.117187441
GO:0009693 ethylene biosynthesis 0.117187441
GO:0003700 transcription factor activity 0.118560092
GO:0046872 metal ion binding 0.123111293
GO:0004089 carbonate dehydratase activity 0.123483657
GO:0015144 carbohydrate transporter activity 0.125004228
GO:0003677 DNA binding 0.125895785
GO:0005351 sugar porter activity 0.126891496
GO:0004867 serine-type endopeptidase inhibitor activity 0.135741499
GO:0006098 pentose-phosphate shunt 0.135741499
GO:0007267 cell-cell signaling 0.135741499
GO:0005992 trehalose biosynthesis 0.141705935
GO:0016998 cell wall catabolism 0.141705935
GO:0030076 light-harvesting complex 0.141705935
GO:0016021 integral to membrane 0.146165635
GO:0008194 UDP-glycosyltransferase activity 0.147192153
GO:0042626
ATPase activity, coupled to transmembrane
movement of substances 0.147192153

198
GO:0009411 response to UV 0.147562562
GO:0006355 regulation of transcription, DNA-dependent 0.150824788
GO:0004872 receptor activity 0.153312747
GO:0005528 FK506 binding 0.153312747
GO:0009664 cell wall organization and biogenesis 0.164499182
GO:0009831
cell wall modification during multidimensional cell
growth 0.16993809
GO:0016168 chlorophyll binding 0.16993809
GO:0030036 actin cytoskeleton organization and biogenesis 0.16993809
GO:0009744 response to sucrose stimulus 0.175275873
GO:0030570 pectate lyase activity 0.175275873
GO:0004693 cyclin-dependent protein kinase activity 0.18565322
GO:0008219 cell death 0.18565322
GO:0005200 structural constituent of cytoskeleton 0.190695327
GO:0009738 abscisic acid mediated signaling 0.195641394
GO:0005829 cytosol 0.210178658
GO:0009828 cell wall loosening (sensu Magnoliophyta) 0.214489783
GO:0009651 response to salt stress 0.216575063
GO:0005199 structural constituent of cell wall 0.218973922
GO:0016757 transferase activity, transferring glycosyl groups 0.221151557
GO:0006810 transport 0.222146013
GO:0005975 carbohydrate metabolism 0.222605128
GO:0006952 defense response 0.222825228
GO:0009737 response to abscisic acid stimulus 0.227188263
GO:0016759 cellulose synthase activity 0.227676876
GO:0015979 photosynthesis 0.236033707
GO:0016798 hydrolase activity, acting on glycosyl bonds 0.244053405
GO:0007568 aging 0.25174476
GO:0030246 carbohydrate binding 0.25174476
GO:0004553 hydrolase activity, hydrolyzing O-glycosyl compounds 0.256198872
GO:0009617 response to bacterium 0.259116363

199
GO:0046910 pectinesterase inhibitor activity 0.259116363
GO:0006457 protein folding 0.261498043
GO:0016298 lipase activity 0.262684891
GO:0009733 response to auxin stimulus 0.264890113
GO:0046686 response to cadmium ion 0.266176616
GO:0009793 embryonic development (sensu Magnoliophyta) 0.27266645
GO:0009624 response to nematode 0.276201125
GO:0003755 peptidyl-prolyl cis-trans isomerase activity 0.282518525
GO:0004194 pepsin A activity 0.282518525
GO:0015297 antiporter activity 0.282518525
GO:0004185 serine carboxypeptidase activity 0.288552517
GO:0005875 microtubule associated complex 0.299800436
GO:0016829 lyase activity 0.299800436
GO:0000074 regulation of progression through cell cycle 0.302446927
GO:0006857 oligopeptide transport 0.312397635
GO:0003777 microtubule motor activity 0.314730821
GO:0009739 response to gibberellic acid stimulus 0.323470812
GO:0009543 thylakoid lumen (sensu Viridiplantae) 0.325511701
GO:0009055 electron carrier activity 0.334891035
GO:0009826 unidimensional cell growth 0.339885953
GO:0009723 response to ethylene stimulus 0.356567403
GO:0009058 biosynthesis 0.361822218
GO:0009753 response to jasmonic acid stimulus 0.363931379
GO:0008234 cysteine-type peptidase activity 0.364561468

200
Table S4.3: Recovered phenotypes of mtn1-1mtn2-1 over three generations of Spd supplementaion
Generational nomenclature is as shown in Figure S 4.6. (N = 8).
Phenotype Naïve /
-Spd G1
+ Spd G1 +SpdG2 +SpdG3 WT
Vegetative phase phenotypes
Delayed first true leaf development /
Interveinal chlorosis
Abnormal rosette leaves
Reproductive phase phenotypes
Delayed bolting
Twisting
Bushy
Altered phyllotaxy
Fasciation
Altered stem vasculature
Abnormal flowers/ buds /
Sterility * ** *** ***
Indehiscent anthers /
Delayed senescence
* Occasionally have around 5 seeds/ plant; develop few embryos b ut abort at globular stage;
** First flowers are sterile but some branches or sector s of branches develop siliques
*** First flowers develop siliques.
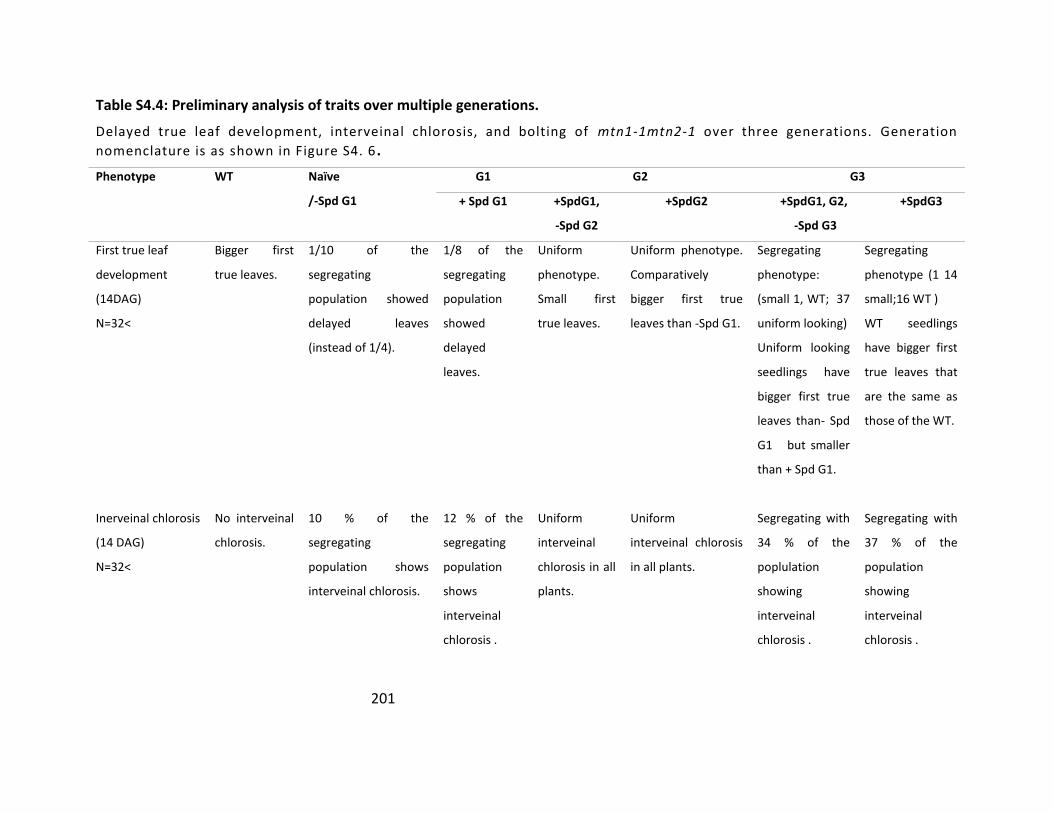
201
Table S4.4: Preliminary analysis of traits over multiple generations.
Delayed true leaf development, interveinal chlorosis, and bolting of mtn1-1mtn2-1 over three generations. Generation
nomenclature is as shown in Figure S4. 6 .
Phenotype WT Naïve
/-Spd G1
G1 G2 G3
+ Spd G1 +SpdG1,
-Spd G2
+SpdG2 +SpdG1, G2,
-Spd G3
+SpdG3
First true leaf
development
(14DAG)
N=32<
Bigger first
true leaves.
1/10 of the
segregating
population showed
delayed leaves
(instead of 1/4).
1/8 of the
segregating
population
showed
delayed
leaves.
Uniform
phenotype.
Small first
true leaves.
Uniform phenotype.
Comparatively
bigger first true
leaves than -Spd G1.
Segregating
phenotype:
(small 1, WT; 37
uniform looking)
Uniform looking
seedlings have
bigger first true
leaves than- Spd
G1 but smaller
than + Spd G1.
Segregating
phenotype (1 14
small;16 WT )
WT seedlings
have bigger first
true leaves that
are the same as
those of the WT.
Inerveinal chlorosis
(14 DAG)
N=32<
No interveinal
chlorosis.
10 % of the
segregating
population shows
interveinal chlorosis.
12 % of the
segregating
population
shows
interveinal
chlorosis .
Uniform
interveinal
chlorosis in all
plants.
Uniform
interveinal chlorosis
in all plants.
Segregating with
34 % of the
poplulation
showing
interveinal
chlorosis .
Segregating with
37 % of the
population
showing
interveinal
chlorosis .
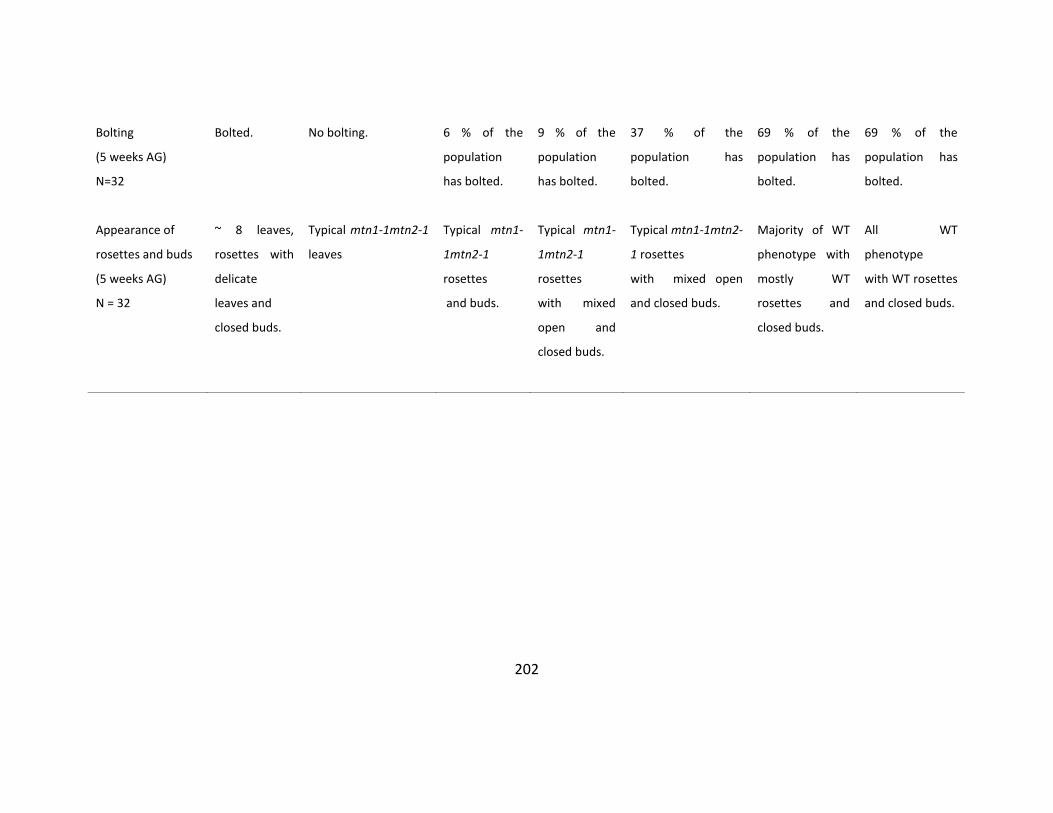
202
Bolting
(5 weeks AG)
N=32
Bolted. No bolting. 6 % of the
population
has bolted.
9 % of the
population
has bolted.
37 % of the
population has
bolted.
69 % of the
population has
bolted.
69 % of the
population has
bolted.
Appearance of
rosettes and buds
(5 weeks AG)
N = 32
~ 8 leaves,
rosettes with
delicate
leaves and
closed buds.
Typical mtn1-1mtn2-1
leaves
Typical mtn1-
1mtn2-1
rosettes
and buds.
Typical mtn1-
1mtn2-1
rosettes
with mixed
open and
closed buds.
Typical mtn1-1mtn2-
1 rosettes
with mixed open
and closed buds.
Majority of WT
phenotype with
mostly WT
rosettes and
closed buds.
All WT
phenotype
with WT rosettes
and closed buds.

203
Chapter 5: Significant contributions and future directions
The complex nature of traits associated with the mtn1-1mtn2-1 phenotype made determining
the function of MTN extremely complicated. However, the research work presented in this
thesis has provided directions to unravel the key targets and fundamental traits of MTN
deficiency. My significant contributions to this project are as follows:
1. The identification of interveinal chlorosis in this mtn1-1mtn2-1 was the first significant
contribution, which led to the realization that this pleiotropic phenotype is due to
disturbed MTA metabolism rather than solely to disrupted PA homeostasis, as was
concluded by our German collaborators at that time.
2. Since mtn1-1mtn2-1 is sterile, the homozygous mutants needed to be recovered from
the segregation populations of MTN1mtn1-1/mtn2-1mtn2-1, or
mtn1-1mtn1-1/MTN2mtn2-1. As a result, the type and number of experiments that
could be conducted using this mutant were limited. I discovered a very simple and early
development marker of mtn1-1mtn2-1: delayed development of the first true leaves.
The use of this marker greatly facilitated the choice of the types of experiments in which
these mutants could be used.
3. Meticulous analysis of the traits of the mutant allowed the delineation of the important
traits that could be traced back to an individual pathway affected by inefficient MTA
metabolism. Examples of these connections are interveinal chlorosis with NA-deficiency
and xylem proliferation defects with Tspm deficiency.
4. The observations of the increased number of leaves, the bushy architecture, the altered
phyllotaxy, the fasciation, and the altered vasculature led to the speculation that this
mutant has auxin imbalances. Auxin transport assays showed that the mtn1-1mtn2-1

204
has a reduced ability to transport auxin. This conclusion was further supported by
experiments conducted with an auxin sensitive reporter, DR5rev:: GFP, and by the
hormone profiles of the organs.
5. Analysis of the series of MTN-deficient mutants developed in collaboration with other
Moffatt lab members revealed that delayed bolting is a trait that is fundamental to MTN
deficiency. In these mutants, a tight correlation was noted between the time of the
bolting and the number of leaves at bolting. This increase in the number of leaves and
the corresponding increase in the number of vascular bundles suggest changes in the
auxin maxima as the most likely fundamental defect associated with disturbed MTA
metabolism.
6. Most importantly, I discovered a means of making the sterile mtn1-1mtn2-1 plants
fertile, using a method in which exogenous Spd was applied daily. The seedlings that
were grown for only 14 days on media supplemented with Spd could recover partial
fertility three to four weeks after bolting. This finding has opened a whole new area of
investigation of the possible links between Spd, eIF5A, and the endomembrane system.
7. During the period that I conducted research in Japan, it was discovered that the mtn1-
1mtn2-1 seeds generated by the exogenous Spd supply were able to generate
phenotypically WT progeny that were genotypically mtn1-1mtn2-1. My supervisor, Prof.
Barb Moffatt discovered the same effects independently at the same time, when she
was on sabbatical in Germany.
Together with all the evidence gathered during the research for this thesis and the findings
reported in the related literature, these significant findings support a holistic view of MTN
functions in plant growth and development which is presented as a model in Figure 5.1

205
Figure 5.1: A model that explains the holistic view of MTN functions in plant growth and
development

206
The mtn1-1mtn2-1 double mutant with knocked down MTN1 and MTN2 resulted in a 14 % level
of residual MTN activity and a two to five fold increase in the MTA content in the mutants. The
accumulated MTA likely inhibits NA synthase, Spd synthase, Spm synthase, Tspm synthase, and
ACC synthase activities. The result is a reduction in the levels of all the products of these
enzymatic reactions, such as NA, Spd, Spm, Tspm, and ethylene. Reduced NA limits metal
transport, which leads to interveinal chlorosis and low seed production. Reduced Tspm causes
premature xylem differentiation. Finally, but most importantly, reduced Spd causes embryo
lethality and reduced hypusination of eIF5A. Interestingly, mtn1-1mtn2-1 mutants share
sterility and delayed scenecence in common with suppression of DHS activity (the first step of
hypusinating eIF5A; Wang et al., 2003, 2005) and increased xylogenesis with overexpression of
eIF5A1 (Liu et al., 2008). Both these phenotypes are possibly due to accumulation of
unhypusinated eIF5A as suggested by (Liu et al., 2008). Here I propose eIF5A as the possible
link to auxin distribution via the disruption of the PIN proteins and the components of the
endomembrane system. Current feedback models for polarized auxin transport have already
incorporated the localization of PIN proteins at the plasma membranes to Tsvi Sachs theoretical
canalization hypothesis (auxin flux directs the auxin transport (Wabnik et al., 2011). Thus a
positive feedback between the auxin flux and PIN localization determines the rate and direction
of the polar auxin transport. Thus in the mtn1-1mtn2-1 mutant altered auxin gradients resulting
from reduced PAT, either due to mislocalization of the PINs or due to altered vascular
development, led to phenotypes such as short and bushy shoot architecture, altered phyllotaxy
and fasciation, increased number of leaves, cuticle defects, and twisting. Reduction in ethylene
may be the basis of the delayed senescence. Although the majority of this model is supported
by the evidence presented in this thesis, further validation is necessary.
A comprehensive analysis of vascular development is necessary to narrow down the vascular
defects caused either by (1) altered auxin distribution together with brassinosteroids, (2) H2O2

207
produced during PA catabolism, or (3) Tspm deficiency. The first step is to determine the most
initial time point and development stage that is affected by MTN deficiency. This could be
achieved by the study of a time course, including embryo sac formation, embryogenesis, and
seed germination, until the seedlings are 14 days old. Utilizing vascular markers (ATHB8::YFP)
will enable the detection of the vascular formation while the auxin responsive marker
(DR5rev::GFP) will provide a visual representation of auxin distribution.
After the time and development stage of the first deformed vascular defect in mtn1-1mtn2-1
have been established, it is necessary to determine the involvement of Tspm and H2O2 in these
stages. To explore the involvement of H2O2 in xylem differentiation, H2O2 production could be
visualized using the cell-permeable H2O2-specific dye dichlorofluorescein diacetate (DCFA-DA)
or DAB. A parallel study could also be carried out using the Tspm-sensitive SAC51::GUS lines
and Tspm-deficient tkv mutant along with the determination of the Tspm sensitive gene
expression (ACL5, ATHB8, PHB and SAC51) levels. Once the potential cause is confirmed, it is
necessary to determine which aspect of xylem differentiation is affected in these mutants and
whether these aspects could be reversed through feeding with exogenous Spd.
To study the proposed involvement of eIF5A, that could link Spd to the endomembrane system,
it is first necessary to determine whether the mtn1-1mtn2-1 seedlings grown for 14 days on Spd
have recovered WT levels of activated eIF5A. A parallel analysis of a mutant, with a mutation in
the gene enording for deoxyhypusine synthase (dhs), which is incapable of activating the
inactive eIF5A could also be beneficial, if such a mutant is available. Comparing this mutant
phenotype to that of mtn1-1mtn2-1 and studying whether the endomembrane system has
been affected in these mutants, either directly using PIN-mEosFP (Dhonukshe et al., 2007) or
indirectly using a lipid-binding, endocytic tracer (FM4-64; Vida and Emr, 1995), is vital in order
to determine whether this link is a possibility. If the possibility is confirmed, then a yeast-two-

208
hybrid study can be conducted using eIF5A as bait in order to recover the potential candidates.
If the model proposed in this thesis is accurate, it is expected that the PIN proteins and BR1
receptors would be among the potential candidates that interact with eIF5A. It would then be
necessary to visualize the localization of the PIN proteins tagged with GFP and possibly the
membrane localization of other proteins (BR1, brassinosteroid transporter or YSL1, Yellow strip-
like NA transporter) in order to show whether the endomembrane system is affected in a PIN
protein-specific or in a general manner.
The MTN-deficient mutant with the disrupted MTA metabolism, coupled with the current and
proposed work described in this thesis has the potential to reveal the molecular basis of PA, NA,
and auxin in the vascular development and transport of nutrients and signal molecules. This
fundamental work has the potential to be applied in the engineering of crop plants so as to
enhance the efficiency of nutrient use and increase yield. As a result, these findings will
ultimately lead to decreased fertilizer use in crop cultivation, which will reduce costs and
prevent environmental damage.

209
Appendix 1
A. MTN activity
Plant #, replicate # WT mtn1-1mtn2-1
1, 1 1.081 0.146
1, 2 0.769 0.136
1, 3 0.721 0.185
2, 1 1.198 0.185
2, 2 1.208 0.195
2, 3 1.052 0.107
3, 1 1.188 0.205
3, 2 1.276 0.205
3, 3 1.403 0.136
Mean 1.1 0.167
SD 0.226 0.036
B. MTA Content
Plant # Leaves Inflorescences
WT mtn1-1mtn2-1 WT mtn1-1mtn2-2
1 1.17 2.01 4.61 22.52
2 0.43 2.09 4.06 25.89
3 0.86 1.61 5.15 18.02
4 0.74 1.06 4.07 30.14
5 0.7 1.67 5.02 22.53
Mean 0.8 1.7 4.6 23.8
SD 0.3 0.4 0.5 4.5
C. NA Content
Plant # Leaves Inflorescences
WT mtn1-1mtn2-1 WT mtn1-1mtn2-1
1 32.86 0 273.87 78.15
2 89.35 0 211.26 107.04
3 105.05 0 318.3 91.44
4 157.53 0 5 145.03 0
105.96 0 267.81 92.21
49.51 0 53.77 53.54

210
D. Polyamine content
Polyamine Plant # Leaves Inflorescences
WT mtn1-1mtn2-1 WT mtn1-1mtn2-2
PUT 1 21.06 71.55 70.64 96.50
2 23.33 25.38 46.67 71.56
3 5.77 11.17 26.36 57.48
4 3.22 4.20 21.60 41.19
Mean 13.35 28.07 41.32 66.68
SD 10.31 30.30 22.37 23.44
SPD 1 336.42 188.74 431.23 140.96
2 334.58 72.62 383.57 177.76
3 53.45 25.53 183.54 123.83
4 58.65 30.34 162.10 123.38
Mean 195.78 79.31 290.11 141.48
SD 161.36 75.96 137.10 25.53
SPM 1 22.03 13.45 65.67 33.50
2 28.13 10.93 66.35 28.18
3 21.35 20.27 33.82 31.79
4 19.00 47.21 41.78
Mean 23.84 15.91 53.26 33.81
SD 3.73 4.45 15.70 5.76
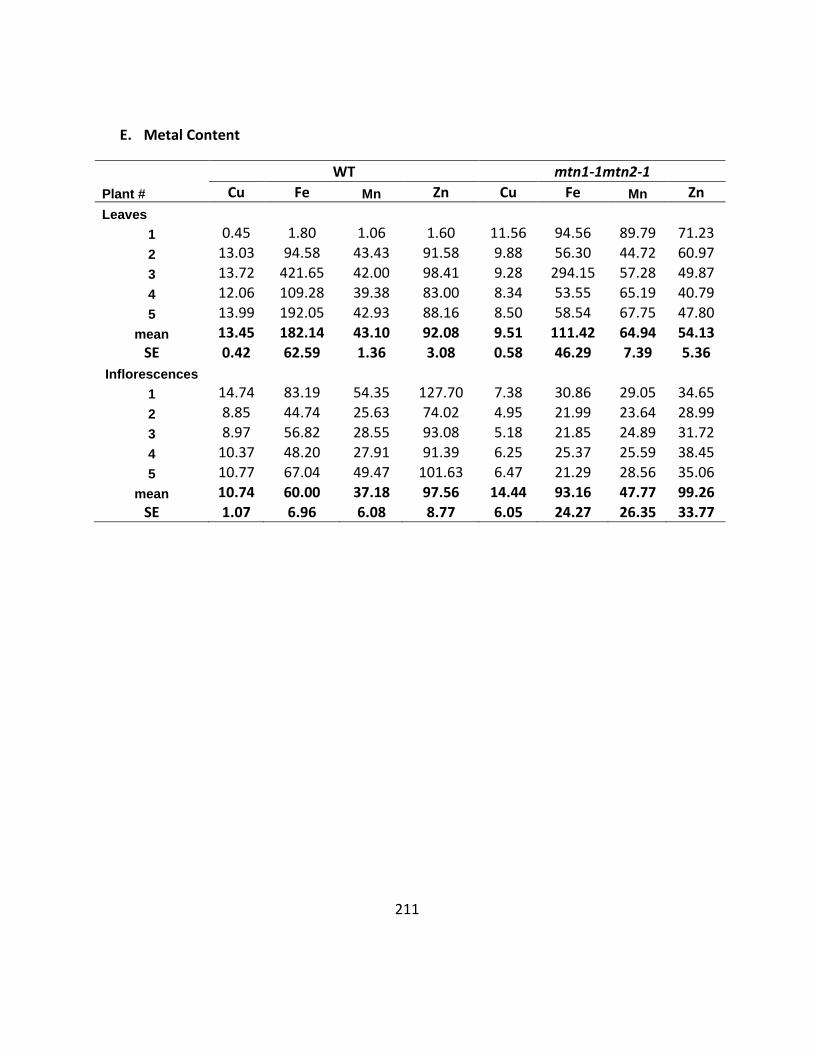
211
E. Metal Content
WT mtn1-1mtn2-1
Plant # Cu Fe Mn Zn Cu Fe Mn Zn
Leaves
1 0.45 1.80 1.06 1.60 11.56 94.56 89.79 71.23
2 13.03 94.58 43.43 91.58 9.88 56.30 44.72 60.97
3 13.72 421.65 42.00 98.41 9.28 294.15 57.28 49.87
4 12.06 109.28 39.38 83.00 8.34 53.55 65.19 40.79
5 13.99 192.05 42.93 88.16 8.50 58.54 67.75 47.80
mean 13.45 182.14 43.10 92.08 9.51 111.42 64.94 54.13
SE 0.42 62.59 1.36 3.08 0.58 46.29 7.39 5.36
Inflorescences
1 14.74 83.19 54.35 127.70 7.38 30.86 29.05 34.65
2 8.85 44.74 25.63 74.02 4.95 21.99 23.64 28.99
3 8.97 56.82 28.55 93.08 5.18 21.85 24.89 31.72
4 10.37 48.20 27.91 91.39 6.25 25.37 25.59 38.45
5 10.77 67.04 49.47 101.63 6.47 21.29 28.56 35.06
mean 10.74 60.00 37.18 97.56 14.44 93.16 47.77 99.26 SE 1.07 6.96 6.08 8.77 6.05 24.27 26.35 33.77
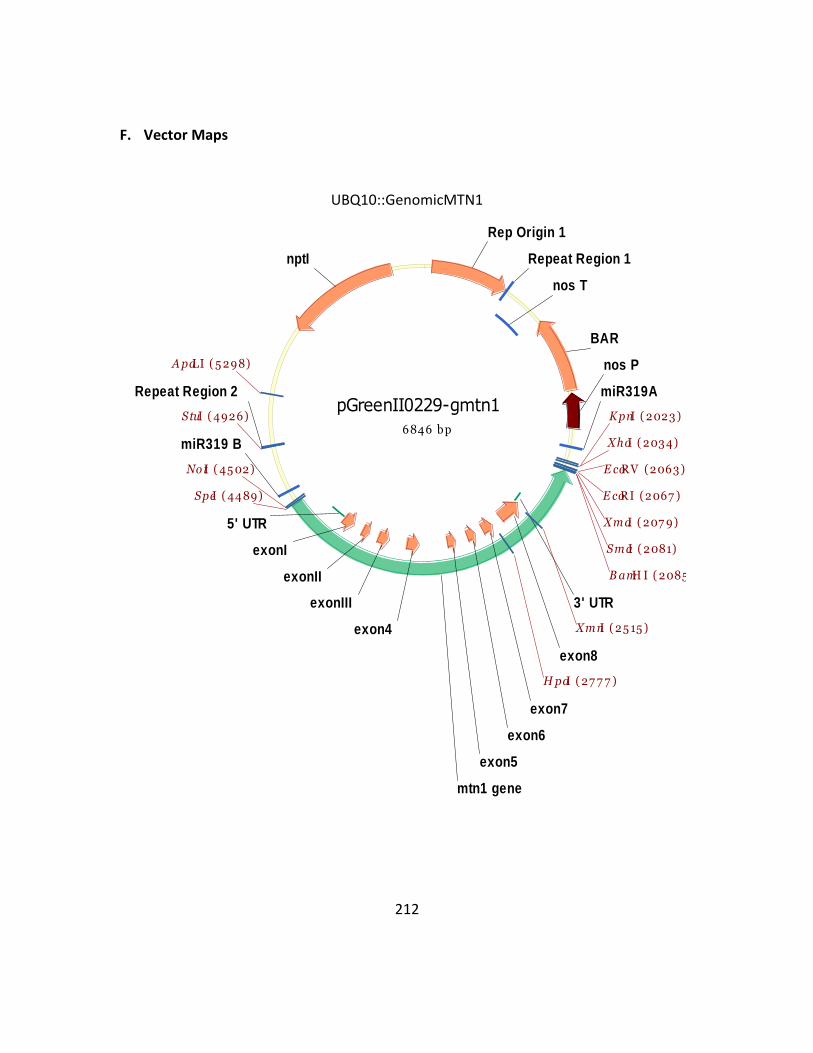
212
F. Vector Maps
UBQ10::GenomicMTN1
pGreenII0229-gmtn1
6846 bp
nptI
BAR
mtn1 gene
miR319A
miR319 B
nos P
Rep Origin 1
Repeat Region 1
Repeat Region 2
nos T
3' UTR
5' UTR
exonI
exonII
exonIII
exon4
exon5
exon6
exon7
exon8
ApaLI ( 5 298)
BamH I ( 2085 )
E coRI (2067 )
SmaI ( 2081)
XmaI ( 207 9)
E coRV (2063 )
KpnI ( 2023 )
XmnI ( 25 15 )
NotI ( 45 02)
XhoI ( 203 4)
SpeI ( 4489)
HpaI ( 27 7 7 )
StuI ( 4926)

213
UBQ10::MTN1CDS
pSAT5.UBQ10p-mtn1-1 CDS-nosT
4491 bp
Amp
mtn1-1 CDS
nopaline synthase terminator
UBQ10p
I-CeuI
I-CeuI
Ava I (1138)
Bam HI (1950)
Cla I (1403)
Sma I (1140)
Xma I (1138)
Age I (426)
Sac I (743)

214
UBQ10::hMTAP
pSAT5.UBQ10p-hMTAP-nosT
4536 bp
Amp
hMTAP
nopaline synthase terminator
UBQ10p
I-CeuI
I-CeuI
Ava I (1677)
BamHI (1995)
Sma I (1679)
XmaI (1677)
AgeI (427)
Sac I (744)

215
pSAT5.UBQ10p-nosT
pSAT5.UBQ10p-nosT
3683 bp
Am p
nopaline synthase te rminator
UBQ10p
I-CeuI
I-CeuI
Ava I (1138)
BamHI (1142)
Sma I (1140)
XmaI (1138)
Age I (426)
Sac I (743)
BglII (1055)
Bsa AI (638)
KpnI (1131)
NdeI (185)
Not I (1421)
Sal I (488)

216
pSAT5.nosP.RNAi.nosT
pSAT5.nosP.RNAi.nosT
46 78 bp
bla
CHSA intron
Misc Feature 1
Misc Feature 2
nosP
nosT
I-CeuI
I-CeuI
BamH I (2137)
EcoR I (752)
Nco I (717)
Pst I (2115)
Sma I (2135)
Xma I (2133)
Ava I (736)
Ava I (2133)
HindIII (74 5)
HindIII (1256)
Apa LI (178)
Apa LI (3113)
Apa LI (4 359)

217
pPZP-RCS2-BAR (904)
904
8627 bpBAR
Spect
LB
RB
ocsA
PI-TilI
904 LR
ocsP
ocsT
I-PpoI
I-SceI
I-CeuI
PI-PspI
Cla I (5571) EcoRI (2133)
HindIII (196)
Pst I (247)
EcoRV (386)
Sac I (367)
Spe I (1359)
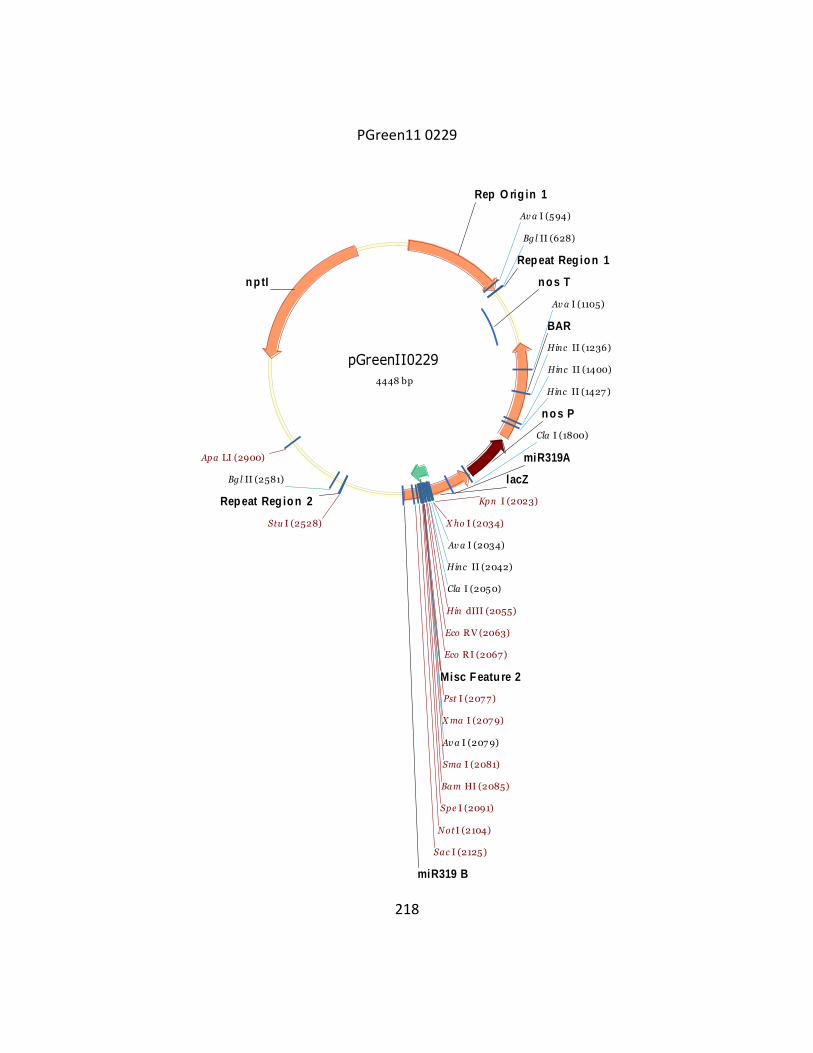
218
PGreen11 0229
pGreenII0229
4448 bp
n p tI
BAR
lacZ
Misc F eatu re 2
miR319A
miR319 B
n o s P
Rep O rig in 1
Rep eat Reg io n 1
Rep eat Reg io n 2
n o s T
Apa LI (2900)
Bam HI (2085)
Eco R I (2067)
Hin dIII (2055)
Pst I (207 7)
Sma I (2081)
Xma I (207 9)
Sac I (2125)
Eco R V (2063)
Kpn I (2023)
Not I (2104)
X ho I (2034)
Spe I (2091)
Stu I (2528)
Cla I (1800)
Cla I (2050)
Bgl II (628)
Bgl II (2581)
Ava I (594)
Ava I (1105)
Ava I (2034)
Ava I (207 9)
Hinc II (1236)
Hinc II (1400)
Hinc II (1427 )
Hinc II (2042)

219
Appendix 2
A. MTN genes
Vector NTI diagrams of gene models
At4g38800 (MTN1) 2800 bp
mtn1-4b R
3'UTR 5' UTR
Ex1
Ex2
Ex3
Ex4
Ex5 Ex6
Ex7 mtn1-4b F
mtn1-1 L
mtn1-1R

220
MTN1-Gene sequence and location of T-DNA inserts
At4g34840 (MTN2)
2800 bp
mtn2-1 L
mtn2-5 Rd
3' UTR
5'UTR
Ex1
Ex2
Ex3 Ex4
Ex5
Ex6
Ex7
Ex 8
mtn2-1R
mtn2-5 Lc

221
mtn1-1 (SALK_ 085385) sequence with LBb1.3
NNNNNNNNNNNCNNGGNNNNNNNGCGTGGNNCGCTTGCTGNNNTCTCTCAGGGCCAGGCGGTGAANNNNNNNNAGCTGTTGCCCGTCTCACTGGTGA
AAAGAAAAACCACCCCANTACATTAAAAACGTCCGCAATGTGTTATTAAGTTGCTAAGCGTCAATTTGTCCGCAGCGACTTGAGAAACCAAAG
CTACTATACTAAAATGCTGAGAGATTCACAGGCTAATTATCATATCTTTGAGAGCATTGAGTGCAAAGCTTACCTAAAGCTGCATCTCTTCCG
GGGCAAACTACATTGATTCGAAGATCTTTATGCACGCCGTGATACAGAACCCAGGGCAATCCTTTACCAAGCCTGCAAAAAAGTAAACTTTGA
AGTGAGAGATTCATGGAGATCAAATCCAAACAAGCAAAATCGAAAAAAGG
mtn1-4 (SALK_088214)sequence with LBb1.3
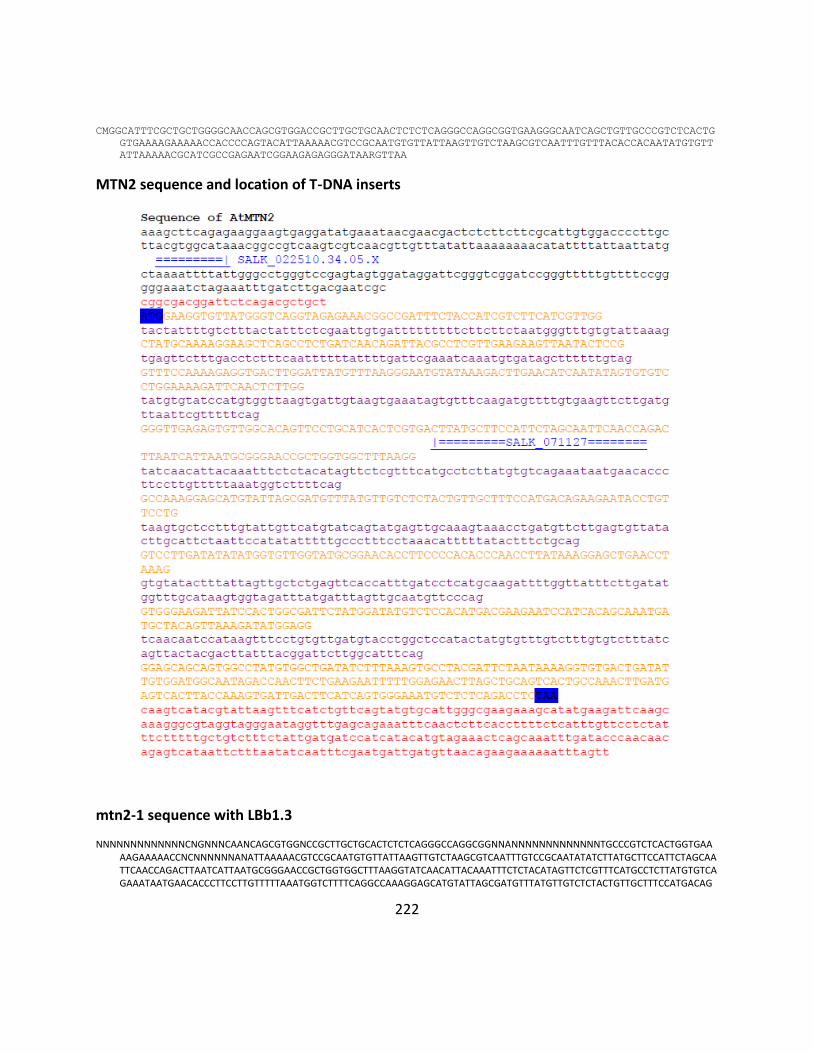
222
CMGGCATTTCGCTGCTGGGGCAACCAGCGTGGACCGCTTGCTGCAACTCTCTCAGGGCCAGGCGGTGAAGGGCAATCAGCTGTTGCCCGTCTCACTG
GTGAAAAGAAAAACCACCCCAGTACATTAAAAACGTCCGCAATGTGTTATTAAGTTGTCTAAGCGTCAATTTGTTTACACCACAATATGTGTT
ATTAAAAACGCATCGCCGAGAATCGGAAGAGAGGGATAARGTTAA
MTN2 sequence and location of T-DNA inserts
mtn2-1 sequence with LBb1.3
NNNNNNNNNNNNNCNGNNNCAANCAGCGTGGNCCGCTTGCTGCACTCTCTCAGGGCCAGGCGGNNANNNNNNNNNNNNNTGCCCGTCTCACTGGTGAAAAGAAAAACCNCNNNNNNANATTAAAAACGTCCGCAATGTGTTATTAAGTTGTCTAAGCGTCAATTTGTCCGCAATATATCTTATGCTTCCATTCTAGCAATTCAACCAGACTTAATCATTAATGCGGGAACCGCTGGTGGCTTTAAGGTATCAACATTACAAATTTCTCTACATAGTTCTCGTTTCATGCCTCTTATGTGTCAGAAATAATGAACACCCTTCCTTGTTTTTAAATGGTCTTTTCAGGCCAAAGGAGCATGTATTAGCGATGTTTATGTTGTCTCTACTGTTGCTTTCCATGACAG

223
AAGAATACCTGTTCCTGTAAGTGCTCCTTTGTATTGTTCATGTATCAGTATGAGTTGCAAAGTAAACCTGATGTTCTTGAGTGTTATACTTGCATTCTAATTCCATATATTTTGCCCCTTTCCN
mtn2-5 sequence with LBb1.3
ATGATCGCTGCTGGGGCAACCAGCGTGGACCGCTTGCTGCAACTCTCTCAGGGCCAGGCGGTGAAGGGCAATCAGCTGTTGCCCGTCTCACTGGTGAAAAGAAAAACCACCCCAGTACATTAAAAACGTCCGCAATGTGTTATTAAGTTGTCTAAGCGTCAATTTGTTTATGCCACGTAAGCAAGGGGTCCACAATGCGAAGAAGAGAGTCGTTCGTTATTTCATATCCTCACTTCCTTCTCTGAAGCTTTATCCTCTAATCGTTTTCTCTCTAAGCCTCTCCAATGGAGGTTACCTCCACCACCTTCATCTCCACTACCAGATCTTCTAAATACCTTACCTTAACTTCGTACTCTCCGGTGATTCTTCCGGCTTCTACTCTCCGCCGTGATTTTCTTGGTTGTTGTCATAGTCTCCGTCCTTCTCCTCATCTTCGAACTCGCGCCGGGAAACGCAATTCTCGTCGTTCTTCAATTCGATCGCCTCGTTTAGTTGTTAGAGCTTCTATCGATTCTGGTTTGATTCTTATTGTTGTTGCTGTCACTGCGTTCTCTGCCATTGCTTTCGCTTATTGCCAAAGTACTTTCAGGAASGG

224
B. Number of rosette leaves
DAG Plant # Mean
WT
1 2 3 4 5 6 7 8
21 10 12 11 10 11 12 10 11 11
35 18 25 25 14 18 16 20 20 20
42 20 26 28 16 19 17 22 25 22
mtn1-4mtn2-1 1 2 3 4 5 6 7 8
21 12 10 9 10 12 10 12 11
28 16 13 12 13 16 13 16 15 14
35 19 23 18 20 25 21 19 28 22
42 25 25 24 26 29 28 26 32 27
mtn1-1mtn2-5 1 2 3 4 5 6 7 8
21 12 11 10 10 14 12 11 10 11
28 16 15 13 13 19 16 15 13 15
35 27 20 20 22 26 20 19 22 22
42 28 22 24 24 28 23 23 24 25
mtn1-1mtn2-1 1 2 3 4 5
21 8 8 8 8 9
8
35 12 15 10 11 10
12
42 19 18 12 18 16
17
49 22 20 20 21 19
20
59 26 24 24 25 22
24
ami 5.3
1 2 3 4 5 6
21 9 9 10 8 10 10
9
35 14 16 13 10 10 11
12
42 22 24 27 14 18 21
21
49 24 26 28 22 21 23
24
59 29 31 34 26 25 28
29
ami2.8
1 2 3 4 5 6 7 8
21 11 12 10 9 12 10 9 8 10
28 15 16 13 12 16 13 12 11 14
35 20 27 20 15 21 22 25 18 21
42 22 31 28 18 25 28 31 26 26

225
C. Percent Bolting
DAG
WT
mtn1-4 mtn2-1
mtn1-1 mtn2-5
mtn1-1 mtn2-1
ami 5.3
ami 2.8
16 0 0 0 0 0 0 18 80 0 0 0 0 0 21 100 15 0 0 0 6 25 100 88 47 74 10 20 28 100 100 97 84 10 93 35 100 100 97 84 45 93 37 100 100 97 87 45 100 40 100 100 100 87 48 100 42 100 100 100 87 55 100 44 100 100 100 90 55 100 47 100 100 100 94 61 100 49 100 100 100 94 65 100 52 100 100 100 94 68 100 54 100 100 100 94 71 100 56 100 100 100 97 71 100 59 100 100 100 100 71 100 N 19 32 32 31 31 15
D. Number of leaves at bolting
# of days to bolt
21
28
28
59
59<
28
Plant # WT
mtn1-4 mtn2-1
mtn1-1 mtn2-5
mtn1-1 mtn2-1
ami5.3
ami 2.8
1 10 16 16 26 29 14 2 12 13 15 24 31 15 3 11 12 13 24 34 16 4 10 13 13 25 26 13 5 11 16 19 22 25 12 6 12 13 16 . 28 16 7 10 16 15 . . 13 8 11 15 13 . . 12
Mean 11 14 15 24 29 14 SD 1 2 2 1 3 2

226
E. Percent senescence
DAG
WT
mtn1-4 mtn2-1
mtn1-1 mtn2-5
mtn1-1 mtn2-1
ami 5.3
ami 2.8
42 25 13 0 0 0 0 44 75 25 0 0 0 13 47 88 63 14 0 36 50 49 88 88 71 60 55 100 52 100 100 100 80 73 100 54 100 100 100 100 91 100 56 100 100 100 100 100 100 N 8 8 7 5 11 8
F. Bundles per unit area
Plant #
Area (cm2)
# of bundles
Bundles/ area
Bundles / area
WT 1 6.38 8.00 1.25 Mean SD
2 6.62 6.00 0.91
3 7.61 6.00 0.79
4 5.51 8.00 1.45 1.10 0.31
mtn1-4mtn2-1 1 5.67 8.00 1.41
2 5.90 6.00 1.02
3 5.64 6.00 1.06
4 4.63 8.00 1.73 1.30* 0.33 mtn1-1mtn 2-5 1 10.94 10.00 0.91
2 7.69 7.00 0.91
3 8.35 7.00 0.84
4 11.29 10.00 0.89 0.89* 0.03 mtn1-1mtn2-1 1 11.40 11.00 0.96
2 10.69 12.00 1.12
3 9.65 10.00 1.04
4 10.23 14.00 1.37 1.12 0.18 ami5.8 1 8.78 8.00 0.91
2 7.57 9.00 1.19
3 7.14 8.00 1.12 1.07 0.14 ami2.8 1 6.68 11.00 1.65
2 5.50 6.00 1.09
3 5.41 7.00 1.30
4 6.06 11.00 1.81 1.46* 0.33

227
Paired Samples Test
Paired Differences
t df Sig. (2-tailed) Mean
Std. Deviation
Std. Error Mean
95% Confidence Interval of the Difference
Lower Upper
Pair 1
WT - MTN1421 -.2046
.08404 .04202 -.3383 -.0708 -
4.868 3 .017
Pair 2
WT - AMI2.8 -.3609
.13331 .06666 -.5730 -.1487 -
5.414 3 .012
Pair 3
WT - MTN1125 .2135 .29336 .14668 -.2533 .6803 1.456 3 .242
Pair 4
WT - MTN1121 -.0223
.25636 .12818 -.4302 .3856 -.174 3 .873
Pair 5
MTN1421 - AMI2.8
-.1563
.08931 .04465 -.2984 -.0142 -
3.501 3 .039
Pair 6
MTN1421 - MTN1125
.4181 .32692 .16346 -.1021 .9383 2.558 3 .083
Pair 7
MTN1421 - AMI5.3
.0901 .35840 .20692 -.8002 .9804 .435 2 .706
Pair 8
MTN1421 - MTN1121
.1823 .26290 .13145 -.2361 .6006 1.387 3 .260
Pair 9
AMI2.8 - MTN1125
.5744 .32620 .16310 .0553 1.0934 3.522 3 .039
Pair 10
AMI2.8 - AMI5.3
.2702 .42463 .24516 -.7847 1.3250 1.102 2 .385
Pair 11
AMI2.8 - MTN1121
.3386 .30123 .15062 -.1408 .8179 2.248 3 .110
Pair 12
MTN1125 - AMI5.3
-.1862
.16327 .09426 -.5918 .2193 -
1.976 2 .187
Pair 13
MTN1125 - MTN1121
-.2358
.17978 .08989 -.5219 .0503 -
2.623 3 .079
Pair 14
AMI5.3 - MTN1121
.0327 .07490 .04324 -.1534 .2187 .755 2 .529

228
G. Segregation analysis of MTN1mtn1-4mtn2-1mtn2-1
Plant # Silique # Total Homo(-/-) Het (-/+) Homo(+/+)
1 1 38 9 17 12
2 60 11 28 21
3 59 17 29 13
0
2
1 45 19 23 3
2 43 7 24 12
3 21 6 9 6
0
3
1 52 20 22 10
2 54 19 20 15
3 48 7 27 14
SUM 420 115 199 106
Observed Expected (Exp-Obs)2/Exp
Homo (-/-) 115 105 0.95
Het (+/-) 199 210 0.58
Homo(+/+) 106 105 0.01
SUM 420 420
Chi
square 1.54
Number of doubles per / total
4
H. Segregation analysis of mtn1-1mtn1-1MTN2mtn2-5(#1) and MTN1mtn1-1mtn2-5mtn2-
5(#2)
plant # Silique # Total Homo (-/-) Het (-/+) 2-5 (+/+)
1 1 52 13 21 18
2 54 16 23 15
3 50 12 36 2
2 1 24 6 14 4
2 45 14 18 13

229
3 27 4 17 6
SUM 252 65 129 58
Observed Expected (Exp-Obs)2/Exp
Homo (-/-) 65 63 0.06
Het (+/-) 129 126 0.07
Homo(+/+) 58 63 0.40
SUM 252 252 0.53
Chi
square
0.53175
Number of doubles per / total
4
I. Segregation analysis of mtn1-1mtn1-1MTN2mtn2-1
Plant
#
Silique
#
Total +
aborted
2-1 Homo
(-/-)
2-1 Het
(-/+)
2-1
(+/+)
Abort
ed
tot
al
1 1 29 4 11 12 2 27
1 2 25 4 7 11 3 22
1 3 23 2 15 3 3 20
Sums 77 10 33 26 8 69
Observed Expected (Exp-Obs)2/Exp
Homo (-/-) 10 17.25 3.05
Het (+/-) 33 34.5 0.07
Homo(+/+) 26 17.25 4.44
SUM 69 69 7.55
Ch
i
sq
ua
re
Number of doubles per /
total
14

230
J. Segregation based on silique observations
mtn 1-4 mtn2-1
Plant Silique Total Mutants
1 1 59 0
2 63 0
3 58 0
4 57 0
5 61 0
6 62 0
7 64 0
8 61 0
2 1 54 0
2 43 0
3 53 0
4 59 0
5 53 0
6 46 0
7 51 0
8 59 0
3 1 59 0
2 60 0
3 63 0
4 60 0
5 50 0
6 59 0
7 63 0
8 60 0
9 59 0
TOTAL
1436 0
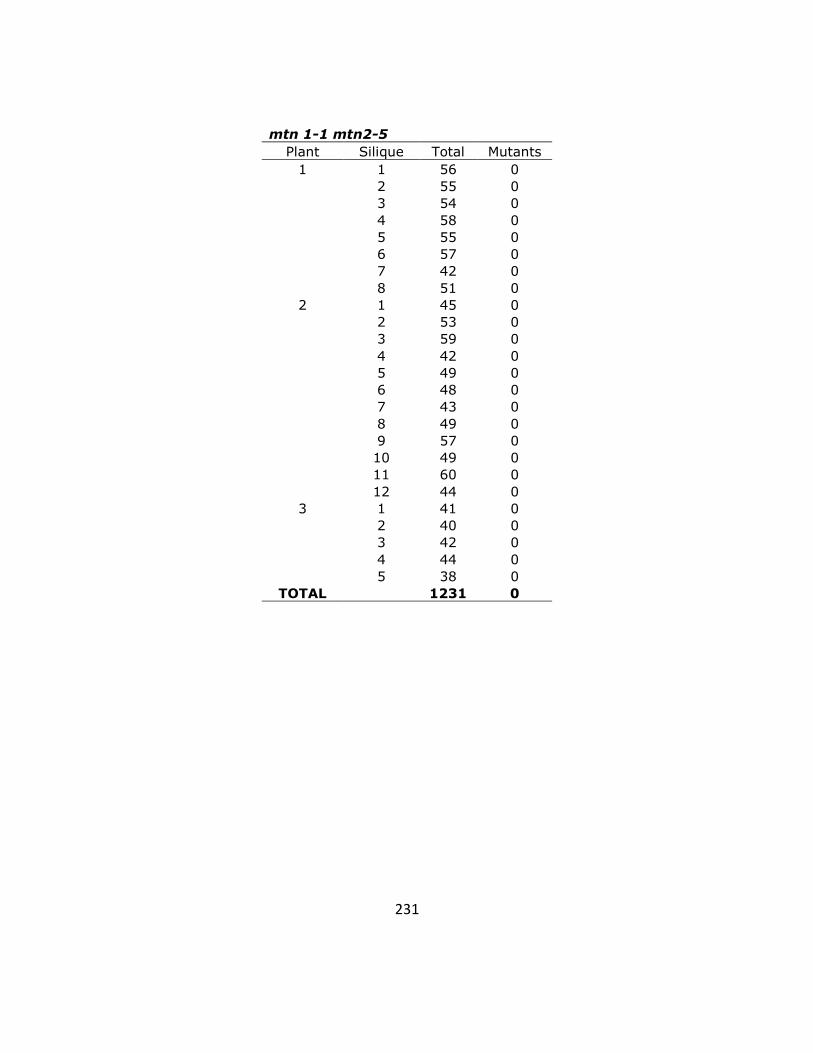
231
mtn 1-1 mtn2-5
Plant Silique Total Mutants
1 1 56 0
2 55 0
3 54 0
4 58 0
5 55 0
6 57 0
7 42 0
8 51 0
2 1 45 0
2 53 0
3 59 0
4 42 0
5 49 0
6 48 0
7 43 0
8 49 0
9 57 0
10 49 0
11 60 0
12 44 0
3 1 41 0
2 40 0
3 42 0
4 44 0
5 38 0
TOTAL
1231 0

232
mtn1-1 mtn2-1
Plant Silique Total Mutants
1 1 44 0
2 47 0
3 43 0
4 48 0
5 43 0
6 51 0
7 41 0
8 47 0
2 1 52 0
2 54 0
3 47 0
4 53 0
5 55 0
6 54 0
7 52 0
8 56 0
9 49 0
10 48 0
11 59 0
3 1 52 0
2 46 0
3 50 0
4 42 0
5 48 0
6 42 1
7 44 0
4 1 41 0
2 48 0
3 45 0
4 54 0
5 40 0
6 50 0
7 44 0
8 50 0
TOTAL
1639 1

233
K. MTN activity
Plant #
WT
mtn1-1 mtn2-5
mtn1-1 mtn2-1
ami 5.3
1 0.86 0.33 0.16 0.15 2 1.15 0.33 0.16 0.14 3 1.29 0.33 0.18 0.17 4 1.14 0.25 0.17 0.27 5 1.08 0.27 0.16 0.38
Mean 1.10 0.31 0.16 0.18 SD 0.09 0.04 0.01 0.07
Paired Samples Test
Paired Differences
t df Sig. (2-tailed) Mean
Std. Deviation
Std. Error Mean
95% Confidence Interval of the
Difference
Lower Upper
Pair 1 WT - MTN5
.7995 .16363 .07318 .5963 1.0026 10.925 4 .000
Pair 2 WT - AMI5
.8802 .18671 .08350 .6483 1.1120 10.541 4 .000
Pair 3 WT - MTN2
.9383 .14884 .06656 .7535 1.1232 14.097 4 .000
Pair 4 MTN5 - AMI5
.0807 .13577 .06072 -.0879 .2493 1.329 4 .255
Pair 5 MTN5 - MTN2
.1389 .03938 .01761 .0900 .1878 7.887 4 .001
L. MTA content
Leaves Inflorescences
Plant #
WT
mtn1-1 mtn2-5
mtn1-1 mtn2-1
ami 5.3
WT
mtn1-1 mtn2-5
mtn1-1 mtn2-1
ami 5.3
1 1 0.8 2.1 1.5 5.2 5.6
5.9
2 1 0.6 2.2 1.6 4.9 6.2 54.3 5.8 3 1 0.5 2.3 1.6 5.5 4.9 52.6 5.5 4 1 0.6 2.1 1.2 4.9 5.1 59.6 7.7
Mean 0.9 0.6 2.2 1.5 5.1 5.4 55.5 6.2 SD 0.2 0.1 0.1 0.2 0.3 0.6 3.7 1.0

234
Paired Samples Test
Paired Differences
t df Sig. (2-tailed) Mean
Std. Deviation
Std. Error Mean
95% Confidence Interval of the
Difference
Lower Upper
Pair 1 LWT - LMTN15
.3750 .12583 .06292 .1748 .5752 5.960 3 .009
Pair 2 LWT - LAMI5.3
-.4750 .18930 .09465 -.7762 -.1738 -5.019 3 .015
Pair 3 LWT - LMTN12
-1.1750 .09574 .04787 -1.3273 -1.0227 -24.545 3 .000
Pair 4 LMTN15 - LAMI5.3
-.8500 .23805 .11902 -1.2288 -.4712 -7.141 3 .006
Pair 5 LMTN15 - LMTN12
-1.5500 .20817 .10408 -1.8812 -1.2188 -14.892 3 .001
Pair 6 LAMI5.3 - LMTN12
-.7000 .14142 .07071 -.9250 -.4750 -9.899 3 .002
Pair 7 FWT - FMTN15
-.3250 .78049 .39025 -1.5669 .9169 -.833 3 .466
Pair 8 FWT - FAMI5.3
-1.1000 1.19722 .59861 -3.0050 .8050 -1.838 3 .163
Pair 9 FWT - FMTN12
-50.3000
3.36452 1.94251 -
58.6579 -
41.9421 -25.894 2 .001
Pair 10 FMTN15 - FAMI5.3
-.7750 1.28679 .64340 -2.8226 1.2726 -1.205 3 .315
Pair 11 FMTN15 - FMTN12
-49.9333
4.28525 2.47409 -
60.5785 -
39.2882 -20.183 2 .002
Pair 12 FAMI5.3 - FMTN12
-49.7667
3.83710 2.21535 -
59.2986 -
40.2348 -22.464 2 .002
M. NA content
Leaves Inflorescences
Plant #
WT
mtn1-1 mtn2-5
mtn1-1 mtn2-1
ami 5.3
WT
mtn1-1 mtn2-5
mtn1-1 mtn2-1
ami 5.3
1 51.7
1 51.71 19.39 10.9
8 770.6
6 468.83 11.63 671.4
1
2 43.8
3 43.83 24.01 32.4
4 536.3
7 568.06 131.61 540.3
8
3 43.3
6 43.36 14.97 54.1
8 741.0
6 639.92 132.45 414.6
9
4 29.1
4 29.14 13.57 51.0
3 603.7 550.77 87.04 596.3 Mean 42 42 18 37 663 557 91 556 SD 9 9 5 20 111 70 57 108

235
Paired Samples Test NA
L = leaves; F = inflorescences
Paired Differences
t df Sig. (2-tailed) Mean
Std. Deviation
Std. Error Mean
95% Confidence Interval of the
Difference
Lower Upper
Pair 2 LNAWT - LNAMI5.3
.4167 16.38236 9.45836 -40.2794 41.1127 .044 2 .969
Pair 3 LNAWT - LNAMTN12
24.0250 7.68178 3.84089 11.8016 36.2484 6.255 3 .008
Pair 4 LNAMTN15 - LNAMI5.3
.4167 16.38236 9.45836 -40.2794 41.1127 .044 2 .969
Pair 5 LNAMI5.3 - LNAMTN12
26.4267 11.95301 6.90107 -3.2663 56.1196 3.829 2 .062
Pair 6 FNAWT - FNAMTN15
106.0525 141.59562 70.79781 -
119.2577 331.3627 1.498 3 .231
Pair 7 FNAWT - FNAMI5.3
107.2525 153.21704 76.60852 -
136.5500 351.0550 1.400 3 .256
Pair 8 FNAWT - FNAMTN12
565.6633 140.27368 80.98705 217.2042 914.1225 6.985 2 .020
Pair 9 FNAMTN15 - FNAMI5.3
1.2000 177.57685 88.78842 -
281.3644 283.7644 .014 3 .990
Pair 10 FNAMTN15 - FNAMTN12
441.9033 107.96765 62.33515 173.6968 710.1098 7.089 2 .019
Pair 11 FNAMI5.3 - FNAMTN12
425.1267 107.11536 61.84308 159.0374 691.2160 6.874 2 .021

236
Appendix 3
A. Metabolite content
Mean N Std. Deviation Std. Error
Mean
Pair 1 MTAWT .0190 3 .00113 .00065
MTADM .6717 3 .14352 .08286
Pair 2 MTAWTSPD .0114 3 .00067 .00039
MTADMSPD .2515 3 .02967 .01713
Pair 3 MTAWT .0190 3 .00113 .00065
MTAWTSPD .0114 3 .00067 .00039
Pair 4 MTADM .6717 3 .14352 .08286
MTADMSPD .2515 3 .02967 .01713
Pair 5 ADEWT .0003 3 .00029 .00017
ADEDM .0003 3 .00053 .00030
Pair 6 ADEWTSPD .0007 3 .00062 .00036
ADEDMSPD .0002 3 .00039 .00022
Pair 7 ADEWT .0003 3 .00029 .00017
ADEWTSPD .0007 3 .00062 .00036
Pair 8 ADEDM .0003 3 .00053 .00030
ADEDMSPD .0002 3 .00039 .00022
Pair 9 METWT .0753 3 .00982 .00567
METDM .0695 3 .01357 .00784
Pair 10 METWTSPD .0760 3 .00922 .00532
METDMSPD .0712 3 .00204 .00118
Pair 11 METWT .0753 3 .00982 .00567
METWTSPD .0760 3 .00922 .00532
Pair 12 METDM .0695 3 .01357 .00784
METDMSPD .0712 3 .00204 .00118
Pair 13 SAMWT .0086 3 .00250 .00144
SAMDM .0089 3 .00220 .00127
Pair 14 SAMWTSPD .0072 3 .00206 .00119
SAMDMSPD .0059 3 .00163 .00094
Pair 15 SAMWT .0086 3 .00250 .00144
SAMWTSPD .0072 3 .00206 .00119
Pair 16 SAMDM .0089 3 .00220 .00127
SAMDMSPD .0059 3 .00163 .00094
Pair 17 ADOWT .0775 3 .01974 .01140
ADODM .0473 3 .00860 .00497

237
Pair 18 ADOWTSPD .0800 3 .02133 .01232
ADODMSPD .1529 3 .11566 .06677
Pair 19 ADOWT .0775 3 .01974 .01140
ADOWTSPD .0800 3 .02133 .01232
Pair 20 ADODM .0473 3 .00860 .00497
ADODMSPD .1529 3 .11566 .06677
Pair 21 SAHWT .0025 3 .00135 .00078
SAHDM .0026 3 .00207 .00120
Pair 22 SAHWTSPD .0033 3 .00175 .00101
SAHDMSPD .0019 3 .00106 .00061
Pair 23 SAHWT .0025 3 .00135 .00078
SAHWTSPD .0033 3 .00175 .00101
Pair 24 SAHDM .0026 3 .00207 .00120
SAHDMSPD .0019 3 .00106 .00061
Pair 25 SMMWT .0504 3 .00714 .00412
SMMDM .0328 3 .00867 .00501
Pair 26 SMMWTSPD .0613 3 .00416 .00240
SMMDMSPD .0564 3 .00865 .00500
Pair 27 SMMWT .0504 3 .00714 .00412
SMMWTSPD .0613 3 .00416 .00240
Pair 28 SMMDM .0328 3 .00867 .00501
SMMDMSPD .0564 3 .00865 .00500
Paired Samples Test
Paired Differences t df Sig. (2-tailed)
Mean Std.
Deviation
Std. Error Mean
95% Confidence Interval of the
Difference
Lower Upper
Pair 1 MTAWT - MTADM
-.6527 .14251 .08228 -1.0067 -.2987 -7.933 2 .016
Pair 2 MTAWTSPD - MTADMSPD
-.2401 .02989 .01726 -.3144 -.1659 -13.915 2 .005
Pair 3 MTAWT - MTAWTSPD
.0077 .00167 .00097 .0035 .0118 7.969 2 .015
Pair 4 MTADM - MTADMSPD
.4202 .14618 .08440 .0571 .7833 4.979 2 .038
Pair 5 ADEWT - ADEDM
.0000 .00047 .00027 -.0011 .0012 .124 2 .913
Pair 6 ADEWTSPD - ADEDMSPD .0005 .00050 .00029 -.0008 .0017 1.687 2 .234
Pair 7 ADEWT - ADEWTSPD
-.0004 .00033 .00019 -.0012 .0005 -1.933 2 .193
Pair 8 ADEDM - ADEDMSPD
.0001 .00014 .00008 -.0003 .0004 1.000 2 .423

238
Pair 9 METWT - METDM
.0059 .01234 .00713 -.0248 .0365 .823 2 .497
Pair 10 METWTSPD - METDMSPD .0048 .00760 .00439 -.0141 .0237 1.094 2 .388
Pair 11 METWT - METWTSPD
-.0007 .00520 .00300 -.0136 .0123 -.221 2 .846
Pair 12 METDM - METDMSPD
-.0017 .01279 .00738 -.0335 .0300 -.234 2 .837
Pair 13 SAMWT - SAMDM
-.0003 .00147 .00085 -.0040 .0034 -.356 2 .756
Pair 14 SAMWTSPD - SAMDMSPD .0013 .00369 .00213 -.0078 .0105 .628 2 .594
Pair 15 SAMWT - SAMWTSPD
.0014 .00456 .00263 -.0099 .0127 .536 2 .645
Pair 16 SAMDM - SAMDMSPD
.0031 .00114 .00066 .0002 .0059 4.617 2 .044
Pair 17 ADOWT - ADODM
.0302 .02046 .01181 -.0206 .0810 2.556 2 .125
Pair 18 ADOWTSPD - ADODMSPD -.0729 .13496 .07792 -.4082 .2623 -.936 2 .448
Pair 19 ADOWT - ADOWTSPD
-.0024 .02699 .01558 -.0695 .0646 -.156 2 .890
Pair 20 ADODM - ADODMSPD
-.1056 .10725 .06192 -.3720 .1609 -1.705 2 .230
Pair 21 SAHWT - SAHDM
-.0001 .00325 .00188 -.0082 .0080 -.045 2 .968
Pair 22 SAHWTSPD - SAHDMSPD .0014 .00275 .00159 -.0055 .0082 .875 2 .474
Pair 23 SAHWT - SAHWTSPD
-.0008 .00298 .00172 -.0082 .0066 -.451 2 .696
Pair 24 SAHDM - SAHDMSPD
.0007 .00305 .00176 -.0069 .0083 .397 2 .730
Pair 25 SMMWT - SMMDM
.0176 .01498 .00865 -.0196 .0548 2.033 2 .179
Pair 26 SMMWTSPD - SMMDMSPD
.0050 .00534 .00308 -.0083 .0182 1.616 2 .248
Pair 27 SMMWT - SMMWTSPD
-.0109 .00300 .00173 -.0184 -.0035 -6.299 2 .024
Pair 28 SMMDM - SMMDMSPD
-.0235 .01730 .00999 -.0665 .0194 -2.356 2 .143
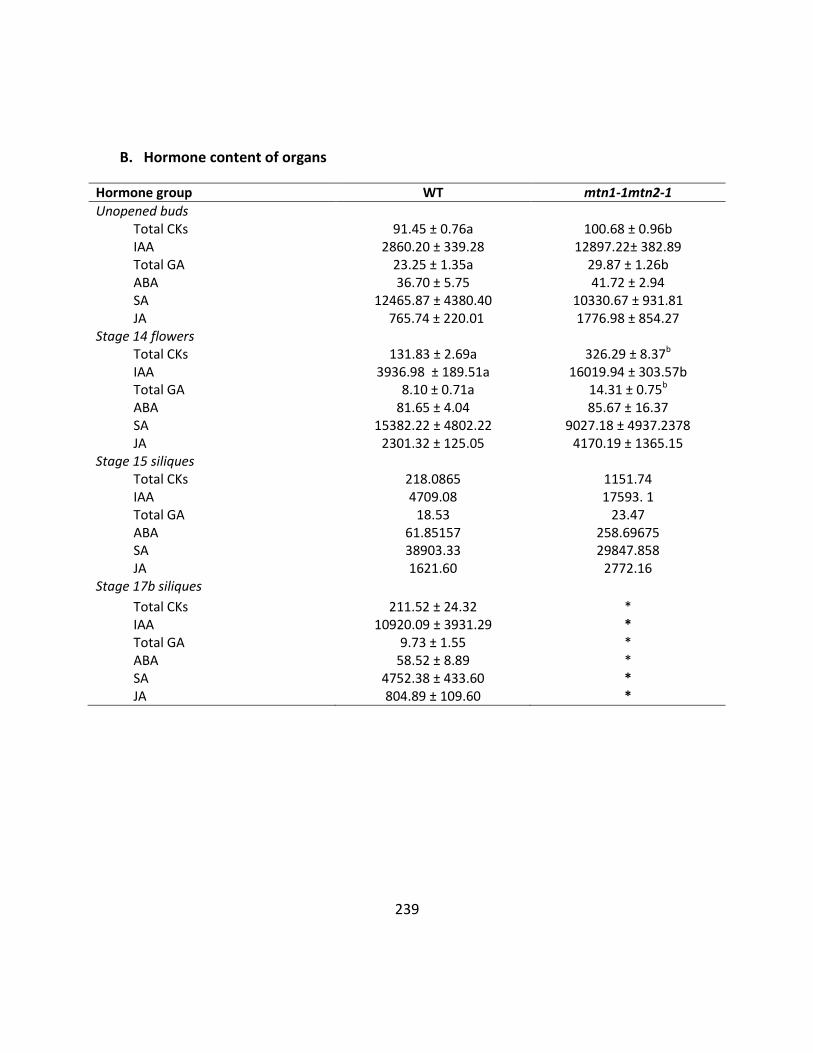
239
B. Hormone content of organs
Hormone group WT mtn1-1mtn2-1
Unopened buds Total CKs 91.45 ± 0.76a 100.68 ± 0.96b IAA 2860.20 ± 339.28 12897.22± 382.89 Total GA 23.25 ± 1.35a 29.87 ± 1.26b ABA 36.70 ± 5.75 41.72 ± 2.94 SA 12465.87 ± 4380.40 10330.67 ± 931.81 JA 765.74 ± 220.01 1776.98 ± 854.27
Stage 14 flowers Total CKs 131.83 ± 2.69a 326.29 ± 8.37b IAA 3936.98 ± 189.51a 16019.94 ± 303.57b Total GA 8.10 ± 0.71a 14.31 ± 0.75b ABA 81.65 ± 4.04 85.67 ± 16.37 SA 15382.22 ± 4802.22 9027.18 ± 4937.2378 JA 2301.32 ± 125.05 4170.19 ± 1365.15
Stage 15 siliques Total CKs 218.0865 1151.74 IAA 4709.08 17593. 1 Total GA 18.53 23.47 ABA 61.85157 258.69675 SA 38903.33 29847.858 JA 1621.60 2772.16
Stage 17b siliques
Total CKs 211.52 ± 24.32 * IAA 10920.09 ± 3931.29 * Total GA 9.73 ± 1.55 * ABA 58.52 ± 8.89 * SA 4752.38 ± 433.60 * JA 804.89 ± 109.60 *
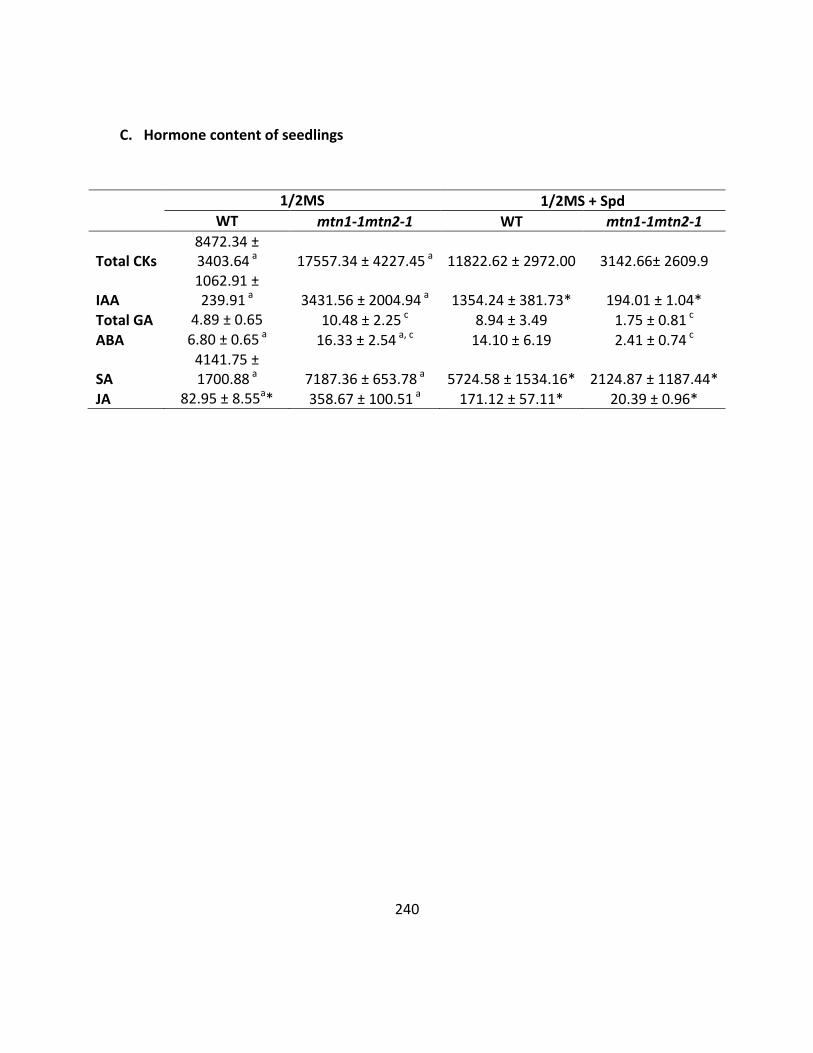
240
C. Hormone content of seedlings
1/2MS 1/2MS + Spd
WT mtn1-1mtn2-1 WT mtn1-1mtn2-1
Total CKs 8472.34 ± 3403.64 a 17557.34 ± 4227.45 a 11822.62 ± 2972.00 3142.66± 2609.9
IAA 1062.91 ± 239.91 a 3431.56 ± 2004.94 a 1354.24 ± 381.73* 194.01 ± 1.04*
Total GA 4.89 ± 0.65 10.48 ± 2.25 c 8.94 ± 3.49 1.75 ± 0.81 c
ABA 6.80 ± 0.65 a 16.33 ± 2.54 a, c 14.10 ± 6.19 2.41 ± 0.74 c
SA 4141.75 ± 1700.88 a 7187.36 ± 653.78 a 5724.58 ± 1534.16* 2124.87 ± 1187.44*
JA 82.95 ± 8.55a* 358.67 ± 100.51 a 171.12 ± 57.11* 20.39 ± 0.96*

241
D. Gene detection in the CEL files
Sample number 1 2 3 4 5 6 Sample Spd-WT-1 Spd-WT-2 Spd-WT-3 MS-WT-1 MS-WT-2 MS-WT-3
Detection Call Absent 6900 6615 6531 6543 6405 6309
Marginal 202 211 232 228 200 214 Present 15644 15920 15983 15975 16141 16223
Total 22746 22746 22746 22746 22746 22746
Sample number 7 8 9 10 11 12 Sample Spd-mut-1 Spd-mut-2 Spd-mut-3 MS-mut-1 MS-mut-2 MS-mut-3
Detection Call Absent 6377 6698 6239 6406 6361 6852
Marginal 194 229 212 224 219 250 Present 16175 15819 16295 16116 16166 15644
Total 22746 22746 22746 22746 22746 22746
Total Gene Number : 22746

242
E. Gene that significantly increased their expression as a result of MTN mutation.
AGI TAIR-060104
At1g52040
[AT1G52030, myrosinase-binding protein, putative (F-ATMBP) identical to SP|Q9SAV1 Myrosinase binding protein-like f-AtMBP [Arabidopsis thaliana]; similar to myrosinase binding protein GI:1711295 from [Brassica napus]; contains Pfam PF01419: Jacalin-like
At1g53870
[AT1G53870, expressed protein contains Pfam profile PF04525: Protein of unknown function (DUF567)];[AT1G53890, expressed protein contains Pfam profile PF04525: Protein of unknown function (DUF567)]
At1g59930 [AT1G59930, hypothetical protein];[AT1G59920, hypothetical protein]
At1g60740
[AT1G60740, peroxiredoxin type 2, putative strong similarity to type 2 peroxiredoxin [Brassica rapa subsp. pekinensis] GI:4928472; contains Pfam profile: PF00578 AhpC/TSA (alkyl hydroperoxide reductase and thiol-specific antioxidant) family];[AT1G65970,
At3g28290
[AT3G28290, integrin-related protein 14a identical to At14a protein GI:11994573 [Arabidopsis thaliana] [Gene 230 (1), 33-40 (1999)], At14a protein [Arabidopsis thaliana] GI:4589123];[AT3G28300, integrin-related protein 14a identical to integrin-related
At4g16860
[AT4G16950, disease resistance protein (TIR-NBS-LRR class), putative domain signature TIR-NBS-LRR exists, suggestive of a disease resistance protein.; closest homolog in Col-0 to RPP5 of clutivar Landsberg erecta.];[AT4G16920, disease resistance protein
At4g23810
[AT4G23800, high mobility group (HMG1/2) family protein similar to HMG2B [Homo sapiens] GI:32335; contains Pfam profile PF00505: HMG (high mobility group) box];[AT4G23810, WRKY family transcription factor AR411 - Arabidopsis thaliana (thale cress), PID:
At5g08610
[AT5G08620, DEAD box RNA helicase (RH25) identical to RNA helicase [Arabidopsis thaliana] GI:3776023; contains Pfam profiles PF00270: DEAD/DEAH box helicase, PF00271: Helicase conserved C-terminal domain];[AT5G08610, DEAD box RNA helicase (RH26) strong
At5g39670
[AT5G39670, calcium-binding EF hand family protein contains INTERPRO:IPR002048 calcium-binding EF-hand domain];[AT5G39680, pentatricopeptide (PPR) repeat-containing protein contains INTERPRO:IPR002885 PPR repeats]
At3g49620
2-oxoacid-dependent oxidase, putative (DIN11) identical to partial cds of 2-oxoacid-dependent oxidase (din11) from GI:10834554 [Arabidopsis thaliana]; identical to cDNA 2-oxoacid-dependent oxidase (din11) GI:10834553; contains Pfam profile PF03171: oxidor

243
At4g03060
2-oxoglutarate-dependent dioxygenase, putative (AOP2) nearly identical to GI:16118891; contains Pfam profile PF03171: 2OG-Fe(II) oxygenase superfamily domain. The gene sequence is frameshifted, this could be a pseudogene or a sequencing error may exist;
At1g20510
4-coumarate--CoA ligase family protein / 4-coumaroyl-CoA synthase family protein similar to SP|P14912 and SP|P14913 from Petroselinum crispum; contains Pfam AMP-binding enzyme domain PF00501
At3g50930 AAA-type ATPase family protein contains Pfam profile: ATPase family PF00004 At3g28540 AAA-type ATPase family protein contains Pfam profile: ATPase family PF00004
At2g39920
acid phosphatase class B family protein weak similarity to pod storage protein [Phaseolus vulgaris GI:2627233 SP|P10743 STEM 31 kDa glycoprotein precursor (Vegetative storage protein B) {Glycine max}; contains Pfam profile PF03767: HAD superfamily (subfam
At5g15950 adenosylmethionine decarboxylase family protein contains Pfam profile: PF01536 adenosylmethionine decarboxylase
At1g69830
alpha-amylase, putative / 1,4-alpha-D-glucan glucanohydrolase, putative similar to SP|P17859 Alpha-amylase precursor (EC 3.2.1.1) (1,4-alpha-D-glucan glucanohydrolase) {Vigna mungo}, alpha-amylase [Malus x domestica] GI:7532799; contains Pfam profile PF00
At5g51190 AP2 domain-containing transcription factor, putative contains similarity to ethylene responsive element binding factor
At4g34410 AP2 domain-containing transcription factor, putative ethylene-responsive element binding protein homolog, Stylosanthes hamata, U91857
At1g74930 AP2 domain-containing transcription factor, putative similar to AP2 domain containing protein RAP2.1 GI:2281627 from [Arabidopsis thaliana]
At1g33760
AP2 domain-containing transcription factor, putative similar to TINY GB: CAA64359 GI:1246403 from [Arabidopsis thaliana]; contains Pfam profile PF00847: AP2 domain
At1g23080 auxin efflux carrier protein, putative similar to efflux carrier of polar auxin transport [Brassica juncea] gi|12331173|emb|CAC24691
At3g56980 basic helix-loop-helix (bHLH) family protein
At5g04150 basic helix-loop-helix (bHLH) family protein contains Pfam profile: PF00010 helix-loop-helix DNA-binding domain; PMID: 12679534
At1g32640 basic helix-loop-helix (bHLH) protein (RAP-1) identical to bHLH protein GB:CAA67885 GI:1465368 from [Arabidopsis thaliana]
At1g10070
branched-chain amino acid aminotransferase 2 / branched-chain amino acid transaminase 2 (BCAT2) identical to SP|Q9M439 Branched-chain amino acid aminotransferase 2, chloroplast precursor (EC 2.6.1.42) (Atbcat-2) {Arabidopsis thaliana}; contains Pfam profi

244
At1g62280 C4-dicarboxylate transporter/malic acid transport family protein contains Pfam profile PF03595: C4-dicarboxylate transporter/malic acid transport protein
At4g27280
calcium-binding EF hand family protein similar to EF-hand Ca2+-binding protein CCD1 [Triticum aestivum] GI:9255753; contains INTERPRO:IPR002048 calcium-binding EF-hand domain
At5g54490
calcium-binding EF-hand protein, putative similar to EF-hand Ca2+-binding protein CCD1 [Triticum aestivum] GI:9255753; contains INTERPRO:IPR002048 calcium-binding EF-hand domain
At2g33380
calcium-binding RD20 protein (RD20) induced by abscisic acid during dehydration PMID:10965948; putative transmembrane channel protein PMID:10965948; identical to GI:10862968 [Arabidopsis thaliana]; contains EF-hand domain
At1g23730
carbonic anhydrase, putative / carbonate dehydratase, putative similar to SP|P27140 Carbonic anhydrase, chloroplast precursor (EC 4.2.1.1) (Carbonate dehydratase) {Arabidopsis thaliana}; contains Pfam profile PF00484: Carbonic anhydrase
At2g43620 chitinase, putative similar to basic endochitinase CHB4 precursor SP:Q06209 from [Brassica napus]
At2g42530
cold-responsive protein / cold-regulated protein (cor15b) nearly identical to cold-regulated gene cor15b [Arabidopsis thaliana] GI:456016; contains Pfam profile PF02987: Late embryogenesis abundant protein
At1g07050
CONSTANS-like protein-related contains similarity to photoperiod sensitivity quantitative trait locus (Hd1) GI:11094203 from [Oryza sativa]; similar to Zinc finger protein constans-like 15 (SP:Q9FHH8) {Arabidopsis thaliana}
At4g12280 copper amine oxidase family protein contains Pfam domain, PF01179: Copper amine oxidase, enzyme domain
At4g23600
coronatine-responsive tyrosine aminotransferase / tyrosine transaminase similar to nicotianamine aminotransferase from Hordeum vulgare [GI:6498122, GI:6469087]; contains Pfam profile PF00155 aminotransferase, classes I and II; identical to cDNA coronatine
At5g45340
cytochrome P450 family protein similar to SP|Q42569|C901_ARATH Cytochrome P450 90A1 (SP:Q42569) [Arabidopsis thaliana]; contains Pfam profile: PF00067: Cytochrome P450
At1g06080 delta 9 desaturase (ADS1) identical to delta 9 acyl-lipid desaturase (ADS1) GB:BAA25180 GI:2970034 from [Arabidopsis thaliana]
At1g72920 disease resistance protein (TIR-NBS class), putative domain signature TIR-NBS exists, suggestive of a disease resistance protein.
At2g24120 DNA-directed RNA polymerase, chloroplast (RPOPT) identical to SP|O24600 DNA-directed RNA polymerase, chloroplast precursor (EC 2.7.7.6) {Arabidopsis

245
thaliana}
At1g56300
DNAJ heat shock N-terminal domain-containing protein similar to SP|Q9QYI7 DnaJ homolog subfamily B member 8 Mus musculus; contains Pfam profile: PF00226: DnaJ domain
At3g25760
early-responsive to dehydration stress protein (ERD12) nearly identical to early-responsive to dehydration (ERD12) protein [GI:15320414]; similar to allene oxide cyclase GI:8977961 from [Lycopersicon esculentum]; identical to cDNA ERD12 partial cds GI:153
At4g19120
early-responsive to dehydration stress protein (ERD3) identical to ERD3 protein [Arabidopsis thaliana] GI:15320410; contains Pfam profile PF03141: Putative methyltransferase; identical to cDNA ERD3 GI:15320409
At1g28370 ERF domain protein 11 (ERF11) identical to ERF domain protein 11 (AtERF11) GI:15207789 from [Arabidopsis thaliana]
At1g53170 ethylene-responsive element-binding factor 8 / ERF transcription factor 8 (ERF8) identical to ERF transcription factor 8 GI:10567108 from [Arabidopsis thaliana]
At2g44840 ethylene-responsive element-binding protein, putative At3g30720 expressed protein At1g47400 expressed protein At2g34600 expressed protein At2g26530 expressed protein At1g13470 expressed protein At5g50335 expressed protein At1g73120 expressed protein At5g35480 expressed protein At1g76960 expressed protein At1g17380 expressed protein At4g19430 expressed protein At1g19180 expressed protein At3g48500 expressed protein At4g16146 expressed protein At4g37290 expressed protein At3g16670 expressed protein At5g64870 expressed protein At2g42870 expressed protein At3g05730 expressed protein At2g29920 expressed protein At1g12845 expressed protein At2g04460 expressed protein At1g35210 expressed protein

246
At1g10522 expressed protein At5g13220 expressed protein At1g80130 expressed protein At4g39675 expressed protein At2g21640 expressed protein At5g26270 expressed protein ; expression supported by MPSS
At2g15560 expressed protein contains Pfam profile PF04396: Protein of unknown function, DUF537
At5g01600 ferritin 1 (FER1) identical to ferritin [Arabidopsis thaliana] GI:1246401, GI:8163920
At2g39030
GCN5-related N-acetyltransferase (GNAT) family protein similar to SP|Q9SMB8 Tyramine N-feruloyltransferase 4/11 (EC 2.3.1.110) (Hydroxycinnamoyl- CoA: tyramine N-hydroxycinnamoyltransferase) {Nicotiana tabacum}; contains Pfam profile PF00583: acetyltransf
At3g05950 germin-like protein, putative similar to germin-like protein GLP6 [SP|P92997]; contains Pfam profile: PF01072 germin family
At1g22770 gigantea protein (GI) identical to gigantea protein SP:Q9SQI2 from [Arabidopsis thaliana]
At3g29320
glucan phosphorylase, putative similar to alpha-glucan phosphorylase, L isozyme 1 precursor GB:P04045 from [Solanum tuberosum] (J. Biochem. 106 (4), 691-695 (1989))
At5g07570 glycine/proline-rich protein contains similarity to flagelliform silk protein [Nephila clavipes] gi|7106224|gb|AAF36090
At3g20440
glycoside hydrolase family 13 protein similar to 1,4-alpha-glucan branching enzyme [Solanum tuberosum] GI:1621012, 1,4-alpha-glucan branching enzyme (EC 2.4.1.18) from [Homo sapiens] SP|Q04446, {Solanum tuberosum} SP|P30924; contains Pfam profiles: PF0012
At2g43610
glycoside hydrolase family 19 protein similar to chitinase GI:17799 from [Brassica napus]; contains Pfam profiles PF00182: Chitinase class I, PF00187: Chitin recognition protein
At3g18080
glycosyl hydrolase family 1 protein contains Pfam PF00232 : Glycosyl hydrolase family 1 domain; TIGRFAM TIGR01233: 6-phospho-beta-galactosidase; similar to beta-glucosidase BGQ60 precursor GB:A57512 [Hordeum vulgare]; similar to beta-mannosidase enzyme (G
At3g57260 glycosyl hydrolase family 17 protein similar to glucan endo-1,3-beta-glucosidase, acidic isoform precursor SP:P33157 from [Arabidopsis thaliana]
At1g67970
heat shock factor protein, putative (HSF5) / heat shock transcription factor, putative (HSTF5) identical to heat shock transcription factor 5 (HSF5) SP:Q9S7U5 from [Arabidopsis thaliana]; contains Pfam profile: PF00447 HSF-type DNA-

247
binding domain
At3g22740
homocysteine S-methyltransferase 3 (HMT-3) identical to homocysteine S-methyltransferase HMT-3 [Arabidopsis thaliana] GI:9966515; similar to homocysteine S-methyltransferase AtHMT-2 (GI:6685163) [Arabidopsis thaliana]; similar to selenocysteine methyltran
At1g73480
hydrolase, alpha/beta fold family protein low similarity to monoglyceride lipase from [Homo sapiens] GI:14594904, [Mus musculus] GI:2632162; contains Pfam profile PF00561: hydrolase, alpha/beta fold family
At4g30660
hydrophobic protein, putative / low temperature and salt responsive protein, putative similar to SP|Q9ZNQ7 Hydrophobic protein RCI2A (Low temperature and salt responsive protein LTI6A) {Arabidopsis thaliana}; contains Pfam profile PF01679: Uncharacterized
At4g30650
hydrophobic protein, putative / low temperature and salt responsive protein, putative similar to SP|Q9ZNQ7 Hydrophobic protein RCI2A (Low temperature and salt responsive protein LTI6A) {Arabidopsis thaliana}; contains Pfam profile PF01679: Uncharacterized
At2g19850 hypothetical protein At2g05950 hypothetical protein At5g03090 hypothetical protein At4g29200 hypothetical protein
At4g19690
iron-responsive transporter (IRT1) identical to Fe(II) transport protein [Arabidopsis thaliana] gi|1353266|gb|AAB01678; member of the Zinc (Zn2+)-Iron (Fe2+) permease (ZIP) family, PMID:11500563
At1g52000
jacalin lectin family protein similar to myrosinase binding protein [Brassica napus] GI:1711296, myrosinase-binding protein homolog [Arabidopsis thaliana] GI:2997767; contains Pfam profile: PF01419 jacalin-like lectin domain
At5g14180
lipase family protein similar to SP|Q64194 Lysosomal acid lipase/cholesteryl ester hydrolase precursor (EC 3.1.1.13) {Rattus norvegicus}; contains Pfam profile PF04083: ab-hydrolase associated lipase region
At1g72520
lipoxygenase, putative similar to lipoxygenase gi:1495804 [Solanum tuberosum], gi:1654140 [Lycopersicon esculentum], GB:CAB56692 [Arabidopsis thaliana]
At5g10140
MADS-box protein flowering locus F (FLF) identical to FLOWERING LOCUS C protein (MADS box protein FLOWERING LOCUS F) (Swiss-Prot:Q9S7Q7) [Arabidopsis thaliana]
At1g24140 matrixin family protein similar to matrix metalloproteinase [Cucumis sativus] GI:7159629; contains InterPro accession IPR001818: Matrixin
At1g10970 metal transporter, putative (ZIP4) similar to Zn and Cd transporter ZNT1 [Thlaspi caerulescens] gi|7381054|gb|AAF61374; member of the Zinc (Zn2+)-Iron (Fe2+)

248
permease (ZIP) family, PMID:11500563
At5g47240
MutT/nudix family protein similar to SP|P53370 Nucleoside diphosphate-linked moiety X motif 6 {Homo sapiens}; contains Pfam profile PF00293: NUDIX domain
At1g18710 myb family transcription factor (MYB47) contains Pfam profile: PF00249 myb-like DNA-binding domain
At1g18570 myb family transcription factor (MYB51) contains PFAM profile: PF00249
At5g56080
nicotianamine synthase, putative similar to nicotianamine synthase [Lycopersicon esculentum][GI:4753801], nicotianamine synthase 2 [Hordeum vulgare][GI:4894912]
At1g09240
nicotianamine synthase, putative similar to nicotianamine synthase [Lycopersicon esculentum][GI:4753801], nicotianamine synthase 2 [Hordeum vulgare][GI:4894912]
At2g17040
no apical meristem (NAM) family protein contains Pfam PF02365: No apical meristem (NAM) domain; similar to petunia NAM (X92205) and A. thaliana sequences ATAF1 (X74755) and ATAF2 (X74756); probable DNA-binding protein
At1g69490 no apical meristem (NAM) family protein similar to N-term half of NAC domain protein NAM [Arabidopsis thaliana] GI:4325282
At2g16660 nodulin family protein similar to nodulin-like protein [Arabidopsis thaliana] GI:3329368, nodule-specific protein Nlj70 [Lotus japonicus] GI:3329366
At4g34950 nodulin family protein similar to nodulin-like protein [Arabidopsis thaliana] GI:3329368, nodule-specific protein Nlj70 [Lotus japonicus] GI:3329366
At5g50790 nodulin MtN3 family protein similar to MtN3 GI:1619602 (root nodule development) from [Medicago truncatula]
At1g14250
nucleoside phosphatase family protein / GDA1/CD39 family protein low similarity to SP|P97687 Ectonucleoside triphosphate diphosphohydrolase 1 (EC 3.6.1.5) (Ecto-apyrase) {Rattus norvegicus}; contains Pfam profile PF01150: GDA1/CD39 (nucleoside phosphatase
At2g14610 pathogenesis-related protein 1 (PR-1) identical to GB:M90508 SP|P33154
At1g31290 PAZ domain-containing protein / piwi domain-containing protein contains Pfam profiles PF02170: PAZ domain, PF02171: Piwi domain
At4g02330 pectinesterase family protein contains Pfam profile: PF01095 pectinesterase
At1g08610 pentatricopeptide (PPR) repeat-containing protein contains Pfam profile PF01535: PPR repeat
At3g17990
phosphoethanolamine N-methyltransferase 1 / PEAMT 1 (NMT1) identical to Phosphoethanolamine N-methyltransferase 1 (EC 2.1.1.103) (PEAMT 1) (AtNMT1) (SP:Q9FR44){Arabidopsis thaliana}; strong similarity to phosphoethanolamine N-methyltransferase from [Spina
At1g02390 phospholipid/glycerol acyltransferase family protein contains Pfam profile
249
PF01553: Acyltransferase
At1g09530 phytochrome interacting factor 3 (PIF3) identical to phytochrome interacting factor 3 (PIF3) GI:3929585 from [Arabidopsis thaliana]
At2g22860 phytosulfokines 2 (PSK2) identical to phytosulfokines 2 (PSK2) from [Arabidopsis thaliana]
At5g44420
plant defensin protein, putative (PDF1.2a) plant defensin protein family member, personal communication, Bart Thomma ([email protected]); similar to antifungal protein 1 preprotein [Raphanus sativus] gi|609322|gb|AAA69541
At2g26020
plant defensin-fusion protein, putative (PDF1.2b) plant defensin protein family member, personal communication, Bart Thomma ([email protected]); similar to antifungal protein 1 preprotein [Raphanus sativus] gi|609322|gb|AAA69541
At1g19610
plant defensin-fusion protein, putative (PDF1.4) plant defensin protein family member, personal communication, Bart Thomma ([email protected]); similar to SWISS-PROT:P30224, Cysteine-rich antifungal protein 1 precursor (AFP1)[Arabidopsis thal
At5g06870
polygalacturonase inhibiting protein 2 (PGIP2) identical to polygalacturonase inhibiting protein 2 (PGIP2) [Arabidopsis thaliana] gi|7800201|gb|AAF69828; contains leucine rich-repeat (LRR) domains Pfam:PF00560, INTERPRO:IPR001611
At4g22470
protease inhibitor/seed storage/lipid transfer protein (LTP) family protein similar to hydroxyproline-rich glycoprotein DZ-HRGP from Volvox carteri f. nagariensis GP|6523547; contains Pfam profile PF00234 Protease inhibitor/seed storage/LTP family
At4g12490
protease inhibitor/seed storage/lipid transfer protein (LTP) family protein similar to pEARLI 1 (Accession No. L43080): an Arabidopsis member of a conserved gene family (PGF95-099), Plant Physiol. 109 (4), 1497 (1995); contains Pfam protease inhibitor/see
At5g67080 protein kinase family protein contains protein kinase domain, Pfam:PF00069 At5g53450 protein kinase family protein contains protein kinase domain, Pfam:PF00069
At4g21680 proton-dependent oligopeptide transport (POT) family protein contains Pfam profile: PF00854 POT family
At3g17170
ribosomal protein S6 family protein (RFC3) annotation temporarily based on supporting cDNA gi|15620809|dbj|AB057424.1|; contains TIGRfam TIGR00166 and Pfam PF01250 profiles ribosomal protein S6.
At3g44860
S-adenosyl-L-methionine:carboxyl methyltransferase family protein similar to defense-related protein cjs1 [Brassica carinata][GI:14009292][Mol Plant Pathol (2001) 2(3):159-169]

250
At1g53885 senescence-associated protein-related similar to senescence-associated protein SAG102 (GI:22331931) [Arabidopsis thaliana];
At3g56710 sigA-binding protein identical to SigA binding protein [Arabidopsis thaliana] gi|6980074|gb|AAF34713; contains Pfam PF05678: VQ motif
At5g15960 stress-responsive protein (KIN1) / stress-induced protein (KIN1) identical to SP|P18612 Stress-induced KIN1 protein {Arabidopsis thaliana}
At5g61160
transferase family protein similar to anthocyanin 5-aromatic acyltransferase from Gentiana triflora GI:4185599, malonyl CoA:anthocyanin 5-O-glucoside-6'''-O-malonyltransferase from Perilla frutescens GI:17980232, Salvia splendens GI:17980234; contains Pfa
At2g43510 trypsin inhibitor, putative similar to SP|P26780 Trypsin inhibitor 2 precursor (MTI-2) {Sinapis alba}
At2g40670 two-component responsive regulator / response regulator 16 (ARR16) identical to response regulator 16 GI:11870067 from [Arabidopsis thaliana]
At2g38470 WRKY family transcription factor contains Pfam profile: PF03106 WRKY DNA -binding domain;
At1g80840 WRKY family transcription factor similar to WRKY transcription factor GB:BAA87058 GI:6472585 from [Nicotiana tabacum]
At3g01970 WRKY family transcription factor similar to WRKY1 GB:AAC49527 [Petroselinum crispum]
At5g46710
zinc-binding family protein similar zinc-binding protein [Pisum sativum] GI:16117799; contains Pfam profile PF04640 : Protein of unknown function, DUF597

251
F. Gene that significantly decreased their expression as a result of MTN mutation
AGI TAIR-060104
At5g33370
GDSL-motif lipase/hydrolase family protein similar to family II lipase EXL3 (GI:15054386), EXL1 (GI:15054382), EXL2 (GI:15054384) [Arabidopsis thaliana]; contains Pfam profile PF00657: Lipase/Acylhydrolase with GDSL-like motif
At5g58310
hydrolase, alpha/beta fold family protein low similarity to SP|Q40708 PIR7A protein {Oryza sativa}, polyneuridine aldehyde esterase [Rauvolfia serpentina] GI:6651393, ethylene-induced esterase [Citrus sinensis] GI:14279437; contains Pfam profile PF00561:
At5g55450 protease inhibitor/seed storage/lipid transfer protein (LTP) family protein contains Pfam protease inhibitor/seed storage/LTP family domain PF00234
At5g52570 beta-carotene hydroxylase, putative similar to GI:1575296, beta-carotene hydroxylase
At5g23940
transferase family protein similar to anthranilate N-hydroxycinnamoyl/benzoyltransferase, Dianthus caryophyllus [gi:2239091]; contains Pfam transferase family domain PF002458
At5g15310 myb family transcription factor contains PFAM profile: myb DNA-binding domain PF00249
At5g01740 expressed protein wound-inducible protein wun1 protein - Solanum tuberosum, PIR:JQ0398
At3g44970 cytochrome P450 family protein similar to Cytochrome P450 85 (SP:Q43147) {Lycopersicon esculentum}; contains Pfam profile: PF00067 cytochrome P450
At4g38800
phosphorylase family protein contains weak similarity to Swiss-Prot:O51931 nucleosidase [Includes: 5'-methylthioadenosine nucleosidase (EC 3.2.2.16); S-adenosylhomocysteine nucleosidase [Buchnera aphidicola]
At4g38330
[AT4G38280, expressed protein unknown protein F4L23.24 Arabidopsis thaliana chromosome II BAC F4L23, PID:g2583136];[AT4G38330, expressed protein];[AT2G45250, expressed protein]
At4g34840 nucleosidase-related contains weak similarity to MTA/SAH nucleosidase (Swiss-Prot:O51931) [Buchnera aphidicola]
At4g11460 protein kinase family protein contains Pfam PF00069: Protein kinase domain
At4g08300 nodulin MtN21 family protein similar to MtN21 GI:2598575 (root nodule development) from [Medicago truncatula]
At1g52820
2-oxoglutarate-dependent dioxygenase, putative similar to AOP1 [Arabidopsis lyrata][GI:16118889]; contains Pfam profile PF03171: 2OG-Fe(II) oxygenase superfamily domain
At2g16005 MD-2-related lipid recognition domain-containing protein / ML domain-containing protein contains Pfam profile PF02221: ML domain
At1g10370
glutathione S-transferase, putative (ERD9) similar to glutathione S-transferase TSI-1 [Aegilops tauschii] gi:2190992 gb:AAD10129; similar to ESTs gb|R29860, emb|Z29757, and emb|Z29758; identical to cDNA ERD9 mRNA for glutathione S-transferase, GI:1537540
At2g40100 chlorophyll A-B binding protein (LHCB4.3) identical to Lhcb4:3 protein [Arabidopsis

252
thaliana] GI:4741956; contains Pfam profile: PF00504 chlorophyll A-B binding protein
At2g39510 nodulin MtN21 family protein similar to MtN21 GI:2598575 (root nodule development) from [Medicago truncatula]
At2g42250 cytochrome P450 family protein similar to cytochrome P450 93A1 (SP:Q42798) [Glycine max]
At5g65730
xyloglucan:xyloglucosyl transferase, putative / xyloglucan endotransglycosylase, putative / endo-xyloglucan transferase, putative similar to endo-xyloglucan transferase GI:2244732 from [Gossypium hirsutum]
At4g30610 serine carboxypeptidase S10 family protein similar to Serine carboxypeptidase II chains A and B (SP:P08819) (EC 3.4.16.6) [Triticum aestivum (Wheat)];
At5g50260 cysteine proteinase, putative similar to cysteine endopeptidase precursor CysEP GI:2944446 from [Ricinus communis]
At4g01390
meprin and TRAF homology domain-containing protein / MATH domain-containing protein weak similarity to ubiquitin-specific protease 12 [Arabidopsis thaliana] GI:11993471; contains Pfam profile PF00917: MATH domain
At4g33720
pathogenesis-related protein, putative similar to SP|P33154 Pathogenesis-related protein 1 precursor (PR-1) {Arabidopsis thaliana}; contains Pfam profile PF00188: SCP-like extracellular protein
At1g78340 glutathione S-transferase, putative similar to glutathione transferase GI:2853219 from [Carica papaya]
At5g48850 male sterility MS5 family protein similar to male sterility MS5 [Arabidopsis thaliana] GI:3859112; contains Pfam profile PF00515 TPR Domain
At3g01420
pathogen-responsive alpha-dioxygenase, putative similar to pathogen-inducible alpha-dioxygenase [Nicotiana attenuata] GI:12539609; contains Pfam profile PF03098: Animal haem peroxidase
At1g23205
invertase/pectin methylesterase inhibitor family protein low similarity to pectinesterase from Phaseolus vulgaris SP|Q43111, Lycopersicon esculentum SP|Q43143; contains Pfam profile PF04043: Plant invertase/pectin methylesterase inhibitor
At3g50560 short-chain dehydrogenase/reductase (SDR) family protein contains INTERPRO family IPR002198 short-chain dehydrogenase/reductase (SDR) superfamily
At2g35380 peroxidase 20 (PER20) (P20) identical to SP|Q9SLH7 Peroxidase 20 precursor (EC 1.11.1.7) (Atperox P20) (ATP28a) {Arabidopsis thaliana}
At4g12500
protease inhibitor/seed storage/lipid transfer protein (LTP) family protein similar to pEARLI 1 (Accession No. L43080): an Arabidopsis member of a conserved gene family (PGF95-099), Plant Physiol. 109 (4), 1497 (1995); contains Pfam protease inhibitor/see
At5g16570 glutamine synthetase, putative similar to glutamine synthetase, cytosolic isozyme (glutamate-- ammonia ligase) [Alfalfa] SWISS-PROT:P04078
At1g44800 nodulin MtN21 family protein similar to MtN21 [Medicago truncatula] GI:2598575; contains Pfam profile PF00892: Integral membrane protein
At5g36910 thionin (THI2.2) identical to thionin [Arabidopsis thaliana] gi|1181533|gb|AAC41679 At5g22300 nitrilase 4 (NIT4) identical to SP|P46011 Nitrilase 4 (EC 3.5.5.1) {Arabidopsis thaliana} At1g63710 cytochrome P450, putative similar to cytochrome P450 GB:O23066 [Arabidopsis

253
thaliana]
At4g04955 amidohydrolase family protein similar to SP|P32375 Allantoinase (EC 3.5.2.5) {Saccharomyces cerevisiae}; contains Pfam profile PF01979: Amidohydrolase family
At5g47610 zinc finger (C3HC4-type RING finger) family protein contains Pfam profile: PF00097 zinc finger, C3HC4 type (RING finger)
At5g03350 legume lectin family protein contains Pfam domain, PF00139: Legume lectins beta domain
At1g68880
bZIP transcription factor family protein similar to common plant regulatory factor 6 GI:9650826 from [Petroselinum crispum]; contains Pfam profile: PF00170 bZIP transcription factor
At3g08770 lipid transfer protein 6 (LTP6) identical to GI:8571927
At1g65480
flowering locus T protein (FT) identical to SP|Q9SXZ2 FLOWERING LOCUS T protein {Arabidopsis thaliana}; contains Pfam profile PF01161: Phosphatidylethanolamine-binding protein
At1g49450
transducin family protein / WD-40 repeat family protein contains 7 WD-40 repeats (PF00400); similar to En/Spm-like transposon protein GI:2739374 from [Arabidopsis thaliana]; no characterized homologs
At5g18430
GDSL-motif lipase/hydrolase family protein similar to family II lipase EXL1 GI:15054382 from [Arabidopsis thaliana]; contains Pfam profile PF00657: GDSL-like Lipase/Acylhydrolase
At1g07180
pyridine nucleotide-disulphide oxidoreductase family protein contains similarity to alternative NADH-dehydrogenase GI:3718005 from [Yarrowia lipolytica], SP|P32340 Rotenone-insensitive NADH-ubiquinone oxidoreductase, mitochondrial precursor (EC 1.6.5.3) (
At3g50400
GDSL-motif lipase/hydrolase family protein similar to family II lipase EXL3 (GI:15054386), EXL1 (GI:15054382), EXL2 (GI:15054384) [Arabidopsis thaliana]; contains Pfam profile PF00657: Lipase/Acylhydrolase with GDSL-like motif
At3g25790 myb family transcription factor contains Pfam domain, PF00249: Myb-like DNA-binding domain
At2g21650 myb family transcription factor contains PFAM profile: PF00249 myb-like DNA-binding domain
At1g52690
late embryogenesis abundant protein, putative / LEA protein, putative similar to SP|P13934 Late embryogenesis abundant protein 76 (LEA 76) {Brassica napus}; contains Pfam profile PF02987: Late embryogenesis abundant protein
At5g24420 glucosamine/galactosamine-6-phosphate isomerase-related contains weak similarity to Swiss-Prot:O95336 6-phosphogluconolactonase (EC 3.1.1.31) (6PGL) [Homo sapiens]
At4g15620
integral membrane family protein contains TIGRFAM TIGR01569 : plant integral membrane protein TIGR01569; contains Pfam PF04535 : Domain of unknown function (DUF588)
At1g30530 UDP-glucoronosyl/UDP-glucosyl transferase family protein contains Pfam profile: PF00201 UDP-glucoronosyl and UDP-glucosyl transferase
At1g30700 FAD-binding domain-containing protein similar to SP|P30986 reticuline oxidase precursor (Berberine-bridge-forming enzyme) (BBE) (Tetrahydroprotoberberine

254
synthase) [Eschscholzia californica]; contains PF01565 FAD binding domain
At1g16390
organic cation transporter-related low similarity to Organic cation/carnitine transporter 2 (Solute carrier family 22, member 5) (High-affinity sodium-dependent carnitine cotransporter) from {Homo sapiens} SP|O76082, {Rattus norvegicus} SP|O70594; contain
At3g22060 receptor protein kinase-related contains Pfam profile: PF01657 Domain of unknown function that is usually associated with protein kinase domain Pfam:PF00069
At4g16870 unknown At3g02140 expressed protein
At5g50200 expressed protein similar to unknown protein (pir||T05562) isoform contains a non-consensus AT acceptor splice site at intron 1
At3g21870
cyclin family protein similar to cyclin 2 [Trypanosoma brucei] GI:7339572, cyclin 6 [Trypanosoma cruzi] GI:12005317; contains Pfam profile PF00134: Cyclin, N-terminal domain
At3g55710
[AT3G55700, UDP-glucoronosyl/UDP-glucosyl transferase family protein glucuronosyl transferase homolog, Lycopersicon esculentum, PIR:S39507 ;contains Pfam profile: PF00201 UDP-glucoronosyl and UDP-glucosyl transferase];[AT3G55710, UDP-glucoronosyl/UDP-gl
At5g01810
CBL-interacting protein kinase 15 (CIPK15) identical to CBL-interacting protein kinase 15 [Arabidopsis thaliana] gi|13249134|gb|AAK16692; identical to novel serine/threonine protein kinase [Arabidopsis thaliana] gi|1777312|dbj|BAA06311; contains Pfam prof
At1g26560
glycosyl hydrolase family 1 protein contains Pfam PF00232 : Glycosyl hydrolase family 1 domain; TIGRFAM TIGR01233: 6-phospho-beta-galactosidase; similar to amygdalin hydrolase isoform AH I precursor (GI:16757966) [Prunus serotina]
At2g47880 glutaredoxin family protein contains INTERPRO Domain IPR002109, Glutaredoxin (thioltransferase)
At3g28345
ABC transporter family protein similar to P-glycoprotein [Arabidopsis thaliana] GI:3849833; contains Pfam profiles PF00005: ABC transporter, PF00664: ABC transporter transmembrane region
At1g13650 expressed protein
At5g41080
glycerophosphoryl diester phosphodiesterase family protein weak similarity to SP|P37965 Glycerophosphoryl diester phosphodiesterase (EC 3.1.4.46) {Bacillus subtilis}; contains Pfam profile PF03009: Glycerophosphoryl diester phosphodiesterase family
At3g28740
[AT3G28730, structure-specific recognition protein 1 / high mobility group protein / HMG protein nearly identical to SP|Q05153 Structure-specific recognition protein 1 homolog (HMG protein) {Arabidopsis thaliana}; contains Pfam profile PF00505: HMG (high
At5g43370
[AT5G43370, inorganic phosphate transporter (PHT2) identical to inorganic phosphate transporter [Arabidopsis thaliana] GI:2780348];[AT5G43350, inorganic phosphate transporter (PHT1) (PT1) identical to inorganic phosphate transporter [Arabidopsis thalian
At4g23680 major latex protein-related / MLP-related low similarity to major latex protein {Papaver

255
somniferum}[GI:294060] ; contains Pfam profile PF00407: Pathogenesis-related protein Bet v I family
At3g24290
ammonium transporter, putative similar to SP|Q9SQH9|AT13_ARATH Ammonium transporter 1, member 3 (AtAMT1;3) {Arabidopsis thaliana}; contains Pfam profile PF00909: Ammonium Transporter Family
At1g68440 expressed protein
At5g09520 hydroxyproline-rich glycoprotein family protein contains proline-rich extensin domains, INTERPRO:IPR002965
At2g48130 protease inhibitor/seed storage/lipid transfer protein (LTP) family protein contains Pfam protease inhibitor/seed storage/LTP family domain PF00234
At2g21045
senescence-associated family protein contains similarity to senescence-associated gene Ntdin from GI:7594903 [Nicotiana tabacum]; contains C2-domain profile. (PS50004;PF00168)
At3g30775
proline oxidase, mitochondrial / osmotic stress-responsive proline dehydrogenase (POX) (PRO1) (ERD5) nearly identical to SP|P92983 Proline oxidase, mitochondrial precursor (EC 1.5.3.-) (Osmotic stress- induced proline dehydrogenase) [Arabidopsis thaliana]
At4g28940 nucleosidase-related contains weak similarity to MTA/SAH nucleosidase (P46). (Swiss-Prot:P24247) [Shigella flexneri]
At2g43590 chitinase, putative similar to basic endochitinase CHB4 precursor SP:Q06209 from [Brassica napus]
At1g18810 phytochrome kinase substrate-related contains weak similarity to Swiss-Prot:Q9SWI1 phytochrome kinase substrate 1 [Arabidopsis thaliana]
At5g20270 expressed protein contains Pfam domain, PF03006: Uncharacterised protein family (Hly-III / UPF0073)
At1g79840
homeobox-leucine zipper protein 10 (HB-10) / HD-ZIP transcription factor 10 / homeobox protein (GLABRA2) identical to homeobox protein (GLABRA2) (homeobox-leucine zipper protein ATHB-10) (HD-ZIP protein ATHB-10) GB:P46607 [Arabidopsis thaliana]
At1g80320
oxidoreductase, 2OG-Fe(II) oxygenase family protein similar to GS-AOP loci [GI:16118889, GI:16118887, GI:16118891, GI:16118893]; contains PF03171 2OG-Fe(II) oxygenase superfamily domain
At5g64850 expressed protein
At5g55720 pectate lyase family protein similar to pectate lyase 1 GP:6606532 from [Musa acuminata]
At5g54720 ankyrin repeat family protein contains ankyrin repeats, Pfam:PF00023
At1g02200 CER1 protein identical to maize gl1 homolog (glossy1 locus) GI:1209703 and CER1 GI:1199467 from [Arabidopsis thaliana]
At1g22160 senescence-associated protein-related similar to senescence-associated protein SAG102 (GI:22331931) [Arabidopsis thaliana]
At3g21950
S-adenosyl-L-methionine:carboxyl methyltransferase family protein similar to SAM:salicylic acid carboxyl methyltransferase (SAMT) [GI:6002712][Clarkia breweri] and to SAM:benzoic acid carboxyl methyltransferase (BAMT)[GI:9789277][Antirrhinum

256
majus]
At5g48490 protease inhibitor/seed storage/lipid transfer protein (LTP) family protein contains Pfam protease inhibitor/seed storage/LTP family domain PF00234
At3g50570 hydroxyproline-rich glycoprotein family protein contains proline-rich protein domains, INTERPRO:IPR000694
At1g55260 protease inhibitor/seed storage/lipid transfer protein (LTP) family protein contains Pfam protease inhibitor/seed storage/LTP family domain PF00234
At1g78170 expressed protein
At1g59500
[AT4G37390, auxin-responsive GH3 family protein similar to auxin-responsive GH3 product [Glycine max] GI:18591; contains Pfam profile PF03321: GH3 auxin-responsive promoter];[AT1G59500, auxin-responsive GH3 family protein similar to auxin-responsive GH3
At3g51350 aspartyl protease family protein contains Eukaryotic and viral aspartyl proteases active site, PROSITE:PS00141
At1g01600 cytochrome P450, putative similar to cytochrome P450 GI:10442763 from [Triticum aestivum]
At3g48720 transferase family protein similar to hypersensitivity-related hsr201 protein - Nicotiana tabacum,PIR2:T03274; contains Pfam transferase family domain PF00248
At4g15210 beta-amylase (BMY1) / 1,4-alpha-D-glucan maltohydrolase identical to Beta-amylase (EC 3.2.1.2) (1,4-alpha-D-glucan maltohydrolase) SP:P25853 [Arabidopsis thaliana]
At2g28305 expressed protein contains Pfam profile PF03641: decarboxylase family protein
At3g48920 myb family transcription factor (MYB45) similar to MybHv33 GI:456214 from [Hordeum vulgare]; contains PFAM profile: myb DNA binding domain PF00249
At3g12580 heat shock protein 70, putative / HSP70, putative strong similarity to heat shock protein GI:425194 [Spinacia oleracea]
At1g25450 very-long-chain fatty acid condensing enzyme, putative nearly identical to fatty acid condensing enzyme CUT1 GI:5001734 from [Arabidopsis thaliana]
At3g01140 myb family transcription factor (MYB106) similar to transforming protein (myb) homolog GB:S26605 from [Petunia x hybrida]
At2g35760
integral membrane family protein contains TIGRFAM TIGR01569 : plant integral membrane protein TIGR01569; contains Pfam PF04535 : Domain of unknown function (DUF588)
At3g01550 triose phosphate/phosphate translocator, putative similar to SWISS-PROT:P52178 triose phosphate/phosphate translocator [Cauliflower]{Brassica oleracea}
At2g02950 phytochrome kinase substrate 1 (PKS1) identical to Swiss-Prot:Q9SWI1 phytochrome kinase substrate 1 [Arabidopsis thaliana]
At1g06350 fatty acid desaturase family protein similar to delta 9 acyl-lipid desaturase (ADS1) GI:2970034 from [Arabidopsis thaliana]
At1g18980 germin-like protein, putative similar to germin-like protein subfamily T member 1 [SP|P92995]; contains PS00725 germin family signature
At4g13410
glycosyl transferase family 2 protein similar to beta-(1-3)-glucosyl transferase GB:AAC62210 GI:3687658 from [Bradyrhizobium japonicum], cellulose synthase from Agrobacterium tumeficiens [gi:710492] and Agrobacterium radiobacter [gi:710493];

257
contains Pfam At2g47200 expressed protein
At5g07680
no apical meristem (NAM) family protein contains Pfam PF02365 : No apical meristem (NAM) protein; similar to cup-shaped cotyledon CUC2 (GI:1944132) [Arabidopsis thaliana]
At1g13080
cytochrome P450 family protein identical to gb|D78605 cytochrome P450 monooxygenase from Arabidopsis thaliana and is a member of the PF|00067 Cytochrome P450 family. ESTs gb|Z18072, gb|Z35218 and gb|T43466 come from this gene
At3g17610
bZIP transcription factor family protein / HY5-like protein (HYH) nearly identical to HY5-like protein [Arabidopsis thaliana] GI:18042111; similar to TGACG-motif binding factor GI:2934884 from [Glycine max]; contains Pfam profile: PF00170 bZIP transcripti
At4g37010 caltractin, putative / centrin, putative similar to Caltractin (Centrin) SP:P41210 from [Atriplex nummularia]
At2g47240
long-chain-fatty-acid--CoA ligase family protein / long-chain acyl-CoA synthetase family protein similar to GI:1617270 (MF7P) and gi:1617628 (MF45P) from [Brassica napus] ; contains Pfam AMP-binding enzyme domain PF00501
At1g64500 glutaredoxin family protein
At4g28780
GDSL-motif lipase/hydrolase family protein similar to family II lipase EXL3 (GI:15054386), EXL1 (GI:15054382), EXL2 (GI:15054384) [Arabidopsis thaliana]; contains Pfam profile PF00657: Lipase/Acylhydrolase with GDSL-like motif
At3g10570 cytochrome P450, putative similar to cytochrome P450 77A3 GB:O48928 [Glycine max] At1g15260 expressed protein EST gb|N65467 comes from this gene
At2g21100
disease resistance-responsive protein-related / dirigent protein-related similar to dirigent protein [Thuja plicata] gi|6694699|gb|AAF25360; similar to disease resistance response protein 206-d [Pisum sativum] gi|508844|gb|AAB18669
At5g51460 trehalose-6-phosphate phosphatase (TPPA) identical to trehalose-6-phosphate phosphatase (AtTPPA) [Arabidopsis thaliana] GI:2944178
At2g23540
GDSL-motif lipase/hydrolase family protein similar to family II lipase EXL1 GI:15054382 from [Arabidopsis thaliana]; contains Pfam profile PF00657: GDSL-like Lipase/Acylhydrolase
At4g29030 glycine-rich protein glycine-rich protein - Onobrychis viciifolia,PID:g2565429
At5g47600 heat shock protein-related contains weak similarity to Heat shock 22 kDa protein, mitochondrial precursor (Swiss-Prot:P46254) [Pisum sativum]
At2g48140
protease inhibitor/seed storage/lipid transfer protein (LTP) family protein similar to pEARLI 1 (Accession No. L43080): an Arabidopsis member of a conserved gene family (PGF95-099), Plant Physiol. 109 (4), 1497 (1995); contains Pfam protease inhibitor/see
At4g38080 hydroxyproline-rich glycoprotein family protein contains proline-rich extensin domains, INTERPRO:IPR002965; Common family member: At2g22510 [Arabidopsis thaliana]
At4g24140
hydrolase, alpha/beta fold family protein low similarity to 2-hydroxy-6-oxo-7-methylocta-2,4-dienoate hydrolase [Pseudomonas putida] GI:2822275, hydroxymuconic semialdehyde hydrolase, Pseudomonas stutzeri, AF039534; contains Pfam profile PF00561: hydrolas
258
At4g37980 mannitol dehydrogenase, putative (ELI3-1) identical to GI:16267
At5g13400 proton-dependent oligopeptide transport (POT) family protein contains Pfam profile: PF00854 POT family
At1g66230
myb family transcription factor (MYB20) similar to myb-related transcription factor GI:1430846 from [Lycopersicon esculentum]; contains PFAM profile: Myb DNA binding domain PF00249
At1g29660
GDSL-motif lipase/hydrolase family protein low similarity to family II lipase EXL1 [Arabidopsis thaliana] GI:15054382; contains InterPro Entry IPR001087 Lipolytic enzyme, G-D-S-L family
At1g04220
[AT1G04220, beta-ketoacyl-CoA synthase, putative Strong similarity to beta-keto-Coa synthase gb|U37088 from Simmondsia chinensis, GI:4091810];[AT1G04210, leucine-rich repeat family protein / protein kinase family protein contains Pfam domains PF00560: L
At1g68850 peroxidase, putative identical to peroxidase ATP23a GB:CAA70035 (Arabidopsis thaliana)
At1g65450
transferase family protein low similarity to anthranilate N-hydroxycinnamoyl/benzoyltransferase Dianthus caryophyllus GI:3288180, GI:2239091; contains Pfam profile PF02458 transferase family
At4g17215 expressed protein
At5g13900 protease inhibitor/seed storage/lipid transfer protein (LTP) family protein contains Pfam protease inhibitor/seed storage/LTP family domain PF00234
At2g17300 expressed protein
At2g38110 phospholipid/glycerol acyltransferase family protein low similarity to SP|O87707 CicA protein {Caulobacter crescentus}; contains Pfam profile PF01553: Acyltransferase
At2g32270
zinc transporter (ZIP3) identical to zinc transporter [Arabidopsis thaliana] gi|3252870|gb|AAC24199; member of the Zinc (Zn2+)-Iron (Fe2+) permease (ZIP) family, PMID:11500563
At3g61060 F-box family protein / lectin-related low similarity to PP2 lectin polypeptide [Cucurbita maxima] GI:410437; contains Pfam profile PF00646: F-box domain
At1g72970
glucose-methanol-choline (GMC) oxidoreductase family protein similar to mandelonitrile lyase from Prunus serotina [SP|P52706, SP|P52707]; contains Pfam profile PF00732 GMC oxidoreductase
At5g44550
integral membrane family protein similar to unknown protein (pir||T10581) This family of plant proteins contains a domain that may have a catalytic activity. It has a conserved arginine and aspartate that could form an active site. These proteins are pred
At2g03200 aspartyl protease family protein contains Pfam domain, PF00026: eukaryotic aspartyl protease
At1g64360 expressed protein
At3g13650
disease resistance response protein-related/ dirigent protein-related similar to dirigent protein [Thuja plicata] gi|6694699|gb|AAF25360; similar to pathogenesis-related protein [Pisum sativum] gi|4585273|gb|AAD25355
At3g52720 carbonic anhydrase family protein low similarity to storage protein (dioscorin)

259
[Dioscorea cayenensis] GI:433463; contains Pfam profile PF00194: Eukaryotic-type carbonic anhydrase
At4g08040 1-aminocyclopropane-1-carboxylate synthase, putative / ACC synthase, putative similar to ACC synthase from Malus sylvestris [SP|P37821], Solanum tuberosum [GI:520914]
At1g75030 pathogenesis-related thaumatin family protein identical to thaumatin-like protein [Arabidopsis thaliana] GI:2435406; contains Pfam profile: PF00314 Thaumatin family
At3g23880 F-box family protein contains F-box domain Pfam:PF00646 At4g25760 expressed protein
At1g51840 protein kinase-related contains similarity to light repressible receptor protein kinase [Arabidopsis thaliana] gi|1321686|emb|CAA66376
At2g20870
cell wall protein precursor, putative identical to Putative cell wall protein precursor (Swiss-Prot:P47925) [Arabidopsis thaliana]; weak similarity to mu-protocadherin (GI:7861967) [Rattus norvegicus]
At1g29720 protein kinase family protein contains eukaryotic protein kinase domain, INTERPRO:IPR000719
At1g29600 zinc finger (CCCH-type) family protein contains Pfam domain, PF00642: Zinc finger C-x8-C-x5-C-x3-H type (and similar)
At1g65060
4-coumarate--CoA ligase 3 / 4-coumaroyl-CoA synthase 3 (4CL3) identical to SP|Q9S777 4-coumarate--CoA ligase 3 (EC 6.2.1.12) (4CL 3) (4-coumaroyl-CoA synthase 3) {Arabidopsis thaliana}
At1g06830 glutaredoxin family protein contains INTERPRO Domain IPR002109, Glutaredoxin (thioltransferase)
At1g26770 expansin, putative (EXP10) similar to expansin At-EXP1 GI:1041702 from [Arabidopsis thaliana]; alpha-expansin gene family, PMID:11641069
At5g09480
hydroxyproline-rich glycoprotein family protein contains proline-rich extensin domains, INTERPRO:IPR002965; Common family members At5g09530, At5g09520, At1g44222 [Arabidopsis thaliana]
At5g49350 unknown
At1g49430 long-chain-fatty-acid--CoA ligase / long-chain acyl-CoA synthetase nearly identical to acyl CoA synthetase (MF45P) GI:1617268 from [Brassica napus]
At5g59320
lipid transfer protein 3 (LTP3) identical to lipid transfer protein 3 from Arabidopsis thaliana [gi:8571921]; contains Pfam protease inhibitor/seed storage/LTP family domain PF00234
At1g31920 pentatricopeptide (PPR) repeat-containing protein contains Pfam profile PF01535: PPR repeat
At1g18970 germin-like protein (GLP1) (GLP4) identical to germin-like protein subfamily T member 1 [SP|P92995]
At4g21870
26.5 kDa class P-related heat shock protein (HSP26.5-P) contains Pfam profile: PF00011 Hsp20/alpha crystallin family: identified in Scharf, K-D., et al,Cell Stress & Chaperones (2001) 6: 225-237.
At5g42760
[AT5G42760, O-methyltransferase N-terminus domain-containing protein contains Pfam profile PF02409: O-methyltransferase N-terminus];[AT5G42765, expressed protein]

260
At2g34620 mitochondrial transcription termination factor-related / mTERF-related contains Pfam profile PF02536: mTERF
At3g25710 basic helix-loop-helix (bHLH) family protein contains Pfam profile: PF00010 helix-loop-helix DNA-binding domain
At4g00050 basic helix-loop-helix (bHLH) family protein contains Pfam profile: PF00010 helix-loop-helix DNA-binding domain
At1g12570
glucose-methanol-choline (GMC) oxidoreductase family protein similar to mandelonitrile lyase from Prunus serotina [SP|P52706, SP|P52707]; contains Pfam profile PF00732 GMC oxidoreductase
At5g37690 GDSL-motif lipase/hydrolase family protein similar to family II lipase EXL3 (GI:15054386), EXL1 (GI:15054382), EXL2 (GI:15054384) [Arabidopsis thaliana]
At3g10910 zinc finger (C3HC4-type RING finger) family protein contains Pfam domain, PF00097: Zinc finger, C3HC4 type (RING finger)
At2g38310 expressed protein low similarity to early flowering protein 1 [Asparagus officinalis] GI:1572683, SP|P80889 Ribonuclease 1 (EC 3.1.-.-) {Panax ginseng}
At4g38950
kinesin motor family protein similar to AtNACK1 kinesin-like protein (GI:19979627) [Arabidopsis thaliana]; similar to kinesin-like protein NACK1 (GI:19570247) [Nicotiana tabacum]
At5g26220 ChaC-like family protein contains Pfam profile: PF04752 ChaC-like protein
At1g06100
[AT1G06100, fatty acid desaturase family protein similar to delta 9 acyl-lipid desaturase (ADS1) GI:2970034 from [Arabidopsis thaliana]];[AT1G06120, fatty acid desaturase family protein similar to delta 9 acyl-lipid desaturase GB:BAA25180 GI:2970034 (AD
At1g65490 expressed protein
At2g22510
hydroxyproline-rich glycoprotein family protein similar to proline-rich cell wall protein [Gossypium barbadense] gi|451544|gb|AAA79364; contains proline-rich extensin domains, INTERPRO:IPR002965
At2g21140 hydroxyproline-rich glycoprotein family protein identical to proline-rich protein 2 [Arabidopsis thaliana] gi|7620011|gb|AAF64549
At5g14130 peroxidase, putative identical to peroxidase ATP20a [Arabidopsis thaliana] gi|1546694|emb|CAA67338
At1g11850 expressed protein At5g13580 ABC transporter family protein
At4g37070
[AT4G37070, patatin, putative similar to patatin-like latex allergen [Hevea brasiliensis][PMID:10589016]; contains patatin domain PF01734];[AT4G37060, patatin, putative similar to patatin-like latex allergen [Hevea brasiliensis][PMID:10589016]; contains
At4g24510 eceriferum protein (CER2) identical to (CER2) [Arabidopsis thaliana] GI:1213594; contains Pfam profile PF02458: Transferase family
At5g15600 expressed protein At5g23190 cytochrome P450 family protein contains Pfam profile: PF00067 cytochrome P450
At5g14070 glutaredoxin family protein contains INTERPRO Domain IPR002109, Glutaredoxin (thioltransferase)

261
At4g19830
immunophilin / FKBP-type peptidyl-prolyl cis-trans isomerase family protein similar to 70 kDa peptidylprolyl isomerase (Peptidylprolyl cis-trans isomerase) (PPiase) (Rotamase) (SP:Q43207) [Triticum aestivum]; FKBP-type peptidyl-prolyl cis-trans isomerase,
At2g44460
glycosyl hydrolase family 1 protein contains Pfam PF00232 : Glycosyl hydrolase family 1 domain; TIGRFAM TIGR01233: 6-phospho-beta-galactosidase; similar to beta-glucosidase 1 (GI:12043529) [Arabidopsis thaliana]
At5g43580
protease inhibitor, putative similar to SP|P19873 Inhibitor of trypsin and hageman factor (CMTI-V) {Cucurbita maxima}; contains Pfam profile PF00280: Potato inhibitor I family
At5g60910
agamous-like MADS box protein AGL8 / FRUITFULL (AGL8) NAP1-1, Nicotiana tabacum, EMBL:AF009126; identical to SP:Q38876 Agamous-like MADS box protein AGL8 (Floral homeotic protein AGL8) (FRUITFULL){Arabidopsis thaliana} PMID:9502732, PMID:10648231; identic
At5g47635 expressed protein At4g28290 expressed protein
At3g54420 class IV chitinase (CHIV) almost identical to class IV chitinase from GI:2597826 [Arabidopsis thaliana]
At3g12110 actin 11 (ACT11) identical to SP|P53496 Actin 11 {Arabidopsis thaliana}

262
References
Albers E (2009) Metabolic characteristics and importance of the universal methionine salvage pathway recycling methionine from 5′-methylthioadenosine. IUBMB Life 61: 1132-1142
Aloni R, Aloni E, Langhans M, Ullrich CI (2006) Role of auxin in regulating Arabidopsis flower development. Planta 223: 315-328
Alonso JM, Stepanova AN, Leisse TJ, Kim CJ, Chen H, Shinn P, Stevenson DK, Zimmerman J, Barajas P, Cheuk R (2003) Genome-wide insertional mutagenesis of Arabidopsis thaliana. Science 301: 653 - 657
Alvarez-Buylla ER, Benítez M, Corvera-Poiré A, Chaos Cador Á, de Folter S, Gamboa de Buen A, Garay-Arroyo A, García-Ponce B, Jaimes-Miranda F, Pérez-Ruiz RV (2010) Flower development. The Arabidopsis Book 8: 1-57
Anderegg G, Ripperger H (1989) Correlation between metal complex formation and biological activity of nicotianamine analogues. J.Chem.Soc., Chem.Commun. 647-650
Arnold K, Bordoli L, Kopp J, Schwede T (2006) The SWISS-MODEL workspace: a web-based environment for protein structure homology modelling. Bioinformatics 22: 195-201
Asami T, Nakano T, Nakashita H, Sekimata K, Shimada Y, Yoshida S (2003) The influence of chemical genetics on plant science: shedding light on functions and mechanism of action of brassinosteroids using biosynthesis inhibitors. J Plant Growth Regul 22: 336-349
Baima S, Nobili F, Sessa G, Lucchetti S, Ruberti I, Morelli G (1995) The expression of the Athb-8 homeobox gene is restricted to provascular cells in Arabidopsis thaliana. Development 121: 4171-4182
Bais PH, Ravishankar GA (2002) Role of polyamines in the ontogeny of plants and their biotechnological applications. Plant cell, tissue and organ culture 69: 1-34
Baron K, Stasolla C (2008) The role of polyamines during in vivo and in vitro development. In Vitro Cell Dev-Pl 44: 384-395
Benjamins R, Quint AB, Weijers D, Hooykaas P,Offringa R (2001) The PINOID protein kinase regulates organ development in Arabidopsis by enhancing polar auxin transport. Development 128: 4057 - 4067
Benková E, Michniewicz M, Sauer M, Teichmann T, Seifertová D, Jürgens G, Friml J (2003) Local, efflux-dependent auxin gradients as a common module for plant organ formation. Cell 115: 591-602

263
Bennett SRM, Alvarez J, Bossinger G, Smyth DR (1995) Morphogenesis in pinoid mutants of Arabidopsis thaliana. Plant J 8: 505-520
Berger F, Grini PE, Schnittger A (2006) Endosperm: an integrator of seed growth and development. Curr Opin Plant Biol 9: 664-670
Berleth T, Mattsson J, Hardtke CS (2000) Vascular continuity and auxin signals. Trends Plant Sci 5: 387-393
Berleth T, Sachs T (2001) Plant morphogenesis: long-distance coordination and local patterning. Curr Opin Plant Biol 4: 57-62
Bertino JR, Waud WR, Parker WB, Lubin M (2011) Targeting tumors that lack methylthioadenosine phosphorylase (MTAP) activity: current strategies. Cancer Biol Ther 11: 627-32
Bleecker AB, Kende H (2000) Ethylene: a gaseous signal molecule in plants. Annu Rev Cell Dev Biol 16: 1-18
Böhme H, Scholz G (1960) VersuchezurNormalisierung des Phänotyps Mutante Chloronerva von Lycopersicon esculentum Mill. Kulturpflanze 8: 93-109
Bowman JL (1994) Arabidopsis: an atlas of morphology and development. Springer-Verlag NY 450pp.
Boyes DC, Zayed AM, Ascenzi R, McCaskill AJ, Hoffman NE, Davis KR, Gorlach J (2001) Growth stage-based phenotypic analysis of Arabidopsis: a model for high throughput functional genomics in plants. Plant Cell 13: 1499-1510
Braybrook SA, Harada JJ (2008) LECs go crazy in embryo development. Trends Plant Sci 13: 624-630
Bürstenbinder K, Rzewuski G, Wirtz M, Hell R, Sauter M (2007) The role of methionine recycling for ethylene synthesis in Arabidopsis. Plant J 49: 238-249
Bürstenbinder K, Waduwara I, Schoor S, Moffatt BA, Wirtz M, Minocha SC, Oppermann Y, Bouchereau A, Hell R, Sauter M (2010) Inhibition of 5’‐methylthioadenosine metabolism in the Yang cycle alters polyamine levels, and impairs seedling growth and reproduction in Arabidopsis. Plant J 62: 977-988
Caño-Delgado A, Yin Y, Yu C, Vafeados D, Mora-García S, Cheng JC, Nam KH, Li J, Chory J (2004) BRL1 and BRL3 are novel brassinosteroid receptors that function in vascular differentiation in Arabidopsis. Development 131: 5341
Carland FM, McHale NA (1996) LOP1: a gene involved in auxin transport and vascular patterning in Arabidopsis. Development 122: 1811

264
Cecchetti V, Altamura MM, Falasca G, Costantino P, Cardarelli M (2008) Auxin regulates Arabidopsis anther dehiscence, pollen maturation, and filament elongation. Plant J 20: 1760 -1774
Cheng Y, Dai X, Zhao Y (2006) Auxin biosynthesis by the YUCCA flavin monooxygenases controls the formation of floral organs and vascular tissues in Arabidopsis. Genes Dev 20: 1790 - 1799
Choe S, Noguchi T, Fujioka S, Takatsuto S, Tissier CP, Gregory BD, Ross AS, Tanaka A, Yoshida S, Tax FE (1999) The Arabidopsis dw f 7/ste1 Mutant Is Defective in the δ7 Sterol C-5 Desaturation Step Leading to Brassinosteroid Biosynthesis. Plant Cell 11: 207 - 222
Clay NK, Nelson T (2005) Arabidopsis thick vein Mutation Affects Vein Thickness and Organ Vascularization, and Resides in a Pro vascular Cell-Specific Spermine Synthase Involved in Vein Definition and in Polar Auxin Transport. Plant Physiol 138: 767-777
Clough SJ, Bent AF (1998) Floral dip: a simplified method for Agrobacterium‐mediated transformation ofArabidopsis thaliana. Plant J 16: 735-743
Cnops G, Neyt P, Raes J, Petrarulo M, Nelissen H, Malenica N, Luschnig C, Tietz O, Ditengou F, Palme K (2006) The TORNADO1 and TORNADO2 genes function in several patterning processes during early leaf development in Arabidopsis thaliana. Plant Cell 18: 852 - 866
Cona A, Rea G, Angelini R, Federico R, Tavladoraki P (2006) Functions of amine oxidases in plant development and defence. Trends Plant Sci 11: 80-88
Cornell KA, Winter RW, Tower PA, Riscoe M (1996) Affinity purification of 5-methylthioribose kinase and 5-methylthioadenosine/S-adenosylhomocysteine nucleosidase from Klebsiella pneumoniae [corrected]. Biochem J 317: 285 - 290
Costa LM, Gutierrez-Marcos JF, Dickinson HG (2004) More than a yolk: the short life and complex times of the plant endosperm. Trends Plant Sci 9: 507-514
Curie C, Cassin G, Couch D, Divol F, Higuchi K, Le Jean M, Misson J, Schikora A, Czernic P, Mari S (2009) Metal movement within the plant: contribution of nicotianamine and yellow stripe 1-like transporters. Ann Bot 103: 1-11
Demura T, Fukuda H (2007) Transcriptional regulation in wood formation. Trends Plant Sci 12: 64-70
Dengler N, Kang J (2001) Vascular patterning and leaf shape. Curr Opin Plant Biol 4: 50-56
Dengler NG (2006) The shoot apical meristem and development of vascular architecture. Can J Bot 84: 1660-1671

265
Dhonukshe P, Aniento F, Hwang I, Robinson DG, Mravec J, Stierhof YD, Friml J (2007) Clathrin-mediated constitutive endocytosis of PIN auxin efflux carriers in Arabidopsis. Current Biol 17: 520-527
Dhonukshe P, Grigoriev I, Fischer R, Tominaga M, Robinson DG, Hašek J, Paciorek T, Petrášek J, Seifertová D, Tejos R (2008) Auxin transport inhibitors impair vesicle motility and actin cytoskeleton dynamics in diverse eukaryotes. Pro Nat Acad Sci 105: 4489 - 4494
Emsley P, Cowtan K (2004) Coot: model-building tools for molecular graphics. Acta Crystallogr D Biol Crystallogr 60 : 2126-2132
Ewing TJA, Makino S, Skillman AG, Kuntz ID (2001) DOCK 4.0: search strategies for automated molecular docking of flexible molecule databases. J Comput Aid Mol Des 15: 411-428
Feng H, Chen Q, Feng J, Zhang J, Yang X, Zuo J (2007) Functional characterization of the Arabidopsis eukaryotic translation initiation factor 5A-2 that plays a crucial role in plant growth and development by regulating cell division, cell growth, and cell death. Plant Physiol 144: 1531 - 1545
Friml J, Vieten A, Sauer M, Weijers D, Schwarz H, Hamann T, Offringa R, Jurgens G (2003) Efflux-dependent auxin gradients establish the apical-basal axis of Arabidopsis. Nature 426: 147-153
Friml J, Yang X, Michniewicz M, Weijers D, Quint A, Tietz O, Benjamins R, Ouwerkerk PBF, Ljung K, Sandberg G (2004) A PINOID-dependent binary switch in apical-basal PIN polar targeting directs auxin efflux. Science 306: 862 - 865
Fukuda H (1997) Tracheary element differentiation. Plant Cell 9: 1147 - 1156
Fukuda H (2004) Signals that control plant vascular cell differentiation. Nature Reviews Molecular Cell Biol 5: 379-391
Gadapati WR, Macfie SM (2006) Phytochelatins are only partially correlated with Cd-stress in two species of Brassica. Plant Sci 170: 471-480
Gälweiler L, Guan C, Müller A, Wisman E, Mendgen K, Yephremov A, Palme K (1998) Regulation of polar auxin transport by AtPIN1 in Arabidopsis vascular tissue. Science 282: 2226
Ge C, Cui X, Wang Y, Hu Y, Fu Z, Zhang D, Cheng Z, Li J (2006) BUD2, encoding an S-adenosylmethionine decarboxylase, is required for Arabidopsis growth and development. Cell Res 16: 446-456
Gehring M, Choi Y, Fischer RL (2004) Imprinting and seed development. Plant Cell 16: S203 – S213

266
Geldner N, Anders N, Wolters H, Keicher J, Kornberger W, Muller P, Delbarre A, Ueda T, Nakano A, Jürgens G (2003) The Arabidopsis GNOM ARF-GEF mediates endosomal recycling, auxin transport, and auxin-dependent plant growth. Cell 112: 219-230
Goldberg RB, Beals TP, Sanders PM (1993) Anther development: basic principles and practical applications. Plant Cell 5: 1217 - 1229
Grunewald W, Fimrl J (2010) The march of the PINs: developmental plasticity by dynamic polar targeting in plant cells. EMBO J 29: 2700-2714
Guranowski A, Montgomery JA, Cantoni GL, Chiang PK (1981) Adenosine analogs as substrates and inhibitors of S-adenosylhomocysteine hydrolase. Biochemistry (N Y) 20: 110-115
Ha HC, Sirisoma NS, Kuppusamy P, Zweier JL, Woster PM, Casero RA (1998) The natural polyamine spermine functions directly as a free radical scavenger. Proc Nat Acad Sci 95: 11140 - 11147
Hamann T, Benkova E, Bäurle I, Kientz M, Jürgens G (2002) The Arabidopsis BODENLOS gene encodes an auxin response protein inhibiting MONOPTEROS-mediated embryo patterning. Genes Dev 16: 1610 - 1615
Hamann T, Mayer U, Jurgens G (1999) The auxin-insensitive bodenlos mutation affects primary root formation and apical-basal patterning in the Arabidopsis embryo. Development 126: 1387 - 1395
Hanfrey C, Sommer S, Mayer MJ, Burtin D, Michael AJ (2001) Arabidopsis polyamine biosynthesis: absence of ornithine decarboxylase and the mechanism of arginine decarboxylase activity. Plant J 27: 551-560
Hanzawa Y, Takahashi T, Komeda Y (1997) ACL5: an Arabidopsis gene required for internodal elongation after flowering. Plant J 12: 863-874
Hanzawa Y, Takahashi T, Michael AJ, Burtin D, Long D, Pineiro M, Coupland G, Komeda Y (2000) ACAULIS5, an Arabidopsis gene required for stem elongation, encodes a spermine synthase. EMBO J 19: 4248-4256
Hardtke CS, Berleth T (1998) The Arabidopsis gene MONOPTEROS encodes a transcription factor mediating embryo axis formation and vascular development. EMBO J 17: 1405-1411
Haughn G, Chaudhury A (2005) Genetic analysis of seed coat development in Arabidopsis. Trends Plant Sci 10: 472-477
He Y, Fukushige H, Hildebrand DF, Gan S (2002) Evidence supporting a role of jasmonic acid in Arabidopsis leaf senescence. Plant Physiol 128: 876 - 884

267
Herbik A (1997) Proteinchemische und molecular biologische Charakterisierung der Tomaten mutante
chloronerva. PhD thesis. Humboldt-University, Berlin. pp 102.
Herbik A, Koch G, Mock HP, Dushkov D, Czihal A, Thielmann J, Stephan U (1999) Isolation, characterization and cDNA cloning of nicotianamine synthase from barley. Eur J Biochem 265: 231-239
Hobbie L, McGovern M, Hurwitz LR, Pierro A, Liu NY, Bandyopadhyay A, Estelle M (2000) The axr6 mutants of Arabidopsis thaliana define a gene involved in auxin response and early development. Development 127: 23 - 32
Huala E, Dickerman AW, Garcia-Hernandez M, Weems D, Reiser L, LaFond F, Hanley D, Kiphart D, Zhuang M, Huang W (2001) The Arabidopsis Information Resource (TAIR): a comprehensive database and web-based information retrieval, analysis, and visualization system for a model plant. Nucleic Acids Res 29: 102 - 105
Huh JH, Bauer MJ, Hsieh TF, Fischer RL (2008) Cellular programming of plant gene imprinting. Cell 132: 735-744
Hyodo H, Tanaka K (1986) Inhibition of 1-aminocyclopropane-l-carboxylic acid synthase activity by polyamines, their related compounds and metabolites of S-adenosylmethionine. Plant and cell physiol 27: 391 - 398
Ibañes M, Fàbregas N, Chory J, Caño-Delgado AI (2009) Brassinosteroid signaling and auxin transport are required to establish the periodic pattern of Arabidopsis shoot vascular bundles. Proc Natl Acad Sci 106: 13630-13635
Ibeñes M, Schreiber K, Ripperger H, Kircheiss A (1983) Metal complex formation by nicotianamine, a possibl e phytosiderophore. Cellular and Molecular Life Sci 39: 261-262
Igarashi K, Kashiwagi K (2010) Modulation of cellular function by polyamines. Int J Biochem Cell Biol 42: 39-51
Imai A, Akiyama T, Kato T, Sato S, Tabata S, Yamamoto KT, Takahashi T (2004a) Spermine is not essential for survival of Arabidopsis. FEBS Lett 556: 148-152
Imai A, Hanzawa Y, Komura M, Yamamoto KT, Komeda Y, Takahashi T (2006) The dwarf phenotype of the Arabidopsis acl5 mutant is suppressed by a mutation in an upstream ORF of a bHLH gene. Development 133: 3575 - 3585

268
Imai A, Matsuyama T, Hanzawa Y, Akiyama T, Tamaoki M, Saji H, Shirano Y, Kato T, Hayashi H, Shibata D (2004b) Spermidine synthase genes are essential for survival of Arabidopsis. Plant Physiol 135: 1565 - 1573
Initiative AG (2000) Arabidopsis Genome Initiative, 2000. Analysis of the genome sequence of the flowering plant Arabidopsis thaliana. Nature 408: 796–815
Irish VF (2010) The flowering of Arabidopsis flower development. Plant J 61: 1014-1028
Irizarry RA, Warren D, Spencer F, Kim IF, Biswal S, Frank BC, Gabrielson E, Garcia JGN, Geoghegan J, Germino G (2005) Multiple-laboratory comparison of microarray platforms. Nature methods 2: 345-350
Jaillais Y, Chory J (2010) Unraveling the paradoxes of plant hormone signaling integration. Nat Struct Mol Biol 17: 642-645
Kakehi J, Kuwashiro Y, Niitsu M, Takahashi T (2008) Thermospermine is required for stem elongation in Arabidopsis thaliana. Plant Cell Physiol 49: 1342-1349
Karim Sorefan TG, Sarah JL, Karin Ljung PR, Carlos S, Remko Offringa J (2009) A regulated auxin minimum is required for seed dispersal in Arabidopsis. Nature 459: 583-586
Klatte M, Schuler M, Wirtz M, Fink-Straube C, Hell R, Bauer P (2009) The analysis of Arabidopsis nicotianamine synthase mutants reveals functions for nicotianamine in seed iron loading and iron deficiency responses. Plant Physiol 150: 257-271
Kleine-Vehn J, Friml J (2008) Polar targeting and endocytic recycling in auxin-dependent plant development. Annu Rev Cell Dev Biol 24: 447-473
Kojima M, Kamada-Nobusada T, Komatsu H, Takei K, Kuroha T, Mizutani M, Ashikari M, Ueguchi-Tanaka M, Matsuoka M, Suzuki K (2009) Highly sensitive and high-throughput analysis of plant hormones using MS-probe modification and liquid chromatography–tandem mass spectrometry: an application for hormone profiling in Oryza sativa. Plant and cell physiol 50: 1201 - 1214
Koornneef M, Hanhart C, Veen JH (1991) A genetic and physiological analysis of late flowering mutants in Arabidopsis thaliana. Mol Genl Gen 229: 57-66
Krizek BA (2011) Auxin regulation of Arabidopsis flower development involves members of the AINTEGUMENTA-LIKE/PLETHORA (AIL/PLT) family. J Exp Bot 62: 3311 - 3319
Kumar A, Taylor M, Altabella T, Tiburcio AF (1997) Recent advances in polyamine research. Trends Plant Sci 2: 124-130

269
Kusano T, Yamaguchi K, Berberich T, Takahashi Y (2007) Advances in polyamine research in 2007. J Plant Res 120: 345-350
Kushad MM, Richardson DG, Ferro AJ (1985) 5'-Methylthioadenosine Nucleosidase and 5-Methylthioribose Kinase Activities and Ethylene Production during Tomato Fruit Development and Ripening. Plant Physiol 79: 525-529
Laemmli UK (1970) Cleavage of structural proteins during the assembly of the head of bacteriophage T4. Nature 227: 680-685
Lan P, Li W, Wen TN, Shiau JY, Wu YC, Lin W, Schmidt W (2011) iTRAQ Protein Profile Analysis of Arabidopsis Roots Reveals New Aspects Critical for Iron Homeostasis. Plant Physiol 155: 821-834
Lancashire PD, Bleiholder H, Boom T, Langelüddeke P, Stauss R, Weber E, Witzenberger A (1991) A uniform decimal code for growth stages of crops and weeds. Ann App Biol 119: 561-601
Lee JE, Luong W, Huang DJT, Kenneth A, Riscoe MK, Howell PL (2005) Mutational analysis of a nucleosidase involved in quorum-sensing autoinducer-2 biosynthesis. Biochem 44: 11049-11057
Ling HQ, Koch G, Bäumlein H, Ganal MW (1999) Map-based cloning of chloronerva, a gene involved in iron uptake of higher plants encoding nicotianamine synthase. Pro Nat Acad Sci 96: 7098 - 7103
Loenen W (2006) S-Adenosylmethionine: jack of all trades and master of everything? Biochem Soc Trans 34: 330-333
Liu Z, Duguay J, Ma F, Wang T.W, Tshin R, Hopkins M, Nowack L, Thompson J.E. (2008) Modulation of eIF5A1 expression alters xylem abundance in Arabidopsis thaliana J Ex Bot 59: 939–950.
Luo J, Fuell C, Parr A, Hill L, Bailey P, Elliott K, Fairhurst SA, Martin C, Michael AJ (2009) A novel polyamine acyltransferase responsible for the accumulation of spermidine conjugates in Arabidopsis seed. Plant Cell 21: 318 – 333.
Mähönen AP, Bishopp A, Higuchi M, Nieminen KM, Kinoshita K, Törmäkangas K, Ikeda Y, Oka A, Kakimoto T, Helariutta Y (2006) Cytokinin signaling and its inhibitor AHP6 regulate cell fate during vascular development. Science 311: 94 - 98
Mähönen AP, Bonke M, Kauppinen L, Riikonen M, Benfey PN, Helariutta Y (2000) A novel two-component hybrid molecule regulates vascular morphogenesis of the Arabidopsis root. Genes Dev 14: 2938 - 2943
Mattsson J, Ckurshumova W, Berleth T (2003) Auxin signaling in Arabidopsis leaf vascular development. Plant Physiol 131: 1327 - 1339

270
Mattsson J, Sung ZR, Berleth T (1999) Responses of plant vascular systems to auxin transport inhibition. Development 126: 2979-2991
May MJ, and Leaver CJ (1993) Oxidative Stimulation of Glutathione Synthesis in Arabidopsis thaliana Suspension Cultures. Plant Physiol103: 621- 627
McCormick S (2004) Control of male gametophyte development. Plant Cell 16: S142
Meinke DW (1994) seed development in Arabidopsis .In EM Meyerowitz, CR Somerville, eds, Arabidopsis. Cold Spring Harbor Laboratory Press, Cold Spring Harbor, NY, pp 253–295,
Michniewicz M, Zago MK, Abas L, Weijers D, Schweighofer A, Meskiene I, Heisler MG, Ohno C, Zhang J, Huang F (2007) Antagonistic regulation of PIN phosphorylation by PP2A and PINOID directs auxin flux. Cell 130: 1044-1056
Minocha R, Shortle WC, Long SL, Minocha SC (1994) A rapid and reliable procedure for extraction of cellular polyamines and inorganic ions from plant tissues. J Plant Growth Regul 13: 187-193
Minocha SC, Minocha R, Robie CA (1990) High-performance liquid chromatographic method for the
determination of dansyl-polyamines. J Chromatogr A 511: 177-183
Moffatt B, Somerville C (1988) Positive selection for male-sterile mutants of Arabidopsis lacking adenine phosphoribosyltransferase activity. Plant Physiol 86: 1150-1154
Møller SG, McPherson MJ (1998) Developmental expression and biochemical analysis of the Arabidopsis atao1 gene encoding an H2O2‐generating diamine oxidase. Plant J 13: 781-791
Mori T, Kuroiwa H, Higashiyama H, Kuroiwa T (2006) GENERATIVE CELL SPECIFIC 1 is essential for
angiosperm fertilization. Nature cell Biology 8: 64 -71
Moschou PN, Paschalidis KA, Delis ID, Andriopoulou AH, Lagiotis GD, Yakoumakis DI, Roubelakis-Angelakis KA (2008) Spermidine exodus and oxidation in the apoplast induced by abiotic stress is responsible for H2O2 signatures that direct tolerance responses in tobacco. Plant Cell 20: 1708 - 1728
Mueller LA, Zhang P, Rhee SY (2003) AraCyc: a biochemical pathway database for Arabidopsis. Plant Physiol 132: 453 - 460
Muñiz L, Minguet EG, Singh SK, Pesquet E, Vera-Sirera F, Moreau-Courtois CL, Carbonell J, Blázquez MA, Tuominen H (2008) ACAULIS5 controls Arabidopsis xylem specification through the prevention of premature cell death. Development 135: 2573-2582

271
Murashige T, Skoog F (1962) A revised medium for rapid growth and bio assays with tobacco tissue cultures. Physiol Plant 15: 473-497
Mustroph A, Zanetti ME, Jang CJH, Holtan HE, Repetti PP, Galbraith DW, Girke T, Bailey-Serres J (2009) Profiling translatomes of discrete cell populations resolves altered cellular priorities during hypoxia in Arabidopsis. Proc Nat Acad Sci 106: 18843
Naka Y, Watanabe K, Sagor G, Niitsu M, Pillai MA, Kusano T, Takahashi Y (2010) Quantitative analysis of plant polyamines including thermospermine during growth and salinity stress. Plant Physiol Bioch 48: 527-533
Nakagami H, Soukupova H, Schikora A, Zarsky´ V, and Hirt H (2006) A Mitogen-activated Protein Kinase Mediates Reactive Oxygen Species Homeostasis in Arabidopsis. J BiolChem 281: 38697-8704
Nakamichi N, Kusano M, Fukushima A, Kita M, Ito S, Yamashino T, Saito K, Sakakibara H, Mizuno T (2009) Transcript profiling of an Arabidopsis PSEUDO RESPONSE REGULATOR arrhythmic triple mutant reveals a role for the circadian clock in cold stress response. Plant and Cell Physiol 50: 447
Nemhauser JL, Feldman LJ, Zambryski PC (2000) Auxin and ETTIN in Arabidopsis gynoecium morphogenesis. Development 127: 3877 -3880
Nieminen KM, Kauppinen L, Helariutta Y (2004) A weed for wood? Arabidopsis as a genetic model for xylem development. Plant Physiol 135: 653 - 657
Oh SI, Park J, Yoon S, Kim Y, Park S, Ryu M, Nam MJ, Ok SH, Kim JK, Shin JS (2008) The Arabidopsis Calcium Sensor Calcineurin B-Like 3 Inhibits the 5'-Methylthioadenosine Nucleosidase in a Calcium-Dependent Manner. Plant Physiol 148: 1883-1896
Ohashi-Ito K, Fukuda H (2003) HD-zip III homeobox genes that include a novel member, ZeHB-13 (Zinnia)/ATHB-15 (Arabidopsis), are involved in procambium and xylem cell differentiation. Plant and cell physiol 44: 1350
Ohnuma M, Ganbe T, Terui Y, Niitsu M, Sato T, Tanaka N, Tamakoshi M, Samejima K, Kumasaka T, Oshima T (2011) Crystal Structures and Enzymatic Properties of a Triamine/AgmatineAminopropyltransferase from Thermusthermophilus. J Mol Biol 408: 971-986
Okada K, Ueda J, Komaki MK, Bell CJ, Shimura Y (1991) Requirement of the Auxin Polar Transport System in Early Stages of Arabidopsis Floral Bud Formation. Plant Cell 3: 677-684
Orlando DA, Brady SM, Koch JD, Dinneny JR, Benfey PN (2009) Manipulating large-scale Arabidopsis microarray expression data: Identifying dominant expression patterns and biological process enrichment. Methods Mol Biol 553: 57-77

272
Pagnussat GC, Yu HJ, Ngo QA, Rajani S, Mayalagu S, Johnson CS, Capron A, Xie LF, Ye D, Sundaresan V (2005) Genetic and molecular identification of genes required for female gametophyte development and function in Arabidopsis. Development 132: 603 - 614
Pandey S, Ranade S, Nagar P, Kumar N (2000) Role of polyamines and ethylene as modulators of plant senescence. J Biosci 25: 291-299
Park MH (2006) The post-translational synthesis of a polyamine-derived amino acid, hypusine, in the eukaryotic translation initiation factor 5A (eIF5A). J Biochem 139: 161- 169
Park MH, Wolff EC, Folk JE (1993) Hypusine: its post-translational formation in eukaryotic initiation factor 5A and its potential role in cellular regulation. Biofactors 4: 95-104
Pegg A, Shuttleworth K, Hibasami H (1981) Specificity of mammalian spermidine synthase and spermine synthase. Biochem J 197: 315-320
Pegg AE, Casero RA (2011) Current status of the polyamine research field. Methods in MolBiol 720: 3-35
Pianelli K, Mari S, Marques L, Lebrun M, Czernic P (2005) Nicotianamine over-accumulation confers resistance to nickel in Arabidopsis thaliana. Transgenic Res 14: 739-748
Pierre T, Laurent C, Andrée H, Alexandra P, Emile K, Georges B, Claire P A novel high efficiency, low maintenance, hydroponic system for synchronous growth and flowering of Arabidopsis thaliana. BMC Plant Biol 3:2-10
Pommerrenig B, Feussner K, Zierer W, Rabinovych V, Klebl F, Feussner I, Sauer N (2011) Phloem-Specific Expression of Yang Cycle Genes and Identification of Novel Yang Cycle Enzymes in Plantago and Arabidopsis. Plant Cell 23: 1904-1919
Prado AM, Colaço R, Moreno N, Silva AC, Feijó JA (2008) Targeting of pollen tubes to ovules is dependent on nitric oxide (NO) signaling. Molecular plant 1: 703 - 714
Raghavan V (2006) Double fertilization: embryo and endosperm development in flowering plants. Springer Verlag, Germany, pp 174-175
Rzewuski G, Cornell KA, Rooney L, Bürstenbinder K, Wirtz M, Hell R, Sauter M (2007) OsMTN encodes a 5′-methylthioadenosine nucleosidase that is up-regulated during submergence-induced ethylene synthesis in rice (Oryzasativa L.). J Exp Bot 58: 1505-1514
Sanders PM, Bui AQ, Weterings K, McIntire K, Hsu YC, Lee PY, Truong MT, Beals T, Goldberg R (1999) Anther developmental defects in Arabidopsis thaliana male-sterile mutants. Sexual Plant Reproduction 11: 297-322

273
Sauter M, Cornell KA, Beszteri S, Rzewuski G (2004) Functional analysis of methylthioribose kinase genes in plants. Plant Physiol 136: 4061-4071
Sawada Y, Akiyama K, Sakata A, Kuwahara A, Otsuki H, Sakurai T, Saito K, Hirai MY (2009) Widely targeted metabolomics based on large-scale MS/MS data for elucidating metabolite accumulation patterns in plants. Plant and Cell Physiol 50: 37 - 47
Scarpella E, Marcos D, Friml J, Berleth T (2006) Control of leaf vascular patterning by polar auxin transport. Genes Dev 20: 1015 - 1027
Schneitz K, Hulskamp M, Kopczak SD, Pruitt RE (1997) Dissection of sexual organ ontogenesis: a genetic analysis of ovule development in Arabidopsis thaliana. Development 124: 1367 - 1376
Schneitz K, Hülskamp M, Pruitt RE (1995) Wild‐type ovule development in Arabidopsis thaliana: a light microscope study of cleared whole‐mount tissue. Plant J 7: 731-749
Schwab R, Ossowski S, Riester M, Warthmann N, Weigel D (2006) Highly specific gene silencing by artificial microRNAs in Arabidopsis. Plant Cell 18: 1121 - 1133
Sessions R (1997) Arabidopsis (Brassicaceae) flower development and gynoecium patterning in wild type and ettin mutants. Am J Bot 84: 1179 - 1183
Siu KKW, Asmus K, Zhang AN, Horvatin C, Li S, Liu T, Moffatt B, Woods Jr VL, Howell PL (2011) Mechanism of substrate specificity in 5'-methylthioadenosine/S-adenosylhomocysteine nucleosidases. J Struct Biol 173: 86-98
Siu KKW, Lee JE, Sufrin JR, Moffatt BA, McMillan M, Cornell KA, Isom C, Howell PL (2008) Molecular Determinants of Substrate Specificity in Plant 5'-Methylthioadenosine Nucleosidases. J Mol Biol 378: 112-128
Smyth DR, Bowman JL, Meyerowitz EM (1990) Early flower development in Arabidopsis. Plant Cell 2: 755-767
Somerville C, Koornneef M (2002) A fortunate choice: the history of Arabidopsis as a model plant. Nat Rev Gen 3: 883-889
Stevens AP, Spangler B, Wallner S, Kreutz M, Dettmer K, Oefner PJ, Bosserhoff AK (2009) Direct and tumor microenvironment mediated influences of 5′-deoxy-5′-(methylthio) adenosine on tumor progression of malignant melanoma. J Cell Biochem 106: 210-219
Su YH, Liu YB, Zhang XS (2011) Auxin–Cytokinin Interaction Regulates Meristem Development. Molecular Plant doi:10.1093/mp/ssr007

274
Szekeres M, Németh K, Koncz-Kálmán Z, Mathur J, Kauschmann A, Altmann T, Rédei GP, Nagy F, Schell J, Koncz C (1996) Brassinosteroids rescue the deficiency of CYP90, a cytochrome P450, controlling cell elongation and de-etiolation in Arabidopsis. Cell 85: 171-182
Takahashi M, Terada Y, Nakai I, Nakanishi H, Yoshimura E, Mori S, Nishizawa NK (2003) Role of nicotianamine in the intracellular delivery of metals and plant reproductive development. Plant Cell 15: 1263-1280
Takahashi T, Kakehi JI (2010) Polyamines: ubiquitous polycations with unique roles in growth and stress responses. Ann Bot 105: 1-6
Tanaka T, Tanaka H, Machida C, Watanabe M, Machida Y (2004) A new method for rapid visualization of defects in leaf cuticle reveals five intrinsic patterns of surface defects in Arabidopsis. Plant J 37: 139-146
Tassoni A, van Buuren M, Franceschetti M, Fornalè S, Bagni N (2000) Polyamine content and metabolism in Arabidopsis thaliana and effect of spermidine on plant development. Plant Physiol Biochem 38: 383-393
Tisi A, Federico R, Moreno S, Lucretti S, Moschou PN, Roubelakis-Angelakis KA, Angelini R, Cona A (2011) Perturbation of polyamine catabolism can strongly affect root development and xylem differentiation. Plant Physiol. 157: 200–215
Toledo-Ortiz G, Huq E, Quail PH (2003) The Arabidopsis basic/helix-loop-helix transcription factor family. Plant Cell 15: 1749 - 1770
Trampczynska A, Bottcher C, Clemens S (2006) The transition metal chelator nicotianamine is synthesized by filamentous fungi. FEBS Lett 580: 3173-3178
Truernit E, Bauby H, Dubreucq B, Grandjean O, Runions J, Barthélémy J, Palauqui JC (2008) High-resolution whole-mount imaging of three-dimensional tissue organization and gene expression enables the study of phloem development and structure in Arabidopsis. Plant Cell 20: 1494 - 1503
Tsuchisaka A, Theologis A (2004) Unique and overlapping expression patterns among the Arabidopsis 1-amino-cyclopropane-1-carboxylate synthase gene family members. Plant Physiol 136: 2982 -2989
Tsuchisaka A, Yu G, Jin H, Alonso JM, Ecker JR, Zhang X, Gao S, Theologis A (2009) A combinatorial interplay among the 1-aminocyclopropane-1-carboxylate isoforms regulates ethylene
biosynthesis in Arabidopsis thaliana. Genetics 183: 979- 789
Urano K, Hobo T, Shinozaki K (2005) Arabidopsis ADC genes involved in polyamine biosynthesis are essential for seed development. FEBS Lett 579: 1557-1564

275
Van Der Graaff E, Schwacke R, Schneider A, Desimone M, Flügge UI, Kunze R (2006) Transcription analysis of Arabidopsis membrane transporters and hormone pathways during developmental and induced leaf senescence. Plant Physiol 141: 776- 792
Vera-Sirera F, Minguet EG, Singh SK, Ljung K, Tuominen H, Blázquez MA, Carbonell J (2010) Role of polyamines in plant vascular development. Plant Physiol Biochem 48: 534-539
Vida TA, Emr SD (1995) A new vital stain for visualizing vacuolar membrane dynamics and endocytosis in yeast. J Cell Biol 128: 779 - 792
Wabnik K, Govaerts W, Friml J, Kleine-Vehn J (2011) Feedback models for polarized auxin transport: an emerging trend. Mol.BioSyst. 7: 2352-2359
Wang T.-W., Lu L., Zhang C.G., Taylor C. & Thompson J.E. (2003) Pleiotropic effects of suppressing deoxyhypusine synthase expression in Arabidopsis thaliana. Plant Mol Biol 52 1223–1235
Wang T.-W., Zhang C.G., Wu W., Nowack L.M., Madey E. & Thompson J.E. (2005) Antisense suppression of deoxyhypusine synthase in tomato delays fruit softening and alters growth anddevelopment. Plant Physiol 138 1372–1382
Wang YH (2008) How effective is T-DNA insertional mutagenesis in Arabidopsis? Journal of Biochem Tech 1: 11-20
Wimalasekera R, Villar C, Begum T, Scherer GFE (2011) COPPER AMINE OXIDASE1 (CuAO1) of Arabidopsis thaliana Contributes to Abscisic Acid-and Polyamine-Induced Nitric Oxide Biosynthesis and Abscisic Acid Signal Transduction. Molecular Plant 4: 663 - 678
Wortman JR, Haas BJ, Hannick LI, Smith RK, Maiti R, Ronning CM, Chan AP, Yu C, Ayele M, Whitelaw CA (2003) Annotation of the Arabidopsis genome. Plant Physiol 132: 461 -470
Wu H, Min J, Zeng H, McCloskey DE, Ikeguchi Y, Loppnau P, Michael AJ, Pegg AE, Plotnikov AN (2008) Crystal Structure of Human Spermine Synthase. J Biol Chem 283: 16135-16146
Wu J, Shang Z, Wu J, Jiang X, Moschou PN, Sun W, Roubelakis‐Angelakis KA, Zhang S (2010) Spermidine oxidase‐derived H2O2 regulates pollen plasma membrane hyperpolarization‐activated Ca2
‐permeable channels and pollen tube growth. Plant J 63: 1042-1053
Yamagami T, Tsuchisaka A, Yamada K, Haddon WF, Harden LA, Theologis A (2003) Biochemical diversity among the 1-amino-cyclopropane-1-carboxylate synthase isozymes encoded by the Arabidopsis gene family. J Biol Chem 278: 49102 - 49112

276
Yamakawa H, Kamada H, Satoh M, Ohashi Y (1998) Spermine is a salicylate-independent endogenous inducer for both tobacco acidic pathogenesis-related proteins and resistance against tobacco mosaic virus infection. Plant Physiol 118: 1213 - 1222
Yamamoto R, Demura T, Fukuda H (1997) Brassinosteroids induce entry into the final stage of tracheary element differentiation in cultured Zinnia cells. Plant and cell physiol38: 980 - 983
Yamamoto R, Fujioka S, Iwamoto K, Demura T, Takatsuto S, Yoshida S, Fukuda H (2007) Co-regulation of brassinosteroid biosynthesis-related genes during xylem cell differentiation. Plant and cell physiol 48: 74 - 83
Yang SF, Hoffman NE (1984) Ethylene biosynthesis and its regulation in higher plants. Annual Review of Plant Physiol 35: 155-189
Zheng Q, Song J, Doncaster K, Rowland E, Byers DM (2007) Qualitative and quantitative evaluation of protein extraction protocols for apple and strawberry fruit suitable for two-dimensional electrophoresis and mass spectrometry analysis. J Agric Food Chem 55: 1663-1673
Zhou J, Sebastian J, Lee JY (2011) Signaling and gene regulatory programs in plant vascular stem cells. Genesis doi10.1002/dvg.20795
Zimmermann P, Hirsch-Hoffmann M, Hennig L, Gruissem W (2004) GENEVESTIGATOR. Arabidopsis microarray database and analysis toolbox. Plant Physiol 136: 2621- 2632