Significance of HOMO and LUMO Studies on dye doped Glycene Lithium Sulphate (GLS) Crystals for...
13
International Journal of Mathematics and Physical Sciences Research ISSN 2348-5736 (Online) Vol. 5, Issue 1, pp: (55-67), Month: April - September 2017, Available at: www.researchpublish.com Page | 55 Research Publish Journals Significance of HOMO and LUMO Studies on dye doped Glycene Lithium Sulphate (GLS) Crystals for Non-linear Optical Applications G. Suresh 1 , K. Sambathkumar 2 , P. Kumaresan 3 1, 3 PG & Research Department of Physics, Thiru.A. Govindasamy Government Arts College, Tindivanam - 604 002, Tamil Nadu, India 2 PG & Research Department of Physics, Arignar Anna Government Arts College, Villupuram-605 602, Tamil Nadu, India Abstract: The ideal material that could have potential applications in non-linear optical (NLO) devices should possess the combination of large non-linear figure of merit for frequency conversion, high laser damage threshold, fast optical response time, wide phase matchable angle, architectural flexibility for molecular design and morphology, optical transparency and high mechanical strength. The stability of Glycene lithium sulphate (GLS) single crystal was improved by doping organic dyes. The structural, chemical, optical, mechanical and non-linear optical properties of the dye doped crystals were analyzed with the characterization studies such as powder XRD, FT-IR, UV-Visible and SHG measurements, respectively. NMR, HOMO and LUMO energies, were performed by time dependent density functional theory (TD-DFT) approach. The Mulliken charge analysis indicates that the nitrogen atoms of the triazole ring and the amino group attached to the ring are the main reactive centers of 3,5-diamino-1,2,4-triazole. And the temperature dependence of the thermodynamic properties of constant pressure (Cp), entropy (S) and enthalpy change (ΔH0→T) for DAT were also determined. Keywords: GLS crystals, XRD studies, FT-IR studies, SGH measurements and HOMO –LUMO studies. 1. INTRODUCTION A nonlinear optical material has many applications like image application using photorefractive crystals, frequency multipliers and mixers, fiber optics, parameter oscillators, optical switches, etc., laser in a modern wonder, whether it is in the field of information transformation or in the field of medicine[1-5]. The interaction of laser with matter has advanced capabilities in optical spectroscopy. The discovery of laser itself is a result of crystal growth [6-8]. In recent years more emphasis is given to semiorganic materials due to their much matured NLO applications than organic materials and owing to their good transparency, chemical stability, and mechanical properties. The large nonlinearity arises from the strong charge transfer and high polarisibility [9-11]. To enable a material to be potentially useful for NLO applications the material should be available in bulk single crystal form. Also research into the growth of large single crystals from aqueous solution is currently serving as the important avenue to general progress in understanding many fundamental concepts of crystallization. To understand the kinetics and mechanisms involved in the process of crystal growth, many theories such as surface energy theory, diffusion theory, surface adsorption theory, etc. have been proposed. The first theory of crystal growth was proposed as early as the late 19 th century. The development of the theories of crystal growth has thrown more light on the understanding of crystal growth phenomena.
Transcript of Significance of HOMO and LUMO Studies on dye doped Glycene Lithium Sulphate (GLS) Crystals for...

International Journal of Mathematics and Physical Sciences Research ISSN 2348-5736 (Online) Vol. 5, Issue 1, pp: (55-67), Month: April - September 2017, Available at: www.researchpublish.com
Page | 55 Research Publish Journals
Significance of HOMO and LUMO Studies on
dye doped Glycene Lithium Sulphate (GLS)
Crystals for Non-linear Optical Applications
G. Suresh1, K. Sambathkumar
2, P. Kumaresan
3
1, 3 PG & Research Department of Physics, Thiru.A. Govindasamy Government Arts College, Tindivanam - 604 002,
Tamil Nadu, India 2 PG & Research Department of Physics, Arignar Anna Government Arts College, Villupuram-605 602, Tamil Nadu,
India
Abstract: The ideal material that could have potential applications in non-linear optical (NLO) devices should
possess the combination of large non-linear figure of merit for frequency conversion, high laser damage threshold,
fast optical response time, wide phase matchable angle, architectural flexibility for molecular design and
morphology, optical transparency and high mechanical strength. The stability of Glycene lithium sulphate (GLS)
single crystal was improved by doping organic dyes. The structural, chemical, optical, mechanical and non-linear
optical properties of the dye doped crystals were analyzed with the characterization studies such as powder XRD,
FT-IR, UV-Visible and SHG measurements, respectively.
NMR, HOMO and LUMO energies, were performed by time dependent density functional theory (TD-DFT)
approach. The Mulliken charge analysis indicates that the nitrogen atoms of the triazole ring and the amino group
attached to the ring are the main reactive centers of 3,5-diamino-1,2,4-triazole. And the temperature dependence
of the thermodynamic properties of constant pressure (Cp), entropy (S) and enthalpy change (ΔH0→T) for DAT
were also determined.
Keywords: GLS crystals, XRD studies, FT-IR studies, SGH measurements and HOMO –LUMO studies.
1. INTRODUCTION
A nonlinear optical material has many applications like image application using photorefractive crystals, frequency
multipliers and mixers, fiber optics, parameter oscillators, optical switches, etc., laser in a modern wonder, whether it is in
the field of information transformation or in the field of medicine[1-5]. The interaction of laser with matter has advanced
capabilities in optical spectroscopy. The discovery of laser itself is a result of crystal growth [6-8].
In recent years more emphasis is given to semiorganic materials due to their much matured NLO applications than
organic materials and owing to their good transparency, chemical stability, and mechanical properties. The large
nonlinearity arises from the strong charge transfer and high polarisibility [9-11]. To enable a material to be potentially
useful for NLO applications the material should be available in bulk single crystal form. Also research into the growth of
large single crystals from aqueous solution is currently serving as the important avenue to general progress in
understanding many fundamental concepts of crystallization.
To understand the kinetics and mechanisms involved in the process of crystal growth, many theories such as surface
energy theory, diffusion theory, surface adsorption theory, etc. have been proposed. The first theory of crystal growth was
proposed as early as the late 19th
century. The development of the theories of crystal growth has thrown more light on the
understanding of crystal growth phenomena.

International Journal of Mathematics and Physical Sciences Research ISSN 2348-5736 (Online) Vol. 5, Issue 1, pp: (55-67), Month: April - September 2017, Available at: www.researchpublish.com
Page | 56 Research Publish Journals
Compared with inorganic NLO materials, organic materials may fulfill many of these requirements, but there are also
some drawbacks with organic NLO materials such as environmental stability, poor chemical and mechanical stability,
red-shift of the cut-off wavelength, low laser damage thresholds and poor phase matching properties [12-14]. In order to
overcome these drawbacks and improve the properties, the growth of semi-organic crystals has nowadays come into
prominence.
The semi organic crystals have some advantages such as higher second order optical non-linearities, short transparency
cut-off wavelength and stable physio-chemical performance over the traditional inorganic and organic crystals [15]. For
greater Second Harmonic Generation (SHG) efficiency, one requires highly polarizable molecular system having
asymmetric charge distribution in the molecule [16]. Since there is a large demand for crystals because of the revolution
in electronic industries, it is required to synthesize new NLO materials and improve the properties of the existing
materials. Considering all the above mentioned facts, Glycene lithium sulphate Crystals have been synthesized and grown
moderately at low cost.
2. EXPERIMENTAL PROCEDURE
2.1 CRYSTAL GROWTH:
A solution of glycine lithium sulphate was prepared by dissolving equimolar amount of glycine and lithium sulphate. The
solution was continuously stirrer using a magnetic stirrer of room temperature. The chemical reaction may be represented
as,
C2H5NO2 + Li2SO4 → [Li2( SO4 )(C2H5NO2)]
The prepared solution was filtered and kept undisturbed in a constant temperature bath maintained at a temperature of 40
°C. When evaporation taken place slowly, super saturation is activated. As a result, crystals with dimensions 7.5 × 5 ×
2.75 mm3 were harvested in a period of 40 days. GLS crystals were grown from aqueous solution by slow evaporation
method. The solubility of dyes doped GLS water was measured. It was found to be 16.5 g/100 ml at 40oC for Coumarine
doped GLS. The amount of GLS salt to be dissolved was determined from its solubility curve at an average temperature
of 38oC. The solution was stirred long enough to ensure complete dissolution of the solute, and filtered. Subsequently the
solution was cooled at a rate of 0.1oC/day. The seed crystals were prepared at low temperature by spontaneous nucleation
(Figure.1 (a)).
The seed crystals with perfect shape and free from macro defects were used for growth experiments. Seed crystals of pure
GLS and doped GLS were grown using constant temperature bath controlled with an accuracy of ± 0.01oC. A
supersaturated solution of Coumarine doped GLS was prepared in distilled, deionized water. Seed crystals were
introduced into the solution using thin nylon thread at the appropriate super saturation condition. Experiments were
allowed to run for considerably longer duration of the time (20 days) would grow large crystals.
Figure 1: Photograph of Coumarine doped GLS Crystal

International Journal of Mathematics and Physical Sciences Research ISSN 2348-5736 (Online) Vol. 5, Issue 1, pp: (55-67), Month: April - September 2017, Available at: www.researchpublish.com
Page | 57 Research Publish Journals
3. CHARACTERIZATION STUDIES
3.1 Powder X-Ray Diffraction Analysis:
Powder X-ray diffraction studies were carried out for the as grown crystals using a Rich Seifert X-ray diffract meter with
CuKα (λ = 1.5405 Å) radiation (Kurtz 1968). Powder X-ray diffraction spectra of the grown crystals from pure and doped
GLS are shown in Figure 2. Powder XRD spectra for the pure and doped GLS revealed that the structures of the doped
crystals were slightly distorted compared to the pure GLS crystal. The (h; k; l) planes satisfy the general reflection
conditions of space group observed from the structure determination of the crystal. This may be attributed to strain on the
lattice by the absorption or substitution of dye. It is observed that the reflection lines of the doped dye crystal correlate
well with those observed in the individual parent compound with a slight shift in the Bragg angle.
Figure 2: XRD Spectra of (a) pure and (b) Coumarine doped GLS crystal
3.2 FT-IR Studies:
The FT-IR spectra of pure and dye doped GLS crystals on a Bruker IFS 66V model spectrophotometer using 1064 nm
output of a cw diode pumped Nd: YAG laser as a source of excitation in the region 500 – 4000 cm–1
operating at 200 mW
power at the samples with a spectral resolution of 2 cm–1
. The observed FT-IR spectra of pure and doped GLS are shown
in Figure 3. In doped GLS spectra, broad peak around 3650 cm-1
was due to free –OH stretching vibration [17]. It reveals
that at least one of the –OH group of GLS was remain unaltered after that doped with GLS. Due to the greater mass of
sulphur in GLS the C=S stretching vibration was expected to occur at 625 cm-1
, it was considerably lower frequency than
the usual C=O stretching vibration at 1710 cm-1
because of the C=S group is less polar than the C=O group and has a
considerably weaker band.

International Journal of Mathematics and Physical Sciences Research ISSN 2348-5736 (Online) Vol. 5, Issue 1, pp: (55-67), Month: April - September 2017, Available at: www.researchpublish.com
Page | 58 Research Publish Journals
Figure 3. FT-IR spectrum of Coumarine doped GLS crystal
The strong vibrational coupling was operative in the case of nitrogen containing thiocarbonyl group of glycene and that
the C=S vibration was not located in the spectra [18]. The comparison of FT-IR studies on pure and Coumarine doped
GLS crystals were tabulated in table.1.
Table 1: FT-IR Assignments of pure and Coumarine doped GLS crystals
Calculated frequency
(cm-1
)
Pure
GLS Coumarine doped GLS Assignments
3615 3600(w) 3650(w) Free O-H stretching
3200 - 3250(vw) N-H asymmetric stretching
3100 3100(br) - Intramolecular H-bonded O-H stretching
2900 - 2900(br) N-H symmetric stretching in NH2 group
2650 2650(br) - O = P – OH asymmetric stretching of
KDP
2250 2250(w) 2250(br) P-O-H asymmetric stretching
1600 1650(br) 1650(vs) O = P – OH symmetric stretching of KDP
1350 1300(sh) 1350(vs) P=O symmetric stretching (aliphatic)
1150 1100(sh) 1150(vs) P-O-H symmetric stretching
975 950(s) - O = P – OH bending
625 600(sh) 600(sh) HO – P – OH bending
3.3 UV-Visible studies:
The transmission spectra were taken at room temperature using Varian Cary 2300 Spectrometer (UV-VIS-NIR). The
transmission spectra were recorded in the range 200-1200 nm for 1 mm thick c-cut plates of pure and Coumarine doped
GLS was shown in Figure 4.
International Journal of Mathematics and Physical Sciences Research ISSN 2348-5736 (Online) Vol. 5, Issue 1, pp: (55-67), Month: April - September 2017, Available at: www.researchpublish.com
Page | 59 Research Publish Journals
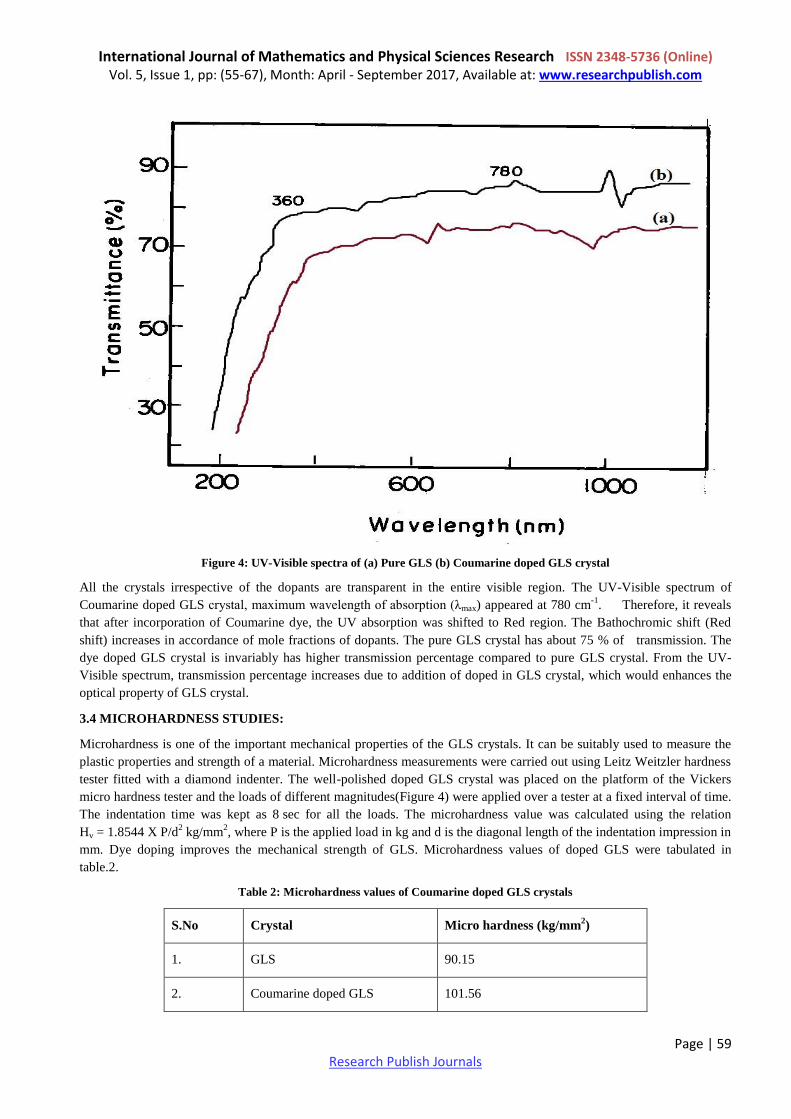
Figure 4: UV-Visible spectra of (a) Pure GLS (b) Coumarine doped GLS crystal
All the crystals irrespective of the dopants are transparent in the entire visible region. The UV-Visible spectrum of
Coumarine doped GLS crystal, maximum wavelength of absorption (λmax) appeared at 780 cm-1
. Therefore, it reveals
that after incorporation of Coumarine dye, the UV absorption was shifted to Red region. The Bathochromic shift (Red
shift) increases in accordance of mole fractions of dopants. The pure GLS crystal has about 75 % of transmission. The
dye doped GLS crystal is invariably has higher transmission percentage compared to pure GLS crystal. From the UV-
Visible spectrum, transmission percentage increases due to addition of doped in GLS crystal, which would enhances the
optical property of GLS crystal.
3.4 MICROHARDNESS STUDIES:
Microhardness is one of the important mechanical properties of the GLS crystals. It can be suitably used to measure the
plastic properties and strength of a material. Microhardness measurements were carried out using Leitz Weitzler hardness
tester fitted with a diamond indenter. The well-polished doped GLS crystal was placed on the platform of the Vickers
micro hardness tester and the loads of different magnitudes(Figure 4) were applied over a tester at a fixed interval of time.
The indentation time was kept as 8 sec for all the loads. The microhardness value was calculated using the relation
Hv = 1.8544 X P/d2 kg/mm
2, where P is the applied load in kg and d is the diagonal length of the indentation impression in
mm. Dye doping improves the mechanical strength of GLS. Microhardness values of doped GLS were tabulated in
table.2.
Table 2: Microhardness values of Coumarine doped GLS crystals
S.No Crystal Micro hardness (kg/mm2)
1. GLS 90.15
2. Coumarine doped GLS 101.56
International Journal of Mathematics and Physical Sciences Research ISSN 2348-5736 (Online) Vol. 5, Issue 1, pp: (55-67), Month: April - September 2017, Available at: www.researchpublish.com
Page | 60 Research Publish Journals
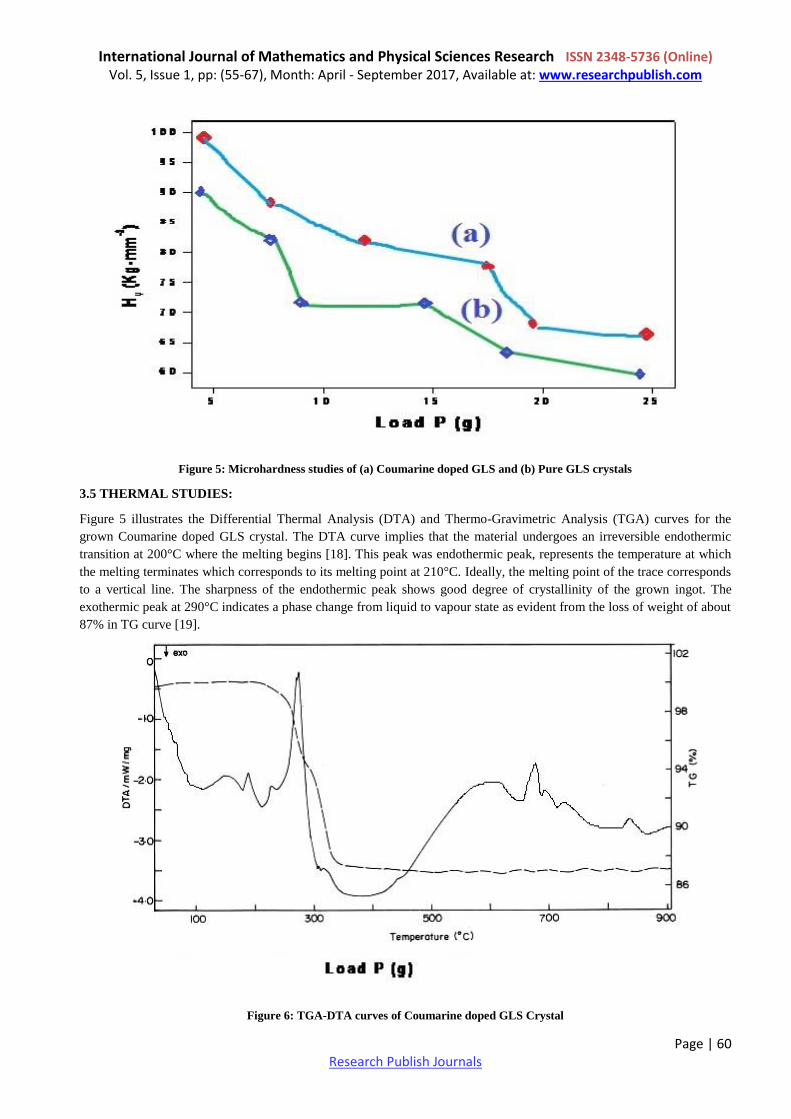
Figure 5: Microhardness studies of (a) Coumarine doped GLS and (b) Pure GLS crystals
3.5 THERMAL STUDIES:
Figure 5 illustrates the Differential Thermal Analysis (DTA) and Thermo-Gravimetric Analysis (TGA) curves for the
grown Coumarine doped GLS crystal. The DTA curve implies that the material undergoes an irreversible endothermic
transition at 200°C where the melting begins [18]. This peak was endothermic peak, represents the temperature at which
the melting terminates which corresponds to its melting point at 210°C. Ideally, the melting point of the trace corresponds
to a vertical line. The sharpness of the endothermic peak shows good degree of crystallinity of the grown ingot. The
exothermic peak at 290°C indicates a phase change from liquid to vapour state as evident from the loss of weight of about
87% in TG curve [19].
Figure 6: TGA-DTA curves of Coumarine doped GLS Crystal

International Journal of Mathematics and Physical Sciences Research ISSN 2348-5736 (Online) Vol. 5, Issue 1, pp: (55-67), Month: April - September 2017, Available at: www.researchpublish.com
Page | 61 Research Publish Journals
3.6 NLO STUDIES:
The dye doped GLS crystals are used for the generation of second harmonics of Nd-based near-infrared solid-state lasers.
The fundamental of an Nd:YAG laser (1064 nm) can be converted to 532 nm of second harmonic or its 355 nm of third
harmonic or its 266 nm of fourth harmonic by using GLS crystals[20]. The performance of these frequency conversion
devices can be seriously degraded if there are defect-associated absorption bands in the crystal which overlap the
fundamental pump wavelength or one of the output wave lengths. Thus, it is important to identify and characterize all
potentially harmful absorption bands in non-linear optical crystals. In order to confirm the suitability of the doped GLS
crystal, the non-linear application, harmonic generation was tested using the Nd-YAG laser [21]. A small crystal was
placed on the sample holder and the YAG laser beam was made to pass through the crystal and the output conversion of
input as green light SHG was analyzed.
The efficiency of doped GLS crystals were compared with pure GLS and also show that dye doped GLS crystal has
higher efficiency. A sample of GLS, also powdered was used for the same experiment as a reference material in the SHG
measurement. It was found that the frequency doubling efficiency of the doped GLS is better than KDP [22]. A
comparison of SHG property of GLS crystal with dye doped GLS crystal is presented in Table 3.
Table 3. Comparison of SHG of pure and Coumarine doped GLS Crystals
S.No. Compound SHG efficiency
1. KDP 1.00
2. Coumarine doped GLS crystals 1.65
3.7 RESULTS AND DISCUSSION
X-ray diffraction studies have been carried out to confirm the crystallinity and to calculate the lattice parameters of the
grown samples. Using the monoclinic crystallographic equation, the lattice parameter values of doped GLS crystals were
calculated and compared with the literature values. This confirms that the doped GLS single crystal retain its own crystal
system [23]. The TG curve of this sample indicates that the sample is stable up to 210°C and above this temperature the
weight loss occurred due to self-degradation of doped GLS but merely to its evaporation after its melting.
Three prominent and interesting features of ferroelectrics of doped GLS crystals are their reversible polarization,
anomalous behavior (optical, thermal, elastic etc.,) and their non-linearities [24]. The ferroelectric materials cease to be
ferroelectric above a certain temperature, known as transition temperature and show normal dielectric behavior. At the
transition temperature the dye doped GLS crystal undergoes a transition from ferroelectric phase to a high symmetry
phase and permittivity increases sharply to a very high value which was referred to be anomalous in the neighborhood.
The highest symmetry phase compatible with the ferroelectric structure is termed as the prototype phase also called
paraelectric phase Although it is not necessary of non-polar character, it was proves to be the greatest majority of known
ferroelectrics so far. Most of the phases actually exist as the highest temperature phase of the crystal, although in some
instances the structure may melt before the prototype phase would otherwise become stable [25]. As a result of its small
structural displacement from the prototype, a typical ferroelectric material possesses a spontaneous polarization Ps which
decreases with the increase of temperature Tc.
3.8. Frontier Orbital Energy:
Many organic molecules that contain conjugated π electrons are characterized hyperpolarizabilities and are analyzed by
means of vibrational spectroscopy. In most cases, even in the absence of inversion symmetry, the weakest bands in the
Raman spectrum are strongest in the IR spectrum and vice versa. But the intra molecular charge transfer from the donor to
accepter group through a single–double bond conjugated path can induce large variations of both the molecular dipole
moment and the molecular polarizability, making IR and Raman activity strong at the same time. It is also observed in the
title compound the bands in FTIR spectrum have their counterparts in Raman shows that the relative intensities in IR and
Raman spectra are comparable resulting from the electron cloud movement through π conjugated frame work from
electron donor to electron acceptor groups. Highest occupied molecular orbital (HOMO) and lowest unoccupied
molecular orbital (LUMO) are very important parameters for quantum chemistry. Can determine the way the molecule
interacts with other species; hence, they are called the frontier orbitals. HOMO, which can be thought the outermost
orbital containing electrons, tends to give these electrons such as an electron donor. On the other hand; LUMO can be
thought the innermost orbital containing free places to accept electrons [26].
International Journal of Mathematics and Physical Sciences Research ISSN 2348-5736 (Online) Vol. 5, Issue 1, pp: (55-67), Month: April - September 2017, Available at: www.researchpublish.com
Page | 62 Research Publish Journals
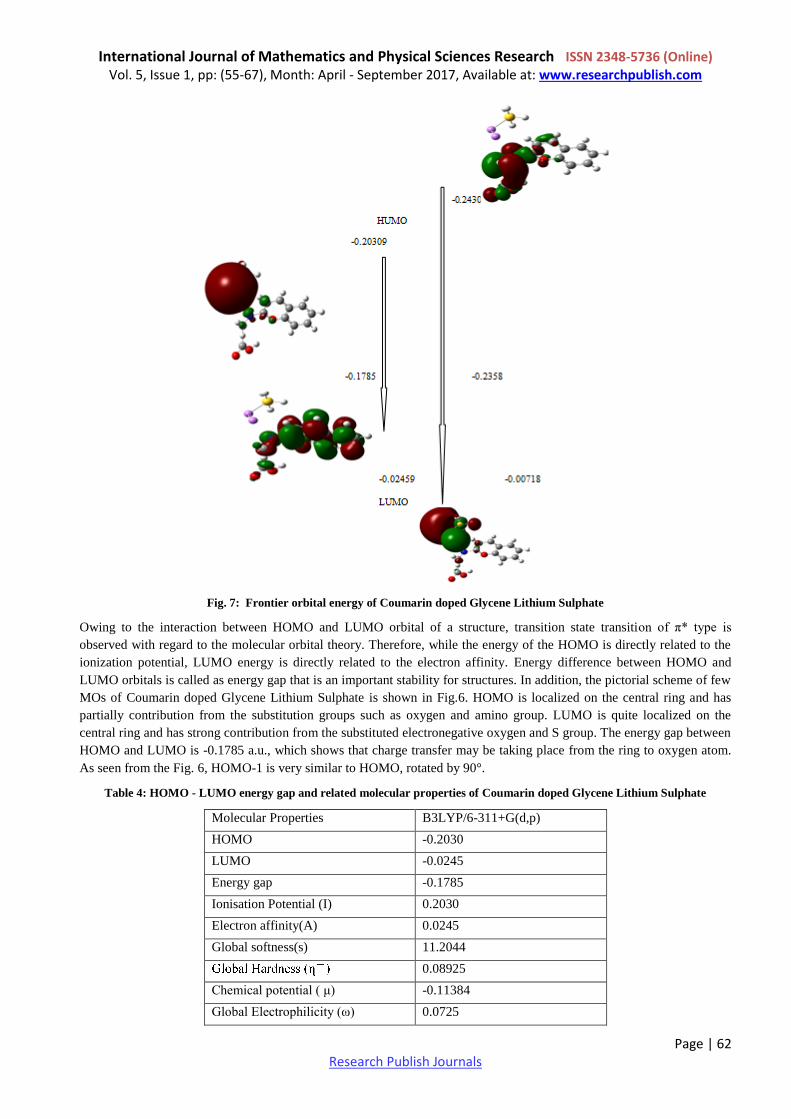
Fig. 7: Frontier orbital energy of Coumarin doped Glycene Lithium Sulphate
Owing to the interaction between HOMO and LUMO orbital of a structure, transition state transition of π* type is
observed with regard to the molecular orbital theory. Therefore, while the energy of the HOMO is directly related to the
ionization potential, LUMO energy is directly related to the electron affinity. Energy difference between HOMO and
LUMO orbitals is called as energy gap that is an important stability for structures. In addition, the pictorial scheme of few
MOs of Coumarin doped Glycene Lithium Sulphate is shown in Fig.6. HOMO is localized on the central ring and has
partially contribution from the substitution groups such as oxygen and amino group. LUMO is quite localized on the
central ring and has strong contribution from the substituted electronegative oxygen and S group. The energy gap between
HOMO and LUMO is -0.1785 a.u., which shows that charge transfer may be taking place from the ring to oxygen atom.
As seen from the Fig. 6, HOMO-1 is very similar to HOMO, rotated by 90°.
Table 4: HOMO - LUMO energy gap and related molecular properties of Coumarin doped Glycene Lithium Sulphate
Molecular Properties B3LYP/6-311+G(d,p)
HOMO -0.2030
LUMO -0.0245
Energy gap -0.1785
Ionisation Potential (I) 0.2030
Electron affinity(A) 0.0245
Global softness(s) 11.2044
0.08925
Chemical potential ( μ) -0.11384
Global Electrophilicity (ω) 0.0725
International Journal of Mathematics and Physical Sciences Research ISSN 2348-5736 (Online) Vol. 5, Issue 1, pp: (55-67), Month: April - September 2017, Available at: www.researchpublish.com
Page | 63 Research Publish Journals
3.8.1 Global and local reactivity descriptors:
Based on density functional descriptors global chemical reactivity descriptors of molecules such as hardness, chemical
potential, softness, electronegativity and electrophilicity index as well as local reactivity have been defined [30-33].
Pauling introduced the concept of electronegativity as the power of an atom in a molecule to attract electrons to it.
Hardness (η), chemical potential (μ) and electronegativity (χ) and softness are defined as
η = ½(∂2E/∂N2)V(r) = ½(∂μ/∂N)V(r)
μ = (∂E/∂N)V(r)
-μ = -(∂E/∂N)V(r)
Where E and V(r) are electronic energy and external potential of an N-electron system respectively. Softness is a property
of molecule that measures the extent of chemical reactivity. It is the reciprocal of hardness.
S = 1/ η
Using Koopman’s theorem for closed-shell molecules, η, μ and χ can be defined as
η = (I – A)/2
μ = - (I + A)/2
χ = (I + A)/2
where A and I are the ionization potential and electron affinity of the molecules respectively. The ionization energy and
electron affinity can be expressed through HOMO and LUMO orbital energies as I = -EHOMO and A = -ELUMO. Electron
affinity refers to the capability of a ligand to accept precisely one electron from a donor. However in many kinds of
bonding viz. covalent hydrogen bonding, partial charge transfer takes places. Recently Parr et al. [27] have defined a new
descriptor to quantify the global electr
measure of energy lowering due to maximal electron flow between donor and acceptor.
They defined electrophilicity index (ω) as follows
ω = μ2/2 η
The usefulness of this new reactivity quantity has been recently demonstrated in understanding the toxicity of various
pollutants in terms of their reactivity and site selectivity . The calculated value of electrophilicity index describes the
biological activity of Coumarin doped Glycene Lithium Sulphate. All the calculated values of hardness, potential,
softness and electrophilicity index are shown in Table 4.
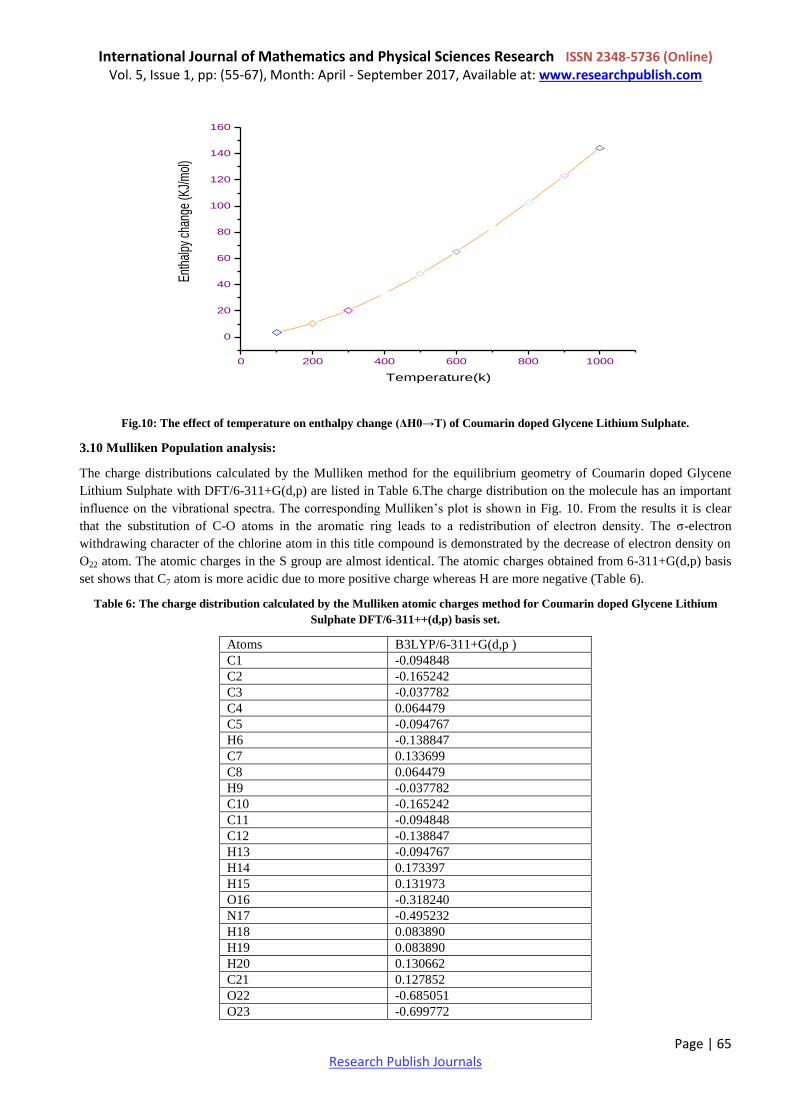
3.9. Temperature dependence of Thermodynamic properties:
The temperature dependence of the thermodynamic properties heat capacity at constant pressure (Cp), entropy (S) and
enthalpy change (ΔH0→T) for Coumarin doped Glycene Lithium Sulphate were also determined by B3LYP/6–
311+G(d,p) method and listed in Table 5. The Figs 7- 9 depicts the correlation of entropy (S), heat capacity at constant
pressure (Cp) and enthalpy change (ΔH0→T) with temperature along with the correlation equations. From Table 9, one
can find that the entropies, heat capacities, and enthalpy changes are increasing with temperature ranging from 100 to
1000 K due to the fact that the molecular vibrational intensities increase with temperature [28]. These observed relations
of the thermodynamic functions vs. temperatures were fitted by quadratic formulas, and the corresponding fitting
regression factors (R2) are all not less than 0.9995. The corresponding fitting equations for Coumarin doped Glycene
Lithium Sulphate are
S = 230.41 + 0.5 T – 11.608 x 10⁻⁴
T2
Cp = 52.242 + 0.179 T –11.715 x 10⁻⁴
T2
ΔH = – 22.982 + 0.160 T + 6.934 x 10⁻⁴
T2

International Journal of Mathematics and Physical Sciences Research ISSN 2348-5736 (Online) Vol. 5, Issue 1, pp: (55-67), Month: April - September 2017, Available at: www.researchpublish.com
Page | 64 Research Publish Journals
Table 5: Thermodynamic properties of Coumarin doped Glycene Lithium Sulphate determined at different temperatures with
B3LYP/6-311+G(d,p) level.
T (K) S (J/mol.K) Cp (J/mol.K) ΔH0→T (kJ/mol)
100 247.69 49.09 3.74
200.00 292.91 84.75 10.47
298.15 332.38 114.01 20.26
300.00 333.08 114.51 20.47
400.00 369.54 139.38 33.21
500.00 402.91 159.68 48.20
600.00 433.51 175.92 65.01
700.00 461.64 188.95 83.27
800.00 487.59 199.60 102.72
900.00 511.63 208.52 123.14
1000.00 534.01 216.13 144.38
0 200 400 600 800 1000
200
250
300
350
400
450
500
550
S(J
/mol
.k)
Temperature(K)
Fig. 8: The effect of temperature on entropy (S) of Coumarin doped Glycene Lithium Sulphate.
0 200 400 600 800 1000
40
60
80
100
120
140
160
180
200
220
Cp(
J/m
ol.k
)
Temperature(k)
Fig. 9: The effect of temperature on heat capacity (Cp) of Coumarin doped Glycene Lithium Sulphate.
International Journal of Mathematics and Physical Sciences Research ISSN 2348-5736 (Online) Vol. 5, Issue 1, pp: (55-67), Month: April - September 2017, Available at: www.researchpublish.com
Page | 65 Research Publish Journals
0 200 400 600 800 1000
0
20
40
60
80
100
120
140
160
Enth
alpy
cha
nge
(KJ/
mol
)
Temperature(k)
Fig.10: The effect of temperature on enthalpy change (ΔH0→T) of Coumarin doped Glycene Lithium Sulphate.
3.10 Mulliken Population analysis:
The charge distributions calculated by the Mulliken method for the equilibrium geometry of Coumarin doped Glycene
Lithium Sulphate with DFT/6-311+G(d,p) are listed in Table 6.The charge distribution on the molecule has an important
influence on the vibrational spectra. The corresponding Mulliken’s plot is shown in Fig. 10. From the results it is clear
that the substitution of C-O atoms in the aromatic ring leads to a redistribution of electron density. The σ-electron
withdrawing character of the chlorine atom in this title compound is demonstrated by the decrease of electron density on
O22 atom. The atomic charges in the S group are almost identical. The atomic charges obtained from 6-311+G(d,p) basis
set shows that C7 atom is more acidic due to more positive charge whereas H are more negative (Table 6).
Table 6: The charge distribution calculated by the Mulliken atomic charges method for Coumarin doped Glycene Lithium
Sulphate DFT/6-311++(d,p) basis set.
Atoms B3LYP/6-311+G(d,p )
C1 -0.094848
C2 -0.165242
C3 -0.037782
C4 0.064479
C5 -0.094767
H6 -0.138847
C7 0.133699
C8 0.064479
H9 -0.037782
C10 -0.165242
C11 -0.094848
C12 -0.138847
H13 -0.094767
H14 0.173397
H15 0.131973
O16 -0.318240
N17 -0.495232
H18 0.083890
H19 0.083890
H20 0.130662
C21 0.127852
O22 -0.685051
O23 -0.699772

International Journal of Mathematics and Physical Sciences Research ISSN 2348-5736 (Online) Vol. 5, Issue 1, pp: (55-67), Month: April - September 2017, Available at: www.researchpublish.com
Page | 66 Research Publish Journals
O24 0.130662
Li25 0.127852
Li26 0.222823
S27 0.485407
H28 0.131973
H29 0.585277
H30 0.173397
H31 0.287984
C1C2C3C4C5H6C7C8H9C10C11C12H13H14H15O16N17H18H19H20C21O22O23O24Li25Li26S27H28H29H30H31
-0.8
-0.6
-0.4
-0.2
0.0
0.2
0.4
0.6
Y A
xis
Titl
e
X Axis Title
B3LYP 6-311+(d,p)
Fig. 11: Mulliken plot of Coumarin doped Glycene Lithium Sulphate
4. CONCLUSION
Good optical quality single crystals of Coumarine dye doped GLS have been grown from solution by slow solvent
evaporation technique for the first time. Experiments were allowed to run for considerably larger duration of the time (20
days) can grow large crystals. The functional groups present in the grown crystals have been confirmed by FT-IR spectral
analysis. The observed frequencies were assigned on the basis of symmetry operation on the molecule and normal
coordinate analysis. The crystallinity of the grown sample was confirmed by single crystal X-ray diffraction analysis.
Thermal stability of the grown sample was studied by TG and DTA analysis. The results from TG and DTA studies dye
doped GLS crystals were stable upto 210°C. The exothermic peak at 290°C indicates a phase change from liquid to
vapour state as evident from the loss of weight of about 87% in TG curve. Optical transmission UV-Visible spectral)
range of dye doped GLS was measured and the doped GLS crystal has a good optical transmission in the entire visible
region.
The powder SHG measurement shows that the grown doped GLS crystal has 1.65 times higher SHG efficiency than KDP.
Vickers micro hardness was calculated in order to understand the mechanical stability of the grown crystals. Each type of
constituent chemical bond is regarded as one part of the whole crystal that has contributions to the total nonlinearity. The
distribution of valence electrons of the metallic elements is an important factor that strongly affects the linear and
nonlinear properties of each type of constituent chemical bond. The fundamental beam of 1064 nm from Q-switched Nd:
YAG laser was used to test the SHG property of the grown crystal.
The non-linear response of the physical properties with respect to the electric field and temperature is a unique
characteristic of ferroelectric materials. This makes them extremely attractive materials for a variety of applications,
particularly based on their anomalous electrical and optical properties. These sites give information about the region from
where the compound can undergo non-covalent interaction. HOMO, LUMO, and Mulliken was calculated and compared
International Journal of Mathematics and Physical Sciences Research ISSN 2348-5736 (Online) Vol. 5, Issue 1, pp: (55-67), Month: April - September 2017, Available at: www.researchpublish.com
Page | 67 Research Publish Journals
with the experimental data. Finally, the thermodynamic properties to the title compound have been calculated for different
temperatures, revealing the correlations among ((Cp), (S) and (ΔH0→T)) and temperatures are obtained.
ACKNOWLEDGEMENTS
We gratefully acknowledge financial supports from the Department of Science & Technology-Science and Engineering
Research Board [DST-SERB-FAST TRACK, PS-20/2009(SR)], New Delhi, India.
REFERENCES
[1] S. Hoshino, Y. Okaya, and R. Pepinsky, Phys. Rev. 115 (1959) 1955.
[2] S. Natarajan, K. Ravikumar, and S. S. Rajan, Z. Kristallogr. 168 (1984) 75.
[3] R. Pepinsky, Y. Okaya, D. P. Eastman, and T. Mitsui, Phys. Rev. 107 (1957) 1538.
[4] R. Pepinsky, K. Vedam, and Y. Okaya, Phys. Rev. 110 (1958) 1309.
[5] S. Hoshino, T. Mitsui, F. Jona, and R. Pepinsky Phys. Rev. 107 (1957) 125.
[6] K. Ravikumar and S. S. Rajan, Z.Kristallogr. 171 (1985) 201.
[7] S. Natarajan and J. K. Mohan Rao, Z. Kristallogr. 152 (1984) 179.
[8] J. Baran, M. Drozd, A. Pietraszko, M. Trzebiatowska, and H. Ratajczak J. Polish.Chem. 77 (2003) 1561.
[9] A. Deepthy and H. L. Bhat, J. Cryst. Growth 226 (2001) 287.
[10] M. Narayan Bhat and S. M. Dharmaprakash, J. Cryst. Growth 235(2002) 511.
[11] P. Narayanan and S. Venkataraman, Z. Kristallogr. 142 (1975) 52.
[12] H. S. Nagaraja, V. Upadhyaya, P. Mohan Rao, S. Aithal, and A. P. Bhat, J. Cryst.Growth 193 (1998) 674.
[13] D. Chakraborty, S. Manogaram, Chem. Phys. Lett. 294 (1998) 56.
[14] R.V. Krishnakumar, M. Subha Nadhimi, S. Natarajan, K. Sivakumar, B. Vaghese, Acta Crystallogr. C 57 (2001)
1149.
[15] Michel Fleck and Ladislav Bohaty, Acta Crystallogr.C 60, (2004) 291.
[16] T. Balakrishnan and K. Ramamurthi Cryst. Res. Technol. 41, No. 12, (2006) 1184 – 1188 .
[17] B. Narayana Moolya, A. Jayarama, M.R. Sureshkumar, M.S. Dharmaprakash, J. Cryst. Growth 280 (2005) 581–586.
[18] Krishnakumar.V and Nagalakshmi .R, Spectrochim. Acta A, 61 (2005) 499-507.
[19] Wenwei Ge, Huaijin Zhang, Jiyang Wang , Donggang Ran, Shangquian Sun, Hairui Xia,Junhai Liu, Xiangang Xu,
Xiaobo Hu, and Minhua Jiyang, J.Cryst. Growth., 282 (2005 )320-329.
[20] N. Vijayan, S. Rajasekaran, G. Bhagavannarayana, R. Rameshbabu, R. Gopalakrishnan, M.Palanichammy, and
P.Ramasamy, Cryst. Growth Des. 6, (2006) 2441.
[21] R.M.R. Wellen, M.S. Rabello, J. Mater. Sci. 40 (2005) 6099.
[22] K. Selvaraju, K. Kirubavathi, N. Vijayan, S. Kumararaman, J. Cryst. Growth 310 (2008) 2859–2862.
[23] R. Sankar, C.M. Ragahvan, R. Mohan Kumar, R. Jayavel, J. Cryst. Growth 309 (2007) 3036.
[24] P. Hobza, Z. Havlas, Chem. Rev. 100 (2000) 4253.
[25] K. Jayalashami, M.A. Sridhar, J. Shashidhara Prasad, M. Naraayan Bhat, S.M. Gharamprakash, Mol. Cryst. Liq.
Cryst. 393 (2003) 99.
[26] Kuppusamy Sambathkumar Spectrochim. Acta A 147 (2015) 51-66.
[27] R.G..Parr,L.V.szentpaly,S.J.Liu.Am.Chem.soc.1999,121,1922.
[28] M. Arivazhagan, K. Sambathkumar and S. Jeyavijayan, Indian J. Pure Appl. Phys., 48 (2010) 716-722.