Signal prioritisation and serious medical events
29
Signal prioritisation and serious medical events: reported rate of fatality as a prioritisation variable F. Maignen 15 December 2009
-
Upload
francois-maignen -
Category
Health & Medicine
-
view
168 -
download
4
Transcript of Signal prioritisation and serious medical events

Signal prioritisation and serious medical events: reported rate of fatality as a prioritisation variable
F. Maignen15 December 2009

EV-EWG IME list
• Useful but purpose not always clear (early signal detection? Focus the detection? Signal prioritisation?)
• Based on expert’s judgment• Has not been formally “validated” / tested
(no standards)• Probably situation dependant

Concept of seriousness
• Grading in seriousness: death >> disability (permanent) >>> life-threatening >>> disability (temp.) >> prolongation hosp.
• Variable linked to fatal outcome = reported rate of fatality
• For each drug-event pair = No of reported fatal cases / total number of reported cases
• Computed for the intensively monitored products

Reported rate of fatality
• Some reactions may be consistently linked to a high reported mortality rate
• Some reactions are serious but do not lead to a fatal outcome
• Some reactions are situation dependent (the reported rate of fatality may be highly variable)– Mean, min., max., range: max. – min., SD

Methods
• Data from last year intensively monitored products
• Imported in ACCESS, computation of reported rate for each drug-event
• Computation of average, min, max, SD and range for each MedDRA PT
• Analysis in R using the ODBC connectivity

Reported rate of fatality

How does it relate to IMEs?RHS: IMEsLHS: non-IMEs

How does it relate to IMEs?
• Reported rate of fatality for IMEs > non-IMEs
• Number of events for which the reported rate is high which are non-IMEs
• Very high number of IMEs for which the reported rate of fatality is zero.
• IMEs useful for prioritisation?

How does it relate to SIMEs?
The figure displays the distr. of the average reported rate of fatality for non-IMEs (left)compared to IMEs (right) (red and blue line = mean rate for non-IMEs (red) vs IMEs (blue))

Mean / median
• Difference of the mean rate / median between non-IMEs and IMEs but not very important (approx. 10%)
• Confirmation that some non-IMEs are linked to a high reported rate of fatality
• And that some IMEs are associated to a very low rate

How does it relate to IMEs?
The figure displays the distr. of the minimum reported rate of fatality for non-IMEs (left)compared to IMEs (right)

How does it relate to IMEs?
The figure displays the distr. of the maximum reported rate of fatality for non-IMEs (left)compared to IMEs (right)

Min and max.
• Confirm that some non-IMEs have a high minimum rate
• The median of the max. reported rate of fatality is quite low.
• Can IMEs discriminate between serious / non-serious signals?

Range: Max. – Min.
The figure displays the distr. of the range (max. – min.) reported rate of fatality for non-IMEs (left)compared to IMEs (right)
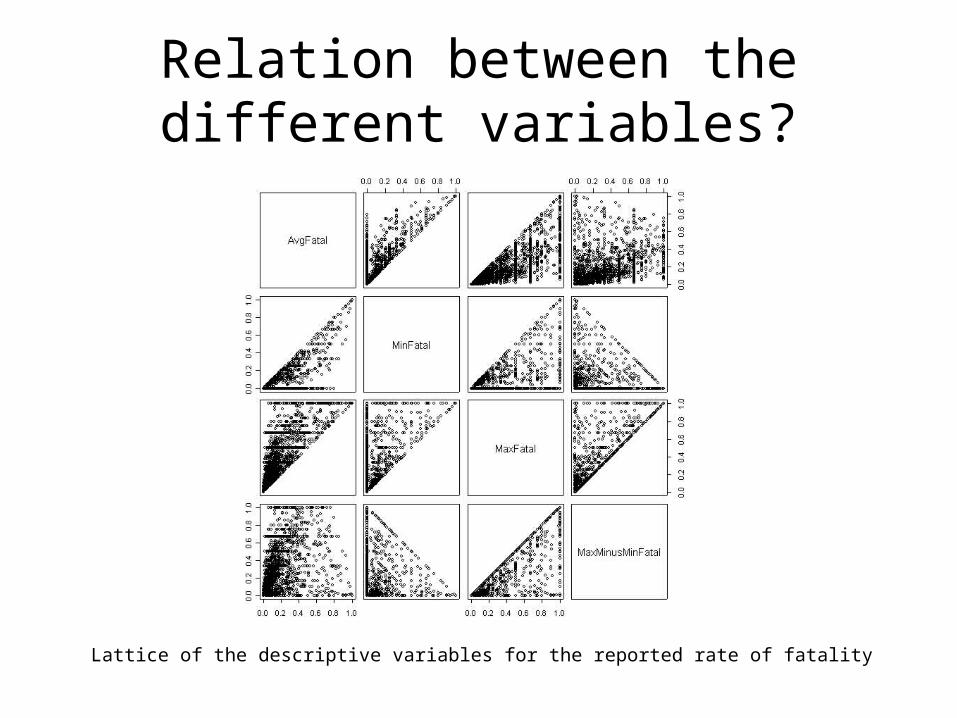
Relation between the different variables?
Lattice of the descriptive variables for the reported rate of fatality

Relations between variables
• No apparent relation• Confirms that a significant number of
events are associated with a very low rate (zero)
• Some events are associated with a very high rate
• No clear relation (from the lattice)

Grading of the severity of reactions? Hepatic reactions ranked by Avg (mild)
PT SME Average Min Max SD Range
Hepatitis toxic -1 0.06 0 0.142857142857143
6.08702806292663E-02
0.142857142857143
Hepatitis -1 0.055 0 0.333333333333333
8.51155316743531E-02
0.333333333333333
Gamma-glutamyltransferase increased
0 0.053 0 0.75 0.1046362136683 0.75
Hepatic enzyme increased -1 0.037 0 0.134831460674157
0.045862805331455
0.134831460674157
Cytolytic hepatitis -1 0.032 0 0.222222222222222
0.051937909442713
0.222222222222222
Hepatitis acute -1 0.017 0 7.69230769230769E-02
3.17977540864653E-02
7.69230769230769E-02
Biopsy liver abnormal 0 0 0 0 0 0
Haemangioma of liver -1 0 0 0 0 0
Hepatic enzyme abnormal 0 0 0 0 0 0
Hepatocellular injury -1 0 0 0 0 0
Hyperbilirubinaemia neonatal -1 0 0 0 0
Hepatic pain 0 0 0 0 0 0
Hepatitis B DNA increased 0 0 0 0 0
Hepatic displacement 0 0 0 0 0

Grading of the severity of reactions? Hepatic reactions (severe)
PT SME Average Mon Max SD Range
Liver transplant 0 0.146 0 0.545454545454545
0.193380460774507 0.545454545454545
Hepatic fibrosis -1 0.13 0 0.25 0.106671401410068 0.25
Liver injury -1 0.125 0 0.5 0.209165006633519 0.5
Hepatic necrosis -1 0.107 0 0.222222222222222
8.04169243768715E-02
0.222222222222222
Hepatic steatosis -1 0.095 0 0.333333333333333
0.102385019533591 0.333333333333333
Liver function test abnormal -1 0.091 0 0.8 0.114251756138268 0.8
Hepatic function abnormal -1 0.085 0 0.258064516129032
6.28347319601348E-02
0.258064516129032
Hepatic cyst -1 0.074 0 0.25 8.43965101118951E-02
0.25
Blood bilirubin unconjugated increased
0 0.067 0 0.2 0.115470053837925 0.2
Hepatotoxicity -1 0.065 0 0.333333333333333
7.56695844471282E-02
0.333333333333333
Alanine aminotransferase increased 0 0.0647 0 0.25 6.21239207887621E-02
0.25
Bilirubin conjugated increased 0 0.0626 0 0.25 8.84174221327833E-02
0.25
Hepatitis viral -1 0.0625 0 0.25 0.125 0.25
Aspartate aminotransferase increased
0 0.062 0 0.375 6.50949239649052E-02
0.375

Grading of the severity of reactions? Hepatic reactions (high reported mortality)
PT SME Average Min Max SD Range
Hepatic haemorrhage -1 0.33 0.333333333333333 0.333333333333333 0
Hepatitis C RNA positive 0 0.33 0.333333333333333 0.333333333333333 0
Cytomegalovirus hepatitis -1 0.328 0.25 0.416666666666667 5.73958290801377E-02 0.166666666666667
Hepatitis C -1 0.301 0.2 0.35 0.046725479075312 0.15
Hepatitis cholestatic -1 0.288 0 0.5 0.196517954829488 0.5
Hepatosplenomegaly -1 0.266 0.2 0.333333333333333 9.42809041582064E-02 0.133333333333333
Liver transplant rejection -1 0.257 0.166666666666667 0.333333333333333 6.22824202822112E-02 0.166666666666667
Autoimmune hepatitis -1 0.254 0 0.6 0.215915745393141 0.6
Ischaemic hepatitis -1 0.25 0.25 0.25 0
Hepatic encephalopathy -1 0.248 0 0.75 0.228080784714652 0.75
Hepatomegaly -1 0.240 0.157894736842105 0.5 0.093057582329235 0.342105263157895
Liver disorder -1 0.189 0 0.62962962962963 0.228267036935107 0.62962962962963
Hyperbilirubinaemia 0 0.187 0 0.75 0.236614554462323 0.75
Blood bilirubin increased 0 0.162 0 1 0.152288707976078 1

Cancers (low rate)PT_new SME AvgFatal MinFatal MaxFatal StDevFatal MaxMinusMinFatal
Thyroid cancer 1 0 0 0 0 0
Adenosquamous carcinoma of the cervix 1 0 0 0 0 0
Testis cancer 1 0 0 0 0 0
Breast cancer in situ 1 0 0 0 0
Breast cancer stage I 1 0 0 0 0 0
Breast cancer stage II 1 0 0 0 0 0
Salivary gland cancer 1 0 0 0 0
Cervix carcinoma stage 0 1 0 0 0 0 0
Metastases to peritoneum 1 0 0 0 0
Mucoepidermoid carcinoma 1 0 0 0 0 0
Lip and/or oral cavity cancer 1 0 0 0 0 0
Recurrent cancer 1 0 0 0 0 0
Lung squamous cell carcinoma stage unspecified 1 0 0 0 0 0
Rectal cancer 1 0 0 0 0
Carcinoma in situ 1 0 0 0 0 0

Cancer (highest rates)PT SME Average Min Max SD Range
Rectal cancer recurrent 1 1 1 1 0
Oesophageal carcinoma 1 1 1 1 0 0
Lymphangiosis carcinomatosa 1 1 1 1 0 0
Gastric cancer 1 1 1 1 0 0
Colorectal cancer 1 1 1 1 0
Lung cancer metastatic 1 0.990610328638498
0.985915492957747
1 8.13169393224786E-03
1.40845070422535E-02
Prostate cancer metastatic 1 0.874369636211742
0.833333333333333
1 6.24720744883884E-02
0.166666666666667
Metastases to bone marrow 1 0.8 0.8 0.8 1.53898531047798E-08
0
Leiomyosarcoma 1 0.733333333333333
0.666666666666667
0.8 9.42809041582055E-02
0.133333333333333
Non-small cell lung cancer 1 0.722444800569801
0.461538461538462
1 0.266745732595527 0.538461538461538
Breast cancer metastatic 1 0.679331245932365
0.58 1 0.125781468817772 0.42
Metastases to meninges 1 0.678571428571429
0.428571428571429
0.75 0.133630620956212 0.321428571428571
Metastases to pleura 1 0.666666666666667
0.666666666666667
0.666666666666667
0 0
Small cell lung cancer stage unspecified
1 0.666666666666667
0.666666666666667
0.666666666666667
0
Liver injuries / cancers
• Reported rate # seriousness of injury• Some iconsistencies (bilirubin or skin
cancers)• Unclear concepts (liver disorders) linked to
a fairly high reported rate

Data reduction (PCA)
• Principal components analysis• Performed on Average, Min, Max, Range• 99% of variability explained by first two
PCs +++• First two PC closely associated to Max
and Average

PCA

Biplot

1st Principal component / Max.

Sum 1+2 PC / Avg
Discussion
• Reported rate of fatality can be useful for signal prioritisation
• Needs to be considered with caution (events with rate of zero include e.g. Torsade de pointes, autism, Breast cancer in situ, Breast cancer stage I, Dermatitis exfoliative)
• Death is not the only criterion which could be used
• EudraVigilance = only serious reactions
Conclusion
• Reported rate of fatality could be useful for signal prioritisation but not the only variable
• Some events are consistently associated either with low rate or conversely with very high rate
• Other events = depend on the context