Signal optimization for rochester corridor shun h cheung
23
CE 7670 ADVANCED TRAFFIC SIGNAL SYSTEMS TRAFFIC SIGNAL OPTIMIZATION REPORT Rochester Road Corridor Bachir Hamadeh Shun Cheung Wayne State University December 9, 2013
-
Upload
shun-cheung-eit -
Category
Documents
-
view
217 -
download
1
description
Â
Transcript of Signal optimization for rochester corridor shun h cheung
CE 7670 ADVANCED TRAFFIC SIGNAL SYSTEMS
TRAFFIC SIGNAL OPTIMIZATION REPORT
Rochester Road Corridor
Bachir Hamadeh
Shun Cheung
Wayne State University
December 9, 2013

Page 1 of 22
TABLES OF CONTENTS
Page
1. Introduction ..................................................................................................................................... 4
1.1 Project Description ................................................................................................................... 4
2. Initial Signal Timing design ............................................................................................................. 5
2.1 Design inputs & Assumptions .................................................................................................. 5
2.1.1 Saturation Flow Rates ....................................................................................................... 7
2.1.2 Left Turn Warrants ........................................................................................................... 7
2.1.3 Yellow and All-Red Clearance Intervals ........................................................................... 8
2.1.4 Pedestrian Clearance Intervals .......................................................................................... 8
2.1.5 Other: ............................................................................................................................... 9
2.2 Design Methodology ................................................................................................................ 9
3. Analysis & optimization of Initial Signal Timing plan .................................................................... 11
4. Proposed design: ............................................................................................................................ 16
4.1 Geometric improvements ....................................................................................................... 16
5. Conclusions ................................................................................................................................... 22
Page 2 of 22
LISTS OF FIGURES
FIGURE 1: Map View of Study Area and Pertaining Intersections ........................................................... 4
FIGURE 2: Intersection Spacing, Volumes and Speed Limits .................................................................. 6
FIGURE 3: Initial Signal Timing Design for John R Road & South Blvd. .............................................. 10
FIGURE 4: Initial Signal Timing Design for Rochester Road & South Blvd. ......................................... 10
FIGURE 5: Initial Signal Timing Design for Rochester Road & M-59 EB Ramp ................................... 10
FIGURE 6: Initial Signal Timing Design for Rochester Road & M-59 WB Ramp .................................. 11
FIGURE 7: Initial Signal Timing Design for Rochester Road & Lowe’s Driveway ................................ 11
FIGURE 8: Initial Signal Timing Design for Rochester Road & Auburn Road ....................................... 11
FIGURE 9: Initial Signal Timing Design for Auburn Road & Barclay Cir. ............................................ 11
FIGURE 10: Optimized Signal Timing Plan for John R Road & South Blvd. ......................................... 12
FIGURE 11: Optimized Signal Timing Plan for Rochester Road & South Blvd. .................................... 12
FIGURE 12: Optimized Signal Timing Plan for Rochester Road & M-59 EB Ramp .............................. 13
FIGURE 13: Optimized Signal Timing Plan for Rochester Road & M-59 WB Ramp ............................. 13
FIGURE 14: Optimized Signal Timing Plan for Rochester Road & Lowe's Driveway ............................ 13
FIGURE 15: Optimized Signal Timing Plan for Rochester Road & Auburn Road .................................. 13
FIGURE 16: Optimized Signal Timing Plan for Auburn Road & Barclay Cir......................................... 13
FIGURE 17: Time-Space Diagram (Optimized Signal timing Plan) ...................................................... 14
FIGURE 18: Proposed Signal Timing Plan for John R Road & South Blvd. ........................................... 18
FIGURE 19: Proposed Signal Timing Plan for Rochester Road & South Blvd. ...................................... 18
FIGURE 20: Proposed Signal Timing Plan for Rochester Road & Auburn Road .................................... 18
FIGURE 21: Time-Space Diagram (Proposed Peak hour condition) ...................................................... 20
FIGURE 22: Time-Space Diagram (Proposed Off-Peak hour condition) ............................................... 21
Page 3 of 22
LIST OF TABLES
TABLE 1: ADDITIONAL assumed/posted speed limits ......................................................................... 7
TABLE 2: Product Rule .......................................................................................................................... 7
TABLE 3: SUM RULE .......................................................................................................................... 7
TABLE 4: No. of Phases and Optimal Cycle Lengths for Initial Signal Timing design ........................... 10
TABLE 5: LOS & Delay Summary (optimized Signal Timing Plan) ...................................................... 15
TABLE 6: MOES (Optimized signal plan)............................................................................................. 16
TABLE 7: Geometric Improvements Summary ..................................................................................... 17
TABLE 8: LOS & Delay Summary (Proposed signal timing plan) ......................................................... 19
TABLE 9: Measures of Effectiveness (MOEs) (Proposed vs Optimized signal timing plan) ................... 22
Page 4 of 22
1. INTRODUCTION
1.1 PROJECT DESCRIPTION
This study aims to propose a new signal timing plan and potentially geometric improvements during the
PM peak hours at 7 intersections in Oakland County, Michigan by utilizing Trafficware’s Synchro
software and engineering judgment in hope of reducing excessive delays experienced by road users on the
network. The proposal is made by designing a new coordinated signal system plan providing a better
progression and improving the flow of traffic on Rochester road (Primary corridor) confined by Auburn
road from the North and South Boulevard on the south end as depicted below in Figure 1.
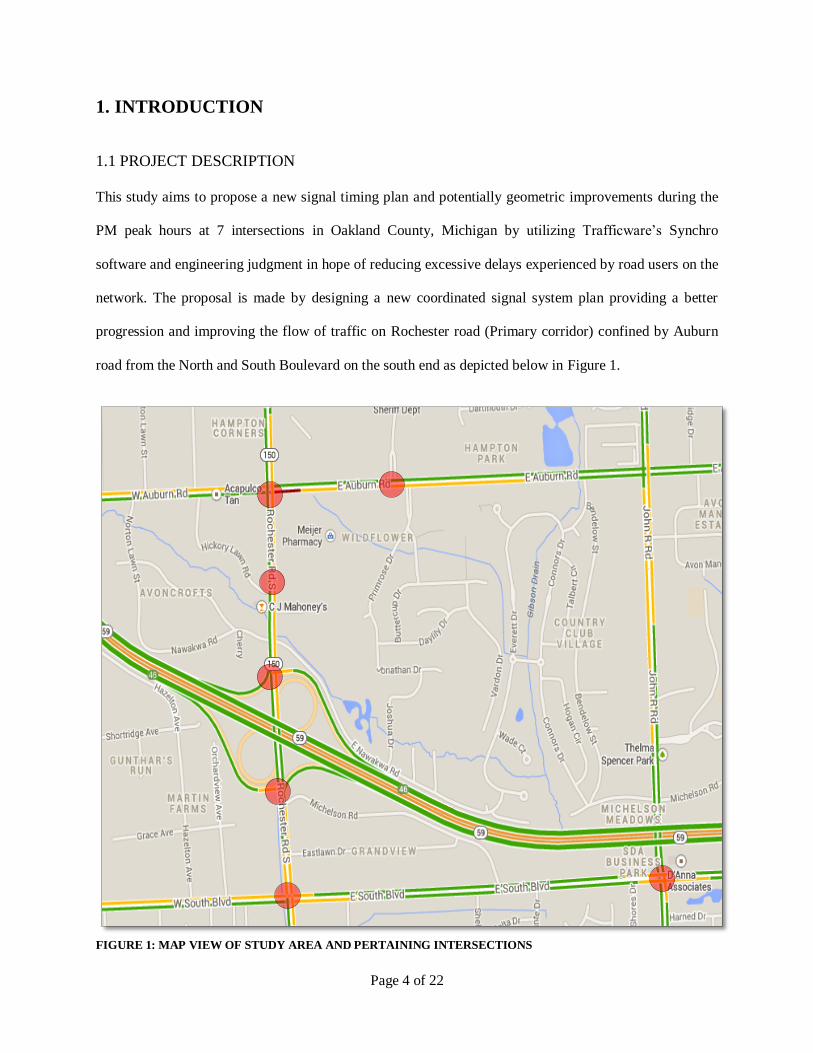
FIGURE 1: MAP VIEW OF STUDY AREA AND PERTAINING INTERSECTIONS
Page 5 of 22
The study area includes five intersections on the primary corridor, and two on secondary corridors. A
residential neighborhood feeds off Rochester road on the South-East end of the corridor, while
commercial strips (i.e. Meijer, C J Mahoney’s, etc.) sandwich the rest of the corridor. Figure 1 also
features color coding outputs depicting traffic conditions for the segments on the main corridor and
adjacent roads at 5:00 p.m. using google maps. It can be seen that most of Rochester roads experiences
below average traffic flow especially traffic going northbound. Exit ramps 46 entering Rochester roads
seem to suffer delay issues as well. Westbound traffic on E Auburn roads also experiences excessive
delays at Rochester, while traffic on South road seems to operate at average or below average speeds.
The process of optimizing the primary corridor starts with designing timing plans during the PM peak
hours. Since the existing timing plans are not provided for the purposes of the study, Webster’s equations
are used to come up with a pre-timed signal timing plan. Next step involves optimizing those timing plans
for the PM peak hour condition and consider those plans to be the available or given existing timing plans
at the time of the study. Finally, a proposed design is made by making geometric improvements at the
intersections of concern. The more specific goals of this study besides reducing overall delay and provide
progression on the primary corridor is to maintain an acceptable level of service (LOS D or better) for
main movements, a LOS of E for all minor movements and provide a better progression on secondary
corridors as well. (South blvd & Auburn road).
2. INITIAL SIGNAL TIMING DESIGN
2.1 DESIGN INPUTS & ASSUMPTIONS
Existing timing plans as mentioned earlier are not provided for the purposes of this study; hence,
Webster’s equations will be used to determine initial cycle lengths and phasing design. There are several
assumptions and components needed for the initial signal timing design such as determining the need for
a separate left turn phase, determining yellow, all-red as well as pedestrian clearance intervals, and
saturation flow rates. More assumptions are needed for the purpose of optimizing those timing plans in
Page 6 of 22
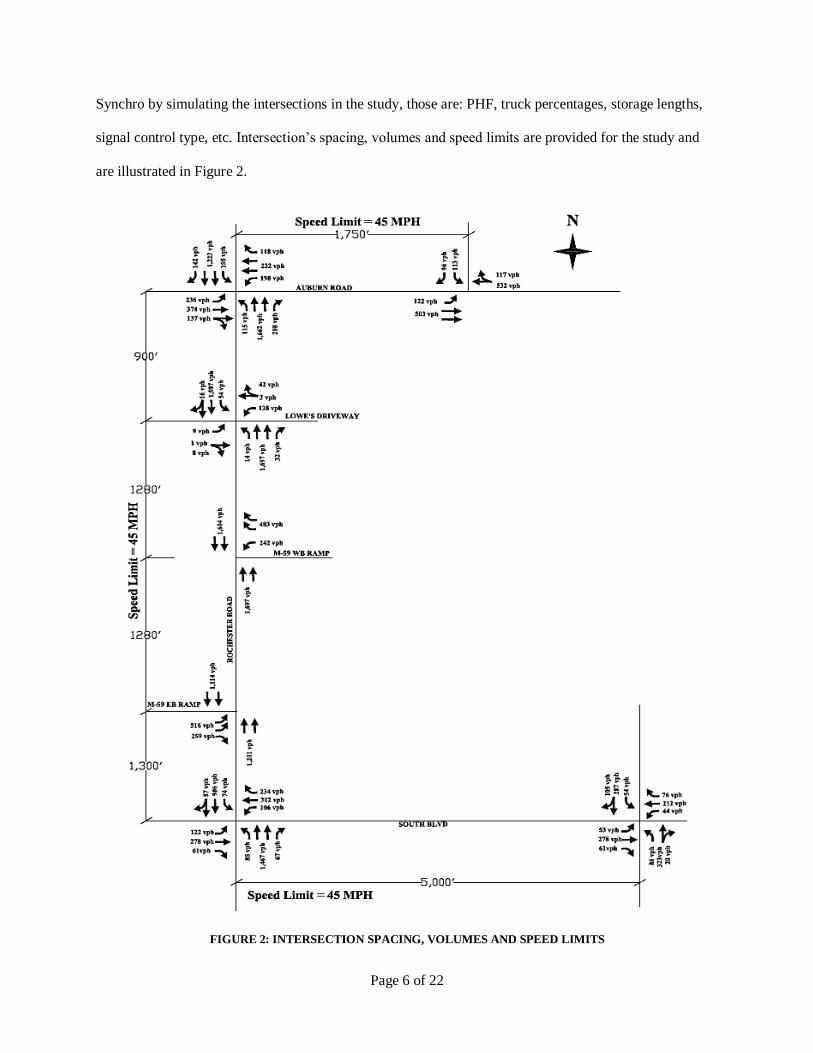
Synchro by simulating the intersections in the study, those are: PHF, truck percentages, storage lengths,
signal control type, etc. Intersection’s spacing, volumes and speed limits are provided for the study and
are illustrated in Figure 2.
FIGURE 2: INTERSECTION SPACING, VOLUMES AND SPEED LIMITS

Page 7 of 22
Speed limits not provided in the figure 2 below are either assumed or are posted on the road, they’re
summarized below in table 1.
TABLE 1: ADDITIONAL ASSUMED/POSTED SPEED LIMITS
Road/ramp Speed limit Assumed/Posted
M-59 EB exit ramp 35 Assumed
M-59 WB exit ramp 35 Assumed
John R road 35 Posted
Barclay cir. 45 Posted
Lowe’s driveway 25 Assumed
2.1.1 Saturation Flow Rates
Saturation flow rates for each lane group are assumed as follows:
Left-turn lane group= 1000 vph
Through lane group = 1900 vph
Right-turn lane group = 1400 vph
2.1.2 Left Turn Warrants
There are three rules to be followed for left-turn warrants in order to grant a protected left-turn phase for
an approach. The first rule is to check if the left-turn volume does not exceed 125 turns per hour. The
second rule is the sum rule, which is the summation of the left-turn volume and the opposing thru volume.
The last rule is the product rule, which is the multiplication of the left-turn volume and the opposing thru
volume. The warrants for the second and third rules depend on the number of opposing lanes as well.
Left-turn warrant analysis results as shown in Table 1 and Table 2. The complete left-turn warrant
analysis table with computations included is available in Appendix A.
TABLE 2: PRODUCT RULE
No. of Opposing Lanes Product (vph2)
1 ≥ 45,000
2 ≥ 90,000
3 ≥ 135,000
TABLE 3: SUM RULE
No. of Opposing Lanes Sum (vph)
1 ≥ 500
2 ≥ 900
3 ≥ 1,000
Page 8 of 22
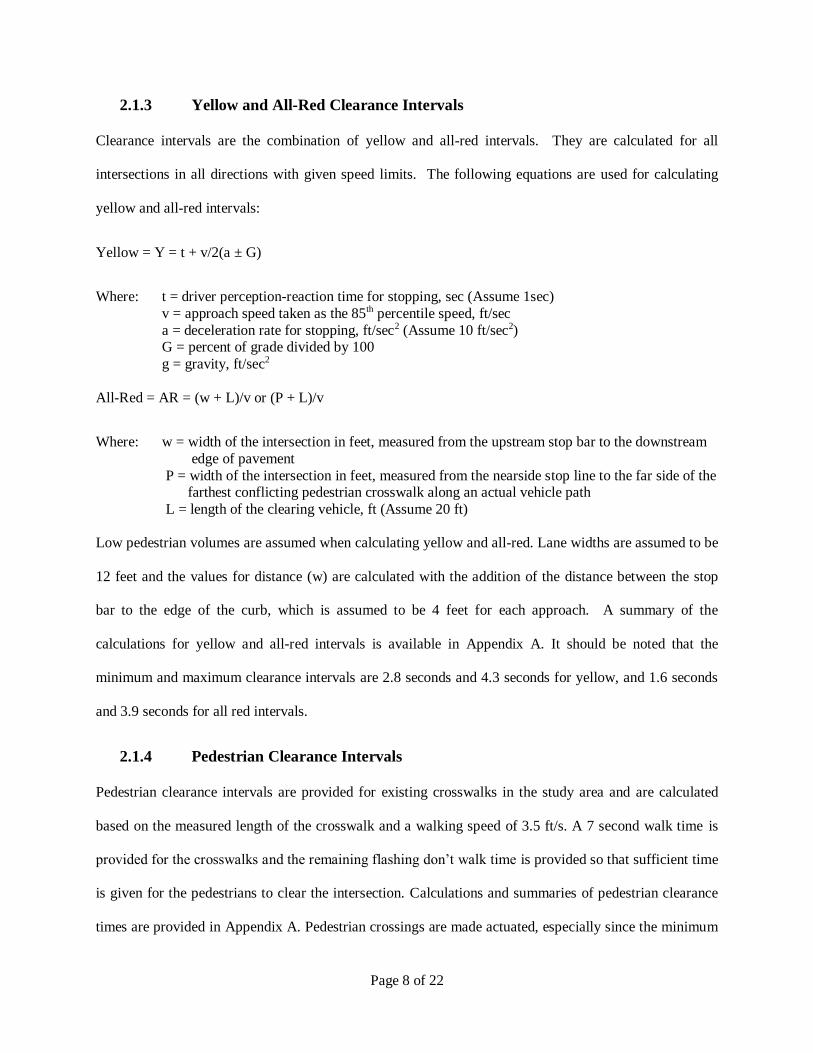
2.1.3 Yellow and All-Red Clearance Intervals
Clearance intervals are the combination of yellow and all-red intervals. They are calculated for all
intersections in all directions with given speed limits. The following equations are used for calculating
yellow and all-red intervals:
Yellow = Y = t + v/2(a ± G)
Where: t = driver perception-reaction time for stopping, sec (Assume 1sec)
v = approach speed taken as the 85th percentile speed, ft/sec
a = deceleration rate for stopping, ft/sec2 (Assume 10 ft/sec2) G = percent of grade divided by 100
g = gravity, ft/sec2
All-Red = AR = (w + L)/v or (P + L)/v
Where: w = width of the intersection in feet, measured from the upstream stop bar to the downstream
edge of pavement
P = width of the intersection in feet, measured from the nearside stop line to the far side of the farthest conflicting pedestrian crosswalk along an actual vehicle path
L = length of the clearing vehicle, ft (Assume 20 ft)
Low pedestrian volumes are assumed when calculating yellow and all-red. Lane widths are assumed to be
12 feet and the values for distance (w) are calculated with the addition of the distance between the stop
bar to the edge of the curb, which is assumed to be 4 feet for each approach. A summary of the
calculations for yellow and all-red intervals is available in Appendix A. It should be noted that the
minimum and maximum clearance intervals are 2.8 seconds and 4.3 seconds for yellow, and 1.6 seconds
and 3.9 seconds for all red intervals.
2.1.4 Pedestrian Clearance Intervals
Pedestrian clearance intervals are provided for existing crosswalks in the study area and are calculated
based on the measured length of the crosswalk and a walking speed of 3.5 ft/s. A 7 second walk time is
provided for the crosswalks and the remaining flashing don’t walk time is provided so that sufficient time
is given for the pedestrians to clear the intersection. Calculations and summaries of pedestrian clearance
times are provided in Appendix A. Pedestrian crossings are made actuated, especially since the minimum
Page 9 of 22
time required for pedestrians sometimes exceeds the minimum vehicular split, in which case, a minimum
pedestrian interval would be given once a call is registered with a push button. Pedestrian phases are also
actuated since pedestrian counts are not available discouraging any accurate evaluation of pedestrian
phasing requirements.
2.1.5 Other:
For the purpose of optimizing the pre-timed initial signal timings, control type of the intersection network
is either kept the same or modified. Since all the intersections in Oakland County are actuated or semi
actuated (SCATS system), therefore, an actuated-coordinated system is assumed for detection of vehicles
and pedestrian push buttons.
In addition, minimum green times are defined; major street = 10 sec and minor street = 7 sec. Minimum
initial time in seconds is defined as the summation of minimum green time and clearance intervals
(Yellow, All-Red & Pedestrian) and are automatically in computed Synchro. Minimum initial times are
not violated unless they needed to be to satisfy LOS criteria set out in the objectives.
Other assumptions are made prior to the initial design, those are:
Right turn on red (RTOR) are allowed at all intersections.
2 % trucks and 0.92 peak hour factor (PHF).
Assumed 12 ft wide lanes while actual storage bay and taper lengths are measured.
TWLT are simulated based on field conditions.
2.2 DESIGN METHODOLOGY
The first step in designing a signal timing plan for an actuated-coordinated system is to determine the
cycle length or a multiple of that. Webster models are employed to calculate the optimal cycle lengths as
well as the number of phases, they are summarized below in table 3.

Page 10 of 22
TABLE 4: NO. OF PHASES AND OPTIMAL CYCLE LENGTHS FOR INITIAL SIGNAL TIMING DESIGN
Intersection
South
Blvd.&
John R.
Rd.
Rochester
Rd &
South
Blvd.
Rochester
Rd & M-
59 EB
Ramp
Rochester
Rd & M-
59 WB
Ramp
Rochester
Rd &
Lowe's
Driveway
Rochester
Rd &
Auburn
Rd.
Auburn
Rd. &
Barclay
Cir.
No. of phases 2 4 2 2 2 4 2
Optimal CL
(seconds) 22 106 34 76 36 22 27
Initial CL
(Seconds) 60 120 60 60 60 120 60
As seen above, a design cycle length of 120 sec is granted for Rochester & South, and Rochester &
Auburn since the signal had four phases. The remaining signals require a minimum cycle length of 60
seconds, a multiple of 120 seconds (allowing for progression). The following figures represent the
product of initial signal system design showing green times, and the phasing design for all 7 intersections.
It should be noted that for four-phased signals, a protected phase is provided for left turn movements
instead of permissive-protected as a starting point.
FIGURE 3: INITIAL SIGNAL TIMING DESIGN FOR JOHN R ROAD & SOUTH BLVD.
FIGURE 4: INITIAL SIGNAL TIMING DESIGN FOR ROCHESTER ROAD & SOUTH BLVD.
FIGURE 5: INITIAL SIGNAL TIMING DESIGN FOR ROCHESTER ROAD & M-59 EB RAMP

Page 11 of 22
FIGURE 6: INITIAL SIGNAL TIMING DESIGN FOR ROCHESTER ROAD & M-59 WB RAMP
FIGURE 7: INITIAL SIGNAL TIMING DESIGN FOR ROCHESTER ROAD & LOWE’S DRIVEWAY
FIGURE 8: INITIAL SIGNAL TIMING DESIGN FOR ROCHESTER ROAD & AUBURN ROAD
FIGURE 9: INITIAL SIGNAL TIMING DESIGN FOR AUBURN ROAD & BARCLAY CIR.
3. ANALYSIS & OPTIMIZATION OF INITIAL SIGNAL TIMING PLAN
Initial timing plans are then modeled into Trafficware’s Synchro software to determine baseline delays
and levels of service.
Having the initial signal timing plans in place, Synchro is used to optimize those timing plans, and modify
lead/lag phases, cycle lengths, phasing, etc. in order to attain a reliable plan to work on for proposing
geometric improvements and a final signal timing plan.
First, Cycle length & offsets (referenced to the beginning of green time of the NB-SB phases, i.e. primary
corridor) with corresponding phasing and time splits that minimize delay, provide maximum progression
speeds and bandwidths on both the primary and secondary corridors are used for optimizing initial signal

Page 12 of 22
timing plan. This time however, half cycle lengths are not allowed since it is found that using half cycle
lengths tend to provide narrower progression bands along the main corridor. Cycle lengths are chosen
based on a performance index calculated by Synchro including variables such as delays & other measures
of effectiveness (MOEs). A a cycle length of 140 seconds is chosen for all intersections in the network
even those off the primary corridor to provide a progression on secondary corridors as as long as that
doesn’t push LOS below acceptable levels.
Next, Synchro is used in revising split times, as well as lead/lag setting of different phases. Delays and
corridor progression are reviewed for those timing plans and are further revised and evaluated in an
iterative matter. Recall mode is set to max for traffic traveling on the primary corridor in an effort to
further reduce delays and provide a relatively good progression on Rochester road. However, in instances
where traffic on cross streets had a dilapidated LOS and excessive delays, recall mode is set to max on
those streets as well, trying to increase the LOS to acceptable levels as much as possible.
The optimized signal timing plans for all 7 intersections are listed below. Permitted-protected left turn
phases are allowed for some intersections, especially when no other measures would have improved
traffic operations at the intersection. It is not ideal allowing for a permissive-protected left turn phasing,
however, it is inevitable since resources are limited on investigating crash history and corresponding
historical timing plans in an attempt to justify such a turn type.
FIGURE 10: OPTIMIZED SIGNAL TIMING PLAN FOR JOHN R ROAD & SOUTH BLVD.
FIGURE 11: OPTIMIZED SIGNAL TIMING PLAN FOR ROCHESTER ROAD & SOUTH BLVD.

Page 13 of 22
FIGURE 12: OPTIMIZED SIGNAL TIMING PLAN FOR ROCHESTER ROAD & M-59 EB RAMP
FIGURE 13: OPTIMIZED SIGNAL TIMING PLAN FOR ROCHESTER ROAD & M-59 WB RAMP
FIGURE 14: OPTIMIZED SIGNAL TIMING PLAN FOR ROCHESTER ROAD & LOWE'S DRIVEWAY
FIGURE 15: OPTIMIZED SIGNAL TIMING PLAN FOR ROCHESTER ROAD & AUBURN ROAD
FIGURE 16: OPTIMIZED SIGNAL TIMING PLAN FOR AUBURN ROAD & BARCLAY CIR.

Page 14 of 22
Time space diagrams for optimized signal timing plan is shown below in figure 17 illustrating progression
speed , offsets, cycle lengths and red/green times. As seen below a progression bandwidth of 40 s is
obtained for the northbound direction on the main corridor vs. 41 seconds in the southbound direction. It
should also be noted that vehicles in the PM peak period are not likely to travel at speed limit, and hence
the time space diagram would be most applicable to off period conditions. However, the given time space
diagram gives a pretty close approximation of progression bands in the peak period.
FIGURE 17: TIME-SPACE DIAGRAM (OPTIMIZED SIGNAL TIMING PLAN)

Page 15 of 22
Optimized delays and levels of service are estimated using HCM 2000 component in Synchro.
Intersection and approach LOS and delays are provided in Table 4.
TABLE 5: LOS & DELAY SUMMARY (OPTIMIZED SIGNAL TIMING PLAN)
Intersection Movement
Name HCM
LOS
Average
Control
Delay
(s)
Approach HCM
LOS
Approach
Delay
(s)
South Blvd.
&
John R. Rd.
C 20.2
NB C 21.1
SB C 22.1
EB A 9.6
WB C 29.3
Rochester Rd
&
South Blvd.
D 39.9
NB D 38.9
SB C 21.9
EB E 63.9
WB E 56.4
Rochester Rd
&
M-59 EB Ramp
B 14.9
NB A 6.4
SB A 5.7
EB D 41.2
Rochester Rd
&
M-59 WB Ramp
C 32.8
NB B 18.5
SB D 39.0
WB D 52.6
Rochester Rd
&
Lowe's Driveway
B 13.3
NB B 14.7
SB A 5.6
EB D 48.9
WB E 63.2
Rochester Rd
&
Auburn Rd.
E 59.4
NB E 65.8
SB D 47.4
EB E 66.9
WB E 59.3
Auburn Rd.
&
Barclay Cir.
B 14.1
SB D 50.8
EB A 5.7
WB B 10.4
In addition to modeling delays in Synchro, SimTraffic, the microsimulation component of Synchro, is
utilized to analyze queuing and to find out whether storage lanes are of sufficient length. One 15 minute
interval is simulated for the peak period, after seeding the network for 15 minutes first, and simulating
two 15 minutes anti peak hour periods before and after the peak simulation period . Different MOEs such
Page 16 of 22
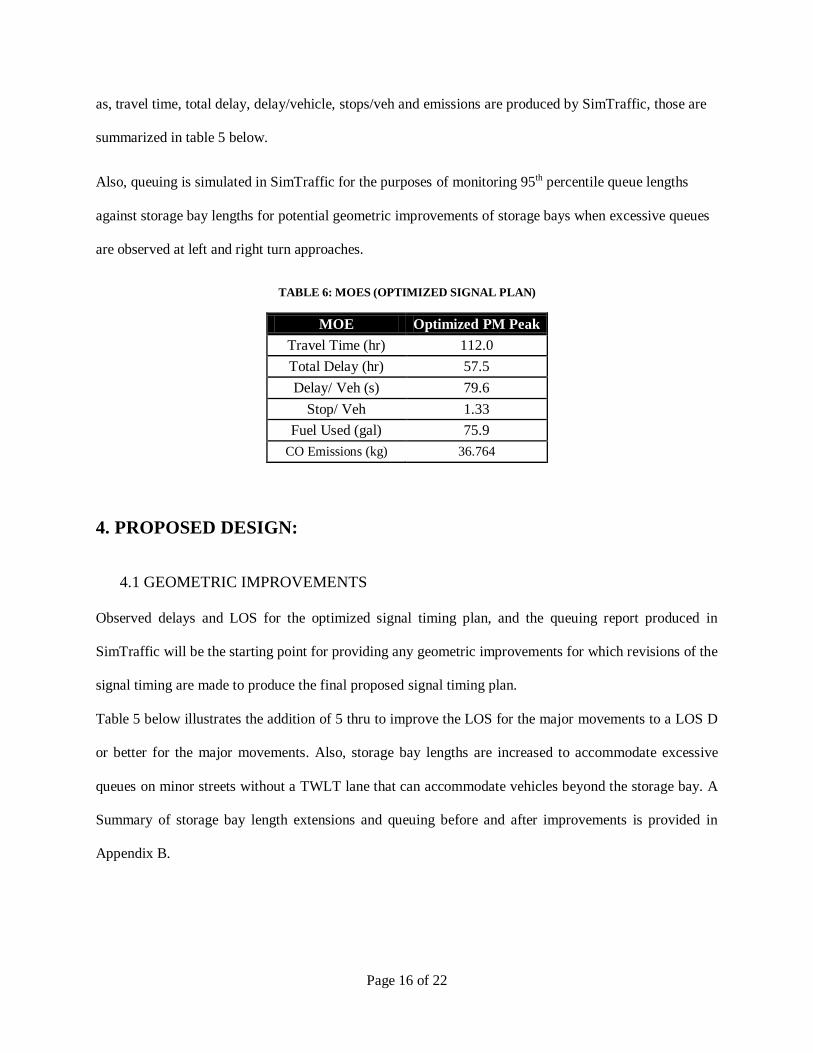
as, travel time, total delay, delay/vehicle, stops/veh and emissions are produced by SimTraffic, those are
summarized in table 5 below.
Also, queuing is simulated in SimTraffic for the purposes of monitoring 95th percentile queue lengths
against storage bay lengths for potential geometric improvements of storage bays when excessive queues
are observed at left and right turn approaches.
TABLE 6: MOES (OPTIMIZED SIGNAL PLAN)
MOE Optimized PM Peak
Travel Time (hr) 112.0
Total Delay (hr) 57.5
Delay/ Veh (s) 79.6
Stop/ Veh 1.33
Fuel Used (gal) 75.9
CO Emissions (kg) 36.764
4. PROPOSED DESIGN:
4.1 GEOMETRIC IMPROVEMENTS
Observed delays and LOS for the optimized signal timing plan, and the queuing report produced in
SimTraffic will be the starting point for providing any geometric improvements for which revisions of the
signal timing are made to produce the final proposed signal timing plan.
Table 5 below illustrates the addition of 5 thru to improve the LOS for the major movements to a LOS D
or better for the major movements. Also, storage bay lengths are increased to accommodate excessive
queues on minor streets without a TWLT lane that can accommodate vehicles beyond the storage bay. A
Summary of storage bay length extensions and queuing before and after improvements is provided in
Appendix B.
Page 17 of 22
TABLE 7: GEOMETRIC IMPROVEMENTS SUMMARY
Name Approach HCM
LOS
Congestion
issues
Geometric
Improvements
South Blvd.
&
John R. Rd.
NB C None None
SB C None None
EB A None None
WB C None None
Rochester Rd
&
South Blvd.
NB D None None
SB C None None
EB E Excessive
Delays
Adding a thru
lane
WB E Excessive
Delays
Adding a thru
lane
Rochester Rd
&
M-59 EB Ramp
NB A None None SB A None None
EB D None
Rochester Rd
&
M-59 WB Ramp
NB B None None
SB D None None
WB D Queuing >
storage
bay length
Increase
Storage Bay
Length
Rochester Rd
&
Lowe's Driveway
NB B None None
SB A None None
EB D None None
WB E
Queuing
>storage
bay length
Increase Storage
Bay Length
Rochester Rd
&
Auburn Rd.
NB E Excessive
Delays
Adding a thru
lane
SB D None None
EB E Excessive
Delays
Adding a thru
lane
WB E Excessive
Delays
Adding a thru
lane
Auburn Rd.
&
Barclay Cir.
SB D None None
EB A None None
WB B None None
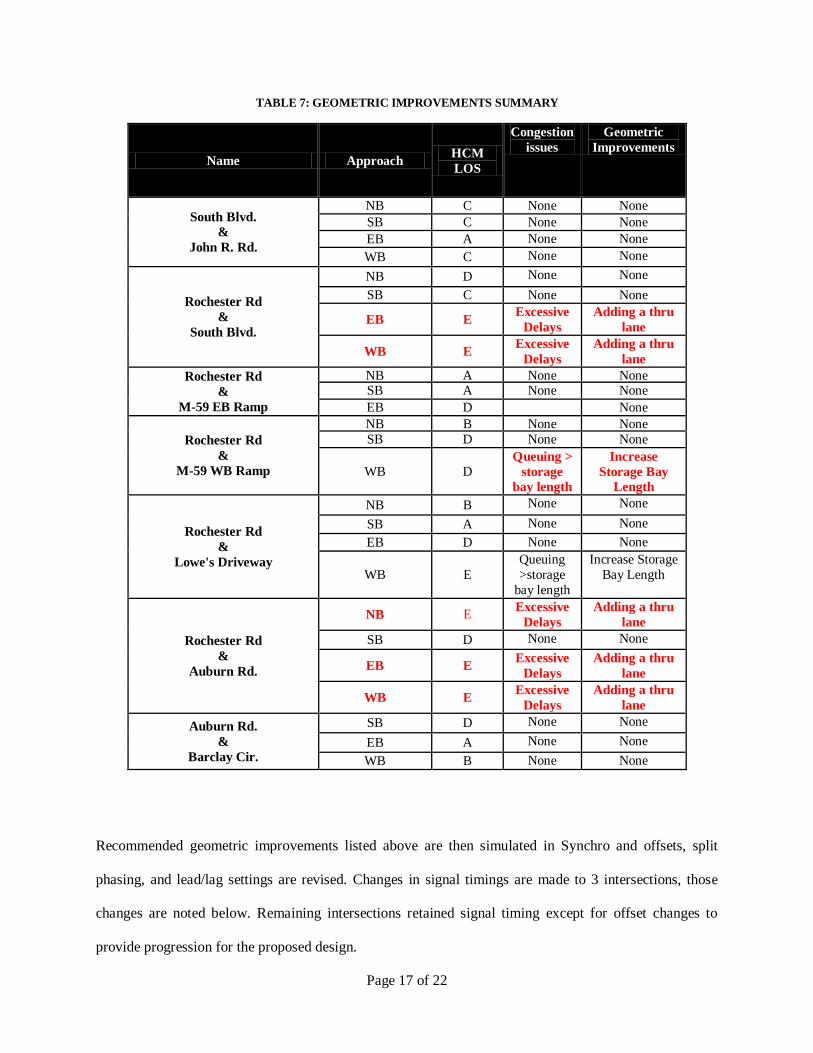
Recommended geometric improvements listed above are then simulated in Synchro and offsets, split
phasing, and lead/lag settings are revised. Changes in signal timings are made to 3 intersections, those
changes are noted below. Remaining intersections retained signal timing except for offset changes to
provide progression for the proposed design.

Page 18 of 22
John R road & South blvd.:
Split time readjusted in favor of North-South approaches since adding a lane on Auburn road in EB-WB
approaches provides an extra capacity on that road.
FIGURE 18: PROPOSED SIGNAL TIMING PLAN FOR JOHN R ROAD & SOUTH BLVD.
Rochester road & South blvd.:
Split time and led/lag changes.
FIGURE 19: PROPOSED SIGNAL TIMING PLAN FOR ROCHESTER ROAD & SOUTH BLVD.
Rochester & Auburn roads:
Split time changes.
FIGURE 20: PROPOSED SIGNAL TIMING PLAN FOR ROCHESTER ROAD & AUBURN ROAD
Page 19 of 22
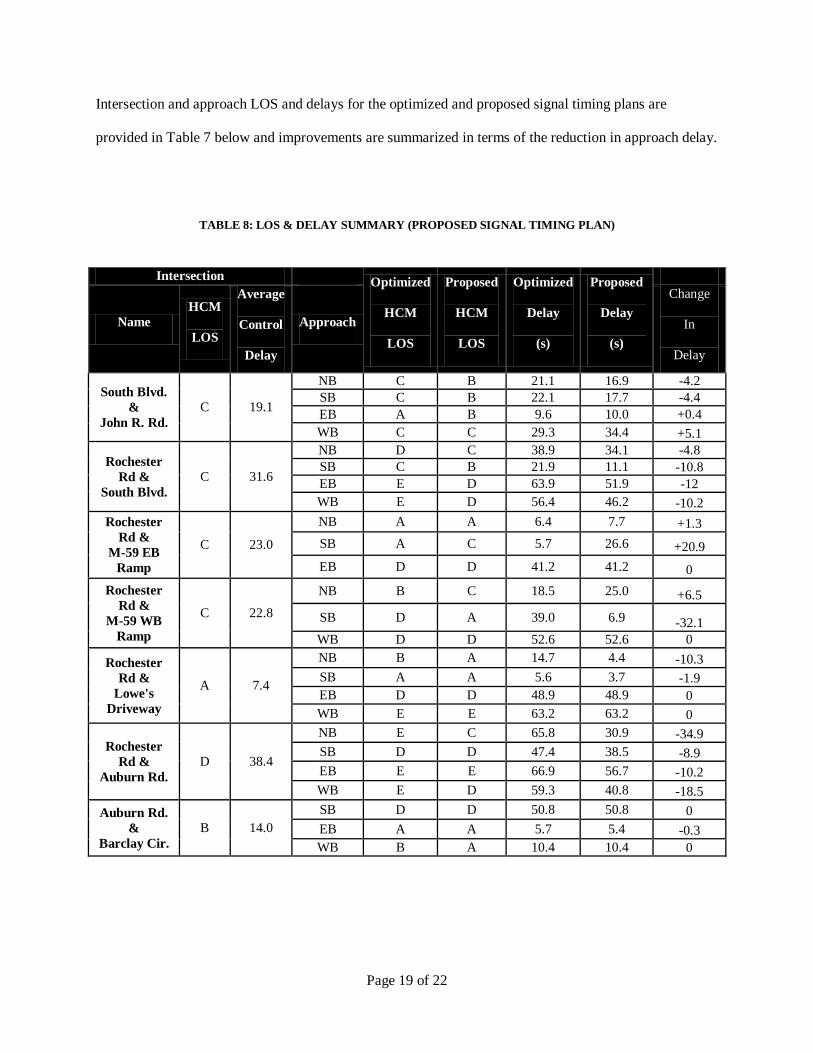
Intersection and approach LOS and delays for the optimized and proposed signal timing plans are
provided in Table 7 below and improvements are summarized in terms of the reduction in approach delay.
TABLE 8: LOS & DELAY SUMMARY (PROPOSED SIGNAL TIMING PLAN)
Intersection Optimized
HCM
LOS
Proposed
HCM
LOS
Optimized
Delay
(s)
Proposed
Delay
(s)
Name
HCM
LOS
Average
Control
Delay
(s)
Approach
Change
In
Delay
(s)
South Blvd.
&
John R. Rd.
C 19.1
NB C B 21.1 16.9 -4.2
SB C B 22.1 17.7 -4.4
EB A B 9.6 10.0 +0.4
WB C C 29.3 34.4 +5.1
Rochester
Rd &
South Blvd.
C 31.6
NB D C 38.9 34.1 -4.8
SB C B 21.9 11.1 -10.8
EB E D 63.9 51.9 -12
WB E D 56.4 46.2 -10.2
Rochester
Rd &
M-59 EB
Ramp
C 23.0
NB A A 6.4 7.7 +1.3
SB A C 5.7 26.6 +20.9
EB D D 41.2 41.2 0
Rochester
Rd &
M-59 WB
Ramp
C 22.8
NB B C 18.5 25.0 +6.5
SB D A 39.0 6.9 -32.1
WB D D 52.6 52.6 0
Rochester
Rd &
Lowe's
Driveway
A 7.4
NB B A 14.7 4.4 -10.3
SB A A 5.6 3.7 -1.9
EB D D 48.9 48.9 0
WB E E 63.2 63.2 0
Rochester
Rd &
Auburn Rd.
D 38.4
NB E C 65.8 30.9 -34.9
SB D D 47.4 38.5 -8.9
EB E E 66.9 56.7 -10.2
WB E D 59.3 40.8 -18.5
Auburn Rd.
&
Barclay Cir.
B 14.0
SB D D 50.8 50.8 0
EB A A 5.7 5.4 -0.3
WB B A 10.4 10.4 0
Page 20 of 22
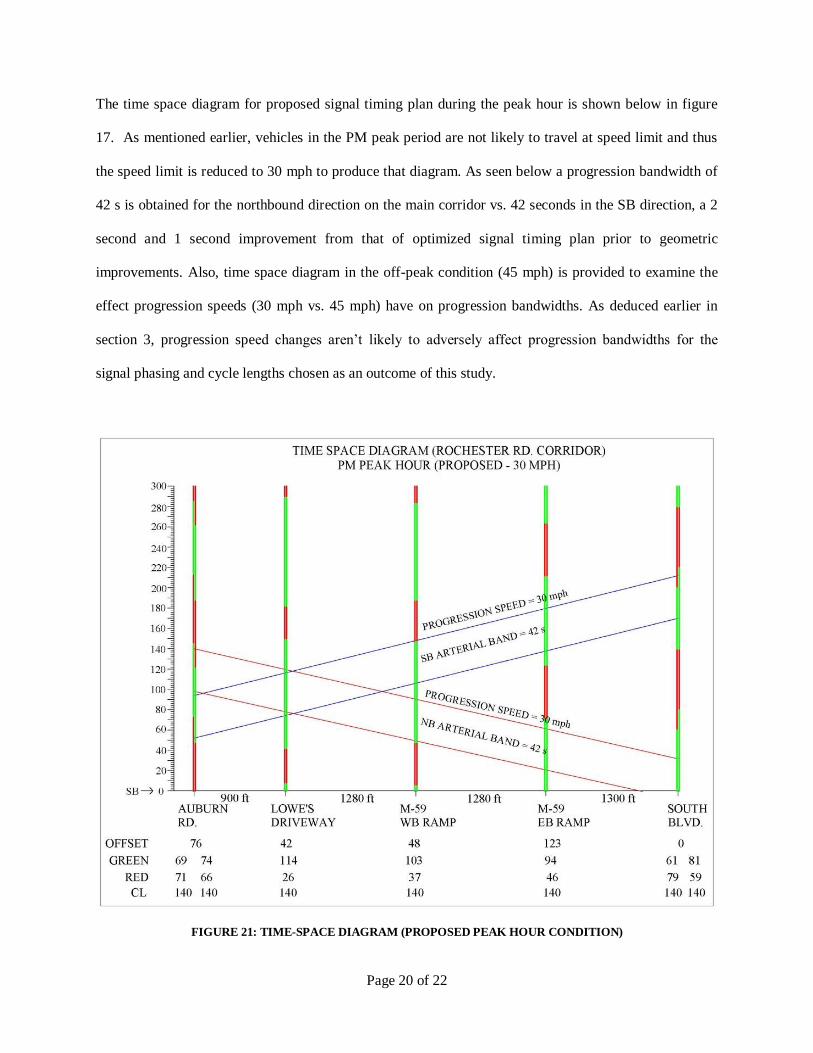
The time space diagram for proposed signal timing plan during the peak hour is shown below in figure
17. As mentioned earlier, vehicles in the PM peak period are not likely to travel at speed limit and thus
the speed limit is reduced to 30 mph to produce that diagram. As seen below a progression bandwidth of
42 s is obtained for the northbound direction on the main corridor vs. 42 seconds in the SB direction, a 2
second and 1 second improvement from that of optimized signal timing plan prior to geometric
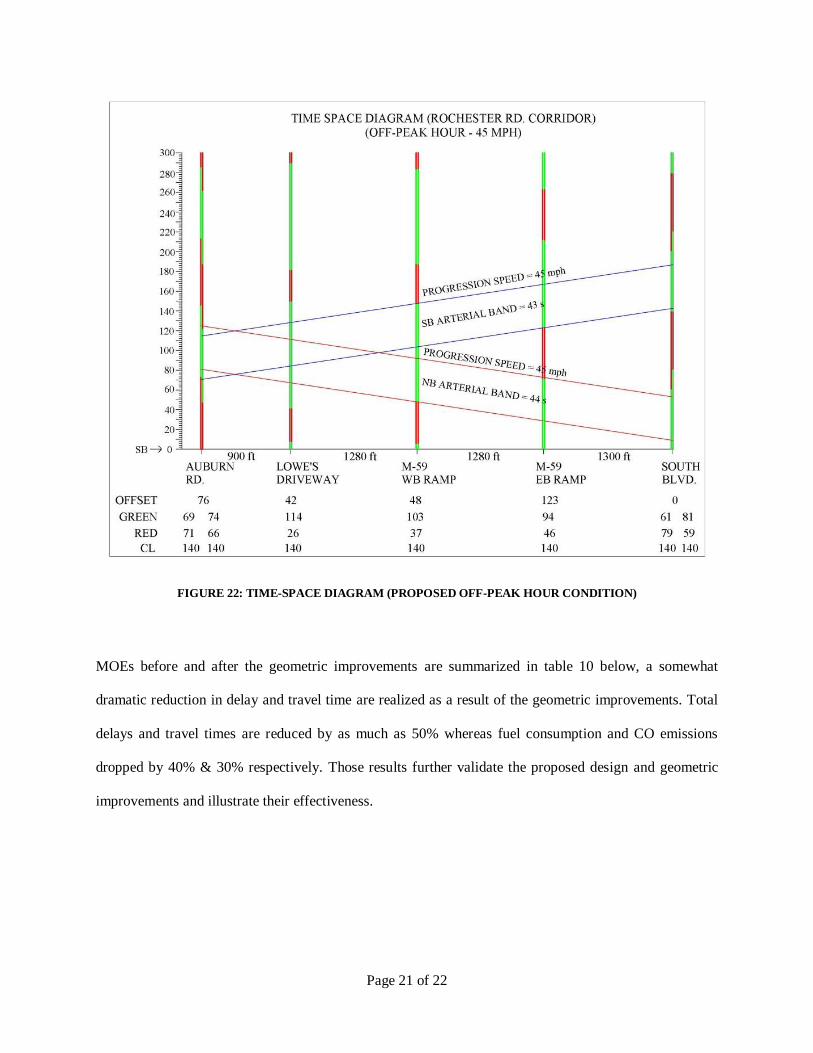
improvements. Also, time space diagram in the off-peak condition (45 mph) is provided to examine the
effect progression speeds (30 mph vs. 45 mph) have on progression bandwidths. As deduced earlier in
section 3, progression speed changes aren’t likely to adversely affect progression bandwidths for the
signal phasing and cycle lengths chosen as an outcome of this study.
FIGURE 21: TIME-SPACE DIAGRAM (PROPOSED PEAK HOUR CONDITION)
Page 21 of 22
FIGURE 22: TIME-SPACE DIAGRAM (PROPOSED OFF-PEAK HOUR CONDITION)
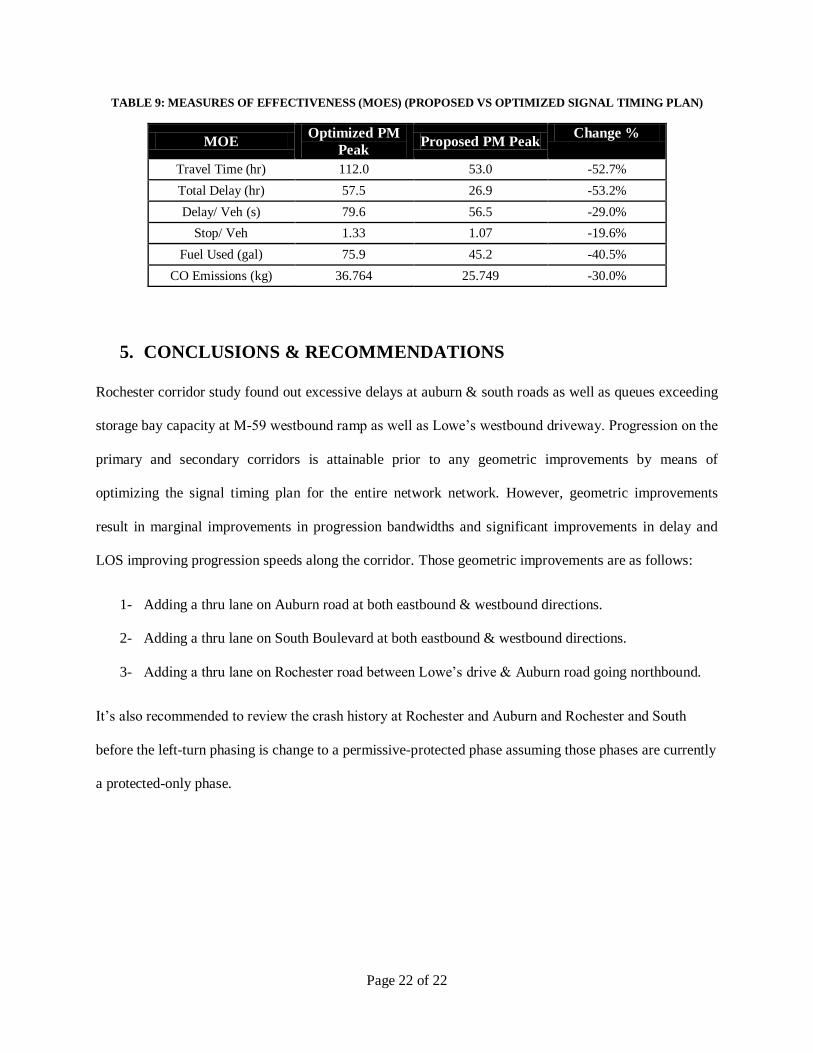
MOEs before and after the geometric improvements are summarized in table 10 below, a somewhat
dramatic reduction in delay and travel time are realized as a result of the geometric improvements. Total
delays and travel times are reduced by as much as 50% whereas fuel consumption and CO emissions
dropped by 40% & 30% respectively. Those results further validate the proposed design and geometric
improvements and illustrate their effectiveness.
Page 22 of 22
TABLE 9: MEASURES OF EFFECTIVENESS (MOES) (PROPOSED VS OPTIMIZED SIGNAL TIMING PLAN)
MOE Optimized PM
Peak Proposed PM Peak
Change %
Travel Time (hr) 112.0 53.0 -52.7%
Total Delay (hr) 57.5 26.9 -53.2%
Delay/ Veh (s) 79.6 56.5 -29.0%
Stop/ Veh 1.33 1.07 -19.6%
Fuel Used (gal) 75.9 45.2 -40.5%
CO Emissions (kg) 36.764 25.749 -30.0%
5. CONCLUSIONS & RECOMMENDATIONS
Rochester corridor study found out excessive delays at auburn & south roads as well as queues exceeding
storage bay capacity at M-59 westbound ramp as well as Lowe’s westbound driveway. Progression on the
primary and secondary corridors is attainable prior to any geometric improvements by means of
optimizing the signal timing plan for the entire network network. However, geometric improvements
result in marginal improvements in progression bandwidths and significant improvements in delay and
LOS improving progression speeds along the corridor. Those geometric improvements are as follows:
1- Adding a thru lane on Auburn road at both eastbound & westbound directions.
2- Adding a thru lane on South Boulevard at both eastbound & westbound directions.
3- Adding a thru lane on Rochester road between Lowe’s drive & Auburn road going northbound.
It’s also recommended to review the crash history at Rochester and Auburn and Rochester and South
before the left-turn phasing is change to a permissive-protected phase assuming those phases are currently
a protected-only phase.