Sierla, Seppo; Azangoo, Mohammad; Fay, Alexander; Vyatkin ...
9
This is an electronic reprint of the original article. This reprint may differ from the original in pagination and typographic detail. Powered by TCPDF (www.tcpdf.org) This material is protected by copyright and other intellectual property rights, and duplication or sale of all or part of any of the repository collections is not permitted, except that material may be duplicated by you for your research use or educational purposes in electronic or print form. You must obtain permission for any other use. Electronic or print copies may not be offered, whether for sale or otherwise to anyone who is not an authorised user. Sierla, Seppo; Azangoo, Mohammad; Fay, Alexander; Vyatkin, Valeriy; Papakonstantinou, Nikolaos Integrating 2D and 3D Digital Plant Information Towards Automatic Generation of Digital Twins Published in: Proceedings of the 29th IEEE International Symposium on Industrial Electronics, ISIE 2020 DOI: 10.1109/ISIE45063.2020.9152371 Published: 01/06/2020 Document Version Peer reviewed version Please cite the original version: Sierla, S., Azangoo, M., Fay, A., Vyatkin, V., & Papakonstantinou, N. (2020). Integrating 2D and 3D Digital Plant Information Towards Automatic Generation of Digital Twins. In Proceedings of the 29th IEEE International Symposium on Industrial Electronics, ISIE 2020 (pp. 460-467). [9152371] (Proceedings of the IEEE International Symposium on Industrial Electronics). IEEE. https://doi.org/10.1109/ISIE45063.2020.9152371
Transcript of Sierla, Seppo; Azangoo, Mohammad; Fay, Alexander; Vyatkin ...

This is an electronic reprint of the original article.This reprint may differ from the original in pagination and typographic detail.
Powered by TCPDF (www.tcpdf.org)
This material is protected by copyright and other intellectual property rights, and duplication or sale of all or part of any of the repository collections is not permitted, except that material may be duplicated by you for your research use or educational purposes in electronic or print form. You must obtain permission for any other use. Electronic or print copies may not be offered, whether for sale or otherwise to anyone who is not an authorised user.
Sierla, Seppo; Azangoo, Mohammad; Fay, Alexander; Vyatkin, Valeriy; Papakonstantinou,NikolaosIntegrating 2D and 3D Digital Plant Information Towards Automatic Generation of DigitalTwins
Published in:Proceedings of the 29th IEEE International Symposium on Industrial Electronics, ISIE 2020
DOI:10.1109/ISIE45063.2020.9152371
Published: 01/06/2020
Document VersionPeer reviewed version
Please cite the original version:Sierla, S., Azangoo, M., Fay, A., Vyatkin, V., & Papakonstantinou, N. (2020). Integrating 2D and 3D Digital PlantInformation Towards Automatic Generation of Digital Twins. In Proceedings of the 29th IEEE InternationalSymposium on Industrial Electronics, ISIE 2020 (pp. 460-467). [9152371] (Proceedings of the IEEE InternationalSymposium on Industrial Electronics). IEEE. https://doi.org/10.1109/ISIE45063.2020.9152371

Integrating 2D and 3D Digital Plant InformationTowards Automatic Generation of Digital Twins
Seppo Sierla1, Mohammad Azangoo1, Alexander Fay2, Valeriy Vyatkin1, 3, and Nikolaos Papakonstantinou4
1Department of Electrical Engineering and Automation, Aalto University, Espoo, Finland2Department of Automation Engineering, Helmut Schmidt University, Hamburg, Germany
3Department of Computer Science, Electrical and Space Engineering, Lulea University of Technology, Lulea, Sweden4VTT Technical Research Centre of Finland Ltd, Espoo, Finland
’[email protected], [email protected], [email protected], [email protected], [email protected]
Abstract—Ongoing standardization in Industry 4.0 supportstool vendor neutral representations of Piping and Instrumenta-tion diagrams as well as 3D pipe routing. However, a completedigital plant model requires combining these two representations.3D pipe routing information is essential for building any accuratefirst-principles process simulation model. Piping and instrumen-tation diagrams are the primary source for control loops. Inorder to automatically integrate these information sources to aunified digital plant model, it is necessary to develop algorithmsfor identifying corresponding elements such as tanks and pumpsfrom piping and instrumentation diagrams and 3D CAD models.One approach is to raise these two information sources to acommon level of abstraction and to match them at this levelof abstraction. Graph matching is a potential technique forthis purpose. This article focuses on automatic generation ofthe graphs as a prerequisite to graph matching. Algorithms forthis purpose are proposed and validated with a case study. Thepaper concludes with a discussion of further research neededto reprocess the generated graphs in order to enable effectivematching.
Index Terms—industry 4.0, process industry, digitisation, au-tomation, modelling and simulation, digital twins, graph match-ing, digital plant, plant design.
I. INTRODUCTION
A major goal of Industry 4.0 is to make plant informationavailable to humans and machines throughout the network ofenterprises involved in designing, commissioning and operat-ing the plant [1]. This information includes design informationas well as information gathered during the operation of theplant, so a life cycle wide information management strategyand supporting tool chains are required [2]. However, plantdesign information still often resides in proprietary and toolspecific formats. A few exceptions exist, such as the ProteusXML schema for P&ID (Piping & Instrumentation Diagram)diagram exchange, which is supported by several leadingP&ID tool vendors [3], and the PCF (Piping ComponentFile) format for 3D isometrics, supported by leading toolvendors such as Hexagon PPM, Autodesk, Alias and PTCCreo. However, these are solutions for exchanging a specifictype of diagram between tools of different vendors. There isalso a need to integrate the information produced with differenttypes of tools. The scope of this article is 2D information fromP&IDs and 3D information from CADs, in the Proteus XML
and PCF formats, respectively. Our use cases for integratingsuch information is the generation of a digital twin, extendingrecent work [4] by combining the control loop informationfrom the P&ID with the physical layout from the 3D CAD. Astraightforward approach for information integration would beto match tag names from the 2D and 3D information sourcesto identify the parts of these models that correspond to thesame component. However, with industrial design repositoriesit cannot be assumed that consistent naming conventions havebeen enforced to enable this approach [5]. Thus, the integrationof 2D and 3D plant information is a challenging task, so itis helpful to break it down to a process consisting of severalsteps. Further research on proposing the steps of such a processis solicited from other research groups. In this paper, thefollowing process is suggested:
1) Digitize the information to a standard, industrially ac-cepted Industry 4.0 format. This may involve no effortif the designs were made in tools that support theseformats. However, industrial plants have lifecycles ofseveral decades, in which case innovative applicationsare required to digitalize the legacy design information.Such work has been done for P&IDs [6]–[8].
2) Raise the level of abstraction of the 2D and 3D designs,so that they are at the same level of abstraction.
3) Match the models generated in step 2, to identify theelements in these models that correspond to the sameplant component, such as a tank or pump.
4) Use the matches to augment applications relying onlyon either 2D or 3D information sources. For example,[9] generate the physical aspect of a digital twin of aprocess based solely on the 3D information, so controlsoftware is not generated and a legacy control systemis expected to be integrated as in [10]. [3] generate thecyber aspect of a digital twin, i.e. a control system, basedon the 2D information. If the instrumentation in the 2Dand 3D sources could be matched, it would be possibleto automatically identify and connect the I/O interfaceof the physical and virtual aspects of the digital twin,eventually aiming at automatic generation of a systemthat could be considered a fully-fledged digital twin [11].

In this paper, it is expected that step 1 has been performed.The research goal of this paper is step 2. Steps 3 and 4are presented for motivational purposes and they are left forfurther research.
II. RELATED WORK
Significant prior work has been done with respect to step1 of the process proposed in section I. Legacy engineeringdocuments can be digitized by scanning and storing [12].OCR (Optical Character Recognition) can be used to identifye.g. tag names in scans and, thus, to link engineering docu-ments (such as equipment data sheets, work instructions, andoperating manuals) that are related to each other. However,graphical data cannot be transformed into information, andlinks between items on a drawing cannot be transformed intoa digital structural model. Several authors have investigatedthe extraction of text annotations from mixed text-graphicdocuments. [13] proposed a method for string separationin images with annotations. [14] introduced a raster-basedmethod for the identification of string boxes. [15] proposeda hybrid algorithm for the same task. [16] presented a methodfor the recognition of both text and basic parametrical forms indocuments. [17], [18] addressed the recognition of text fromdrawings. In [19], authors presented approaches for detectionand segmentation of complex engineering drawings consistingof textual and graphical elements, aiming at identificationof key elements only. Also, they published a comprehensivesurvey on alternative approaches for the digitisation of com-plex engineering drawings [20]. Other works have focusedon the analysis of symbols (OSR), which is relevant e.g.in mechanical engineering to interpret and convert designdrawings [21]. The ultimate goal is to generate 2D or 3Dmodels in a neutral format. [22] presented a system whichis able to interpret a range of engineering documents, such aslogical diagrams, electrical circuits, and P&IDs. This approachdoes not support key geometric features such as scaling, rota-tion, and partial overlap of objects. [23] presented a methodto analyse design drawings, esp. electric wiring diagrams.[24] proposed the combination of geometric and semanticinformation for the reconstruction of 3D CAD models fromengineering drawings. The semantic information used in thisapproach is, however, limited to the recognition of symbolsand does not consider semantic properties of the analyzedstructural items. In addition, commercial methods exist whichallow for automatic conversion of CAD designs into object-oriented models [25], but this requires access to the originalCAD model software and can therefore not be applied to thetypical use case where a plant owner has to rely on PDFdocuments. In [6], a method is described which combines OSRwith semantic knowledge. This method allows extracting astructural model from a given 2D diagram, e.g. a P&I diagramor a control logic diagram. Furthermore, a method is describedwhich merges the 2D P&I Diagram and the 2D control logicdiagram into a single structural model. The method has beenapplied successfully to interpret engineering documents froman oil rig in the North Sea [26]. The method is limited as
it relies on a consistent, common naming scheme of the tagnames in both diagrams. In [27], a P&I diagram is analysedfor design faults based on the identified objects and theirconnections. A similar approach has been patented recentlyby T. Tung [28].
For step 2 of the process proposed in section I, severalauthors have identified graph formats as a suitable abstrac-tion of complex engineering drawings. In [29], it has beendescribed how to formulate rules which can be applied toconvert structural plant models into more abstract models. Forexample, a P&ID which contains tanks, nozzles, pipes andjoints can be converted into a structural model which providesall possible flow paths between a given set of tanks. [30]presents an application for the automatic generation of bondgraph models from an IEC 62424 hierarchical representationof the process plants. Also, [5] convert 3D pulp&paper plantdesigns to graphs in order to perform graph matching toidentify similar, and thus reusable designs. [31] has presentedan approach for extracting information from P&ID sheets byusing deep learning networks and low-level image processingtechniques for capturing inlets, outlets and pipelines as a tree-like data structure. [32] uses graph abstractions to identifydifferences between process designs, as captured in 3D CADmodels, and the as-built version of the plant, as captured bylaser scans.
In recent years, many efforts have been made to standardizeprocess presentation formats. The ISO 15926 standard infor-mation model with its Proteus XML file format [33], [34]focuses on the interoperability of P&IDs. A working group ofowner operators, software vendors and research organizationscalled DEXPI developed a specification (DEXPI) based onthe ISO 15926 to address practical issues and push for theadoption of the DEXPI/ISO15926 as an open P&ID storageformat. DEXPI and OPC Foundation have formed a jointworking group for defining a DEXPI OPC UA companionspecification [35] to enable access of P&ID data over OPCUA communication platforms. Also, In [36], ISO 15926 andIEC 62424, i.e. two different standards for computer-accessiblestructural model descriptions, which have been conceived forthe modeling of process plants, have been compared.
III. CASE STUDY
The case study is a thermo-hydraulic water process (Fig. 1).The functionality of the process is not important for the aimsof this article, but interested readers will find more details in[4], [9], [10], [37].
The process has been modelled in the Intergraph Smart3D tool (Fig. 2), which is capable of exporting PCF files.The model includes 10 pipelines, each of which has itscorresponding PCF file. Pipelines may have branches. Theendpoint of a pipeline is either a nozzle of process equipmentor an open endpoint, referencing another open end point inanother PCF file.
A P&ID has been developed in the SmartPlant P&ID andexported with its ISO 15926 export tool. The exported fileconforms to the Proteus 3.6 XML schema. Fig. 3 presents a
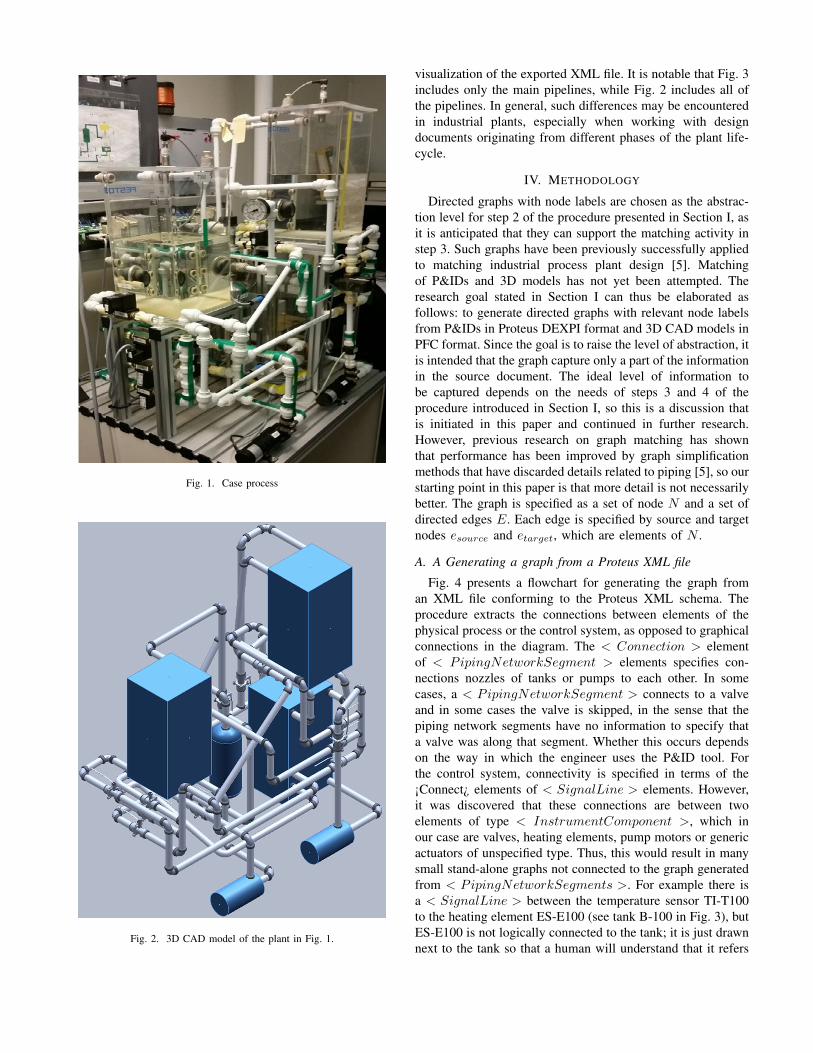
Fig. 1. Case process
Fig. 2. 3D CAD model of the plant in Fig. 1.
visualization of the exported XML file. It is notable that Fig. 3includes only the main pipelines, while Fig. 2 includes all ofthe pipelines. In general, such differences may be encounteredin industrial plants, especially when working with designdocuments originating from different phases of the plant life-cycle.
IV. METHODOLOGY
Directed graphs with node labels are chosen as the abstrac-tion level for step 2 of the procedure presented in Section I, asit is anticipated that they can support the matching activity instep 3. Such graphs have been previously successfully appliedto matching industrial process plant design [5]. Matchingof P&IDs and 3D models has not yet been attempted. Theresearch goal stated in Section I can thus be elaborated asfollows: to generate directed graphs with relevant node labelsfrom P&IDs in Proteus DEXPI format and 3D CAD models inPFC format. Since the goal is to raise the level of abstraction, itis intended that the graph capture only a part of the informationin the source document. The ideal level of information tobe captured depends on the needs of steps 3 and 4 of theprocedure introduced in Section I, so this is a discussion thatis initiated in this paper and continued in further research.However, previous research on graph matching has shownthat performance has been improved by graph simplificationmethods that have discarded details related to piping [5], so ourstarting point in this paper is that more detail is not necessarilybetter. The graph is specified as a set of node N and a set ofdirected edges E. Each edge is specified by source and targetnodes esource and etarget, which are elements of N .
A. A Generating a graph from a Proteus XML file
Fig. 4 presents a flowchart for generating the graph froman XML file conforming to the Proteus XML schema. Theprocedure extracts the connections between elements of thephysical process or the control system, as opposed to graphicalconnections in the diagram. The < Connection > elementof < PipingNetworkSegment > elements specifies con-nections nozzles of tanks or pumps to each other. In somecases, a < PipingNetworkSegment > connects to a valveand in some cases the valve is skipped, in the sense that thepiping network segments have no information to specify thata valve was along that segment. Whether this occurs dependson the way in which the engineer uses the P&ID tool. Forthe control system, connectivity is specified in terms of the¡Connect¿ elements of < SignalLine > elements. However,it was discovered that these connections are between twoelements of type < InstrumentComponent >, which inour case are valves, heating elements, pump motors or genericactuators of unspecified type. Thus, this would result in manysmall stand-alone graphs not connected to the graph generatedfrom < PipingNetworkSegments >. For example there isa < SignalLine > between the temperature sensor TI-T100to the heating element ES-E100 (see tank B-100 in Fig. 3), butES-E100 is not logically connected to the tank; it is just drawnnext to the tank so that a human will understand that it refers

Fig. 3. P&ID of the plant in Fig. 1.
to the heating element in the tank. Thus, although extractionof < InstrumentComponent > and < SignalLine >elements was implemented, it was concluded after examiningthe results for the case study that it is very questionablewhether these would add value to the generated graph. Thus,the procedure in Fig. 4 does not examine these elements. Itis understood that further research is needed to determine theideal level of detail for graphs generated from Proteus XML.
The flowchart in Fig. 4 attaches 3 kinds of labels to nodes:nname (a unique id), nlable (a tag for human readable presen-tation) and nclass (which specifies the type of component andmay be used later for graph matching purposes).
B. Generating a graph from a PCF file
Fig. 5 presents a procedure for generating a directed graphfrom a PCF file. The ‘New Component?’ element of the MAINALGORITHM examines components of type PIPE, WELDand VALVE. The PCF also defines TEE-STUB elements,but the branches in the pipelines can be captured in thegraph without examining these elements. Each componenthas two END-POINT lines in the PCF file, which specify3D coordinates. Each such coordinate will result in a nodein the graph. The two END-POINTs are used to define anedge between the nodes that they define. The edge is labelledwith the type of component; the types relevant for our casestudy are ‘Pipe’, ‘Weld’ and ‘Valve’. Thus, these nodes do notcorrespond to nodes in the graph generated from the P&ID.ALGORITHM2 in Fig. 5 extracts end connections from thePCF and generates nodes for them as well. The end connectionof a pipeline is either a nozzle of process equipment or anopen endpoint, referencing another open endpoint in anotherPCF file. In the case of a nozzle of process equipment, thecreated node will have a direct correspondence to a nodegenerated from the P&ID. The label of this node generated byALGORITHM2 is a string that combines tag and componenttype information, thus merging information similar to nlable
and nclass generated by the algorithm Fig. 4.
STARTRead Proteus XML file to Java document model
Eq = set of <Equipment> elements
Eq = ∅
Remove eq ∈ Eq from Eq; Create node n ∈ Nnname = “ID” attribute of eq
nlabel = “TagName” attribute of eqnclass = “ComponentClass” attribute of eq
NzEq = set of <Nozzle> elements of Eq
NzEq = ∅
Remove nz ∈ NzEq from NzEq
Create node n ∈ N; nname = “ID” attribute of nz
PI = set of <ProcessInstrument> elements
F
F
T
T
PI = ∅
Remove pi ∈ PI from PI; Create node n ∈ Nnname = “ID” attribute of pi
nlabel = “TagName” attribute of pinclass = “ComponentClass” attribute of pi
F
PNS = set of <PipingNetworkSegment> elements
PNS = ∅
Remove pns ∈ PNS from PNS; Create edge e ∈ ERetrieve element <Connection> of pns,
and get its “FromID” and “ToID” attributesesource = n ∈ N : nname = ”FromID”
etarget = n ∈ N : nname = ”TOID”
F
STOPT
T
Fig. 4. Flowchart for generating a directed graph from an XML fileconforming to Proteus XML schema.
MAIN ALGORITHM
Read next line of PCF file
End offile?
Create edge e and add to Eelabel = component typeSet firstEndPoint = trueExecute ALGORITHM1
Newcomponent?
ALGORITHM1
END-POINTon this line?
Parse XYZ coordinates and create node n.
firstEndPoint
∃ n’ ∈ N:n = n’
Add n to NCreate reference n’
Assign n’ = nRetrieve n’
TF
esource = n’Set firstEndPoint = false
etarget = n’
F
T
T
F
RETURN
Read next line of PCF file
DONE
T
F
T
F
Create edge e and add to EExecute ALGORITHM2
New endconnection?
T
Read next line of PCF file
ALGORITHM2
CO-ORDSon this line?
Parse XYZ coordinates.Create node n
esource = n
∃ n’ ∈ N:n = n’
etarget = n’
T F
F
T
RETURN
MALFORMEDPCF
Read next line of PCF file
CONNECTION-REFERENCE on this
line?
Parse connection name(next word on this line)nlabel = connection name
F
T
F
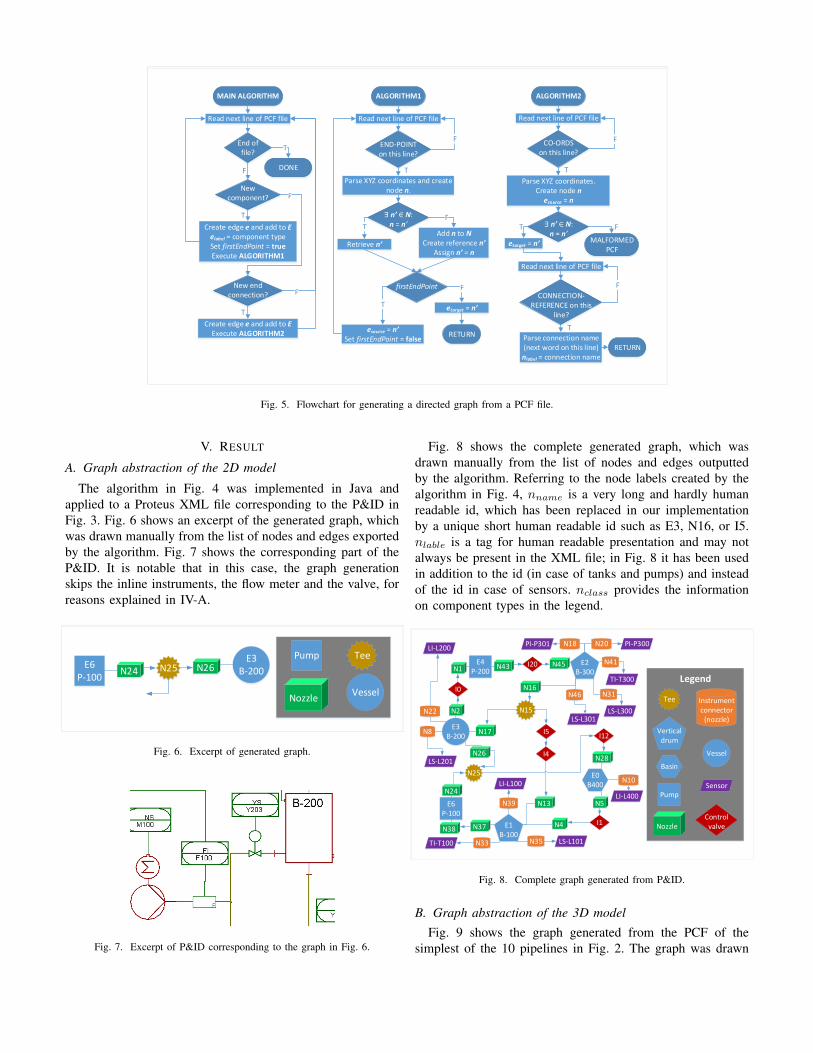
Fig. 5. Flowchart for generating a directed graph from a PCF file.
V. RESULT
A. Graph abstraction of the 2D model
The algorithm in Fig. 4 was implemented in Java andapplied to a Proteus XML file corresponding to the P&ID inFig. 3. Fig. 6 shows an excerpt of the generated graph, whichwas drawn manually from the list of nodes and edges exportedby the algorithm. Fig. 7 shows the corresponding part of theP&ID. It is notable that in this case, the graph generationskips the inline instruments, the flow meter and the valve, forreasons explained in IV-A.
Vessel
Pump
Nozzle
E3B-200
TeeN25 N26E6
P-100N24
Fig. 6. Excerpt of generated graph.
Fig. 7. Excerpt of P&ID corresponding to the graph in Fig. 6.
Fig. 8 shows the complete generated graph, which wasdrawn manually from the list of nodes and edges outputtedby the algorithm. Referring to the node labels created by thealgorithm in Fig. 4, nname is a very long and hardly humanreadable id, which has been replaced in our implementationby a unique short human readable id such as E3, N16, or I5.nlable is a tag for human readable presentation and may notalways be present in the XML file; in Fig. 8 it has been usedin addition to the id (in case of tanks and pumps) and insteadof the id in case of sensors. nclass provides the informationon component types in the legend.
Legend
Vessel
Basin
Vertical drum
Pump
E4P-200
Nozzle
N43 N45 E2B-300N1
N2
E3B-200
Sensor
Controlvalve
LS-L201
I0
Instrumentconnector
(nozzle)
N8
I20
Tee
N25
N22
LI-L200
N26
E6P-100
N24
N38 E1B-100
N37
N33 N35TI-T100 LS-L101
N39
LI-L100
N4 I1
E0B400
N5
N28
I12
N31
LS-L300
N41
TI-T300N16
N15
I5
I4
N13
N10
LI-L400
N17
N18PI-P301 N20 PI-P300
N46
LS-L301
Fig. 8. Complete graph generated from P&ID.
B. Graph abstraction of the 3D modelFig. 9 shows the graph generated from the PCF of the
simplest of the 10 pipelines in Fig. 2. The graph was drawn

manually from the list of nodes and edges outputted by thealgorithm in Fig. 5. Color coding is used to show the corre-sponding process components on the photo of the pipeline.
Node0
Node1
Node4
Node5
Node8
Node9
B100_Preheater/Out_M100$15
M100/In_Preheater$15
Pipe0Elbow2
Weld1
Weld3
Pipe4
Weld5Endpoint7
EndPoint8
Fig. 9. Graph for the pipeline from tank 100 to pump 100
Fig. 10 repeats the experiment on a more complex pipelinewith branches and valves, and Fig. 11 uses color coding tomark the corresponding elements on a photo of the pipeline.
It is notable that the edge directions do not correspond toflow directions, which may be a major issue for matchingapproaches based on directed graphs. Three possible solutionsare proposed for further research:
1) It would be possible to examine the FLOW attributesof the PCF. However, these are optional attributes andit cannot be assumed that modelers define them, so thisapproach is not recommended.
2) The START-CO-ORDS attribute of the pipeline can beused. This can be used to identify the end connectionnode on the pipeline from which the flow originates. Thesolution depends on assuming that in 1 PCF file thereare branches but no loops and that flows in all branchesare away from the node at START-CO-ORDS. START-CO-ORDS is an optional attribute, but this assumptioncould be enforced by a semi-automatic solution that asksthe users to specify the start node for each pipeline. Ifthere is a usable interface which allows the user to selectfrom options in a drop-down menu, the manual workloadwould be minimal. In this case, the edge directions canbe fixed to correspond to flow directions by treating thegraph generated from the PCF file as a tree with thenode at START-CO-ORDS as the root node. The graphcould then be processed with a tree traversal algorithm,so that edge directions are fixed to always point awayfrom the root.
Node39
Node40
Node5
Node36
Node0
Node1B200_Feedwater/Out_M200$15
Pipe20
Elbow18
Weld19
Pipe0
Weld2
EndPoint46
Node42Weld21
Node44Elbow22
Node54
Node59
Node46
Node50
Node47
Node58
Node67
Weld24
Pipe23
Valve25
Pipe27
Weld30
Elbow29
Weld34
Node31
Node62
Node79
Node78
Node70
Node74
Node71
Node83
Node82
Pipe33
Pipe31Node64
Pipe32
Weld36
Elbow35
Node75Weld38
Pipe37
Weld40
Elbow39
Weld43
Pipe41
M200/In_Feedwater$15
EndPoint46
Node7
Node11
Node6
Node89
Node13
Pipeline 2(other PCF file)
EndPoint47
Pipe44
B400_Makeup/Out_M200$15
EndPoint47
Pipe3
Weld5
Elbow6
Node18
Node19
Node14
Node15
Node22
Node23
Node27
Weld8
Pipe7
Weld10Elbow9
Weld12
Pipe11
Valve13
Pipe15
Fig. 10. Graph generated from the PCF of the pipeline from tank 200 topump 200.
3) The ingoing and outgoing flows at pumps are specifiedin the end connection information of the PCF. In case ofpipelines without pumps, in which the flow is caused bygravity, the elevations of the endpoints can be used toinfer the flow direction. This could be used to overcomethe need for manual input in solution 2 in case START-CO-ORDS has not been used.
VI. DISCUSSION
Fig. 12 matches the PCF generated graph in Fig. 9 tothe Proteus generated graph in Fig. 8. Color-coding is usedto show the matching elements. The blue color makes itclear how the graphs are at a different level of abstraction.Graph simplification methods such as presented in [5] couldreadily be applied to eliminate this difference; however, theraw outputs are presented in Fig. 12, since the ideal graphsimplification approach is a matter of further research.
Fig. 13 matches the PCF generated graph Fig. 10 to theProteus generated graph in Fig. 8. It is notable that someparts of the PCF generated graph could not be matched, asthey correspond to pipelines not included in the simplified

Fig. 11. Marking the color coded nodes and edges in Fig. 10 with coloredellipses on the relevant process components on the photo of the pipeline.
Node0
Node1
Node4
Node5Node8
Node9 B100_Preheater/Out_M100$15
M100/In_Preheater$15
Pipe0
Elbow2
Weld1
Weld3Pipe4
Weld5
Endpoint7EndPoint8
E4P-200
N43 N45 E2B-300N1
N2
E3B-200
LS-L201
I0
N8
I20
N25
N22LI-L200
N26
E6P-100
N24
N38 E1B-100
N37
N33 N35TI-T100 LS-L101
N39
LI-L100
N4 I1
E0B400
N5
N28
I12
N31
LS-L300
N41
TI-T300N16
N15
I5
I4
N13
N10
LI-L400
N17
N18PI-P301 N20 PI-P300
N46
LS-L301
Fig. 12. Matching the graph in Fig. 9 to the graph in Fig. 8.
P&ID. As discussed in Section III, such a scenario is likelyto occur in industrial practice over the plant lifecycle andsolutions developed in further work should be robust againstthese scenarios.
E4P-200
N43 N45 E2B-300N1
N2
E3B-200
LS-L201
I0
N8
I20
N25
N22LI-L200
N26
E6P-100
N24
N38 E1B-100
N37
N33 N35TI-T100 LS-L101
N39
LI-L100
N4 I1
E0B400
N5
N28
I12
N31
LS-L300
N41
TI-T300N16
N15
I5
I4
N13
N10
LI-L400
N17
N18PI-P301 N20 PI-P300
N46
LS-L301
Node39
Node40
Node5
Node36
Node0
Node1
B200_Feedwater/Out_M200$15
Pipe20
Elbow18
Weld19
Pipe0
Weld2
EndPoint46
Node42Weld21
Node44Elbow22
Node54
Node59
Node46
Node50
Node47
Node58
Node67
Weld24
Pipe23
Valve25
Pipe27
Weld30
Elbow29
Weld34
Node31
Node62
Node79
Node78
Node70
Node74
Node71
Node83
Node82
Pipe33
Pipe31Node64
Pipe32
Weld36
Elbow35
Node75Weld38
Pipe37
Weld40
Elbow39
Weld43
Pipe41
M200/In_Feedwater$15
EndPoint46
Node7
Node11
Node6
Node89
Node13
Pipeline 2(other PCF file)
EndPoint47
Pipe44
B400_Makeup/Out_M200$15
EndPoint47
Pipe3
Weld5
Elbow6
Node18
Node19
Node14
Node15
Node22
Node23
Node27
Weld8
Pipe7
Weld10Elbow9
Weld12
Pipe11
Valve13
Pipe15
Fig. 13. Matching the graph in Fig. 10 to the graph in Fig. 8.
The color-coding in Fig. 12 and Fig. 13 was added manually.The automation of this matching work belongs to step 3 of theprocedure introduced in Section I and is expected to be donein further work by graph matching techniques similar to [5]. Itis notable that the graphs generated by the algorithms in Fig. 4and Fig. 5 are a straightforward abstraction of the informationin the source formats. Thus, they may not be ideal inputs forgraph matching methods in further work. In particular, nodesin the graph generated from a P&ID correspond to processcomponents and have a label nclass, which specifies the typeof component. However, the PFC file specifies componentssuch as pipe segments, welds and valves with result in edges.In other words, nodes in the P&ID graph may correspond toedges in the PCF graph (such as the indigo coded elements inFig. 13).
VII. CONCLUSION
To summarize the discussion, a preprocessing phase maybe needed before graph matching to address the identifieddisparities between the graphs generated from the 2D and3D sources. In particular, piping simplifications algorithmsas in [5] could be applied to the graphs generated from the3D CAD to arrive at the same level of details as in theP&ID graphs. Additional novel preprocessing algorithms arerequired to address disparities such as valves being representedas nodes in the 2D graph and as edges in the 3D graph.Finally, the findings suggest that level of tool support andindustry standardization for capturing flow directions maybe insufficient for the development of robust and generalsolutions for generating directed graphs from 3D CAD models.In this case, one viable option is to work with undirected

graphs, since according to previous research the directioninformation is only used to variants of the graph matchingalgorithm, such as the ‘anchor similarity measure’ in [5]. Afterthese preprocessing steps, it is reasonable to expect the graphmatching will give good results, since the graphs to be matchedhave similar structure and level of detail. The matching willprovide the basis for integrating the 2D and 3D informationto a single digital plant model.
VIII. ACKNOWLEDGEMENTS
This work was partially supported by Business Finlandproject SEED (grant 4153/31/2019.)
REFERENCES
[1] F. Zezulka, P. Marcon, I. Vesely and O. Sajdl, “Industry 4.0 – AnIntroduction in the phenomenon,” IFAC-PapersOnLine, vol.49, issue 25,pp. 8-12, 2016.
[2] R. Harrison, D. Vera and B. Ahmad, ”Engineering Methods and Toolsfor Cyber–Physical Automation Systems,” in Proceedings of the IEEE,vol. 104, no. 5, pp. 973-985, May 2016.
[3] N. Papakonstantinou, J. Karttunen, S. Sierla and V. Vyatkin, ”Design toautomation continuum for industrial processes: ISO 15926 – IEC 61131versus an industrial case,” 2019 24th IEEE International Conferenceon Emerging Technologies and Factory Automation (ETFA), Zaragoza,Spain, 2019, pp. 1207-1212.
[4] G. S. Martınez, S. A. Sierla, T. A. Karhela, J. Lappalainen and V.Vyatkin, ”Automatic Generation of a High-Fidelity Dynamic Thermal-Hydraulic Process Simulation Model From a 3D Plant Model,” in IEEEAccess, vol. 6, pp. 45217-45232, 2018.
[5] M. Rantala, H. Niemisto, T. Karhela, S. Sierla and V. Vyatkin, “Applyinggraph matching techniques to enhance reuse of plant design informa-tion,” Computers in Industry, vol. 107, pp. 81-98, 2019.
[6] E. Arroyo, M. Hoernicke, P. Rodrıguez and A. Fay,“Automatic derivationof qualitative plant simulation models from legacy piping and instru-mentation diagrams,” Computers in Chemical Engineering, vol.92, pp.112-132, 2016.
[7] M. Barth, A. Fay, “Automated generation of simulation models forcontrol code tests,” Control Engineering Practice, vol.21, issue 2, pp.218-230, 2013.
[8] J. Nurminen, K. Rainio, J.-P. Numminen, T. Syrjanen, N. Paganus and K.Honkoila, “Object Detection in Design Diagrams with Machine Learn-ing,” CORES 2019: The 11th International Conference on ComputerRecognition Systems, Polanica-Zdroj, Poland, 2019.
[9] G. S. Martınez, S. Sierla, T. Karhela and V. Vyatkin, ”AutomaticGeneration of a Simulation-Based Digital Twin of an Industrial ProcessPlant,” IECON 2018 - 44th Annual Conference of the IEEE IndustrialElectronics Society, Washington, DC, 2018, pp. 3084-3089.
[10] G. S. Martınez, T. A. Karhela, R. J. Ruusu, S. A. Sierla and V.Vyatkin, ”An Integrated Implementation Methodology of a Lifecycle-Wide Tracking Simulation Architecture,” in IEEE Access, vol. 6, pp.15391-15407, 2018.
[11] C. Koulamas and A. Kalogeras, “Cyber-Physical Systems and DigitalTwins in the Industrial Internet of Things,” Computer, vol.51, issue 11,pp. 95-98, 2018.
[12] ”Viewport Operations.” viewport.ai. https://viewport.ai/solutions/products/viewport-operations (accessed Jan. 30, 2020).
[13] S. Chowdhury, S. Mandal, A. Das and B. Chanda, ”Segmentation of Textand Graphics from Document Images,” Ninth International Conferenceon Document Analysis and Recognition (ICDAR 2007), Parana, 2007,pp. 619-623.
[14] J. Gao, L. Tang, W. Liu and Z. Tang, ”Segmentation and recognitionof dimension texts in engineering drawings,” Proceedings of 3rd Inter-national Conference on Document Analysis and Recognition, Montreal,Quebec, Canada, 1995, pp. 528-531 vol.1.
[15] I. Chai and D. Dori, ”Extraction of text boxes from engineeringdrawings,” Proc. SPIE 1661, Machine Vision Applications in CharacterRecognition and Industrial Inspection, August 1992.
[16] L. Wenyin and D. Dori, ”Genericity in graphics recognition algorithms,”Tombre K., Chhabra A.K. (eds) Graphics Recognition Algorithms andSystems. GREC 1997. Lecture Notes in Computer Science, vol. 1389.Springer, Berlin, Heidelberg, 1998.
[17] L. Zhaoyang, ”Detection of text regions from digital engineeringdrawings,” in IEEE Transactions on Pattern Analysis and MachineIntelligence, vol. 20, no. 4, pp. 431-439, April 1998.
[18] C.-C Han and K.-C Fan, ”Skeleton generation of engineering drawingsvia contour matching,” Pattern Recognition, vol, 27, issue 2, pp. 261-275, ISSN 0031-3203, 1994.
[19] C. F. Moreno-Garcıa, E. Elyan and C. Jayne, ”Heuristics-Based Detec-tion to Improve Text/Graphics Segmentation in Complex EngineeringDrawings,” Communications in Computer and Information Science, vol.744, Springer, 2017.
[20] C. F. Moreno-Garcıa, E. Elyan and C. Jayne, ”New trends on digitisationof complex engineering drawings,” Neural Comput. & Applic., vol. 31,issue 6, pp. 1695–1712, 2019.
[21] T. C. Henderson, ”Analysis of Engineering Drawings and Raster MapImages,” Springer, 10.1007/978-1-4419-8167-7, 2014.
[22] Y. Yu, A. Samal and S. C. Seth, ”A system for recognizing a large classof engineering drawings,” Proceedings of 3rd International Conferenceon Document Analysis and Recognition, Montreal, Quebec, Canada,1995, pp. 791-794 vol.2.
[23] M. A. Berbar, “Automatic Diagrams Analysis,” Geometric Modeling andImaging–New Trends (GMAI’06), pp. 160-170, 2006.
[24] C. Ah-Soon and K. Tombre, ”A step towards reconstruction of 3-D CADmodels from engineering drawings,” Proceedings of 3rd InternationalConference on Document Analysis and Recognition, Montreal, Quebec,Canada, 1995, pp. 331-334 vol.1.
[25] ”xmplant.” https://www.nextspace.nz[26] M. Hoernicke, A. Fay and M. Barth, ”Virtual plants for brown-field
projects,” 2015 IEEE 20th Conference on Emerging Technologies &Factory Automation (ETFA), Luxembourg, 2015, pp. 1-8.
[27] W. C. Tan, I-M. Chen, S. J. Pan and H. K. Tan, ”Automated designevaluation on layout of Piping and Instrumentation Diagram usingHistogram of Connectivity,” 2016 IEEE International Conference onAutomation Science and Engineering (CASE), Fort Worth, TX, 2016,pp. 1295-1300.
[28] Piping and instrumentation planning and maintenance system, by T.Tung, J-I. Chatelain, J. A. Weichenberger, I. S. Grewal. (2018, Sep.7). US10534983B1. Accessed on: Jan. 14, 2020. [Online]. Available:https://www.patentguru.com/US10534983B1
[29] T. Schmidberger and A. Fay, ”A rule format for industrial plant infor-mation reasoning,” 2007 IEEE Conference on Emerging Technologiesand Factory Automation (EFTA 2007), Patras, 2007, pp. 360-367.
[30] S. Beez, A. Fay and N. Thornhill, ”Automatic generation of bondgraph models of process plants,” 2008 IEEE International Conferenceon Emerging Technologies and Factory Automation, Hamburg, 2008,pp. 1294-1301.
[31] R. Rahul, S. Paliwal, M. Sharma and L. Vig, ”Automatic InformationExtraction from Piping and Instrumentation Diagrams,” arXiv preprintarXiv:1901.11383, 2019.
[32] H. Son, C. Kim and C. Kim, ”3D reconstruction of as-built industrialinstrumentation models from laser-scan data and a 3D CAD databasebased on prior knowledge,” Automation in Construction, vol. 49, partB, pp. 193-200, 2015.
[33] DEXPI. ”Data Exchange in the Process Industry (DEXPI).” 2019, fromhttp://www.dexpi.org/.
[34] Fiatech. ”ISO 15926 Information Models and Proteus Mappings (IIMM)- Proteus schema.” Retrieved 2017, from http://fiatech.org/information-management/projects/1161-iso-15926-information-models-and-proteus-mappings-iimm.
[35] M. Wiedau, L. von Wedel, H. Temmen, R. Welke and N. Papakonstanti-nou, ”ENPRO Data Integration: Extending DEXPI Towards the AssetLifecycle,” Chemie Ingenieur Technik, vol. 91, issue 3, pp. 240-255,2019.
[36] T. Holm, L. Christiansen, M. Goring, T. Jager and A. Fay, ”ISO 15926vs. IEC 62424 — Comparison of plant structure modeling concepts,”Proceedings of 2012 IEEE 17th International Conference on EmergingTechnologies & Factory Automation (ETFA 2012), Krakow, 2012, pp.1-8.
[37] S. Sierla, T. A. Karhela and V. Vyatkin, ”Automatic Generation ofPipelines Into a 3D Industrial Process Model,” IEEE Access, vol. 5,pp. 26591-26603, 2017.