Siemens Q1 FY09 - Home - English - Siemens Global … one or more of these risks or uncertainties...
17
Copyright © Siemens AG 2009. All rights reserved. Siemens Q1 FY09 The Analyst Conference Call, on January 27, at 8.45 a.m., and will be webcast on www.siemens.com/investorrelations The Annual Press Conference will take place in Munich, on January 27, at 7.45 a.m., and will be webcast on www.siemens.com/press IR FLASHLIGHT
Transcript of Siemens Q1 FY09 - Home - English - Siemens Global … one or more of these risks or uncertainties...

Copyright © Siemens AG 2009. All rights reserved.
Siemens Q1 FY09
The Analyst Conference Call,on January 27, at 8.45 a.m., and will be webcast on www.siemens.com/investorrelations
The Annual Press Conference will take place in Munich,on January 27, at 7.45 a.m., and will be webcast on www.siemens.com/press
IR FLASHLIGHT

Page 2 January 2009 Copyright © Siemens AG 2009. All rights reserved.Flashlight Q1 09
Safe Harbour Statement
This document contains forward-looking statements and information – that is, statements related to future, not past, events. These statements may be identified by words such as “expects,” “looks forward to,” “anticipates,” “intends,” “plans,” “believes,” “seeks,” “estimates,” “will,” “project” or words of similar meaning. Such statements are based on our current expectations and certain assumptions, and are, therefore, subject to certain risks and uncertainties. A variety of factors, many of which are beyond Siemens’ control, affect our operations, performance, business strategy and results and could cause the actual results, performance or achievements of Siemens to be materially different from any future results, performance or achievements that may be expressed or implied by such forward-looking statements. For us, particular uncertainties arise, among others, from changes in general economic and business conditions (including margin developments in major business areas and recessionary trends); the possibility that customers will delay conversion of booked orders into revenue or that our pricing power will be diminished by continued adverse market developments, to a greater extent than we currently expect; the behavior of financial markets, including fluctuations in interest and exchange rates, commodity and equity prices, debt prices (credit spreads) and financial assets generally; continued volatility and further deterioration of the capital markets; the commercial credit environment and, in particular, additional uncertainties arising out of the subprime, financial market and liquidity crises; future financial performance of major industries that we serve, including, without limitation, the Sectors Industry, Energy and Healthcare; the challenges of integrating major acquisitions and implementing joint ventures and other significant portfolio measures; introduction of competing products or technologies by other companies; lack of acceptance of new products or services by customers targeted by Siemens; changes in business strategy; the outcome of pending investigations and legal proceedings, including corruption investigations to which we are currently subject and actions resulting from the findings of these investigations; the potential impact of such investigations and proceedings on our ongoing business including our relationships with governments and other customers; the potential impact of such matters on our financial statements; as well as various other factors. More detailed information about certain of these factors is contained throughout this report and in our other filings with the SEC, which are available on the Siemens website, www.siemens.com, and on the SEC’swebsite, www.sec.gov. Should one or more of these risks or uncertainties materialize, or should underlying assumptions prove incorrect, actual results may vary materially from those described in the relevant forward-looking statement as expected, anticipated, intended, planned, believed, sought, estimated or projected. Siemens does not intend or assume any obligation to update or revise these forward-looking statements in light of developments which differ from those anticipated.
Earnings before interest and taxes, or EBIT (adjusted); Earnings before interest, taxes, depreciation and amortization, or EBITDA (adjusted); Return on capital employed (ROCE); Return on equity (ROE); Free cash flow; Cash conversion rate; and adjusted or organic growth rates of revenue and new orders are or may be non-GAAP financial measures. These non-GAAP financial measures should not be viewed in isolation as alternatives to measures of our financial condition, results of operations or cash flows as presented in accordance with IFRS in our Consolidated Financial Statements. Information for a reconciliation of these amounts to the most directly comparable IFRS financial measures is available on our Investor Relations website under www.siemens.com/investors -> Financial Publications. “Profit Total Sectors” is reconciled to “Income from continuing operations before income taxes” in the table “Segment Information.”

Page 3 January 2009 Copyright © Siemens AG 2009. All rights reserved.Flashlight Q1 09
Highlights of Q1 09
Top line holding up in challenging times benefiting from diversified portfolio: robust book-to-bill at 1.13x on the back of strong revenue growth at +8%1)
Orders slightly above previous quarter, down 7% y-o-y, no major cancellations:Industry (-11%): double digit decline at IA, DT, IS partly offset by Mobility (+9%): b-t-b at 1.05xEnergy (-6%): double digit decrease at Renewable and Oil & Gas partly offset by Fossil (+14%); Very strong book-to-bill at 1.37x; orders up 18% q-o-qHealthcare (-4%), however DX holding up (+1%)
Revenue growth (+8%) driven by Energy (+25%) benefiting from high order backlog; Healthcare (+3%); Industry (+1%)Total sector profit € 2.0bn up 20% y-o-y leading to a total sector profit margin of 10.8%
Margin increase at Energy across all divisions; underlying earnings conversion of +18%Margin pressure in IA and DT partly offset by y-o-y margin improvement at BT, IS and MobilityMargin expansion at Imaging & IT: 25% incremental margin; solid performance of DX with an underlying margin of 17.1%
Clean quarter: EPS Cont. operations at €1.43 up 25% y-o-yFree cash flow at -€1.6bn affected by €1.0bn payment related to resolution of legal proceedings and €222m cash outflow related to project reviews, restructuring, and SG&A chargesROCE increased y-o-y from 11.6% to 12.9% due to higher income from cont. operations of €1.3bn
1) All figures on a comparable basis excluding currency translation and portfolio effects

Page 4 January 2009 Copyright © Siemens AG 2009. All rights reserved.Flashlight Q1 09
Key Items relating to Q1 09 (I)
Industry
Industry Automation – Margin: 12.9%, PPA1) €(35)m associated to UGS acquisition– Underlying margin: 14.7% excl. PPA– Q1 08: PPA €(48)m, OTC €(5)m, €36m disposal gain: underlying
margin 20.7%Drive Technologies
– Margin: 11.0%, PPA €(9)m – Underlying margin: 11.4% excl. PPA– Loss of €27m at electronics assembly unit due to lower business
volume– Q1 08: PPA €(10)m, underlying margin 11.9%
Building Technologies– Margin: 8.1%
Osram– Margin: 8.4% incl. positive effects from hedging activities– Charges expected in coming quarters related to improving its
cost structure and product mix
IS Margin 6.6%
Mobility – Margin: 5.4%, – €10m positive effect related to settlement of a claim in the rolling
stock business– Underlying margin: 4.8% – Q1 08: Combino charges €(32)m, underlying margin 5.3%
Energy
1) PPA = purchase price allocation; OTC = one-time costs
Fossil Power Generation– Margin: 12.2%
– Substantial volatility in equity investment income expected in coming quarters
– Q1 08: More than €(200)m charges; underlying margin ~11.8%
Renewable Energy– Margin: 14.2%
Oil & Gas
– Margin: 10.1%
Power Transmission
– Margin: 10.1%
Power Distribution
– Margin: 13.3%

Page 5 January 2009 Copyright © Siemens AG 2009. All rights reserved.Flashlight Q1 09
Key Items relating to Q1 09 (II)
Healthcare Equity Investment and Cross-Sector Businesses
Imaging & IT- Margin: 14.8%
Workflow and Solutions- Margin: -1.6%, - incl. €(41)m further charges related to project delays in the particle
therapy business partly offset by €11m in divestment gains - Margin 6.4% excl. charges and divestment gains
Diagnostics– Margin: 9.5%, PPA €(46)m and OTC €(20)m – Underlying margin 17.1% (excl. PPA, OTC)– Q1 08: PPA €(51)m, OTC €(35)m
Underlying margin 21.5% (excl. PPA, OTC)
Equity Investments – Equity investments profit: €85m
– NSN equity investment loss €(7)m; Q1 08: €(37)m
– Results are expected to be volatile in coming quarters
– Q1 08: equity investment income €36m
Cross-Sector Businesses
Siemens IT Solutions and Services
– Margin: 3.6%
SFS
– ROE: 23.4%
– Total assets rose from €11.3bn Q4 08 to €12.0bn Q1 09 driven in part by growth in customer finance activity
Page 6 January 2009 Copyright © Siemens AG 2009. All rights reserved.Flashlight Q1 09
Key Items relating to Q1 09 (III)
Other Operations, Corporate Activities and Eliminations Cash Flow and Subsequent Events
Other Operations– By the end of 2009 all businesses activities are to be integrated into
a Siemens Sector or Cross-sector Business, divested, moved to a joint venture or closed
– Siemens completed the transfer of an 80.2% stake in Siemens Home Office Communications (SHC) to Arques at the beginning of Q1
– Q1 08: included a goodwill impairment of €70m related to a buildingand infrastructure business, partly offset by a profit of €14m at SHC
SRE– Intends to continue real estate disposals in coming quarters
depending on market conditions
Corporate Items & Pensions: €(236)mCorporate items €(166)m include:– Outside advisor expenses in connection with legal and regulatory
matters: €(49)m in Q1 09, down from €(93) in Q1 08
Corporate Treasury, Elim., other reconciling items: €(263)m– Negatively impacted by hedging activities not qualifying for hedge
accounting related to a decline in US dollar interest rates
Free Cash Flow Continuing Operations: €(1.6)bn– Centrally taken cash outflow of €1.0bn related to resolution of
legal proceedings in the US and Germany– €222m cash outflow for previously recorded charges related to
project reviews, restructuring, and SG&A– Cash Conversion (1.25)
Subsequent Events– Siemens announced that it will terminate the Shareholders
Agreement for the joint venture Areva NP S.A.S. as contractuallyspecified effective latest January 30, 2012, and sell its 34% minority interest in Areva NP S.A.S. to the majority shareholderAreva S.A. under the terms of a put agreement
– The transaction is subject to the approval of antitrust authorities

Page 7 January 2009 Copyright © Siemens AG 2009. All rights reserved.Flashlight Q1 09
Q1 09 Key Figures – New orders
New orders
*adjusted for currency translation and portfolio effects
€m Q1 2008 Q4 2008 Q1 2009 Y-o-Y Q1 08 - Q1 09
Y-o-Y adj.*Q1 08 - Q1 09
Q-o-Q Q4 08 - Q1 09
Industry Sector 11,001 10,255 9,831 -11% -11% -4%Industry Automation 2,281 2,213 1,953 -14% -13% -12%Drive Technologies 2,505 2,260 2,141 -15% -16% -5%Building Technologies 1,539 1,723 1,545 0% -3% -10%Osram 1,193 1,134 1,097 -8% -7% -3%Industry Solutions 2,567 1,814 1,916 -25% -24% 6%Mobility 1,775 1,809 1,924 8% 9% 6%
Energy Sector 9,079 7,246 8,534 -6% -6% 18%Fossil Power Generation 3,431 3,287 3,997 16% 14% 22%Renewable Energy 1,032 319 648 -37% -38% 103%Oil & Gas 1,847 1,137 1,360 -26% -24% 20%Power Transmission 1,924 1,785 1,915 0% 1% 7%Power Distribution 920 835 857 -7% -6% 3%
Healthcare Sector 2,806 3,382 2,896 3% -4% -14%Imaging & IT 1,755 2,195 1,769 1% -2% -19%Workflow & Solutions 396 450 335 -15% -17% -26%Diagnostics 713 829 864 21% 1% 4%
Total Sectors 22,886 20,883 21,261 -7% -8% 2%Equity Investments
Cross Sector BusinessesSiemens IT Solutions and Services 1,225 1,393 1,231 0% 6% -12%SFS 182 193 188
ReconciliationsOther Operations 735 520 226SRE 394 440 429Corp. Items & Pensions 31 82 32Elimn., CT & Other recon. -1,211 -1,306 -1,147
Siemens 24,242 22,205 22,220 -8% -7% 0%

Page 8 January 2009 Copyright © Siemens AG 2009. All rights reserved.Flashlight Q1 09
Q1 09 Key Figures – Revenue
Revenue
*adjusted for currency translation and portfolio effects
€m Q1 2008 Q4 2008 Q1 2009 Y-o-Y Q1 08 - Q1 09
Y-o-Y adj.*Q1 08 - Q1 09
Q-o-Q Q4 08 - Q1 09
Industry Sector 9,174 10,408 9,351 2% 1% -10%Industry Automation 2,089 2,286 1,977 -5% -4% -14%Drive Technologies 1,974 2,420 2,123 8% 6% -12%Building Technologies 1,434 1,676 1,531 7% 3% -9%Osram 1,193 1,134 1,097 -8% -7% -3%Industry Solutions 1,708 2,084 1,796 5% 3% -14%Mobility 1,440 1,647 1,564 9% 11% -5%
Energy Sector 5,035 6,749 6,232 24% 25% -8%Fossil Power Generation 1,901 2,442 2,373 25% 23% -3%Renewable Energy 417 627 713 71% 71% 14%Oil & Gas 827 1,200 1,048 27% 32% -13%Power Transmission 1,244 1,596 1,500 21% 21% -6%Power Distribution 732 1,004 805 10% 12% -20%
Healthcare Sector 2,653 3,118 2,936 11% 3% -6%Imaging & IT 1,650 1,963 1,769 7% 4% -10%Workflow & Solutions 348 407 373 7% 6% -8%Diagnostics 712 831 872 22% 2% 5%
Total Sectors 16,862 20,275 18,519 10% 8% -9%Equity Investments
Cross Sector BusinessesSiemens IT Solutions and Services 1,340 1,464 1,289 -4% 1% -12%SFS 181 192 188
ReconciliationsOther Operations 708 552 264SRE 394 440 429Corp. Items & Pensions 33 65 23Elimn., CT & Other recon. -1,118 -1,337 -1,078
Siemens 18,400 21,651 19,634 7% 8% -9%

Page 9 January 2009 Copyright © Siemens AG 2009. All rights reserved.Flashlight Q1 09
Q1 09 Key Figures – Profit and margin
Profit and margin€m Q1 2008 Q4 2008 Q1 2009 Margin
Q1 2008MarginQ4 2008
MarginQ1 2009
Targetrange
Industry Sector 994 793 907 10.8% 7.6% 9.7% 9-13%Industry Automation 415 353 255 19.9% 15.4% 12.9% 12-17%Drive Technologies 225 302 233 11.4% 12.5% 11.0% 11-16%Build ing Technologies 93 169 124 6.5% 10.1% 8.1% 7-10%Osram 126 42 92 10.6% 3.7% 8.4% 10-12%Industry Solutions 91 129 119 5.3% 6.2% 6.6% 5-7%Mobility 44 -197 85 3.1% -12.0% 5.4% 5-7%
Energy Sector 347 466 756 6.9% 6.9% 12.1% 11-15%Fossil Power Generation 25 2 289 1.3% 0.1% 12.2% 11-15%Renewable Energy 52 83 101 12.5% 13.2% 14.2% 12-16%Oil & Gas 66 112 106 8.0% 9.3% 10.1% 10-14%Power Transmission 125 149 152 10.0% 9.3% 10.1% 10-14%Power Distribution 78 126 107 10.7% 12.5% 13.3% 11-15%
Healthcare Sector 332 226 342 12.5% 7.2% 11.6% 14-17%Imaging & IT 232 232 262 14.1% 11.8% 14.8% 14-17%Workflow & Solutions 35 -65 -6 10.1% -16.0% -1.6% 11-14%Diagnostics 67 50 83 9.4% 6.0% 9.5% 16-19%
Total Sectors 1,673 1,485 2,005 9.9% 7.3% 10.8%Equity Investments 36 6 85
Cross Sector BusinessesSiemens IT Solutions and Services 70 45 46 5.2% 3.1% 3.6% 5-7%SFS 77 49 66 35.7% 21.5% 23.4% 20-23%*
ReconciliationsOther Operations -64 -229 -13SRE 139 54 45Corporate Items and Pensions -315 -2,760 -236Elimn., CT & Other recon. -99 -130 -263
Siemens Pre-Tax Profit 1,517 -1,480 1,735Taxes -439 221 -475
Income from Cont. Operations 1,078 -1,259 1,260 *SFS: RoEIncome from discontinued operations 5,397 -1,161 -30
Net Income (All-In) 6,475 -2,420 1,230Minority interest 43 45 27Basic EPS from Cont. Operations 1.14 (1.51) 1.43Basic EPS from Net income (all- in) 7.04 (2.85) 1.40
Page 10 January 2009 Copyright © Siemens AG 2009. All rights reserved.Flashlight Q1 09
Net DebtQ4 FY08
2.3
Profitability
3.5
AssetManage-
ment
0.2
Other Operating Activities
1.9
Net Cash from
Investing Activities
2.3
Key Financing Activities
-14.2
Net DebtQ1 FY09
5.0
Under-funding
0.4Credit
guarantees
9.9
SFS Debt
0.8-9.0
Adj. ind.Net DebtQ1 FY09
-8.9
Hybrid adjust.*
€bn
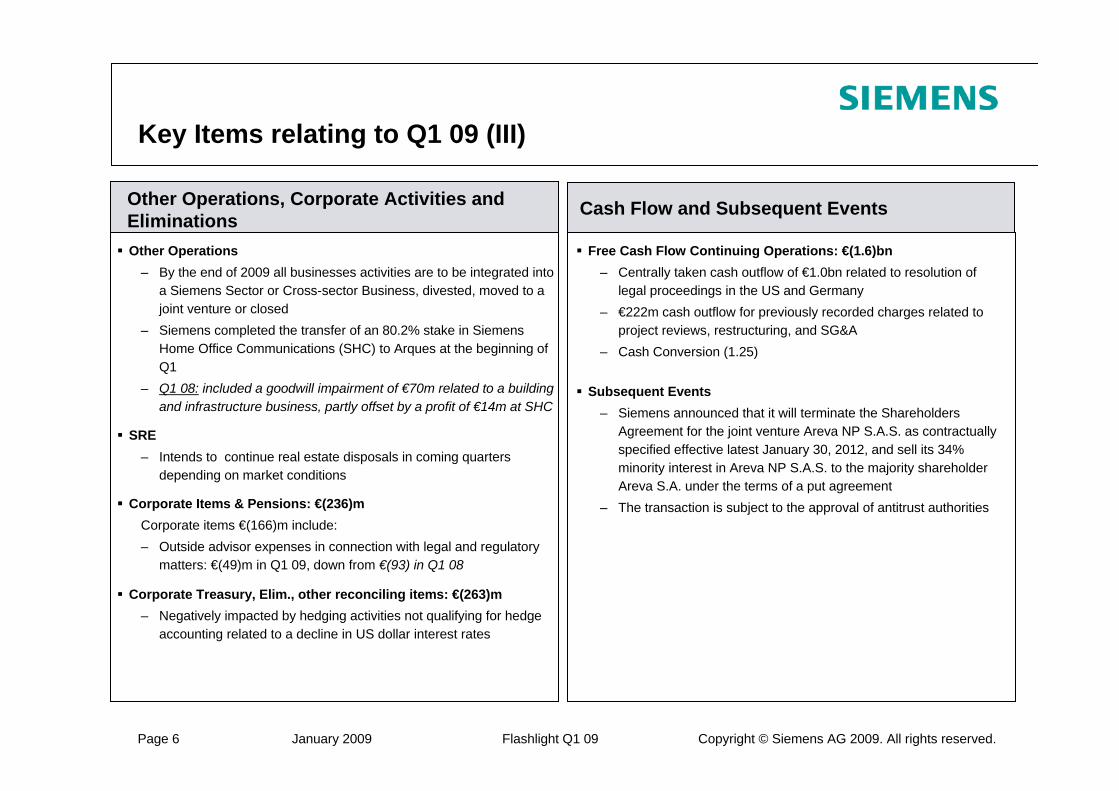
Q1 FY09 net debt development
Net Cash from Operating Activities
Therein change in Net working capital -€3.3bn e.g.Change in Inventories -0.9bnChange in Trade receivables -0.6bnChange in Trade payables -0.8bnChange in Current provisions -1.0bn
Therein change in other assets and liabilities -€0.2bn
Therein e.g.Interest paid -0.3bnChange in Fair Value of LT Debt (Hedge Accounting) -1.1bnRealized Payment FX Swaps -0.7bn
Pension deficit -4.3bnOPEB -0.7bn
* approx. 50% nominal amount hybrid bond

Page 11 January 2009 Copyright © Siemens AG 2009. All rights reserved.Flashlight Q1 09
SFS Key Figures Q1 09
P&L Cash Flow
Revenue: Interest Expense: Interest Income: Profit before Tax:
€ 188 m€ (124) m
€ 182 m€ 66 m
Depreciation & Amortisation: Operating Cash Flow:Capex (incl. operating leases):
€ 79 m€ 274 m
€ (122) m
Assets Liabilities
1) Operating and finance leases, originated and purchased loans and asset-based lending loans
Equity Total debt
12.09.9
Accruals & other liabilities
Total assets / liabilities
0.1
CashOtherassets & inventory
InvestmentsPurchased receivables
Leases &loan
receivables1)
€bn1.2
1.0
9.5 0.7 0.41.3
Page 12 January 2009 Copyright © Siemens AG 2009. All rights reserved.Flashlight Q1 09
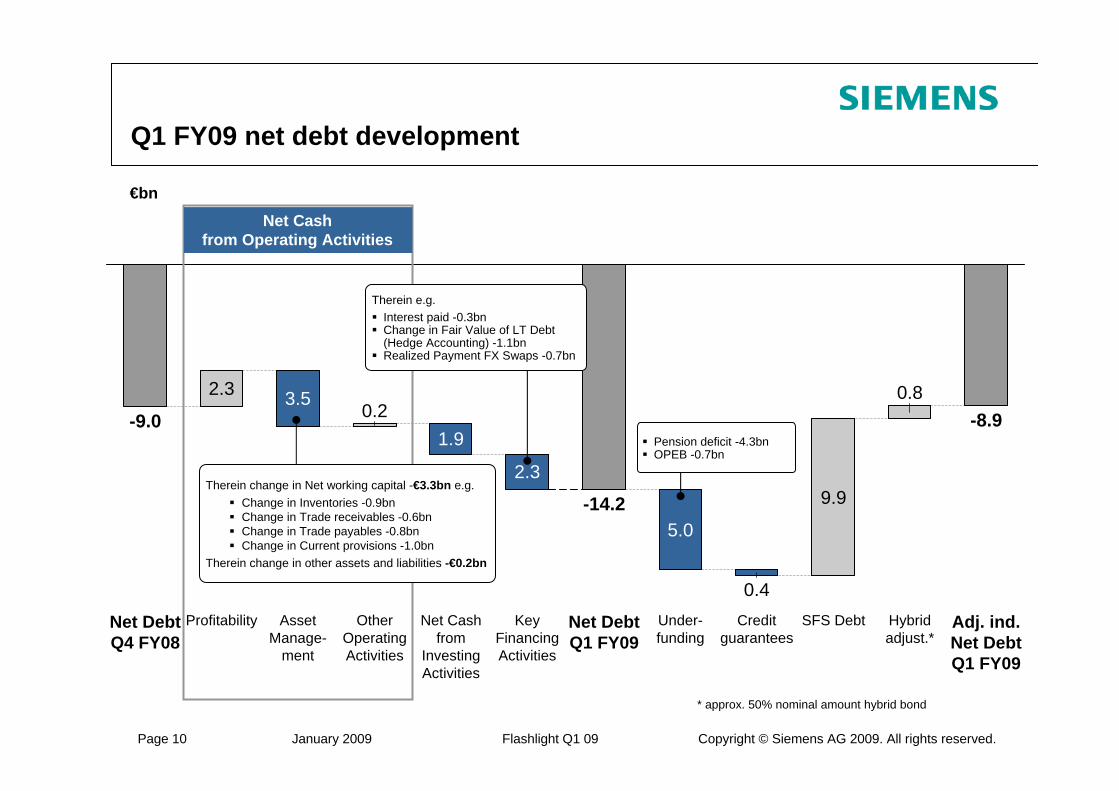
Plan assets decreased by €0.8bn, mainly based on pension payments and currency effects (similar currency effects on the DBO)Fixed income investments could almost compensate the negative return in equitiesDBO increased by €1.0bn, mainly due to a significant decrease in the discount rate
29%61%9%1%
(2.2)
0.00.60.6
(2.5)
22.76.2%20.2
FY 08
0.00.00.7
0.00.80.8
Additional contributionRegular fundingDBO of Principal Other Post-Employment Benefits1)
(4.3)(1.0)Funded status
24%66%9%1%
33%54%8%5%
Asset allocation of pension assetsEquitiesFixed incomeReal estateCash
(0.2)1.3Actual return on plan assets
23.75.5%19.4
25.05.3%24.0
Defined benefit obligation (DBO) of Principal Pension BenefitsDiscount rateFair Value of plan assets
Q1 FY 09FY 07According to 20F, in €bn
Pension funding deteriorated by €1.8bn to -€4.3bn in Q1 FY09
1) Mainly unfunded

Page 13 January 2009 Copyright © Siemens AG 2009. All rights reserved.Flashlight Q1 09
225 -286
NSN Operating
Profit
Charges Purchase-Price
Retailed Items
-179 191
Adjust-ments1)
NSN Net Income
(Corrected)
12
-118
NSN Operating Profit pre Charges and PPA
6
Siemens Share pre
PPA
-13
Siemens PPA
-7
Siemens Equity Share
€m
Q1 09 Bridge from NSN Operating Profit to Siemens At Equity Income
1) Nokia / NSN eliminations, NSN financial income/expenses, taxes, reversal of minority shares, differences in accounting,reversal of NSN PPA to Siemens step up (cross-over accounting of PPA)
50%
Siemens share
Reported by Nokia

Page 14 January 2009 Copyright © Siemens AG 2009. All rights reserved.Flashlight Q1 09
Reconciliation and Definitions forNon-GAAP Measures (I)
Profit Total Sectors is reconciled to “Income from continuing operations before income taxes” under “Reconciliation to consolidated financial statements” in the table “Segment Information.” See our Financial Publications at our Investor Relations website under www.siemens.com/investors.
Earnings before interest and taxes, or EBIT (adjusted) is Income from continuing operations before income taxes less Financial income (expense), net and Income (loss) from investments accounted for using the equity method, net.
Earnings before interest, taxes, depreciation and amortization, or EBITDA (adjusted) is calculated as earnings before income taxes (EBIT) (adjusted) before amortization (defined as amortization and impairments of intangible assets other than goodwill) and depreciation and impairments of property, plant and equipment and goodwill.
Profit is reconciled to EBIT (adjusted) and EBITDA (adjusted) on the table Segment Information Analysis (II). See our Financial Publications at our Investor Relations website under www.siemens.com/investors.
Return on capital employed (ROCE) is a measure of how capital invested in the Company or the Sectors yields competitive returns.
For the Company, ROCE is calculated as Net income (before interest) divided by average Capital employed (CE). Net income (before interest) is defined as Net income excluding Other interest income (expense), net and excluding taxes on Other interest income (expense), net. Taxes on Other interest income (expense), net are calculated in a simplified form by applying the current tax rate which can be derived from the Consolidated Statements of Income, to Other interest income (expense), net. CE is defined as Total equity plus Long-term debt plus Short-term debt and current maturities of long-term debt minus Cash and cash equivalents. Because Siemens reports discontinued operations, Siemens also calculates ROCE on a continuing operations basis, using Income from continuing operations rather than Net income. For purposes of this calculation, CE is adjusted by the net figure for Assets classified as held for disposal included in discontinued operations less Liabilities associated with assets classified as held for disposal included in discontinued operations.
For the Sectors, ROCE is calculated as Profit divided by average Assets. Profit of the Sectors is principally defined as earnings before financing interest, certain pension costs and income taxes, whereas certain other items not considered performance indicative by Management may be excluded. Assets of the Sectors is defined as Total assets primarily less intragroup financing receivables and investments, less income tax assets, less non-interest bearing liabilities/provisions other than tax liabilities.
Page 15 January 2009 Copyright © Siemens AG 2009. All rights reserved.Flashlight Q1 09
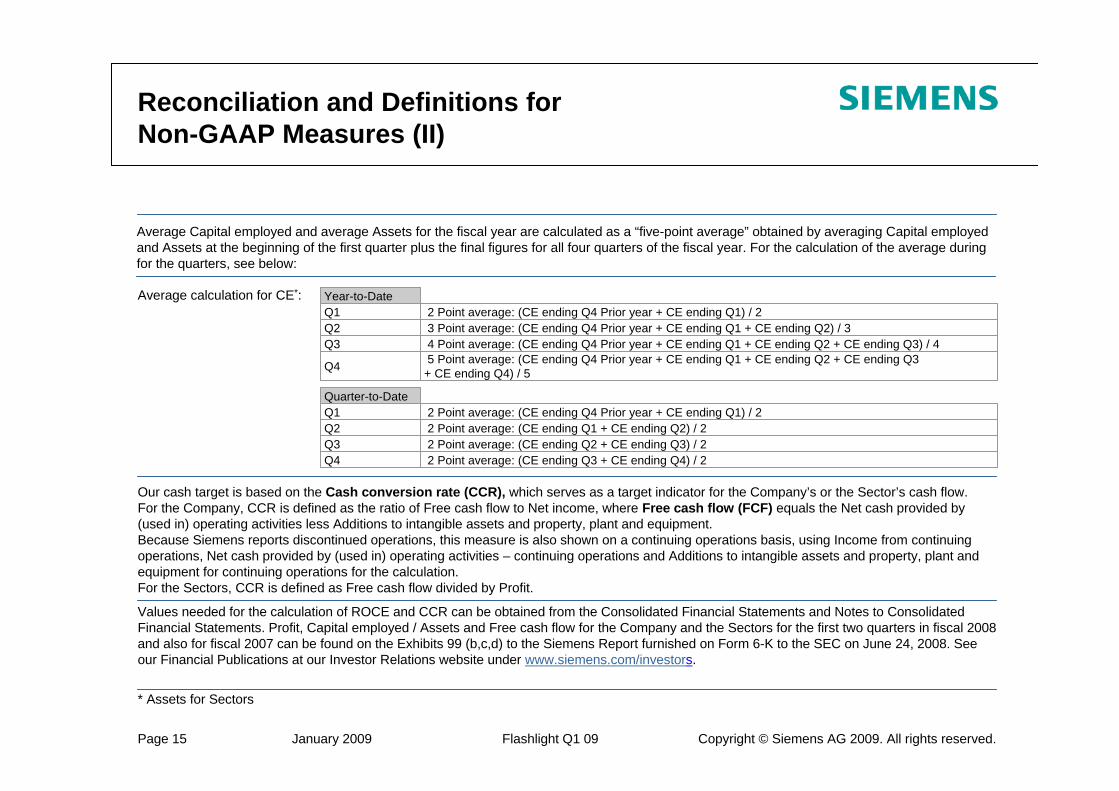
Reconciliation and Definitions forNon-GAAP Measures (II)
Our cash target is based on the Cash conversion rate (CCR), which serves as a target indicator for the Company’s or the Sector’s cash flow. For the Company, CCR is defined as the ratio of Free cash flow to Net income, where Free cash flow (FCF) equals the Net cash provided by (used in) operating activities less Additions to intangible assets and property, plant and equipment. Because Siemens reports discontinued operations, this measure is also shown on a continuing operations basis, using Income from continuing operations, Net cash provided by (used in) operating activities – continuing operations and Additions to intangible assets and property, plant and equipment for continuing operations for the calculation. For the Sectors, CCR is defined as Free cash flow divided by Profit.
Values needed for the calculation of ROCE and CCR can be obtained from the Consolidated Financial Statements and Notes to Consolidated Financial Statements. Profit, Capital employed / Assets and Free cash flow for the Company and the Sectors for the first two quarters in fiscal 2008 and also for fiscal 2007 can be found on the Exhibits 99 (b,c,d) to the Siemens Report furnished on Form 6-K to the SEC on June 24, 2008. See our Financial Publications at our Investor Relations website under www.siemens.com/investors.
Average calculation for CE*:
5 Point average: (CE ending Q4 Prior year + CE ending Q1 + CE ending Q2 + CE ending Q3 + CE ending Q4) / 5Q4
4 Point average: (CE ending Q4 Prior year + CE ending Q1 + CE ending Q2 + CE ending Q3) / 4Q33 Point average: (CE ending Q4 Prior year + CE ending Q1 + CE ending Q2) / 3Q22 Point average: (CE ending Q4 Prior year + CE ending Q1) / 2Q1
Year-to-Date
2 Point average: (CE ending Q3 + CE ending Q4) / 2Q42 Point average: (CE ending Q2 + CE ending Q3) / 2Q32 Point average: (CE ending Q1 + CE ending Q2) / 2Q22 Point average: (CE ending Q4 Prior year + CE ending Q1) / 2Q1
Quarter-to-Date
* Assets for Sectors
Average Capital employed and average Assets for the fiscal year are calculated as a “five-point average” obtained by averaging Capital employed and Assets at the beginning of the first quarter plus the final figures for all four quarters of the fiscal year. For the calculation of the average during for the quarters, see below:

Page 16 January 2009 Copyright © Siemens AG 2009. All rights reserved.Flashlight Q1 09
Reconciliation and Definitions forNon-GAAP Measures (III)
Our capital structure target is based on an Adjusted industrial net debt divided by EBITDA (adjusted). For the calculation of Adjusted industrial net debt, we subtract from Net debt (defined as Long-term debt plus Short-term debt and current maturities of long-term debt less Cash and cash equivalents less Available-for-sale financial assets (current)) (1) SFS debt excluding SFS internally purchased receivables and (2) 50% of the nominal amount of our hybrid bond; and add/subtract (3) Funded status of Pension benefits, (4) Funded status of Other post-employment benefits; and add (5) Credit guarantees. The components of Net debt are available on our Consolidated Balance Sheets, SFS debt less internally purchased receivables in fiscal 2008 is available in our Management Discussion & Analysis in our Annual Report 2008 under Segment information analysis –Siemens Financial Services (SFS). The Funded status of our principle pension plans and Other post-employment benefits, the amount of credit guarantees and the nominal amount of our Hybrid bond is available in the Notes to our Consolidated Financial Statements.
To measure Siemens’ achievement of the goal to grow at twice the rate of global GDP, we use GDP on real basis (i.e. excluding inflation and currency translation effects) with data provided by Global Insight Inc. and compare those growth rates with growth rates of our revenue (adjusted for portfolio and currency translation effects). In accordance with IFRS, revenue numbers are not adjusted by inflation and currency translation effects.
Return on equity (ROE) margin for SFS was calculated as annualized SFS’ Income before income taxes for Q1 of fiscal 2009 divided by average allocated equity for SFS for the first three months of fiscal 2009. Average allocated equity for the first three months of fiscal 2009 is €1.129 billion.The allocated equity for SFS is determined and influenced by the size and quality of its portfolio of commercial finance assets (primarily leases) and equity investments. This allocation is designed to cover the risks of the underlying business and is in line with common credit risk management standards in banking. The actual risk profile of the SFS portfolio is evaluated and controlled monthly and is reflected in the quarterly (commercial finance) and annual (equity investments) adjustment of allocated equity.
Profit Total Sectors, EBIT (adjusted), EBITDA (adjusted), ROCE, ROE, CCR and Adjusted industrial net debt are or may be Non-GAAP financial measures as defined in relevant rules of the U.S. Securities and Exchange Commission. Our management takes these measures, among others, into account in its management of our business, and for this reason we believe that investors may find it useful to consider these measures in their evaluation of our performance. None of Profit Total Sectors, EBIT (adjusted), EBITDA (adjusted), ROCE and ROE should be viewed in isolation as an alternative to figures reported in our IFRS statement of income for purposes of evaluating our results of operations; CCR should not be viewed in isolation as an alternative to measures reported in our IFRS cash flow statement for purposes of evaluating our cash flows; and Adjusted industrial net debt should not be viewed in isolation as an alternative to liabilities reported in our IFRS balance sheet for purposes of evaluating our financial condition.

Page 17 January 2009 Copyright © Siemens AG 2009. All rights reserved.Flashlight Q1 09
Siemens investor relations contact data
Michael Sen +49-89-636-33780
Munich Office +49-89-636-32474
US Office +1-408-464-2004
Internet: http://www.siemens.com/investorrelations
Email: [email protected]
Fax: +49-89-636-32830


![[Challenge:Future] Youth - I - lize :a nationwide Youth employment campaign](https://static.fdocuments.in/doc/165x107/58adf81a1a28abf0628b5455/challengefuture-youth-i-lize-a-nationwide-youth-employment-campaign.jpg)